DOI:10.32604/cmc.2022.022694
| Computers, Materials & Continua DOI:10.32604/cmc.2022.022694 | |
| Article |
Detection of Low Sugar Concentration Solution Using Frequency Selective Surface (FSS)
1Faculty of Electrical and Electronics Engineering, Universiti Tun Hussein Onn Malaysia, Parit Raja, Batu Pahat, 86400, Malaysia
2Research Center for Applied Electromagnetics (EMcenter), The Institute of Integrated Engineering, Universiti Tun Hussein Onn Malaysia, Parit Raja, Batu Pahat, 86400, Malaysia
3Microelectronic and Nanotechnology- Shamsuddin Research Centre (MiNT-SRC), The Institute of Integrated Engineering, Universiti Tun Hussein Onn, Parit Raja, Batu Pahat, 86400, Malaysia
4Photonics Devices and Sensor Research (PDSR), Faculty of Applied Science and Technology (FAST), Universiti Tun Hussein Onn Malaysia (Pagoh Campus), Jorak, Bukit Pasir, 84500, Malaysia
*Corresponding Author: F. C. Seman. Email: fauziahs@uthm.edu.my
Received: 16 August 2021; Accepted: 06 October 2021
Abstract: Sugar is important in daily food intake since it is used as food preservative and sweetener. Therefore, is important to analyze the influence of sugar on the spectroscopic properties of the sample. Terahertz spectroscopy is proven to be useful and an efficient method for sugar detection as well as for future food quality industry. However, the lack of detection sensitivity in Terahertz Spectroscopy has prevented it from being used in a widespread spectroscopic analysis technology. In this paper, Frequency Selective Surface (FSS) using the Terahertz Spectroscopy Time Domain Spectrum (THz-TDS) which operates at terahertz frequency range has been demonstrated for application of sugar detection. The FSS is designed with a circle slot structure and has been optimized in line with the molecular resonance of glucose and fructose at different level concentration at 1.98 THz and 1.80 THz, respectively. Transmission magnitude of glucose and sucrose is inversely proportional with the level of sugar concentrations. The realization of the FSS structure is using electron beam lithography and wet etching technique. Results show that the FSS performance for glucose and sucrose reveal fair shifts in measured transmission magnitude from its original in CST by approximately 30%. The use of fabricated FSS with circle structure indicates that the concentration can be improved averagely at 25% for glucose and 13% for sucrose. Thus, it shows that the FSS circle structure combined with THz-TDS has the potential to become an alternative method for food sensing technology in the future.
Keywords: THz sensing; FSS circle structure; sugar concentration
Sugar plays an important role in the food industry since it uses as a food preservative and sweetener. One of the most favourite and natural sweeteners is honey. Due to natural or raw honey are quite expensive, honey can be easily adulterated by adding sugar syrups with similar composition and been selling in the market nowadays [1]. Therefore, it is important to be analyze the influence of sugar on the spectroscopic properties of the sample. The conventional sensing food method that uses the Near Infrared (NIR) and mid-IR spectroscopic suffers from the lack of sensitivity [2] in relation to the demand in food quality control and it has become the main problem in food industry [3] Therefore, it is necessary to explore new detection tools that can be useful for the food sensing industry. Terahertz spectroscopy can be an alternative method in this industry. Terahertz spectroscopy is a non-destructive method suitable for examining biological [4] and chemical materials [5]. Terahertz Spectroscopy has a unique interpretation based on bio-molecular resonance characteristics within the broad THz range In the past, terahertz spectroscopy technology has been applied for alcohol detection [2] sugar detection [6] antibiotics [7] and drugs [8]. This is due to its capability that enables absorption and penetration of non-conductive materials, provides molecular information, and emits non-ionizing radiation that will do no harm to the sample [9]. Thus, terahertz spectroscopy has been considered as an alternative method to enhancing the usage of microwave and infrared band in the conventional spectroscopy. However, the main issue that prevents the widespread use of THz-TDS is its limited detection sensitivity. The improvement of the low detection sensitivity can be improved by using a Frequency Selective Surface (FSS).
Frequency Selective Surface (FSS) is made up of a periodic element of either a patch or a circle slot structure. It is widely known for its applications in electromagnetic (EM) shielding [10], microwave filters [11–13], absorbers [14], radomes [15–17] and radar cross section [18]. Meanwhile, in biochemical sensing, FSS is introduced and applied as transducer which allows for a better detection with its increasing sensitivity for detection in fungi, bacteria, pesticide residue [7,19,20]. According to previous research in [7,21,22] by applying the FSS structure, it helps to increase the sensitivity and detection limitation around 104 to 1010 times higher than the detection abilities without applying FSS structure. Thus, with the possibilities of FSS in detection of a small structure, and a rapid growth in Terahertz (THz) research and microfabrication technologies, FSSs are ahead from microwave frequencies towards higher frequencies, making them as demanding components of THz instrumentation.
In this paper, glucose and sucrose are analyzed for molecular resonance at different levels of concentration. These two sugar types are chosen due to the basic compound of sugar and important element in daily food intake. Specifically, this paper focuses on the study of sugar detection by using the THZ-TDS combined with the FSS structure.
2 Terahertz Scanning for Glucose and Sucrose
Based on past literature in [6,23,24] which applied the exact same type of sugar and analysis, glucose resonances were mostly found between range 1 THz to 3 THz while sucrose resonance were mostly found between range 1.3 THz to 3.55 THz [25,26].
In this study, two sugar resonance was chosen based on the best transmittance at every concentration level that follows the Beer's law theory. In general, Beer's law theory explained the attenuation of light to the material's properties through which the light is travelling. This section discusses the effects of transmission of sugar at different level of concentration at terahertz range as presented in Figs. 1a–1d. In this project, the best sugar molecular resonance of glucose and sucrose was observed and analysed at every concentration. From the analysis, glucose shows the best molecular resonance, observed at 1.10 THz and 1.98 THz for all concentration. Between those two molecular resonances, 1.98 THz shows a better and consistent transmission magnitude decrease at every glucose concentration level which significantly follows the Beer's law theory. At resonance 1.1 THz, the transmission magnitude of glucose shows some inconsistent decreases in transmission magnitude at a certain concentration level of glucose, as shown in Figs. 1a and 1b.
On the other hand, for the molecular resonance of sucrose analysis, it is observed that the best molecular resonance show at resonance 1.31 THz and 1.80 THz. From the study, molecular resonance at 1.80 THz shows the best and consistent transmission decrease as an increased concentration of sucrose compared to the result in transmission at resonance 1.31 THz. At 1.31 THz shows an inconsistent transmission decrease when the sucrose concentration level increases, as presented in Figs. 1c and 1d.
Therefore, from the analysis two best molecular resonance from glucose and sucrose, 1.98 THz and 1.80 THz, are chosen based on the consistent decrease in transmission as increase in level of concentration of the sugar. For the improvement in detection of Terahertz Spectroscopy combined with metamaterial structure, the frequency of the FSS structure is designed based on circle slot structure and optimized in line with the sugar molecular resonance of both glucose and sucrose at 1.98 THz and 1.80 THz, respectively. Besides that, the level of concentration detected in this study is set as low as 0.2% level of glucose and sucrose concentration. Later, the transmission magnitude of sugar, glucose and sucrose is analyzed before and after applying the FSS structure to observe the detection improvement when FSS structure is applied.
There are various groups of FSS, and each element has its unique response that depends totally on the design structure to obtain different specifications, such as multiband, narrow, and broad bandwidth, angular and polarization stability [27]. Essentially, the total length of the loop structure of FSS is equivalent to one wavelength, λ. According to [28], the resonant frequency of a FSS structure can be expressed through Eq. (1), where, wavelength, λ can be substituted accordingly based on the FSS design structure, thus, in this paper, λ is substituted with the total circumference of one circle loop as expressed in Eq. (2) & Eq. (3) where, d is diameter of the circle, while
In this paper, the FSS structure is designed and optimized in line with the sugar, Glucose and Sucrose molecular resonance with resonant frequency of 1.98 THz and 1.80 THz with transmission magnitude of 0.928 and 0.915, respectively.
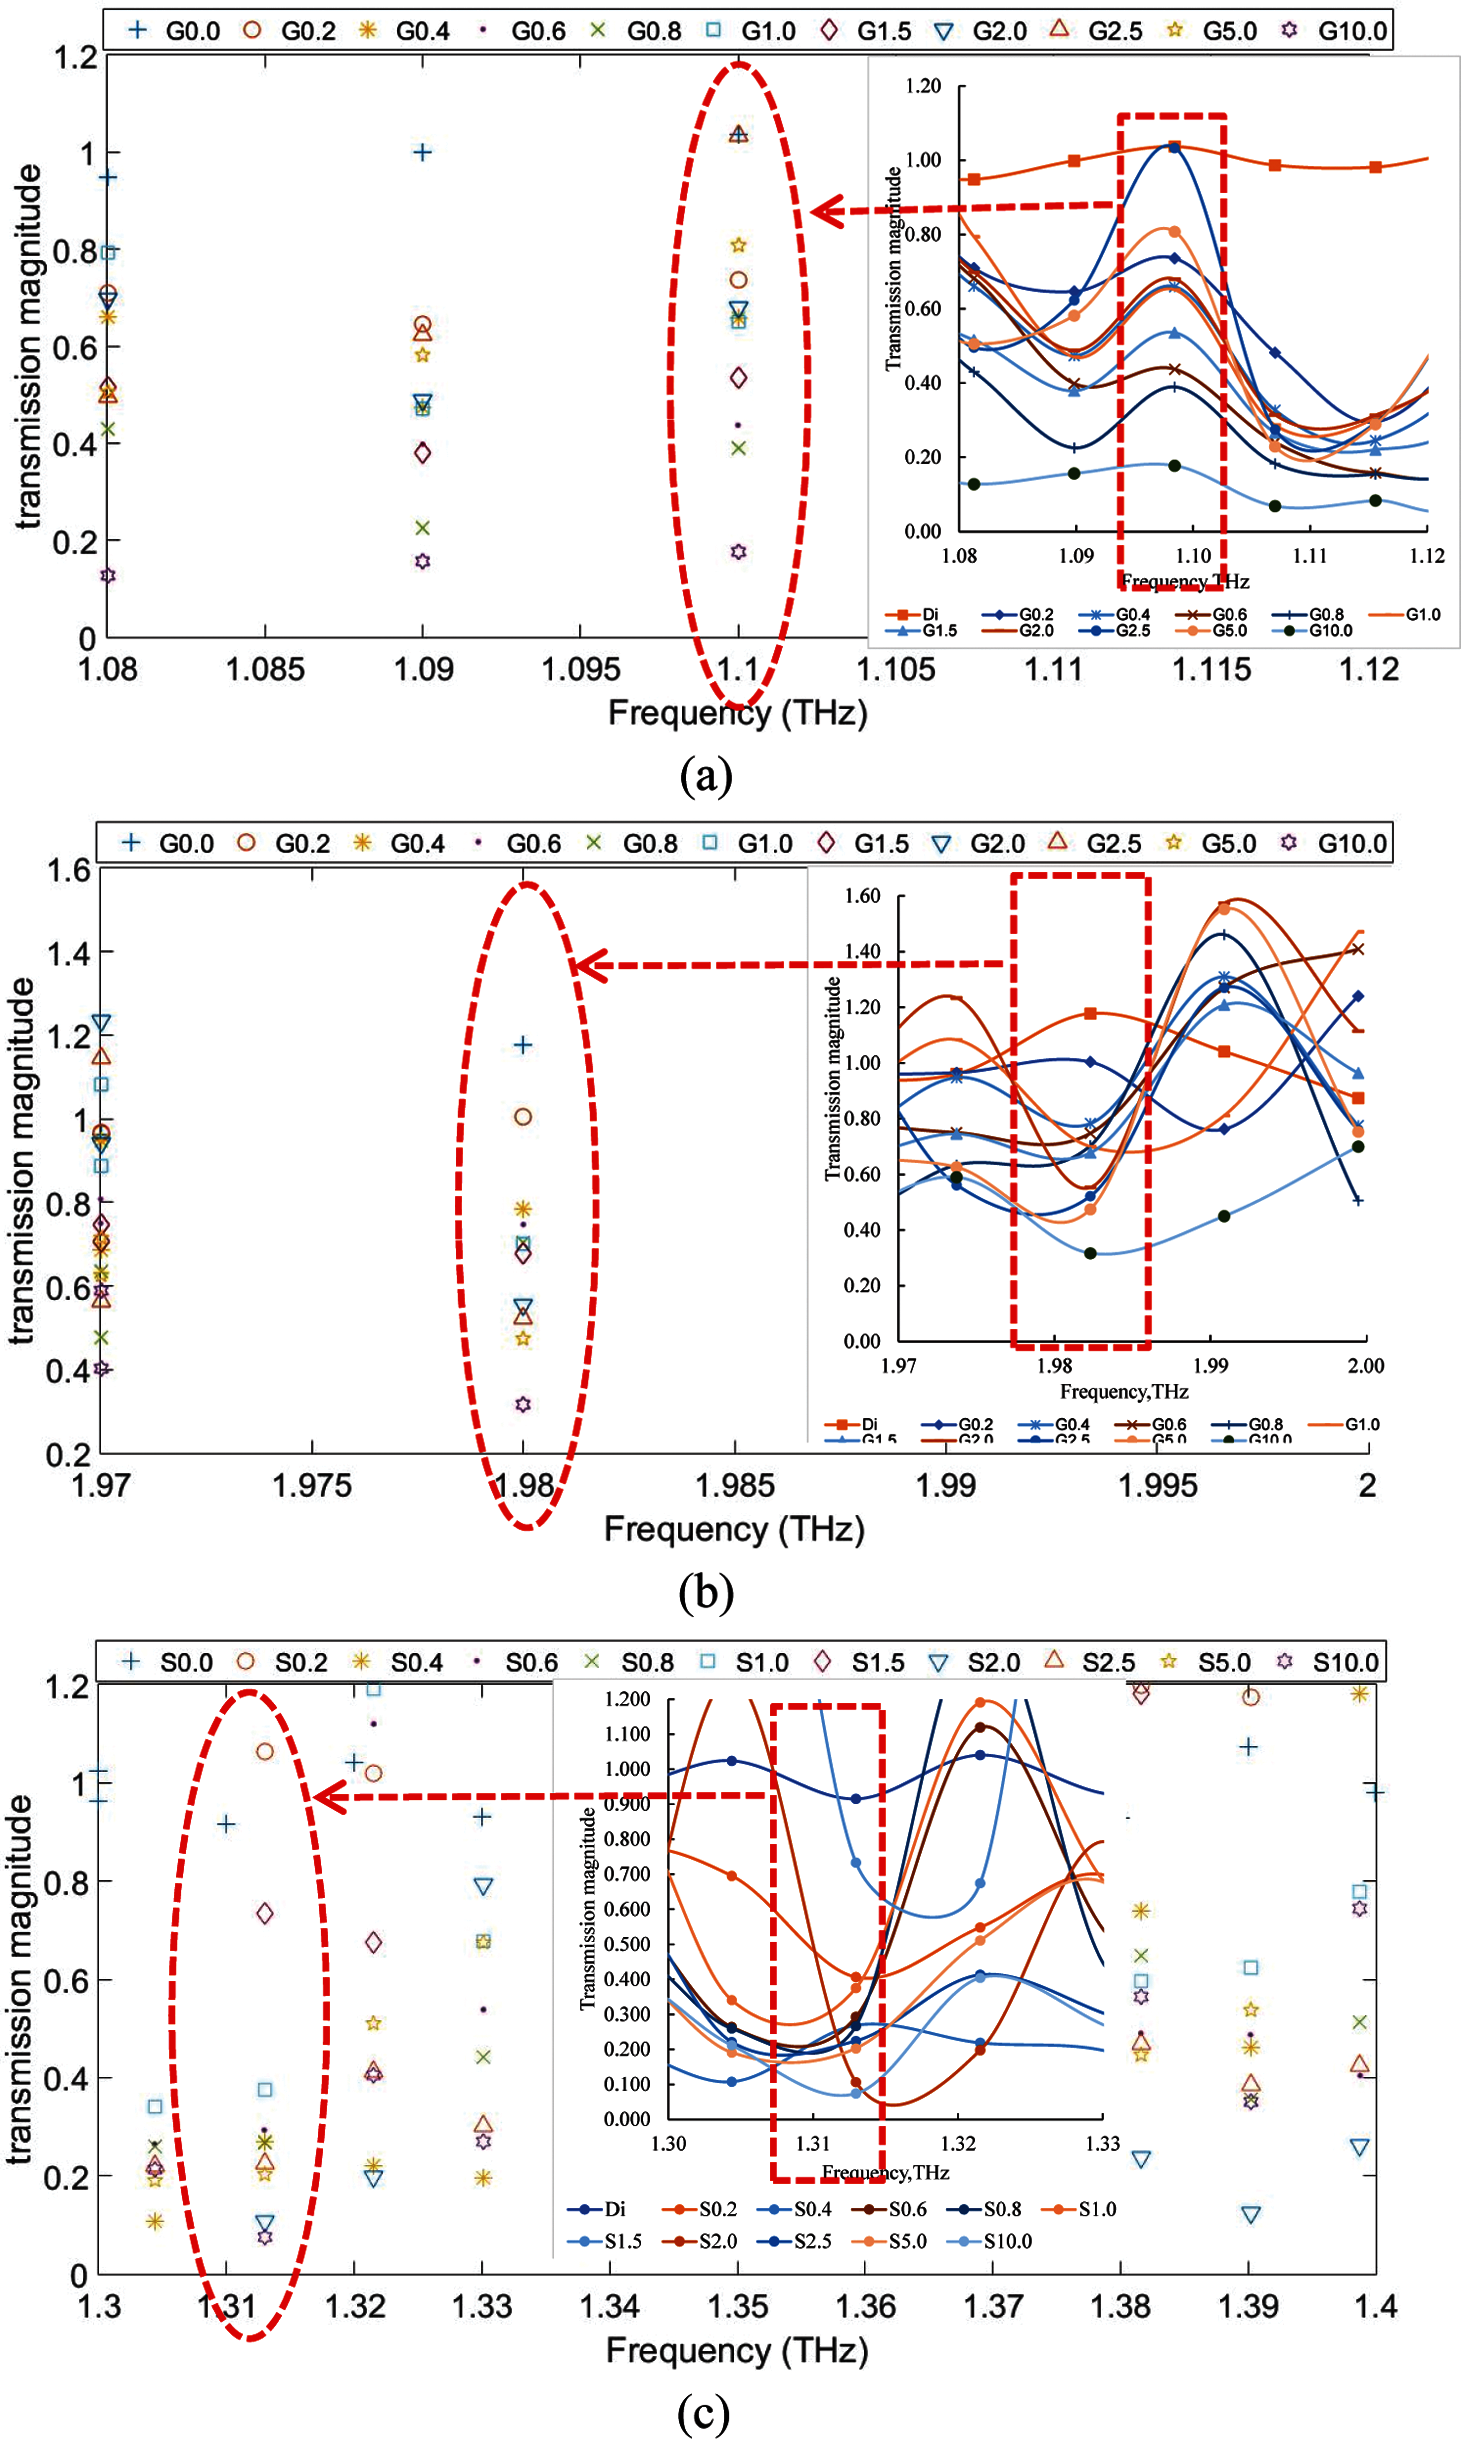
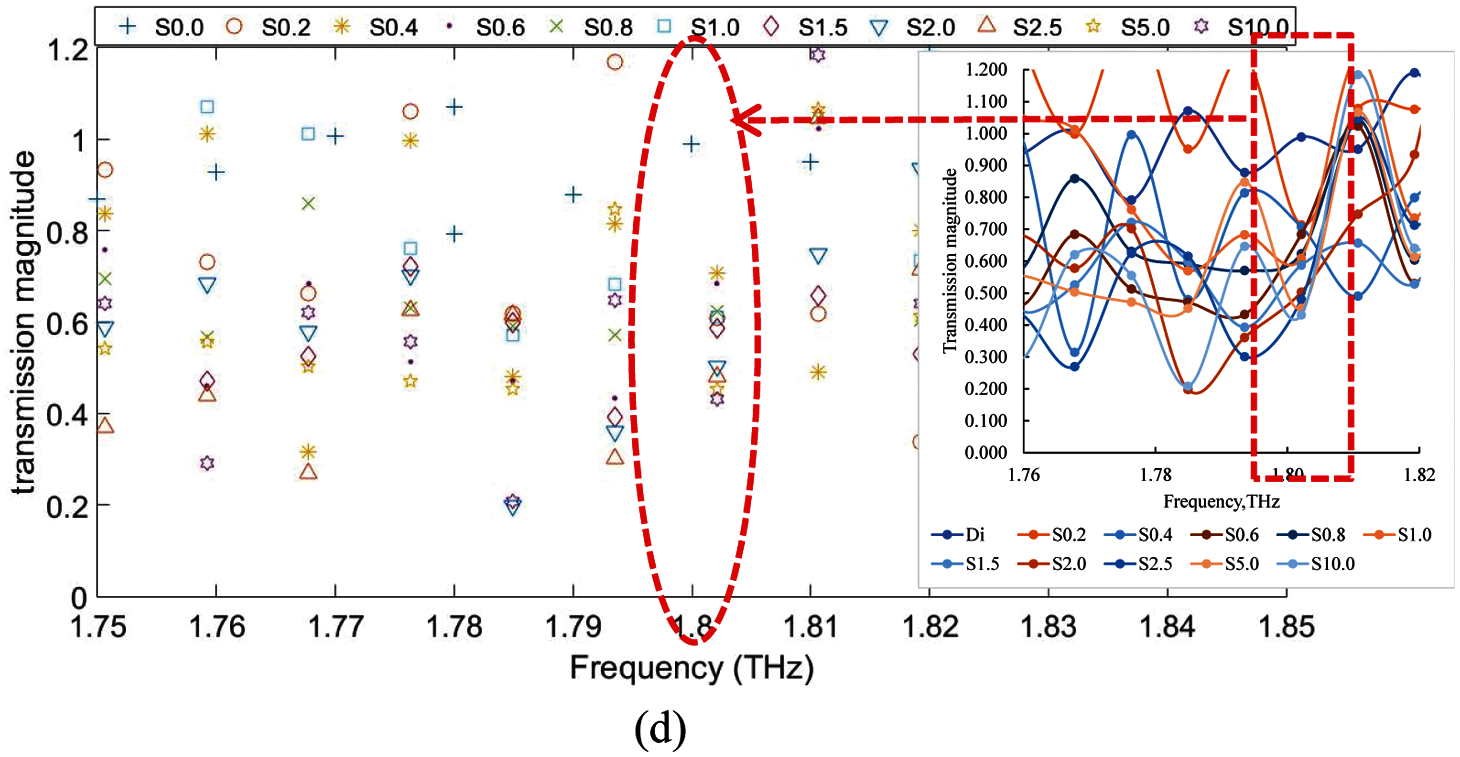
Figure 1: Transmission of Glucose at different level of concentration at frequency (a) 1.1 THz, (b) 1.98 THz, and Sucrose (c) 1.31 THz and (d) 1.80 THz
The FSS structure is designed on a 400 μm thick quartz surface as a substrate a metal layer of 0.5 μm thick of aluminum layer. Computer Simulation Technology (CST) Microwave Studio software is used as a platform to perform the simulation and optimization of these FSS structures and have been setup with boundary condition of a unit cell. The reflection phase diagram is setup for angular optimization purposes and Frequency Domain Solver is chosen due to its capability to optimize high resonance and electrically small structures such as FSS. Fig. 2 shows the optimize FSS structure for Glucose and Sucrose.

Figure 2: Top view and side view of FSS structure
Glucose and Sucrose sample powder with purity > 99% has been used in this study. The objective is to observe the molecular resonance of different type of sugar at conditions of low concentrations. Ten different samples of concentration of 0.2%, 0.4%, 0.6%, 0.8%, 1.0%, 1.5%, 2.0%, 2.5%, 5.0% and 10.0% of glucose and sucrose were prepared and measured using Terahertz Spectroscopy and had been analyzed repeatedly. To observe the molecular resonance of both three types of sugar, Glucose and Sucrose the appropriate amount of sugar has been carefully scaled using weighting machine to avoid miscalculation and mix with constant 10 mL of distilled water. Deionized water is used as a reference to avoid any impurities and contaminated substances effects on to the sample. The concentration of solution is prepared using weightage per Volume percentage calculation used to prepare the sample is based on Eq. (4).
Fig. 3 shows the sugar sample was inserted on the surface of microscope slide customized with the O-ring glued on the microscope slide surface. O-ring area was glued on to the microscope slide to ensure the constant volume sugar solution sample was inserted during measurement. In addition, to prevent from spillage, microscope cover was cascaded together on the O-ring after the solution was inserted.

Figure 3: (a) Sugar sample inserted in O-ring Area (b) Zoom microscope slides with O-ring
4.2 Terahertz Spectroscopy Setup
Fig. 4 is the experimental setup of the THz-TDS in transmission mode [29]. The generation and detection of the terahertz ray was employed with a by photoconductive antenna which acts as emitters and receiver. A femtosecond laser at wavelength 800 nm with optical pulse generated from a self-mode-locked Ti-Sapphire crystal was used as the laser source. This femtosecond laser pulse has between 10-150 fs pulse duration and 100 MHz repetition rate. The laser pulse was guided into lenses L1 and L2. Then, a half-wave plate, (HWP 1) and polarizer, (P1) were used to split part the pumping power for pumping towards the THz emitter. The amount of power can be adjusted by changing the angle of HWP 1. Emitter pumping beam then was directed to the optical delay line based on hollow retro reflector, HLR 1 guided by mirrors, M3 and M4 to the THz emitter. Lens L3 focused the pumping beam to the gap of the photoconductive antenna in the THz emitter. While half-wave plate, HWP 2 and polarizer, P2 were used to split part of pumping power for probing towards the THz detector. The beam from the probe would be reflected through the mirrors, M5 and M6, to the lens L4 and focused to the gap of a photoconductive antenna in the THz detector. The average power of pumping pulses focused into the THz emitter and detector photoconductive antennas are ∼20 mW and ∼15 mW, respectively. The spectral bandwidth of this THz-TDS system is ranging from 0.1–2.0 THz. During the experiment, the sample was placed at the center of the focal point of two lenses and the transmission result of the sample was observed and analyzed. As water vapor has strong absorption across the Terahertz range, the experimental setup was placed into a closed, sealed container filled with dry nitrogen.

Figure 4: Setup of THz TDS
In this study, a mono-crystalline single side polished quartz wafer with 400 μm thick was used. The 3 inch diameter of quartz substrate was cut into a square sample with a 1 cm × 1 cm using a diamond cutter. Prior to the fabrication process, the sample was cleaned by the standard cleaning procedure where the sample was immersed into ethanol and isopropanol (IPA) solutions and then rinsed with de-ionized water. Next, the sample was dipped into the hydroflouric (HF) solution to remove the native oxide and rinse with de-ionized water. The sample was dried with a nitrogen gun and left in the oven for 5 min at 90°C. Metal layer, namely aluminium was deposited with 0.5 μm thickness, using ULVAC VPC-1100 Thermal Evaporator System. The aluminium deposition parameter was monitored using standard parameter setup with melting point at 660°C, density 270 g/cm3, and the Z-ratio of 1.08. The aluminium thickness was measured and confirmed with KLA Tencor D-100 surface profiler measurement system.
A Polymethyl Methacrylate (PMMA) was used as a resist layer. The PMMA liquid solution was coated on the aluminium layer using a standard spinning procedure. The sample was spun with the cycle of 1000 rpm for 10 s and then increased to 4000 rpm for 60 s. Next, the sample was baked in the oven at 90°C temperatures for 30 min to make sure that the resist layer is adhered to the sample. Surface profiler was used to check the PMMA layer thickness. The lithography process was then commenced for transferring the circular slot patterns that were designed using CST software. This was carried out by exposing the PMMA resist layer using the electron beam. In this case, the exposure was set up with 100 kV voltage acceleration, 2 nA of beam current, and line dosage of 1000 μC/cm2. The exposed sample pattern was developed by immersing it into the mixed developer solution, namely Methyl Isobutyl Ketone (MIBK) and IPA with a ratio of 1:3 for 60 s. Then, the sample was rinsed with the IPA solution. Aluminium etchant was used for removal of the unwanted aluminium layer with varies etching time process. The PMMA resist was removed using acetone, and then the sample was rinsed with IPA and de-ionized water. Next, the sample was dried up using a nitrogen gun. During the fabrication process, the sample was checked and examined with the optical microscope and Field Effect scanning Electron Microscope (FE-SEM). Fig. 5 shows the fabrication process flow of FSS sample using quartz susbstrate.

Figure 5: FSS Fabrication Process
5.1 Glucose and Sucrose Detection at Terahertz Range
Based on the result in Figs. 1a–1d, both sugar glucose and sucrose show the decrease in transmission magnitude as the sugar concentration increases. This relationship between transmission and concentration are related to Beer's law theory presented in Eq. (5). According to the Beer's law [30], absorption will be directly proportional with the concentration. Therefore, transmission will be inversely proportional to the concentration of the solution. Where, A is representing as absorption, while T is transmittance, ɛ is molar absorptivity, l is length of the light passes through, and c is concentration of the solution.
Furthermore, the correlation analysis shows that at resonance of 1.98 THz and 1.80 THz all concentration shows high correlation with the regression value near to 1 and consistent decrease in transmission magnitude is observed as the concentration of glucose and sucrose in the solution increases compared to resonance frequency at 1.1 THz and 1.31 THz. Thus, to observe the improvement of detection sensitivity of terahertz spectroscopy combined with FSS, the FSS will be designed in line with resonance frequency of 1.98 THz and 1.80 THz.
5.2 Measured Transmission of FSS
After the process of fabrication mentioned in methodology section, the FSS sample is inspected using optical microscope and FESEM to observe the FSS structure after undergoing the etching process. The pattern structure on the FSS is labelled as FSS A for the FSS designed based on glucose detection at resonance of 1.98 THz, while FSS B is for FSS designed based on sucrose detection at resonance of 1.80 THz. The inspection analysis on both pattern is taken randomly at several structures to investigate the fabrication tolerance that might affect the FSS performance. Thus, the inspection shows the pattern structure is expanding its size between 1.5 μm to 2 μm after the fabrication process. Furthermore, further verification and inspection had been analyzed using FESEM together with Energy Dispersive X-ray Analysis (EDX) to observe that the circle slot structure is fully etched as well as identify the element composition in the sample. From the analysis of EDX over all slot area show no tracing of aluminum composition indicates all circle slot structure are fully removed through etching process. After the inspection, the FSS is measured using Terahertz Spectroscopy to investigate the FSS performance, however, the measured FSS performance might be slightly different from the simulated due to the fabrication process and Terahertz Spectroscopy error.
Fig. 6a compares between the measured and simulated transmission of FSS A for Glucose detection at resonance of 1.98 THz. Even though experiencing a bit of fabrication and terahertz spectroscopy error, the measured result for FSS A (glucose detection at 1.98 THz) shows moderate decrease in transmission magnitude from 0.928 in simulated to 0.628 in measured transmission magnitude at 1.98 THz. Furthermore, Fig. 6b shows the comparison results between measured and simulated transmission of FSS B for Sucrose detection at resonance of 1.80 THz. Analysis shows the measured transmission of FSS B (sucrose detection at 1.80 THz) had decrease in transmission magnitude from 0.915 in simulated to 0.744 in measured transmission magnitude at 1.80 THz. Despite from fabrication error that might affect the FSS performance, the inconsistency and unstable of amplitude fluctuation of the measured transmission result of FSS comes from the THz system issue on the input power during the measurement where it can only supply approximately until 1.3 THz.
5.3 Detection Improvement of Glucose and Sucrose Using FSS
In this paper, the molecular resonance of Glucose and Sucrose is observed at its best molecular resonance of 1.98 THz and 1.80 THz respectively due to its consistent decrease in transmission as increase in concentration that significantly follow the Beer's law theory. The initial measurement is analyzed using deionized water as a reference before analyzing the measurement using sugar (glucose and sucrose) sample under terahertz spectroscopy reading. In this paper, the result of the deionized water shows a transmission magnitude of 1.037 at 1.10 THz and 0.987 at 1.11 THz. Next, all glucose and sucrose concentration ranges between 0.2% to 10.0% are measured using terahertz spectroscopy and the effect of transmission of terahertz spectroscopy at every concentration analyzed.

Figure 6: FSS Measured and simulation transmission for (a) Glucose and (b) Sucrose detection
The graph presented in Figs. 7a and 7b shows a transmission magnitude over concentration level for sugar sample glucose and sucrose with and without metamaterial (FSS) layer. Result presented in Figs. 7a and 7b shows how the transmission magnitude changed with the glucose and sucrose concentrations ranging from 0.2% to 10.0%. From the result shown, the transmission decreases as sugar concentration increases. This can be clearly seen through three different concentrations in both sugar glucose (blue_diamond) and sucrose (blue_circle) which is 0.2%, 1.5% and 10.0%. However, it is observed that between concentration of 0.4% to 1.0% the transmission magnitude shows slightly small difference and approximately contained similar transmission amplitude from each other. Meanwhile, between concentrations of 1.5% to 10.0% sugar concentration the transmission magnitude can be easily observed and distinguished from each other. This might happen due to the limited detection sensitivity of terahertz spectroscopy system at low or small concentration.
Therefore, the same sugar sample is applied and cascaded together with the FSS layer on to the sugar sample and measured using Terahertz Spectroscopy to analyze the improvement of detection sensitivity of terahertz spectroscopy over low concentration. The FSS structure used in this study has already been optimized using CST software to the molecular resonance of the sugar molecular resonance of glucose and sucrose at resonant frequency 1.98 THz and 1.80 THz, respectively. The purpose of FSS designed at resonance of 1.98 THz and 1.80 THz is because by using the strong e-field concentration provided by the FSS at its resonance for utilizing the capability also maximize the sensitivity of the FSS structure to improve the detection sensitivity of the sample using FSS structure [31,32].
By the comparison between the transmission of glucose and sucrose with and without applying the FSS layer, the result in Figs. 7a and 7b can be clearly seen that all transmission magnitude of glucose (red_ cross) and sucrose (green_diamond) can be distinguished from each concentration when FSS structure is applied. Even so the improvement is observed for all concentration, but, in glucose concentration at 1.0%, slight low detection is observed compared to the other concentration. This might be due to the process of fabrication of the FSS or the placement orientation of the FSS. Changes in angle of incidence affects the performance of FSS or it might also be due to the process of measurement using Terahertz Spectroscopy experiencing some input power issue

Figure 7: Transmission magnitude for (a) Glucose and (b) Sucrose at different level of concentration with and without FSS layer
In addition, by calculating the average improvement by using the FSS, both glucose and sucrose transmittance is improved on the average of 25% and 13%, at resonance 1.98 THz and 1.80 THz, respectively for most of its concentration when FSS layer is applied on the sucrose sample. Meanwhile at non optimized resonance of FSS, it is observed that there are some improvements in detection when FSS layer is applied on to the sample by only at 4% and 9% at 1.1 THz and 1.31 THz, respectively. However, this situation shows that even though the FSS responses are not optimized to the designated frequency response, but by the strong field concentration provided by spatial filtering in the FSS is able to improve the detection sensitivity of terahertz spectroscopy at lower concentration.
In this paper, we demonstrate the feasibility of a terahertz detection using THz-TDS combined with the FSS structure for sugar detection of glucose and sucrose at different level of concentration. It is because glucose and sucrose are the basic element of sugar and play an important role in daily food intake. This study designed the FSS based on the circle slot structure used for detecting sugar, glucose, and sucrose concentration level as low as 0.2%. From the results of detection improvement, the FSS of glucose and sucrose can improve approximately about 25% and 13% at resonance of 1.98 THz and 1.80 THz, respectively. However, although the FSS is not optimized to its designated frequency, but by using the strong field concentration provided by spatial filtering in the FSS is able to improve the detection sensitivity of terahertz spectroscopy at lower concentration It means that, FSS combined with THz-TDS has the potential to become the alternative methods towards the traditional methods for food quality and safety control in food industry in future.
Acknowledgement: This research was supported by Ministry of Higher Education Malaysia (MOHE) through Fundamental Research Grant Scheme, FRGS/1/2017/TK04/UTHM/02/13, and Research Management Centre (RMC) of Universiti Tun Hussein Onn Malaysia (UTHM) through Postgraduate Research Scheme, GPPS VOT H026.
Funding Statement: This research was supported by Ministry of Higher Education Malaysia (MOHE) through Fundamental Research Grant Scheme, FRGS/1/2017/TK04/UTHM/02/13, and Postgraduate Research Scheme, GPPS VOT H026.
Conflicts of Interest: The authors declare that they have no conflicts of interest to report regarding the present study.
1. M. A. Rios-Corripio, M. Rojas-López and R. Delgado-Macuil, “Analysis of adulteration in honey with standard sugar solutions and syrups using attenuated total reflectance-Fourier transform infrared spectroscopy and multivariate methods,” CYTA – Journal of. Food, vol. 10, no. 2, pp. 119–122, 2012. [Google Scholar]
2. U. Moller, H. Merbold, J. R. Folkenberg and P. U. Jepsen, “Determination of alcohol- and sugar concentration in aqueous solutions using reflection terahertz time-domain spectroscopy,” in 2007 Joint 32nd Int. Conf. on Infrared and Millimeter Waves and the 15th Int. Conf. on Terahertz Electronics, Cardiff, UK, IEEE, pp. 1–2, 2007. [Google Scholar]
3. K. A. Kovshova, S. A. Lisakov and E. V. Sypin, “High-speed electro-optical device for determining of adulterated honey,” in 17th Int. Conf. of Young Specialists on Micro/Nanotechnologies and Electron Devices (EDMErlagol, Russia, IEEE, pp. 313–316, 2016. [Google Scholar]
4. S. Das, K. M. Reza and M. A. Habib, “Frequency selective surface based bandpass filter for THz communication system,” Journal of Infrared, Millimeter, and Terahertz Waves, vol. 33, no. 11, pp. 1163–1169, 2012. [Google Scholar]
5. K. Kneipp, H. Kneipp, I. Itzkan, R. R. Dasari and M. S. Feld, “Ultrasensitive chemical analysis by Raman spectroscopy,” Chemical Reviews, vol. 99, no. 10, pp. 2957–2976, 1999. [Google Scholar]
6. T. Zhang, A. Tao and S. Yan, “Terahertz time-domain spectroscopy of crystalline glucose and galactose,” in 2nd Int. Conf. on Bioinformatics and Biomedical Engineering, Shanghai, China, IEEE, pp. 1146–1149, 2008. [Google Scholar]
7. J. Qin, L. Xie and Y. Ying, “A high-sensitivity terahertz spectroscopy technology for tetracycline hydrochloride detection using metamaterials,” Food Chemistry, vol. 211, pp. 300–305, 2016. [Google Scholar]
8. M. O. AlNabooda, R. M. Shubair, N. R. Rishani and G. Aldabbagh, “Terahertz spectroscopy and imaging for the detection and identification of illicit drugs,” In 2017 Sensors Networks Smart and Emerging Technologies (SENSET), Beiriut, Lebanon, IEEE, pp. 1–4, 2017. [Google Scholar]
9. X. Zipeng, L. Lijuan, R. Jiaojiao and C. Guohua, “Nondestructive testing of rubber materials based on the reflective terahertz time-domain spectroscopy,” in 2017 Int. Topical Meeting on Microwave Photonics (MWPBeijing, China, IEEE, pp. 1–4, 2017. [Google Scholar]
10. S. Narayan, R. U. Nair and R. M. Jha, “A novel EM analysis of free-standing rectangular aperture FSS based on MM-gSM technique,” in 2009 Applied Electromagnetics Conf. (AEMCKolkata, India, IEEE, no. 3, pp. 1–3, 2009. [Google Scholar]
11. T. K. Wu, “Improved broadband bandpass FSS filters for 5G applications,” in 2018 IEEE Int. Symposium on Antennas and Propagation & USNC/URSI National Radio Science Meeting, Boston, MA, USA, IEEE, pp. 2033–2034, 2018. [Google Scholar]
12. T. Chakrabarti, S. Sarkar, S. K. Ghosh and S. Bhattacharyya, “An ultra-thin FSS bandpass filter in terahertz region,” in 2019 TEQIP III Sponsored Int. Conf. on Microwave Integrated Circuits, Photonics and Wireless Networks (IMICPWTiruchirappalli, India, IEEE, pp. 492–494, 2019. [Google Scholar]
13. C. Sun and J. Li, “Bandpass filter based on metamaterials in terahertz wave region,” in 2011 4th IEEE Int. Symposium on Microwave, Antenna, Propagation and EMC Technologies for Wireless Communications, Beijing, China, IEEE, pp. 252–254, 2011. [Google Scholar]
14. R. Mishra, A. Sahu and R. Panwar, “Cascaded graphene frequency selective surface integrated tunable broadband terahertz metamaterial absorber,” in IEEE Photonics Journal, vol. 11, no. 2, pp. 1–10, 2019. [Google Scholar]
15. N. Liu, X. Sheng, C. Zhang and D. Guo, “Design of frequency selective surface structure with high angular stability for radome application,” in IEEE Antennas and Wireless Propagation Letters, vol. 17, no. 1, pp. 138–141, 2018. [Google Scholar]
16. T. W. Li, D. Li and E. P. Li, “A novel FSS structure with high selectivity and excellent angular stability for 5G communication radome,” in 10th Global Symposium on Millimeter-Waves, GSMM 2017, Hong Kong, China, IEEE, pp. 50–52, 2017. [Google Scholar]
17. H. Zhou, S. Qu, B. Lin, J. Wang, H. Ma et al., “Filter-antenna consisting of conical FSS radome and monopole antenna,” IEEE Transactions on Antennas and Propagation, vol. 60, no. 6, pp. 3040–3045, 2012. [Google Scholar]
18. J. Xue, W. Jiang and S. Gong, “Wideband RCS reduction of microstrip antenna based on 2.5-dimension miniaturized frequency selective surface,” in 2016 IEEE 5th Asia-Pacific Conf. on Antennas and Propagation (APCAPKaohsiung, Taiwan, IEEE, pp. 209–210, 2017. [Google Scholar]
19. D. K. Lee, G. Kim, C. Kim, Y. M. Jhon, J. H. Kim et al., “Ultrasensitive detection of residual pesticides using THz near-field enhancement,” IEEE Transactions on Terahertz Science and Technology, vol. 6, no. 3, pp. 389–395, 2016. [Google Scholar]
20. B. Qin, Z. Li, F. Hu, C. Hu, T. Chen et al., “Highly sensitive detection of carbendazim by using terahertz time-domain spectroscopy combined with metamaterial,” IEEE Transactions on Terahertz Science and Technology, vol. 8, no. 2, pp. 149–154, 2018. [Google Scholar]
21. S. J. Park, J. T. Hong, S. J. Choi, H. S. Kim, W. K. Park et al., “Detection of microorganisms using terahertz metamaterials,” Scientific Reports, vol. 4, no. 1, pp. 4988, 2015. [Google Scholar]
22. L. Xie, W. Gao, J. Shu, Y. Ying and J. Kono, “Extraordinary sensitivity enhancement by metasurfaces in terahertz detection of antibiotics,” Scientific Reports, vol. 5, pp. 1–4, 2015. [Google Scholar]
23. C. Song, W. H. Fan, L. Ding, X. Chen, Z. Y. Chen et al., “Terahertz and infrared characteristic absorption spectra of aqueous glucose and fructose solutions,” Scientific Reports, vol. 8, no. 1, pp. 2–9, 2018. [Google Scholar]
24. Z. P. Zheng, W. H. Fan, Y. Q. Liang and H. Yan, “Application of terahertz spectroscopy and molecular modelling in isomers investigation: Glucose and fructose,” Optics. Communications, vol. 285, no. 7, pp. 1868–1871, 2012. [Google Scholar]
25. J. Kröll, J. Darmo, and K. Unterrainer, “Terahertz spectroscopy of vibrational modes of molecular crystal of sucrose,” in Infrared and Millimeter Waves, Conf. Digest of the 2004 Joint 29th Int. Conf. and 12th Int. Conf. on Terahertz Electronics, Karlsruhe, Germany, IEEE, pp. 89–90, 2004. [Google Scholar]
26. T. Ohashi, K. Takahashi, H. Sato and H. Takaba, “Assignment of terahertz vibrational mode in sucrose powder by comparing with single-crystalline and computational spectra,” in 41st Int. Conf. on Infrared, Millimeter, and Terahertz Waves (IRMMW-THzCopenhagen, Denmark, IEEE, pp. 1–2, 2016. [Google Scholar]
27. S. Sarkar, T. Chakrabarti, S. K. Ghosh and S. Bhattacharyya, “A broadband FSS bandstop filter in terahertz region,” in in 2019 URSI Asia-Pacific Radio Science Conf. (AP-RASCNew Delhi, India, IEEE, pp. 7–10, 2019. [Google Scholar]
28. F. C. Seman and N. K. Khalid, “Design strategy for optimum planar square loop FSS with different dielectric substrates,” In Theory and Applications of Applied Electromagnetics, Springer International, Germany, 2014. [Google Scholar]
29. S. N. M. Rifin, Y. Munajat, N. Kasim, M. Hamdi, A. Z. Arshad, et al., “Terahertz time- domain spectroscopy of local cow's tissues,” Buletin Optik, no. 2, pp. 16–22, 2017. [Google Scholar]
30. T. Mayerh and P. Technologien, “Beer's law derived from electromagnetic theory,” Spectrochimica Acta Part a: Molecular and Biomolecular Spectroscopy, vol. 215, pp. 345–347, 2019. [Google Scholar]
31. I. Jáuregui-López, P. Rodriguez-Ulibarri, S. A. Kuznetsov and M. Beruete, “Labyrinth absorber based on metageometries metasurface for fungi detection,” in 14th European Conf. on Antennas and Propagation (EuCAPCopenhagen, Denmark, IEEE, pp. 1–4, 2020. [Google Scholar]
32. C. Weisenstein, D. Schaar, M. Schmeck, A. K. Wigger, A. K. Bosserhoff and P. H. Bolívar, “Detection of human tumor markers with THz metamaterials,” in 43rd Int. Conf. on Infrared, Millimeter, and Terahertz Waves (IRMMW-THzNagoya, Japan, IEEE, pp. 1–2, 2018. [Google Scholar]
 | This work is licensed under a Creative Commons Attribution 4.0 International License, which permits unrestricted use, distribution, and reproduction in any medium, provided the original work is properly cited. |