DOI:10.32604/cmc.2022.022711
| Computers, Materials & Continua DOI:10.32604/cmc.2022.022711 | |
| Article |
Noisy ECG Signal Data Transformation to Augment Classification Accuracy
1Department of Information Technology, University of Gujrat, Gujrat, 50700, Pakistan
2Department of Computer Science, University of Gujrat, Gujrat, 50700, Pakistan
3Faculty of Computing, The Islamia University of Bahawalpur, Bahawalpur, 63100, Pakistan
4Department of Computer Science, COMSATS University Islamabad, Islamabad, Pakistan
5Industrial Engineering Department, College of Engineering, King Saud University, P.O. Box 800, Riyadh 11421, Saudi Arabia
6Department of Information Systems, College of Computer and Information Sciences, King Saud University, P.O. Box 800, Riyadh, 11421, Saudi Arabia
7Department of Information and Communication Engineering, Yeungnam University, Gyeongsan, 38541, Korea
*Corresponding Author: Muhammad Shafiq. Email: shafiq@ynu.ac.kr
Received: 16 August 2021; Accepted: 27 September 2021
Abstract: In this era of electronic health, healthcare data is very important because it contains information about human survival. In addition, the Internet of Things (IoT) revolution has redefined modern healthcare systems and management by providing continuous monitoring. In this case, the data related to the heart is more important and requires proper analysis. For the analysis of heart data, Electrocardiogram (ECG) is used. In this work, machine learning techniques, such as adaptive boosting (AdaBoost) is used for detecting normal sinus rhythm, atrial fibrillation (AF), and noise in ECG signals to improve the classification accuracy. The proposed model uses ECG signals as input and provides results in the form of the presence or absence of disease AF, and classifies other signals as normal, other, or noise. This article derives different features from the signal using Maximal Information Coefficient (MIC) and minimum Redundancy Maximum Relevance (mRMR) technique, and then classifies them based on their attributes. Since the ECG contains some kind of noise and irregular data streams so the purpose of this study is to remove artifacts from the ECG signal by deploying the method of Second-Order-Section (SOS) (filter) and correctly classify them. Several features were extracted to improve the detection of ECG data. Compared with existing methods, this work gives promising results and can help improve the classification accuracy of the ECG signals.
Keywords: ECG; atrial fibrillation; adaptive boosting; heart rate variability
In order to fulfill the body's needs such as oxygen supply and nutrition, the heart is the main organ located in the chest and assists the entire circulatory system inside the body. The heart has four chambers. The upper two chambers that are responsible for receiving blood are called atria, and the lower two chambers that discharge blood are called ventricles. In the ordinance that separates the left and right atria and the left and right ventricles, nerves walls called septum are used [1]. In the right atrium, there is a node that produces a heartbeat, called the atrial node (or SA node). In the human heart, the process from the end of a heartbeat to the beginning of a new heartbeat is called the cardiac cycle. The cardiac cycle has two phases of contraction or depolarization and diastole or repolarization [2]. Systole is a period when the ventricles contract to empty all blood on the other hand, extra-cardiac diastole is part of the cardiac cycle, during which the heart is emptied and refilled with blood during the systolic and repolarization period. Doctors can use electrodes and a suitable device called an electrocardiogram (ECG) to capture the signal produced by the pacemaker. The electrocardiogram is one of the most integrated and important methods for studying the electrical signals produced by the heart. An ECG is a diagnostic tool that can measure and record the electrical activity of the cardiac cycle in impeccable detail. It records the heart's electrical pulses in vivid graphics.
Auxiliary stimulation of the nerve impulse of the heart is used to generate an electrocardiogram. ECG is explained by using waves, intervals, and segments. In ECG, a wave can be described as any positive or negative deflection from isoelectric line (a straight line with no positive or negative charges in the ECG to produce deflection), which represent specific electrical events. They are also representatives of different electrophysiological events in the cardiac cycle. A normal ECG consists of P, Q, R, S, and T waves [3]. QRS waves collectively made the QRS complex. When the upper chambers of the heart contract they produce P wave. QRS complex refers to the depolarization of the ventricles. Since the myocardium is also repolarized, they induce T waves when the lower chambers of the heart are electrically resting [4]. A segment can be defined as the length between two specific events of the cardiac cycle (between depolarization and repolarization. The duration between these events that describes the period of time is called the interval. The interval includes one or more waveforms and one segment. When these waves are generated irregularly, they describe the presence of arrhythmia.
A condition where the depolarization is very high and the heartbeat is fast or the heartbeat is low and irregular is called arrhythmia. There are two basic types of arrhythmias. Bradycardia is the point where the pulse is too low- Less than 60 beats per minute. In this regard, tachycardia can be identified as a point where the heart pulse is too high-more than 100 heartbeats per minute. If it is more extreme, it can lead to cardiovascular failure or death [5]. Heart arrhythmias demonstrate the vast majority of the cardiovascular issues that may prompt chest pain, heart failure, or sudden cardiac death [6]. One of the most common tachycardia arrhythmias that widely affect the population is Atrial Fibrillation (AF). AF is detected when there is an irregular flow of ECG waveforms, that is, when atrial contractions experience chaotic electrical impulses (these are waveforms generated in a rapidly uncoordinated and weekly manner). AF is defined as “irregular supraventricular tachycardia (SVT) with no p-wave and duration > 30 s” [7]. It occurs in 1% to 2% of the total population and can cause heart attacks, heart failure, and other complex heart diseases.
In the United States, it is estimated that more than 5 million people have AF, and the prevalence of this arrhythmia will increase with age in the next ten years [8]. In order to reduce the risk of stroke, patients should be treated with anticoagulants appropriately. ECG is currently the best quality detector for detecting the presence of AF, because it can accurately obtain the electrical activity of the heart. Irregularities in the ECG waveform, such as the absence of P waves and abnormal RR intervals, can detect AF arrhythmia [9]. Nowadays, signal processing can basically be found in any ECG evaluation framework, and it has truly verified its importance for completing the improved analysis of a large number of heart diseases [10]. Over the years, from the perspective of ECG signal-based analysis, the study of heart beat-to-beat time variation (called heart rate variability (HRV)) has been deeply considered [11]. From various electrocardiogram signals, HRV is a feature extracted to better identify cardiac abnormalities and diseases.
AF can be detected in two ways by analyzing atrial activity or by examining methods based on ventricular response [12]. In the atrial activity analysis method, AF is detected by analyzing the absence of P wave or the presence of fibrillating f wave in the TQ interval. On the other hand, the ventricular response method is based on the analysis of the interbeat time (“RR interval”) of the QRS complex. In the past, many techniques have been applied to predict AF arrhythmia, but this field is still lacking because most of the proposed algorithms and techniques are based on ventricular response analysis methods, which are usually used to clean data by eliminating noise signals. Techniques based on atrial activity analysis are also applied, but their algorithms are not sufficient to deal with noise, because noise is the main factor in the method, so the results provided by these techniques are inefficient and less accurate. The electrocardiogram signal is either affected by external sources or by morphological processes that occur in the human body that cause noise. There are two types of noise in ECG signals. The noise generated by the movement of the patient or the recording cable is called baseline wander (BW) and has a low power frequency. The noise caused by EMG and power line interference refers to Gaussian white noise, which has a normal or high-power frequency [13]. In this study, we classify ECG signals as AF and other arrhythmias, and we will apply techniques to remove noise from ECG signals. Since the ECG signal contains noisy data, it may produce unexpected and erroneous results. The data set we used for this research is Physionet/Computing in Cardiology Challenge 2017 [14]. This research has the following key contributions.
• We propose a method to remove noise from ECG signals by using Second-Order Cross-Section (SOS) filter to improve the accuracy of the data set. In this regard, we extracted a set of features, including morphology, statistics, HRV, AF, noise, and other rhythm-related features.
• We improve the classification accuracy by implementing a multi-layer model method of binary classification instead of a single-class model, because it provides degrees of freedom in the selection of features and classifiers for each binary classification node.
• We verified the accuracy of the proposed technology while analyzing the ECG signal through a large number of medical records. Compared with existing solutions, the proposed technology has achieved gratifying results because the classification accuracy of all categories (F1n, F1a, F1o, and F1p) has been improved, which can help the sensor-based healthcare industry to identify more accurately cardiovascular diseases.
The rest of the paper is organized as follows: Section 2 briefly introduces related work. Section 3 details the proposed method. Section 4 evaluates the proposed algorithm and discusses the results. Finally, Section 5 concludes the paper by identifying limitations and future work.This section contains information about the achievements and an overview of ECG analysis and classification. In addition, it covers the different techniques used in ECG analysis. Since the development of this field, a lot of work has been done in various branches and fields of ECG analysis. However, the key artifacts are described below.
2.1 Techniques for Noise Removal Only
For electrocardiogram analysis, some studies are only devoted to processing and removing the noise in the electrocardiographic. In [15], the authors proposed the delay error normalized LMS (DENLMS) to remove high frequency and Channel noise. In [16], the authors deployed to replace noise it sets a threshold, and after detecting noise or missing values, replace these values with the appropriate threshold. The results show that the noise replacement technique is more effective than just filtering the noise and also produces more accurate results. This method is used for noise generated in wearable sensors, but the model provides a better alternative instead of removing the noise value.
2.2 Techniques Based on Inappropriate Features
Most existing methods (e.g., [1,17–19]) are model to ignore irregular Data flow. These models do not classify the noise classes and just discard the waves with irregular flow, which also reduces the length of the signal. In addition, these technologies only use QRS complexes from various ECG signals. The article proposes an algorithm to identify the RS slope from the QRS complex [20]. This algorithm uses five data channels to process different types of signals, even noisy signals. But for preprocessing, they use a very basic filtering method of moving median and mean and Butterworth linear low-pass filter. This article does not classify the signal, and the noise removal technology is also insufficient. Authors of [21] used a powerful method to distinguish between normal and irregular recordings. The proposed model initially loads an ECG file and converts the ECG signal into an envelope diagram. These envelope maps are then used to detect QRS complexes from the original ECG signal. If more than four complexes are detected, these signals are considered to be noisy and the process is terminated. None of these techniques were used to deal with noisy recordings, they were simply rejected.
2.3 Noise Classification Techniques Without P Wave
In the past, some studies on ECG analysis used P&T (Pan-Tompkins detector). By using this detector, they retained the R peak, where only the r peak was used to classify the ECG signal, and some of them only used the Rr interval for ECG analysis. In [22,23], the author used a third-order noise removal technique called Butterworth and a median low-pass linear filter. In [24], proposed systems are also applicable to RR but their models are different. These systems have used a combination of three methods, called phasor transform, continuous wavelet transform (CWT), and S transform, with two median filters called wavelet Wiener and Pyramid for noise processing. Paper [25] and [26] use a QRS complex-based model that includes characteristics from the QRS complex, such as skewness and kurtosis, to assign ECG waves. The noise model used in the study [25] is a Butterworth filter, and [26] uses LMS Adaptive filter Least Mean Square (LMS delay error normalization. LMS uses an extended version of DENLMS to remove noise. Paper [6] proposed a new noise removal model based on band-pass filter, segmentation and labeling, and scaling. But this model only extracts features based on r peaks and ensures the validity of the RR interval. Another valuable method in the past is [27], which uses a convolutional neural network (CNN) includes primary and secondary models. Their classification method detects QRS complexes and then uses the signal quality index (SQI) to analyze the signal quality. If the signal category is too low, it marks the signal as a noise segment, otherwise it processes the spectrogram into batch normalization and then performs post-processing, but the technology does not train their model for noise signals. Paper [28] also used SQI technology for noise classification and Savinsky-Golay filter for preprocessing. The main problem with all models proposed in this context is that they only ensure R waves and do not care about keeping other waves, which can lead to misclassification of other categories, because other waves also matter while scrutinizing the ECG.
2.4 P Wave-Based Noise Classification Methods
Researchers are also committed to extracting features of QRS complex and P wave. Paper [29] uses classical analysis to explore the rules of P wave and ventricular utilization accumulation RR responds at intervals. For preprocessing, they use existing methods along with MATLAB. Similarly [30] also use atrial activity and ventricular response for classification. The author performed wavelet multifractal and symbol analysis to obtain a regular ECG waveform. For ventricular analysis, they used the old P&T detector technology. Paper [31] proposed a technique that follows the same strategy, which is suitable for atrial and ventricular response characteristics. The moving average filters are used to detect baseline drift and low-frequency noise signals for de-noising, and they use wavelet transform methods to cut off high-frequency irregularities. The authors of [32] also experienced a different method. They extract different features and apply R peak detector by setting thresholds on the basis of these peaks. They further detect all other waves if any Peaks do not match their set threshold they mark them as noisy. Paper [33] also suggested that morphology and HRV characteristics are most important when analyzing ECG. If RR interval is greater than 2 s, this study marks the waveforms as noisy. In the context of HRV feature-based analysis, paper [34] describes a QRS detection algorithm called “gqrs” to generate HRV signals. For noise processing, this work uses the “double median filter” and the “taut string linear approximation method”. These technologies respectively eliminate baseline drift and reduce the influence of abnormal signals. Paper [35] use two-layer binary classification and a simple spectrogram-based method to identify noise and extract ventricles, atria, and HRV and morphological features. This model marked RR intervals with high spectral power above 50 Hz as noisy and rejected them before further processing. All these studies have some shortcomings, for example [31] and [30] only use P&T for QRS, which alone is not enough for better analysis and classification of ECG. Similarly [32] detect all waves based on R, which leads to misclassification and inadequate results.
This section contains information about the tools, methods, and materials used to conduct the research. In addition, it also details the system processes for performing data analysis and operations, including data collection, data processing and extraction.
The data set used in our research comes from [14]. The data set contains 8,528 different single-lead ECG records. In these 8,528 records, 5154 are normal types, 771 are AF, 2557 are other types, and 46 are noisy. The frequency used to sample these records is 300 Hz. These signals are based on binary data, where time is measured in seconds on the x-axis and amplitude is measured in milliamps on the y-axis. The normal category contains data of normal ECG waveforms, AF contains data about patients with atrial fibrillation disease, and the noise rhythm contains very irregular data that cannot provide any information. Fig. 1 shows the proposed methodology, which includes multiple steps detailed below.
Preprocessing the electrocardiogram is a technique to remove different kinds of artifacts from the electrocardiogram. Past research on P&T algorithm [25] and spectrogram technique [35] are not enough, because spectrogram represents time as a sine wave that is not localized in time and does not represent abrupt changes. Therefore, in this study, we use Second-Order Cross Section Filter (SOS). This SOS contains high-pass and low-pass filter orders. It performs band-pass filtering by removing the low-scale coefficient of the low-frequency signal, and eliminates the high-scale of the waveform with too low frequency. In order to further remove the noise in the signal, it will create a waveform closer to the ECG signal, thereby preserving the QRS and P and T waves. In addition, the signal length remains the same, and a well-reconstructed signal is generated. Fig. 2 elaborates the process of preprocessing.
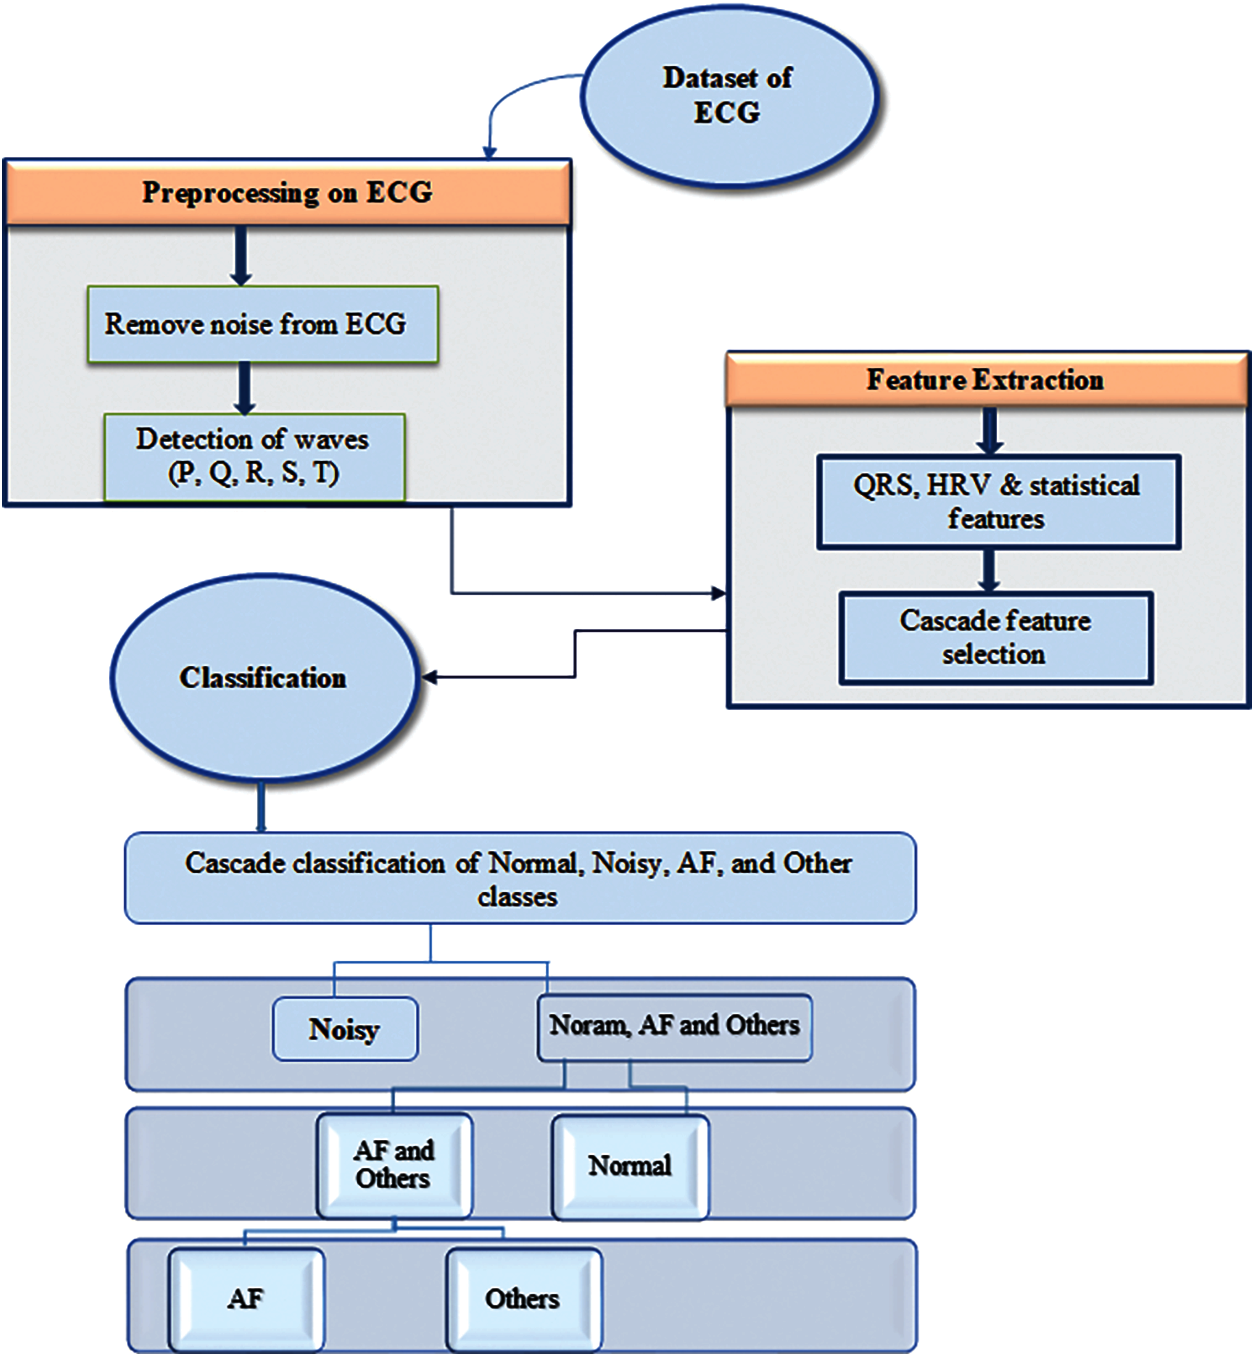
Figure 1: Architecture of the proposed methodology
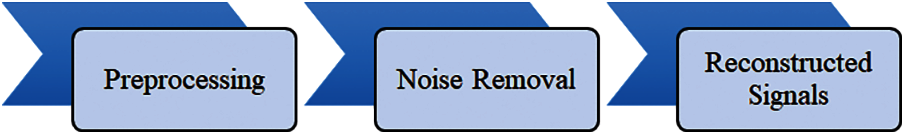
Figure 2: Transformation phases of the ECG signal
3.3 Identification of ECG Waves
This module is used to detect ECG waves including P, Q, R, S and T. Pan & Tompkins algorithm is used for detecting and identifying R waves. After detecting the R wave, we identified other waves on the basis of it. The P wave is complementary, and the R wave is detected as the maximum value, which is called the maximum value because the maximum value is higher than the two edges of the R peak. The salient minimum, called the minimum of the R wave, is detected as the Q wave because it is the most prominent low on both sides. After this extreme value, the R peak is used to detect the S wave and T wave. Since extreme values also have maximum and minimum points on both sides, the minimum value in this recognized extreme value is called an S wave with high amplitude. On the other hand, the maximum point of this extreme value is detected as T wave.
Since we have discussed that the purpose of this study is to classify ECG signals into one of four categories, in the direction of achieving this goal, we extract features from data signals. After extracting the features, we store them in cells, which help us to classify the signal. According to the characteristics, these features are divided into the following categories.
The structure of ECG waveforms varies, so in order to classify them, information about their structure needs to be extracted. In terms of morphological features, we extract features based on the ECG waveform, such as the segments and intervals of the height, width, and depth of the ECG waves. Therefore, the features extracted in this context are the slope and variance of the interval in the ECG, including ST, RS, and QR. In addition, these features include the depth of all segments in the ECG and the depth of the ECG waveform. In addition, the features in this context are the average, median, and range of ECG intervals, segments, and slopes. Since morphological features have data about the structure of the ECG signal, this data can be used to predict normal, abnormal, and other categories that contain irregular intervals, so the Model 1 classifier can use it to classify normal and other categories. It also includes SOA (structure-oriented functions) capabilities.
3.4.2 State of the Art AF Features
AF represents irregular ventricular response, so it can be detected as irregular R peaks in ECG, and it does not have P waves. This module detects different features from existing technologies, including AFEvidence, raw count, irregular evidence, pace count, density evidence, anisotropy evidence, and AFEvidence from RR interval [36]. More features are extracted in this context, some of which are based on sample entropy, while others are related to RR and delta RR intervals. The features extracted from these are their coefficients and variation.
3.4.3 Time Domain Features of HRV
In ECG, we have a variety of heart cycles, so we can measure their distance, which leads to a heartbeat in HRV. HRV features include features about intervals, such as standard deviation (SDSN), SDSD (standard deviation of successive differences) features. We extract features in this context based on RMSSD (Root Mean Square of Continuous Differences). nn50 The number of consecutive NN pairs with a difference of more than 50 ms pnn50 NN50 divided by the ratio of the total number of 50 ms nn20 Paired continuous NNs with a difference of more than 20 milliseconds pnn20 [37].
3.4.4 Statistical Characteristics of RR Interval
This module is about extracting the characteristics of the RR interval statistical measurement. These statistical measures include the average, median, maximum, and minimum of the RR interval. These features also include irregular intervals called RR interval skewness and features including large intervals called kurtosis. Some other extracted features are variance, RR interval range, and dRR (delta RR) interval.
3.4.5 Features from Frequency Domain
In the context of visualizing HRV features, Poincare plotting technology was sued. For this purpose, Poincare features are tested, which represent how the prediction of the next RR interval is predicted by the previous interval. In addition, the frequency analysis of the ECG signal is also carried out in this section. For this frequency analysis, a technique called Time Fourier Transform STFT is used.
3.4.6 Features from Delta (RR) and RR
In this module, the probability density estimates of RR and incremental RR intervals are extracted. It includes skewness, kurtosis, and other characteristics. Other characteristics include maximum distance, minimum distance, and length, or the number of peaks between RR and delta RR.
3.4.7 Features for Other Rhythm
To describe categories other than AF, normal and noisy features are used, such as irregular R peaks, abnormal duration of R peaks, slope, segmentation, increased and abnormal heart rate.
3.4.8 Features Regarding the Noisy Rhythm
Any abnormality of the ECG peak and any sudden changes in structure reveal noisy segments. Therefore, in order to detect the features of these segments, the features including the amplitude and variance based on the QRS complex and other peaks are extracted from the frequency domain and the time domain. Because of this amplitude and variance, the noise segment can be detected more accurately, because the noise segment is nothing more than the change in the peak amplitude and variance in the ECG.
Feature selection is more important because all results are based on the selection of extracted features, which can eliminate irrelevant features, and can discard duplicate features and store them in only one file. we used well-known tools to select the most relevant features, namely the maximum information coefficient (MIC) and the minimum redundancy and maximum correlation (mRMR) techniques [35].
In this study, we use AdaBoost (Adaptive Boost) for classification. This is a machine learning integration technology based on boosting. Based on the work of AdaBoost, a similar task was performed in our research. Classification is performed on different layers by using different AdaBoost models. Different models of the classifier take different metrics on the data and train on these data to obtain better results from weak classifiers and at the same time enhance poor classification results. This method will generate a robust classifier by introducing inadequate, unskilled and weak classifiers. Due to its user-friendly interface and multiple built-in data analysis technologies, all feature extraction and classification are performed in MATLAB. In order to obtain the classification results and check the performance according to accuracy, F1 for each of the four types is defined in the following. In this regard, F1 for normal rhythm can be written as,
F1 for AF rhythm is calculated as follows,
F1 for other rhythms is given by,
and, F1 for noisy signal is defined as follows,
For F1n in Eq. (1), Nn is the number of normal instances classified as normal by both the reference and prediction classifier, ∑N is the total number of instances in the reference category, and ∑n is the sum of all instances classified as normal by the classifier. For AF in Eq. (2), ∑A is the total amount of data represented by the reference classifier as AF, and ∑a is the total amount of classified data predicted as AF by the proposed classification method. For Eq. (3), Oo in the other rhythm formula section has the number of instances predicted as ‘other’ class by the referenced and proposed classifier. ∑O represents the aggregated instance of the other class by the reference classifier, and ∑o has the total amount of data predicted by the classifier to be the other class. In F1p in Eq. (4), Pp is the number of Noisy instances that are predicted by the reference and working classifiers and labelled as Noisy. On the other hand, ∑P has the total number of instances classified as Noisy by the reference classification, and ∑p represents the total number of instances predicted by the working classifier.
This section provides detailed information about the experiment and interpretation of the results. In the experimental analysis, we used Matlab to analyze the ECG data through signal processing because it is the most important technique for analyzing ECG waveforms because ECG waves are sometimes in a continuous and episodic rhythm with the help of signal processing. In this regard, we perform feature extraction after performing preprocessing to clean the ECG signal. In past research, the features of ECG classification were to extract general types of features, such as RS slope, QRS complex, and heart rate. These features are not enough when we need to divide the signal into four categories. We, therefore, extracted some other features to support “Other” and “noisy” classes to improve the accuracy. The classification is performed after obtaining the numerical characteristics of the features. In order to obtain more accurate results, we used AdaBoost (Adaptive Boost) with a multi-layer method for classification.
Preprocessing experiments are performed to obtain pre-processed ECG signals and to remove baseline drift, other high-frequency and low-frequency artifacts. The ECG waveform has sporadic data streams, which contain noise fragments (only the coefficients of extremely high frequency and extremely low frequency), which cannot be classified more accurately, and often produce wrong results, so this step in our experiment helps to improve result. As a result of this, we get bpfecg (bandpass filtered electrocardiogram). After getting bpfecg, because the ECG does not have all the artifacts, we get the filtered form of the ECG signal as shown in Fig. 3. We observed that the ECG we get is in a state in which the lower scale coefficients of the high-frequency signal and the higher scale coefficients of the waveform with too low frequency are eliminated. In addition, the waveform closest to the ECG signal is created, all waveforms are preserved, and the signal length remains the same.
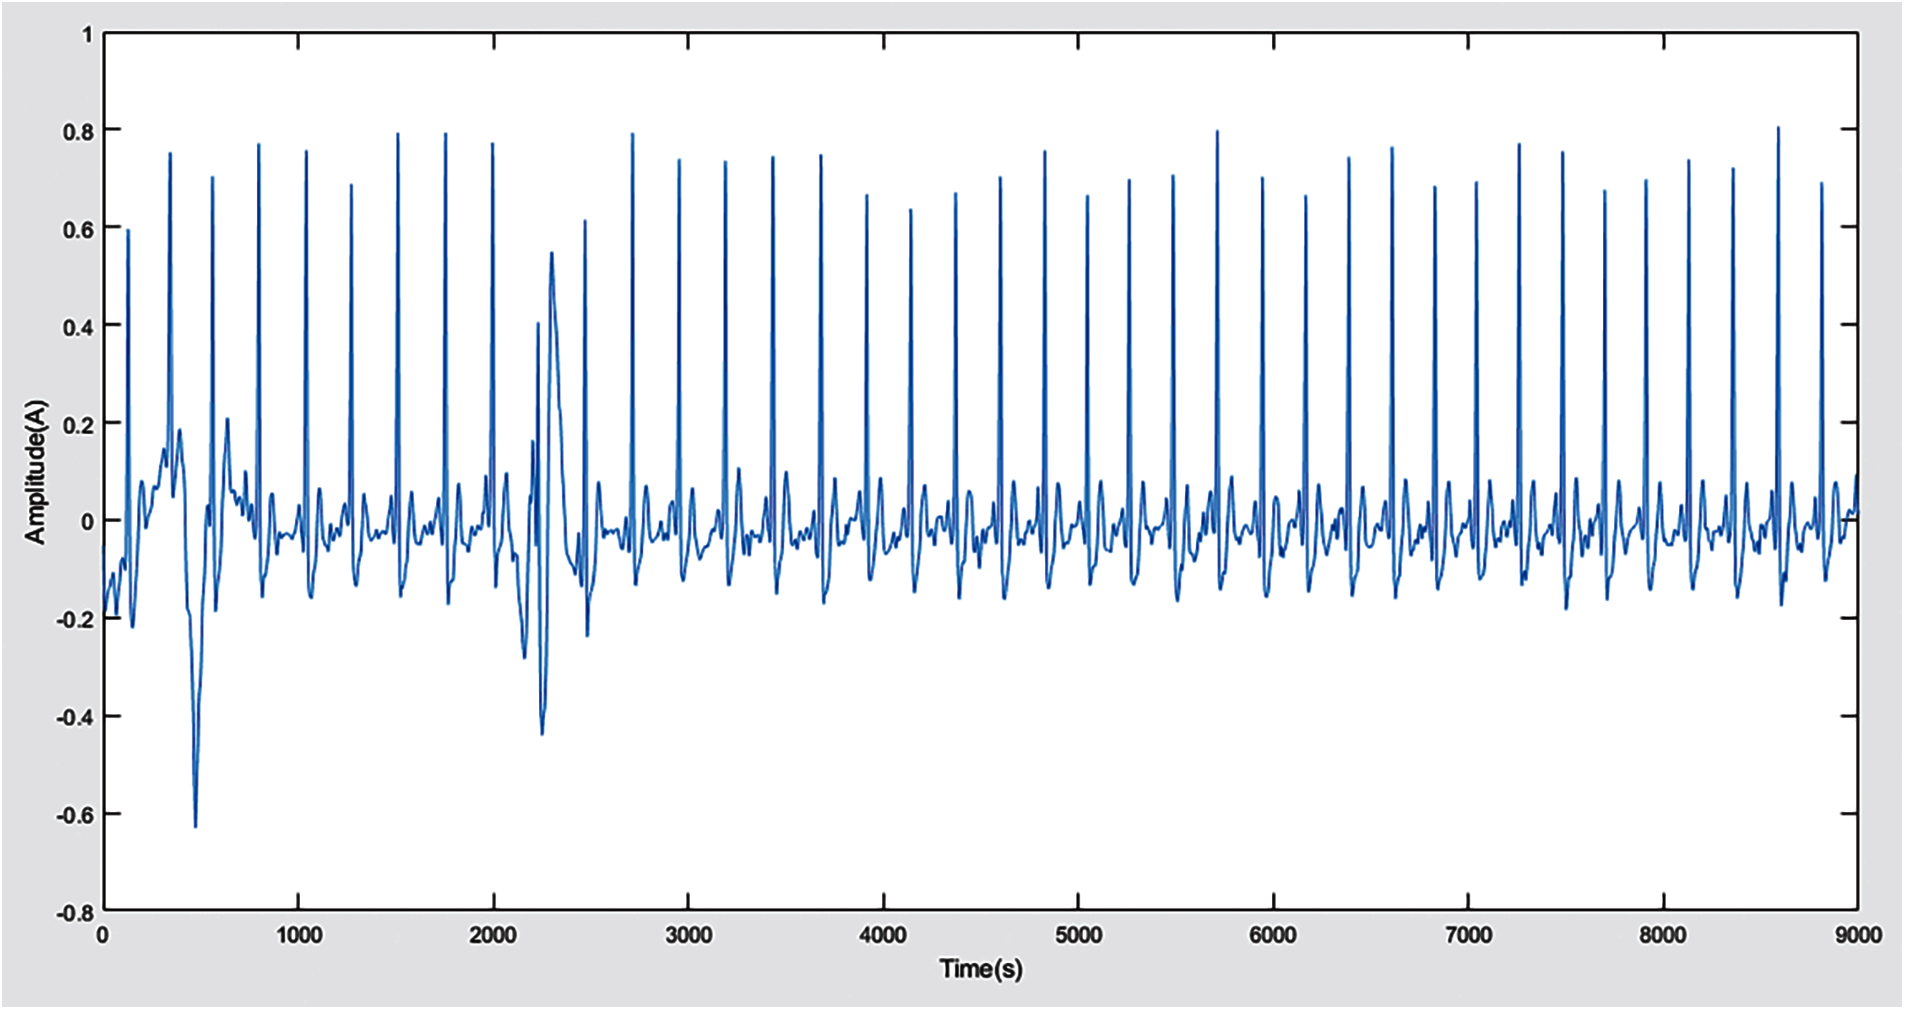
Figure 3: Filtered ECG signal after noise removal
4.2 P, Q, R, S, and T Detection
In order to obtain the PQRST wave, we follow the maximum and minimum method discussed in the methodology which leads us to identify these indicators and then detect all waves from the ECG signal. Fig. 4 represents the indexes we get in the form of P, Q and S. After these values and indexes are displayed in the graph, the P, Q, R, S and T points are detected and identified in the ECG as flaunted in Fig. 5. If the ECG can be distinguished effectively, the system can predict the result more accurately. In the existing techniques, only the three-wave QRS complex is the center wave, and the classification is based on this complex. This is not enough to get better results, because all other waves will also affect the output. Therefore, we aim and hit all waves to obtain more accurate results.
In Fig. 6, we have obtained some RR and deltaRR (dRR) interval values since features such as R wave and its interval play an important role in this classification. After outputting the form of feat1, the values of AF evidence (AFEv), the coefficient of variation of RR (CVrr), and the coefficient of variation of dRR (CVdrr) are observed as -11.0000, 0.0443, and 0.0315, respectively.
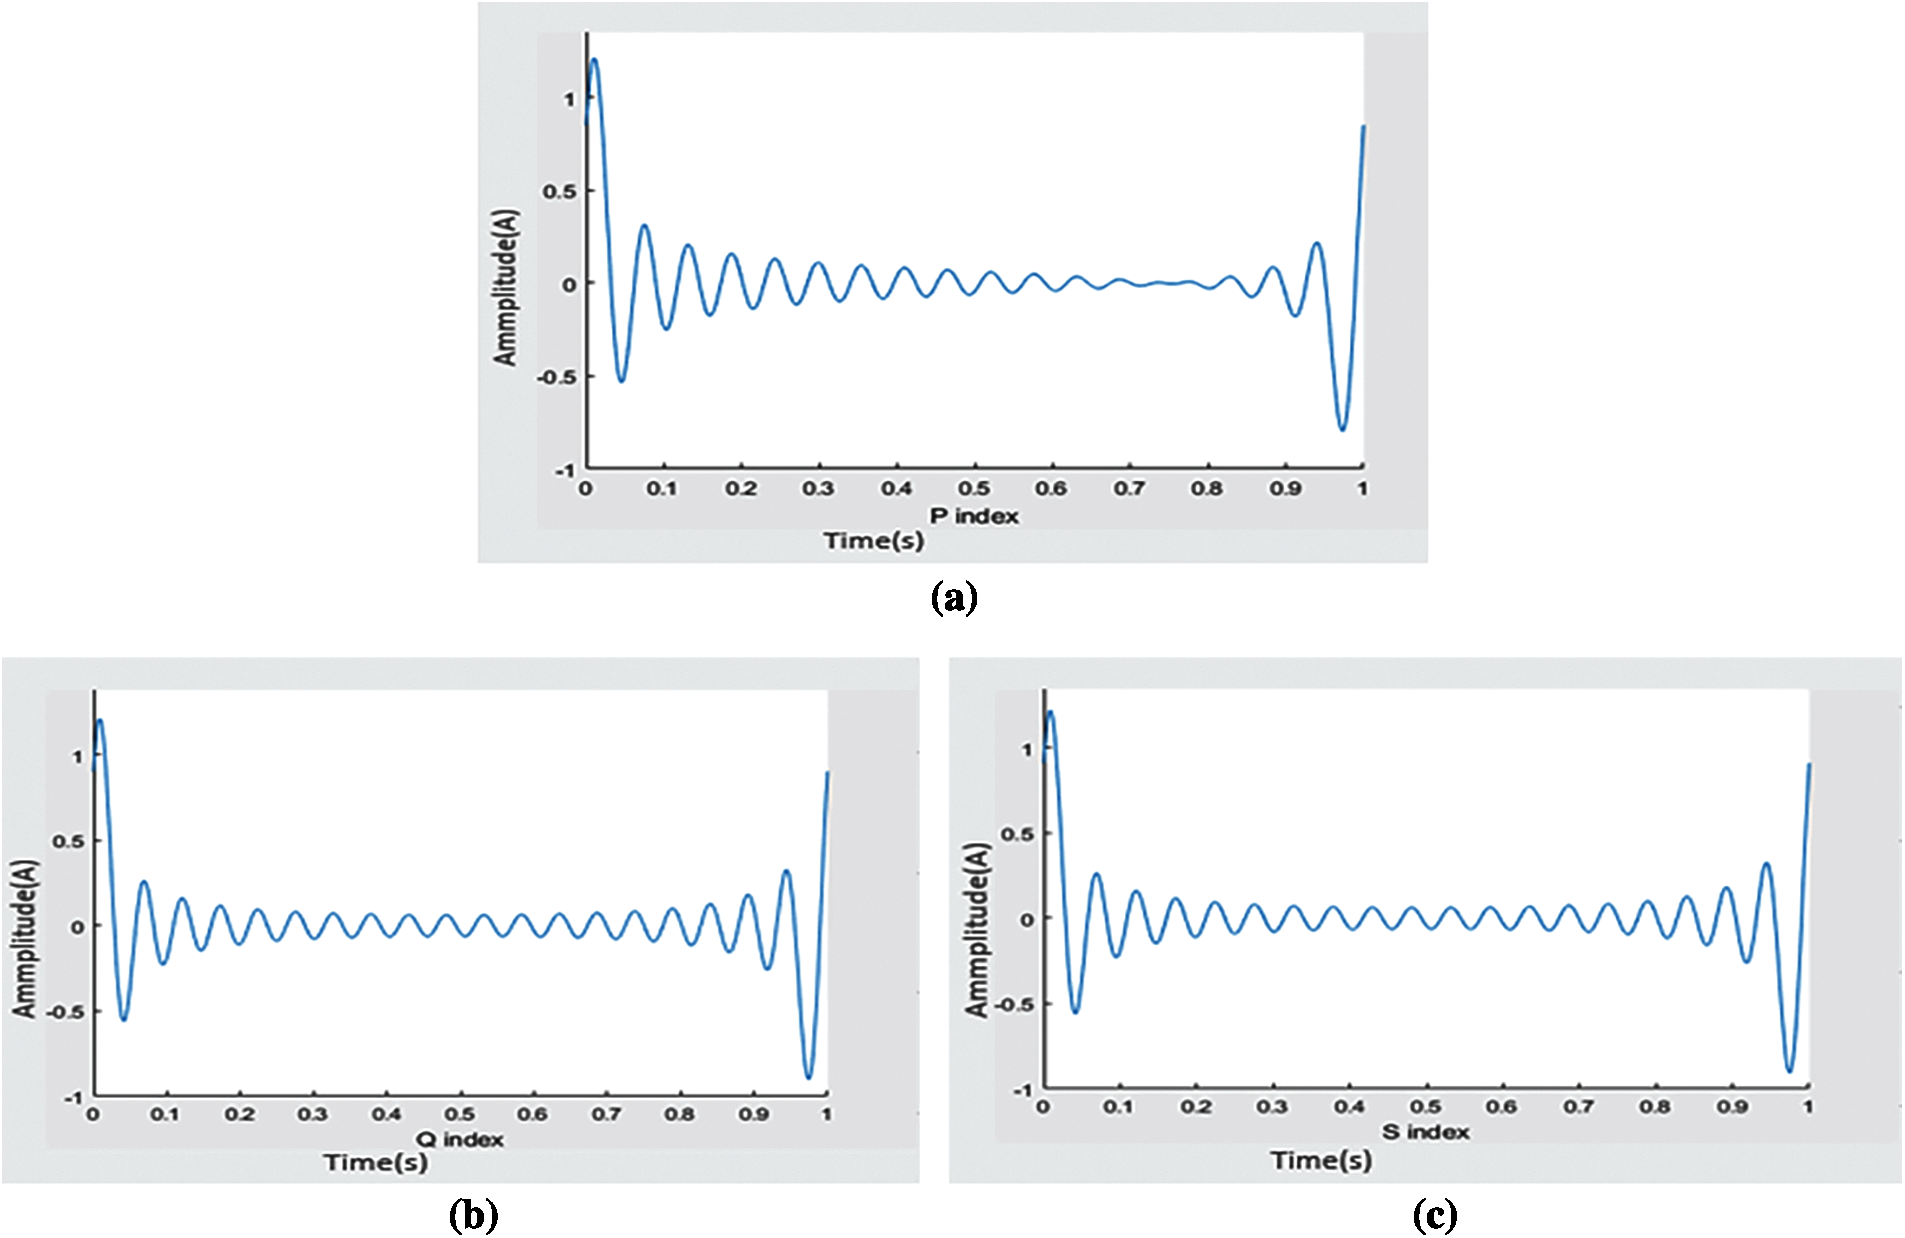
Figure 4: ECG index: (a) P wave index, (b) Q wave index, (c) S wave index
These statistical measurements also help us in the classification of noisy categories and all other categories. Through these extracted features, we can locate the position of the ECG wave, we can detect the location where the P wave does not exist, or we can say that P is zero as expressed in Fig. 7 to detect a specific category. In order to detect the regular and irregular flow of ECG waves, we need to extract the PP and RR indexes so that the system can accurately make decisions on noise and noisy categories. This can be achieved by using the PP and RR index features interpreted in Fig. 8. It will help the system understand how the duration between R streams exists and how its frequency and other data streams change before and after R. All the features extracted in the experiment use MIC and mRMR technology to help us extract the most relevant features without any redundancy. Figs. 6, 7 and 8 show the statistical measures of ECG streams, which are of great significance when classifying ECG because they extract these features to predict the skewness and kurtosis and most other relevant and basic features. We train our model to produce better results with more enormous features.
Experiments are performed with the training data and the verification data given by the challenge to check the verification of the system. By using the formula, we have F1n = 0.9764 on the test data and a score of 0.99 on the training data. In addition, the overall accuracy of F1 is 0.9613. We score F1a = 0.9592, which ranks higher compared to other technologies. Our proposed work score of F1o = 0.9482. The classification accuracy of our proposed work on noise segment is F1p = 0.8571. The confusion matrix of the training set and the validation set are shown in Fig. 9. The highlighted cells (in the Normal, AF, Other, Noisy) row and column represent data that our classifier has correctly predicted.
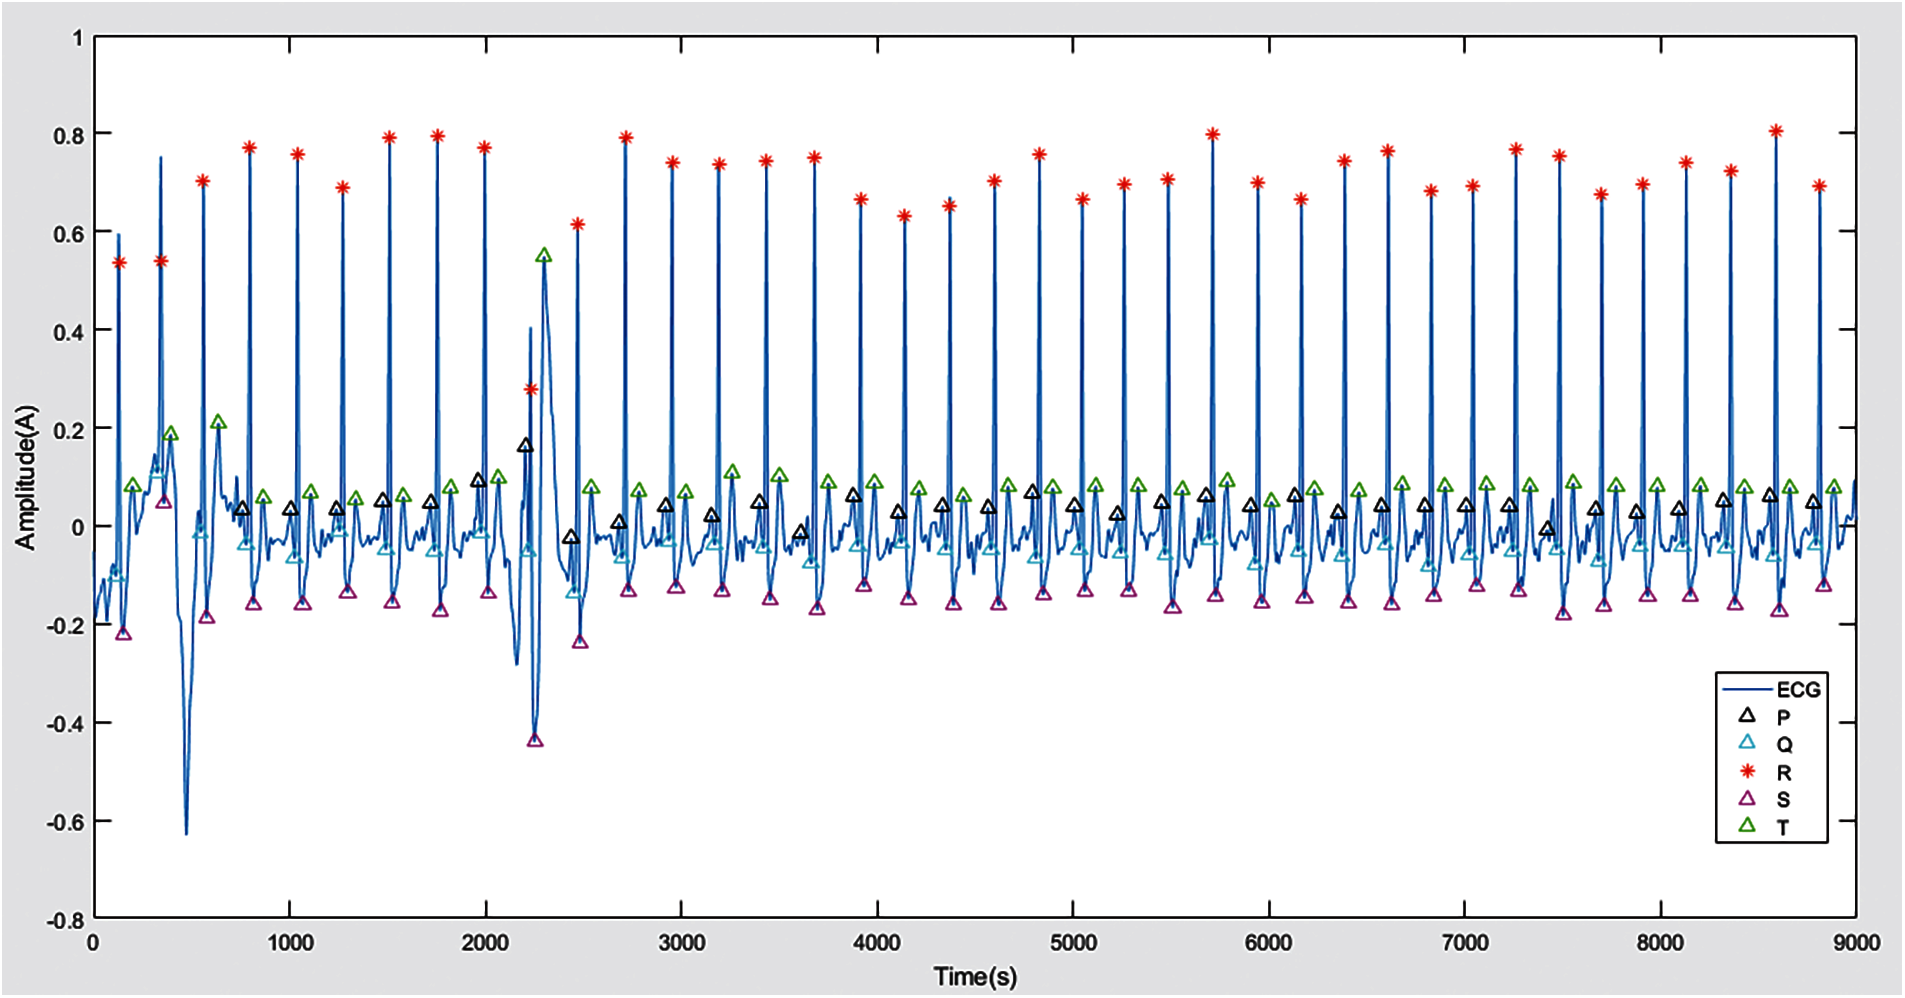
Figure 5: P, Q, R, S and T waves
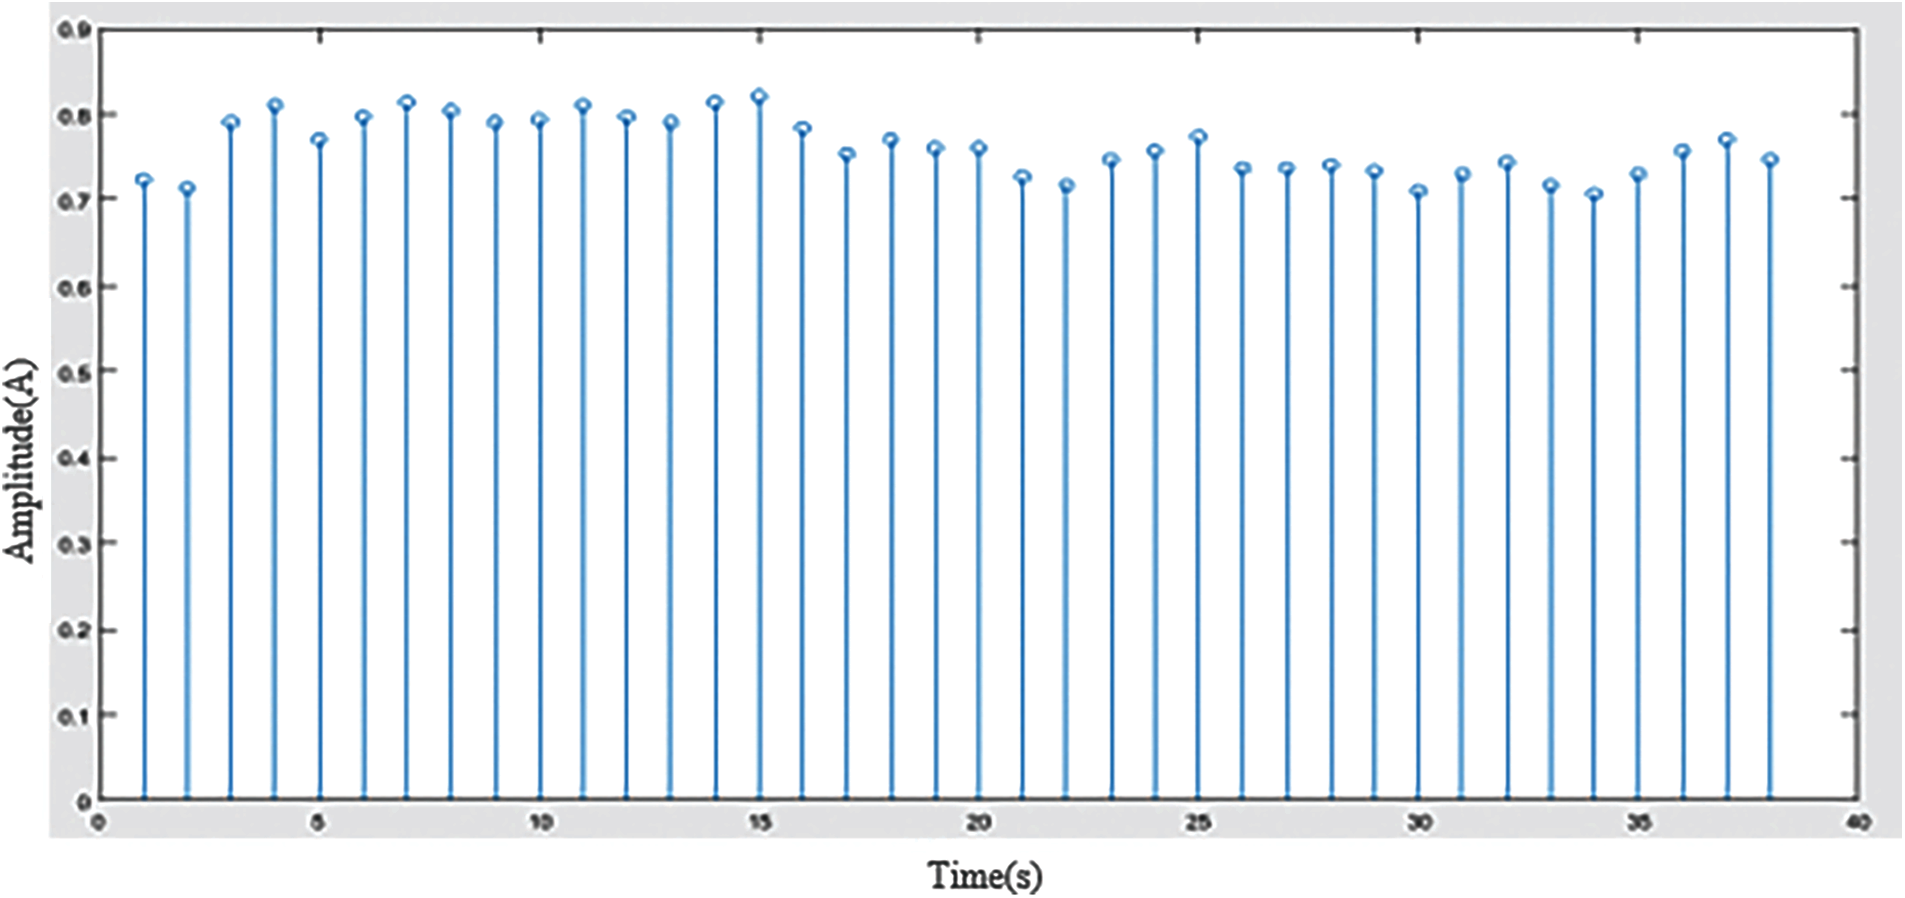
Figure 6: RR Interval
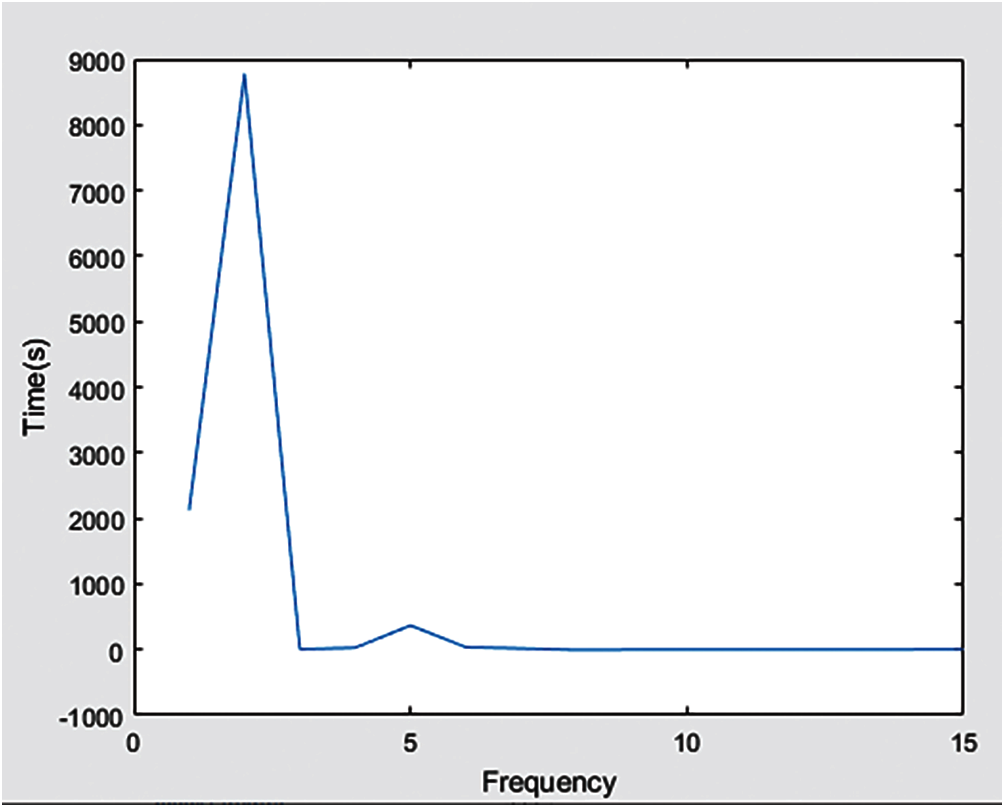
Figure 7: Zero position of P wave
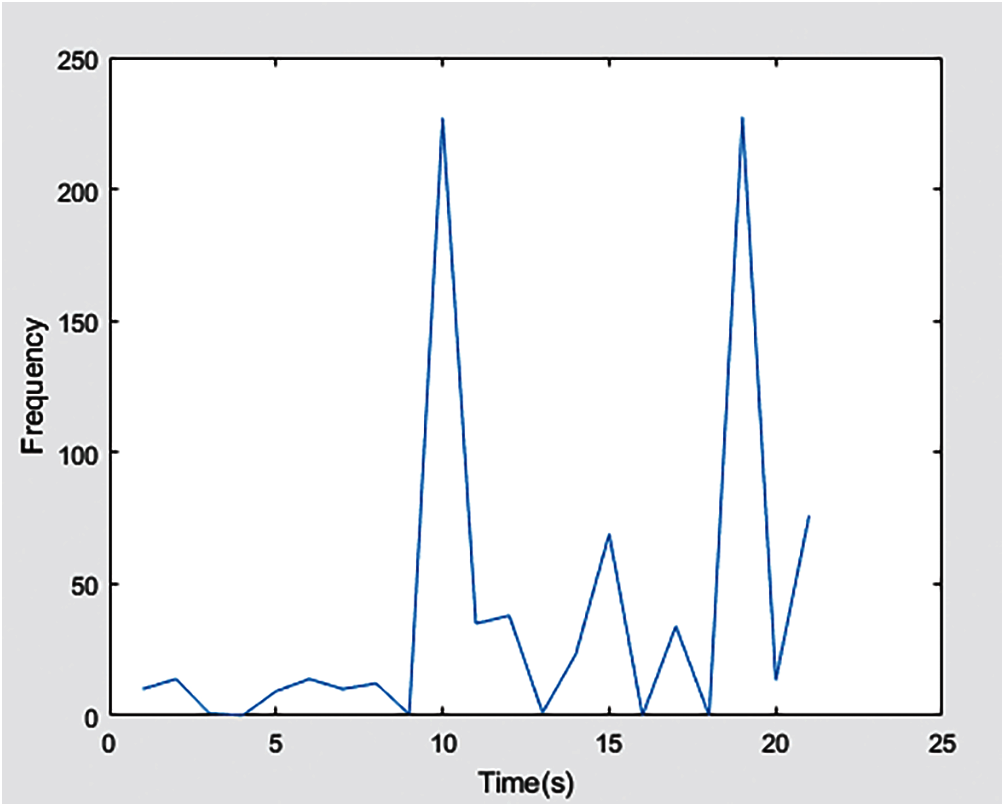
Figure 8: PP and RR index
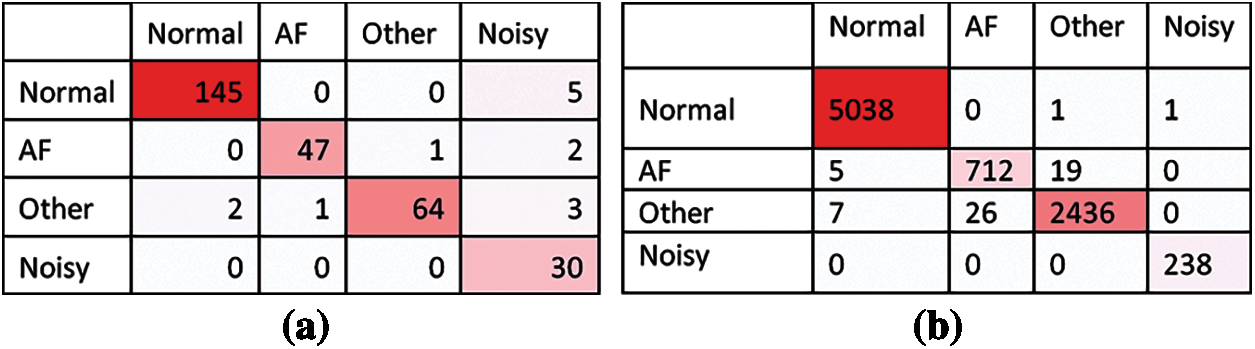
Figure 9: Confusion matrix obtained on validation and training sets (a) Validation set (b) Training set
Fig. 10 shows the comparison between the proposed technique and other techniques in terms of classification accuracy of F1n, F1a, F1o, and F1p results. We observe that our technique is superior to other techniques because the classification accuracy of F1n, F1a, F1o, and F1p is higher. This is because our method uses SOS filters to remove noise from ECG signals and extract many features, including morphology, statistics, HRV, AF, noise, and other rhythm-related features. This provides evidence for our framework to clean up the signals in the ECG structure that are more likely to be wavelets, carefully detect all waves present in the ECG, and extract classification features that do not have any redundancy. It turns out that our framework ranks higher compared to other technologies, and it also shows that our multi-layer model for binary classification provides better results compared to the single-layer model. Most of the top-ranked techniques (see Fig. 10) are considered for this comparison. The simulation results prove that our proposed work ranks high in the classification of all categories.
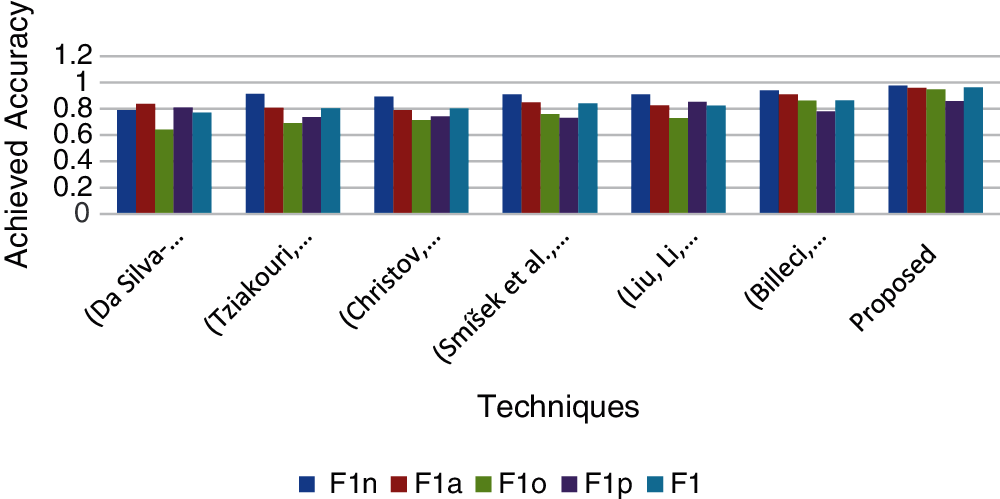
Figure 10: Archived accuracy of the proposed technique compared with different techniques
Heart disease is a very common health disorder in every society, and its diagnosis or testing plays an important role in saving the lives of millions of people around the world. Atrial fibrillation is one of the most important cardiovascular diseases and has received great attention from computer science and engineering disciplines to automatically detect it with the help of different algorithms. However, this is a challenging problem due to identification issues and low accuracy. In this paper, we proposed an effective method to extract the most relevant and novel features from the medical data of binary ECG signal. These features are morphological, state-of-the-art AF, time domain and HRV features, including SDSN and SDSDS. The other features extracted are the statistical features of the RR interval, the features from the frequency domain, and the features from the probability density estimation of delta (RR) and RR. These derived features are then selected through cascaded feature selection to classify the ECG signals of the normal, AF, other, or noise categories that form the specific instance of the data set. Extensive experiments have been conducted with publicly available ECG waveform data sets. Compared with the previous literature, the classification accuracy of the proposed technique shows improved results in all categories including F1n, F1a, F1o, and F1p. This work will also provide strong support to the sensor-based healthcare industry, which will focus on continuous patient monitoring systems in the future. This work can also be extended to the identification and classification of many other heart diseases, especially the irregular streams associated with non-AF arrhythmias.
Acknowledgement: The authors extend their appreciation to the Deanship of Scientific Research at King Saud University for funding this work through research group No (RG- 1441-425).
Funding Statement: This work was supported by the Deanship of Scientific Research at King Saud University through research group No (RG- 1441-425).
Conflicts of Interest: The authors declare that they have no conflicts of interest to report regarding the present study.
1. E. E. Coppola, P. K. Gyawali, N. Vanjara, D. Giaime and L. Wang, “Atrial fibrillation classification from a short single lead ECG recording using hierarchical classifier,” in Proc. Computing in Cardiology, Rennes, France, pp. 1–4, 2017. [Google Scholar]
2. J. Campos, J. Sundnes, R. Dos Santos and B. Rocha, “Uncertainty quantification and sensitivity analysis of left ventricular function during the full cardiac cycle,” Philosophical Transactions of the Royal Society, vol. 378, no. 2173, pp. 20190381, 2020. [Google Scholar]
3. H. Li and P. Boulanger, “A survey of heart anomaly detection using ambulatory electrocardiogram (ECG),” Sensors, vol. 20, no. 5, pp. 1461, 2020. [Google Scholar]
4. R. V. Andreao, B. Dorizzi and J. Boudy, “ECG signal analysis through hidden markov models,” IEEE Transactions on Biomedical Engineering, vol. 53, no. 8, pp. 1541–1549, 2006. [Google Scholar]
5. M. Mitra and R. Samanta, “Cardiac arrhythmia classification using neural networks with selected features,” Procedia Technology, vol. 10, no. 4, pp. 76–84, 2013. [Google Scholar]
6. P. Schwab, G. Scebba, J. Zhang, M. Delai and W. Karlen, “Beat by beat: classifying cardiac arrhythmias with recurrent neural networks,” in Proc. Computing in Cardiology, Rennes, France, pp. 1–4, 2017. [Google Scholar]
7. L. S. Johnson, A. P. Persson, P. Wollmer, S. Juul-Möller, T. Juhlin et al., “Irregularity and lack of p waves in short tachycardia episodes predict atrial fibrillation and ischemic stroke,” Heart Rhythm, vol. 15, no. 6, pp. 805–811, 2018. [Google Scholar]
8. G. D. Clifford, C. Liu, B. Moody, H. L. Li-wei, I. Silva et al., “AF classification from a short single lead ECG recording: the physionet computing in cardiology challenge 2017,” in Proc. Computing in Cardiology, Rennes, France, pp. 1–4, 2017. [Google Scholar]
9. B. R. Boveja and A. Widhany, “Methods and system for atrial fibrillation ablation using a fluoroscopy and/or medical images based cardiac mapping system with optional esophageal temperature monitoring,” U.S. Patent US-9918, vol. 792, pp. 1–40, 2018. [Google Scholar]
10. W. Ahmed and S. Khalid, “ECG signal processing for recognition of cardiovascular diseases: a survey,” in Proc. Institute for New Technologies, Dublin, Ireland, pp. 677–682, 2016. [Google Scholar]
11. U. R. Acharya, H. Fujita, M. Adam, O. S. Lih, V. K. Sudarshan et al., “Automated characterization and classification of coronary artery disease and myocardial infarction by decomposition of ECG signals: A comparative study,” Information Sciences, vol. 377, no. 3, pp. 17–29, 2017. [Google Scholar]
12. S. Ladavich and B. Ghoraani, “Rate-independent detection of atrial fibrillation by statistical modeling of atrial activity,” Biomedical Signal Processing and Control, vol. 18, no. 4, pp. 274–281, 2015. [Google Scholar]
13. M. Bahaz and R. Benzid, “Efficient algorithm for baseline wander and powerline noise removal from ECG signals based on discrete Fourier series,” Australasian Physical & Engineering Sciences in Medicine, vol. 41, no. 1, pp. 143–160, 2018. [Google Scholar]
14. A. Goldberger, L. Amaral, L. Glass, J. Hausdorff, P. C. Ivanov et al., “Physiobank, physioToolkit, and physioNet: Components of a new research resource for complex physiologic signals,” Circulation, vol. 101, no. 23, pp. e215–e220, 2000. [Google Scholar]
15. C. Venkatesan, P. Karthigaikumar and R. Varatharajan, “FPGA implementation of modified error normalized LMS adaptive filter for ECG noise removal,” Cluster Computing, vol. 22, no. 5, pp. 12233–12241, 2019. [Google Scholar]
16. J. Lee, J. Kim and M. Shin, “Correlation analysis between electr ocardiography (ECG) and photoplethysmogram (PPG) data for driver's drowsiness detection using noise replacement method,” Procedia Computer Science, vol. 116, no. 14, pp. 421–426, 2017. [Google Scholar]
17. Z. Xiong, M. K. Stiles and J. Zhao, “Robust ECG signal classification for detection of atrial fibrillation using a novel neural network,” in Proc. Computing in Cardiology, Rennes, France, pp. 1–4, 2017. [Google Scholar]
18. B. Chandra, C. S. Sastry, S. Jana and S. Patidar, “Atrial fibrillation detection using convolutional neural networks,” in Proc. Computing in Cardiology, Rennes, France, pp. 1–4, 2017. [Google Scholar]
19. K. Stępień and I. Grzegorczyk, “Classification of ECG recordings with neural networks based on specific morphological features and regularity of the signal,” in Proc. Computing in Cardiology, Rennes, France, pp. 1–4, 2017. [Google Scholar]
20. J. Gierałtowski, K. Ciuchciński, I. Grzegorczyk, K. Kośna, M. Soliński et al., “RS slope detection algorithm for extraction of heart rate from noisy, multimodal recordings,” Physiological Measurement, vol. 36, no. 8, pp. 1743, 2015. [Google Scholar]
21. F. Plesinger, P. Nejedly, I. Viscor, J. Halamek and P. Jurak, “Automatic detection of atrial fibrillation and other arrhythmias in holter ECG recordings using rhythm features and neural networks,” in Proc. Computing in Cardiology, Rennes, France, pp. 1–4, 2017. [Google Scholar]
22. D. Smoleń, “Atrial fibrillation detection using boosting and stacking ensemble,” in Proc. Computing in Cardiology, Rennes, France, pp. 1–4, 2017. [Google Scholar]
23. L. Billeci, F. Chiarugi, M. Costi, D. Lombardi and M. Varanini, “Detection of AF and other rhythms using RR variability and ECG spectral measures,” in Proc. Computing in Cardiology, Rennes, France, pp. 1–4, 2017. [Google Scholar]
24. R. Smíšek, J. Hejč, M. Ronzhina, A. Němcová, L. Maršánová et al., “SVM based ECG classification using rhythm and morphology features, cluster analysis and multilevel noise estimation,” in Proc. Computing in Cardiology, Rennes, France, pp. 1–4, 2017. [Google Scholar]
25. S. Ghiasi, M. Abdollahpur, N. Madani, K. Kiani and A. Ghaffari, “Atrial fibrillation detection using feature based algorithm and deep convolutional neural network,” in Proc. Computing in Cardiology, Rennes, France, pp. 1–4, 2017. [Google Scholar]
26. C. Venkatesan, P. Karthigaikumar, A. Paul, S. Satheeskumaran and R. Kumar, “ECG signal preprocessing and SVM classifier-based abnormality detection in remote healthcare applications,” IEEE Access, vol. 6, pp. 9767–9773, 2018. [Google Scholar]
27. J. Rubin, S. Parvaneh, A. Rahman, B. Conroy and S. Babaeizadeh, “Densely connected convolutional networks and signal quality analysis to detect atrial fibrillation using short single-lead ECG recordings,” in Proc. Computing in Cardiology, Rennes, France, pp. 1–4, 2017. [Google Scholar]
28. M. Tziakouri, C. Pitris and C. Orphanidou, “Classification of AF and other arrhythmias from a short segment of ECG using dynamic time warping,” in Proc. Computing in Cardiology, Rennes, France, pp. 1–4, 2017. [Google Scholar]
29. M. Kropf, D. Hayn and G. Schreier, “ECG classification based on time and frequency domain features using random forests,” in Proc. Computing in Cardiology, Rennes, France, pp. 1–4, 2017. [Google Scholar]
30. P. Bonizzi, K. Driessens and J. Karel, “Detection of atrial fibrillation episodes from short single lead recordings by means of ensemble learning,” in Proc. Computing in Cardiology, Rennes, France, pp. 1–4, 2017. [Google Scholar]
31. Y. Liu, K. Wang, Q. Li, R. He, Y. Xia et al., “Diagnosis of AF based on time and frequency features by using a hierarchical classifier,” in Proc. Computing in Cardiology, Rennes, France, pp. 1–4, 2017. [Google Scholar]
32. V. Gliner and Y. Yaniv, “Identification of features for machine learning analysis for automatic arrhythmogenic event classification,” in Proc. Computing in Cardiology, Rennes, France, pp. 1–4, 2017. [Google Scholar]
33. I. Christov, V. Krasteva, I. Simova, T. Neycheva and R. Schmid, “Multi-parametric analysis for atrial fibrillation classification in ECG,” in Proc. Computing in Cardiology, Rennes, France, pp. 1–4, 2017. [Google Scholar]
34. A. Nguyen, S. Ansari, M. Hooshmand, K. Lin, H. Ghanbari et al., “Comparative study on heart rate variability analysis for atrial fibrillation detection in short single-lead ECG recordings,” in Proc. Engineering in Medicine and Biology Society, Honolulu, HI, USA, pp. 526–529, 2018. [Google Scholar]
35. S. Datta, C. Puri, A. Mukherjee, R. Banerjee, A. D. Choudhury et al., “Identifying normal, AF and other abnormal ECG rhythms using a cascaded binary classifier,” in Proc. Computing in Cardiology, Rennes, France, pp. 1–4, 2017. [Google Scholar]
36. J. Park, S. Lee and M. Jeon, “Atrial fibrillation detection by heart rate variability in poincare plot,” Biomedical Engineering Online, vol. 8, no. 1, pp. 1–12, 2009. [Google Scholar]
37. R. Banerjee, R. Vempada, K. Mandana, A. D. Choudhury and A. Pal, “Identifying coronary artery disease from photoplethysmogram,” in Proc. Ubiquitous Computing, Heidelberg, Germany, pp. 1084–1088, 2016. [Google Scholar]
 | This work is licensed under a Creative Commons Attribution 4.0 International License, which permits unrestricted use, distribution, and reproduction in any medium, provided the original work is properly cited. |