DOI:10.32604/cmc.2022.023073
| Computers, Materials & Continua DOI:10.32604/cmc.2022.023073 | |
| Article |
VANET Jamming and Adversarial Attack Defense for Autonomous Vehicle Safety
1Department of Vehicle Convergence Engineering, Yonsei University, Seoul, 03722, Korea
2School of Electrical & Electronic Engineering, Yonsei University, Seoul, 03722, Korea
*Corresponding Author: Jong-Moon Chung. Email: jmc@yonsei.ac.kr
Received: 27 August 2021; Accepted: 13 October 2021
Abstract: The development of Vehicular Ad-hoc Network (VANET) technology is helping Intelligent Transportation System (ITS) services to become a reality. Vehicles can use VANETs to communicate safety messages on the road (while driving) and can inform their location and share road condition information in real-time. However, intentional and unintentional (e.g., packet/frame collision) wireless signal jamming can occur, which will degrade the quality of communication over the channel, preventing the reception of safety messages, and thereby posing a safety hazard to the vehicle's passengers. In this paper, VANET jamming detection applying Support Vector Machine (SVM) machine learning technology is used to classify jamming and non-jamming situations. The analysis is based on two cases which include normal traffic and heavy traffic conditions, where the results show that the probability of packet dropping will increase when many vehicles are using the wireless channel simultaneously. When using SVM classification, the most appropriate feature set applied in determining a jamming situation shows an accuracy of 98% or higher. Furthermore, more advanced jamming attacks need to be considered for preparation of more reliable and safer autonomous ITS services. Such research can use vehicular communication transmission and reception data based on selected published datasets. In this paper, an additional adversarial defense algorithm using the Density-Based Spatial Clustering of Applications with Noise (DBSCAN) method is proposed, which assumes that evolutionary attacks of the jammer will attempt to confuse the trained classifier. The simulation results show that applying DBSCAN can improve the accuracy by elimination of outliers before conducting classification testing.
Keywords: Vehicle safety; VANET; jamming; SVM; adversarial defense
Recently, the development of self-driving and connected cars has led to the establishment of an Intelligent Transportation System (ITS) by connecting vehicles to the road infrastructure (V2I) (e.g., road-side units (RSUs) and cellular base stations), vehicles to vehicles (V2V), and vehicles to pedestrians (V2P), which form the overall description of vehicle to everything (V2X) networks [1]. In addition, vehicular safety techniques are being developed to reduce the risk of road hazards, collisions, and accidents. The main goal of ITS is to make vehicles safer, faster, and more convenient to ride and drive. Vehicular ad-hoc network (VANET) technology is the basis for ITS. It was introduced in 2001 under vehicular ad-hoc mobile communication applications to provide road safety and roadside services [2]. VANET applications include automatic toll systems, safety warning, platooning, and traffic information system support. In particular, vehicles performing time sensitive VANET applications for safety warning and driving guidance exchange urgent data to other vehicles and RSUs in a cooperative manner [3]. This requires a VANET network with minimum data transmission delay and maximum reliability.
In these VANET scenarios, intentional and unintentional (e.g., packet/frame collision) wireless signal jamming can occur. Intentional jamming attacks can seriously reduce the quality of the V2X communication performance [4]. Jamming can cause the vehicle to suddenly stop or experience traffic jams due to traffic congestion. In addition, advanced jammers can attack as much as desired without detection as new undetectable attack patterns are developed. Therefore, much research on jamming detection has been conducted.
However, mathematical estimation based on the correlation of representative communication parameters used in existing research has limitations. It is necessary to first identify the characteristics of various parameters in jamming situations and derive a parameter set that can obtain high detection accuracy. Therefore, in this paper, jamming detection is performed based on machine learning and the optimal communication parameter set is investigated. In addition, a detection algorithm against adversarial attacks is developed based on the assumption that the jammers continue to attempt evolved attacks. Before the detection test phase, a data pre-processing method is added to remove the data that makes classification difficult, based on the reason that the data points are located too close to the trained classifier or the noise which is far away.
The sections of this paper are organized as follows. Details on VANET and jamming signals are provided in Section 2. Jamming detection using Support Vector Machine (SVM) technology is introduced in Section 3 along with corresponding experiment results. In Section 4, the proposed adversarial defense scheme that uses data sanitization to adapt to evolving attack patterns of the jammer is presented. Finally, the paper is concluded in Section 5.
In support of V2I vehicle communications, the On-board Unit (OBU) and RSU communicate with each other, where the OBU is attached to the vehicle and the RSU is like a smart traffic light that can communicate with the vehicle. For road safety, all vehicles and base stations periodically send Basic Safety Messages (BSMs) at an average of 10 messages per second. BSMs include the vehicle's location and incident information. Therefore, it is important to prevent the loss of the BSMs by reducing packet drops below the threshold level.
Jamming refers to a situation that an attacker intentionally sends a sequence of messages or signals to make vehicles unable to use the wireless channel [5]. Or it makes the OBUs increase their transmission power so that other vehicles do not receive safety messages from other vehicles. The Signal to Noise Ratio (SNR) equation
Jammer attack types can be categorized according to mobility and behavior [4]. Jamming mobility can be modeled as motionless (Stationary mobility), moving closer to a specific target vehicle (Target mobility), or moving around emitting a jamming signal without any target (Random mobility). In addition, the attack behavior can be divided into 3 patterns: Constant, Random, and Reactive. Constant behavior continuously transmits jamming signals, interfering with the channel access of regular vehicles by increasing the packet drop rate. The random pattern is when jammers randomly alternate between sleep mode and active mode to reduce their energy consumption and confuse the antijamming counter measure detection systems. Finally, a reactive pattern jammer senses a particular channel and attempts to attack only when a packet is transmitted.
In recent research on VANETs, to improve the performance and provide adaptability, machine learning and deep learning optimization techniques have been applied to existing mathematical schemes. For example, for fast mobility and low energy consumption of vehicles, the authors of [7] develop a routing protocol based on reinforcement learning. Vehicles are clusted within the range of a RSU or a base station, and an optimal header node is selected for data collection and processing. Reinforcement learning adjusts the transmit power of each vehicle and continously motnitors the signal strength against the noise level.
Related to the topic of this paper, the studies that focus on enhancing the jamming detection accuracy and avoidance techniques in VANETs are as follows.
The authors of [8–10] propose a mathematical physical layer control scheme. The authors of [8] propose a new model based on the correlation among the error and the correct reception times to detect a jamming attack. The authors of [9] implement different jamming scenarios and evaluate jamming detection schemes, but only focus on RSU-OBUs based V2I communications. In addition, [10] focuses on the Bit Error Rate (BER) as the detection parameter. If the BER increases in time, the proposed scheme assumes that the nodes are moving towards a jamming area or adversary, then a plausibility check is done to check whether switching the frequency of communication is safe or not.
The authors of [4] study jamming behaviors and effectiveness by focusing on 3 parameters, which are the Received Signal Strength (RSS), Packet Delivery Ratio (PDR), and Packet Send Ratio (PSR). The proposed scheme calculates the communication parameters based on the assumption that a jammer signal does not exist at initialization, and attempts to determine when jamming occurs. However, in real vehicular environments, every car generates lots of messages and such jammer-less initialization situations will not commonly occur in dense urban areas.
Research in [11] implements a VANET intrusion detection application called the accurate and lightweight intrusion detection framework for vehicular networks (abbreviated as ‘AECFV’). In this scheme, after clustering the vehicles, the individual detection algorithms for cluster heads, cluster members, and RSUs are conducted. In particular, at the cluster head level, anomaly detection and rule-based detection using SVM is performed considering 4 measurable parameters, which are the PSR, PDR, Message Duplication Ratio (MDR), and the Signal Strength Intensity (SSI). In use of the MDR, each cluster head is required to share its information with the RSU and needs other cluster members to perfrom their own periodic SVM training. Therefore, the RSU, cluster heads, and members in the VANET all need to have the AECFV application installed in order to conduct their required functions. As a result, the network overhead will significantly increase as the number of vehicles increases, caused by an increase in the number of messages they exchange in order to share control information. Unlike AECFV of [11], the scheme proposed in this paper only needs to be installed in the RSU. The parameters necessary for testing can be obtained periodically, and the presence of the jammer can be chekced at a RSU's fixed position.
The authors of [12] propose a jamming detection scheme that can be used to protect vehicle platoon applications. The purpose of jamming detection is to ensure that vehicles are not disturbed by a jammer by sending control messages to maintain the inter vehicle spacing. But, the detection algorithm only considers a constant jammer and the detection parameters used are the time delay between beacon messages and BER.
In [13], a scheme that uses density-based spatial clustering of applications with noise (DBSCAN) and SVM to detect anomaly events using unsupervised learning in Wireless Sensor Network (WSN) is proposed. DBSCAN is used to label the sensor data based on clustering and then trains the system through SVM. Among the eight parameters used for training, the most important parameters for detection are temperature, humidity, and voltage. The results of [13] show that the propsoed scheme can effectively detect anomalies and recursively find the optimal DBSCAN parameter until the coefficient correlation (CC) value is minimized.
Recently, the influence of jamming on Unmanned Aerial Vehicles (UAVs) networks has been studied in [14], where the authors propose a protocol-aware jammer avoidance scheme and implement a remote control system. Based on the communication indicator Jam to Signal Ratio (JSR), jamming signals with the characteristics of one, sweep, and protocol-aware are compared and analyzed based on the power required to successfully interfere with the network.
The research of [15] proposes an UAV jamming detection scheme based on federated deep learning, where multiple clients and one central server collaborate, and a jamming detection module is integrated into the client UAV. In [15], the Received Signal Strength Indicator (RSSI) and PDR are used as training parameters to improve the learning performance, where a new client group prioritization method is introduced.
In this paper, the jamming signal is detected using various communication parameters and a SVM machine learning detection system. The proposed scheme uses a sanitization algorithm that eliminates test points that are too far away (e.g., noise factors) or test points that are too close to the SVM decision region, where its performance is compared to related antijamming schemes.
3 Jamming Detection and Analysis
In this section, a jamming detection method that uses SVM machine learning technology is proposed. Experiments are divided into two cases, where Case 1 has about 10 vehicles and 1 RSU, and Case 2 has more than 80 vehicles and 1 RSU. To increase the accuracy performance, the optimal feature sets and the kernel that can determine the jamming situation are searched.
3.1 Support Vector Machine (SVM)
SVM is a supervised machine learning algorithm which decides the boundary located midway between the training data classes [16]. The linear discriminate is determined so that each class has a maximum margin. This margin is described as the vertical distance between the possible linear discriminator and the nearest points in either class. The data in either class which defines the maximum margin are referred to the support vectors that are presented in Fig. 1, in which z represents the training data points. The data points can be separated by a linear discriminator H, and w is a normal vector perpendicular to the decision region, where the relation can be expressed as
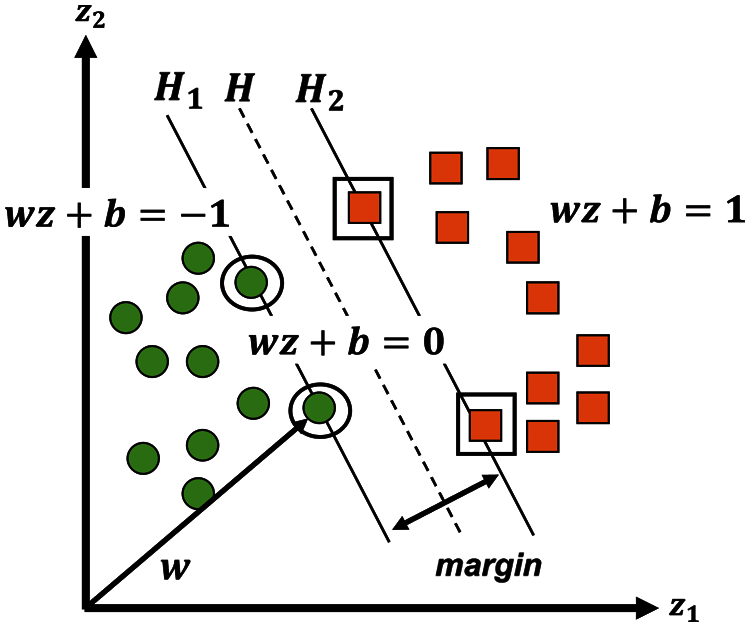
Figure 1: Illustration of the SVM classification process
In the case of this paper, an experiment was conducted based on (up to) 6 parameters (which is same as the 6 dimensions of the detection space) and SVM is used to separate the pattens in the hyperplane and make the detection process less sensitive to the number of points in each class [17]. In addition, the kernel funcitons linear, rbf, and polynomial were customized to enhance the accuracy of the detection. SVM was used in this paper because it is easier to control and tune compared to neural networks, and the classification performance is sufficiently good while the degree of over-fitting can be kept sufficiently low [18].
The dataset used in this paper is the Dedicated Short Range Communication (DSRC) Vehicle Communications Dataset of [19] which is a freely distributed open-source dataset. This set includes data based on measurements of the wireless V2I and V2V communication. According to the Society of Automotive Engineers (SAE) Standard, DSRC sends 10 BSMs per second, which are 500 Byte User Datagram Protocol (UDP) packets [20]. Measurement situations are based on a reactive jammer with 3 mixed mobility patterns (as described in Section 2.3) where the jammers only attack the control channel (Ch. 127) which is one of the most important channels since safety messages are exchanged through it. Two separate datasets were used, which are the normal scenario (i.e., non-jamming scenario) and the scenario that jamming attackers exist (i.e., jamming scenario), thus each becomes a dataset which is labeled 0 and 1, respectively. In addition, a total of 1250 datasets are used and tested separately according to the vehicle traffic patterns.
There are 6 main attributes of information on V2V car-to-car communication, which include the transmitted node's ID number (Txnid), received node's ID number (Rxnid), RSS (in dBm units), BER, RSSI, and SNR. The designed SVM scheme uses RSS and SNR as machine learning parameters in addition to PSR and PDR, which are monitored over the V2I RSU-to-vehicle communication. Further details of the parameters are provided below.
Tab. 1 describes the parameters to be used as the features of the SVM scheme. In studies [11] and [15], PDR and PSR values are calculated at each vehicle and there is a process of collecting data at the center vehicle and updating it. In this paper, each BSM includes the measured RSS and SNR values in every time message delivered, which is recorded in a log. In addition, information on
RSS: The S measures the surrounding power of the receiver. If there is a jammer or traffic is congested because there are many vehicles, the signal strength could be high. Let
SNR: The
PDR: The Packet Delivery Ratio indicates the percentage of the correctly delivered packets, which is measured at the transmitter end.
PSR: The Packet Send Ratio is the ratio of packets that are successfully sent out by a legitimate source compared to the number of packets that are intended to be sent out.
PDSR: The Packet Delivery to Send Ratio is calculated by the RSU. PDSR is a parameter added to consider both the PSR and PDR, although CAR-PDSR and RSU-PDSR are not included in the existing dataset [6].

The proposed SVM scheme classifies jamming and non-jamming situations to determine the decision region and appropriate parameter/kernel set. For feature selection, the process of finding the highest jamming detection accuracy among the 4 feature sets are conducted. S and
1) Split the Dataset, Train:Test = 8:2
2) Feature Selection
a) {
b) {
c) {
d) {
3) Kernel Selection
a) Linear Kernel
b) rbf Kernel
c) Polynomial Kernel (degree 2 or 3)
4) Train using the SVM model
5) Classify the test dataset and analyze the results.
To find the optimal feature set, an analysis on the accuracy of distinguishing the jamming situations based on the features was conducted. Fig. 2 shows the correlation between the feature pairs and how the SVM decision boundary is drawn. First, RSS and SNR are significant factors that can easily determine the jamming situation as shown in Fig. 2a. However, if there are many vehicles, the RSS increases and the SNR becomes small, and more similar to the jamming cases, so other features should be referred to. In the case of Figs. 2b and 2c, PDR and PSR (which are measured by the RSU) are used as features, and the jamming situations are generally distinguished while allowing some errors. However, Figs. 2d and 2e show that most of the PSR values are high even in jamming situations, so the start of message transmission is successful, but as the PDR level degrades, it is more difficult to deliver the message to the receiver. In addition, in both cases, the normal and jamming situations are not clearly dividable using a hard margin, so it is difficult to use this technique alone. As shown in Fig. 2f, when only using the PDR value calculated from the RSU and vehicle, it is very difficult to distinguish the signal groups and make an accurate detection decision.
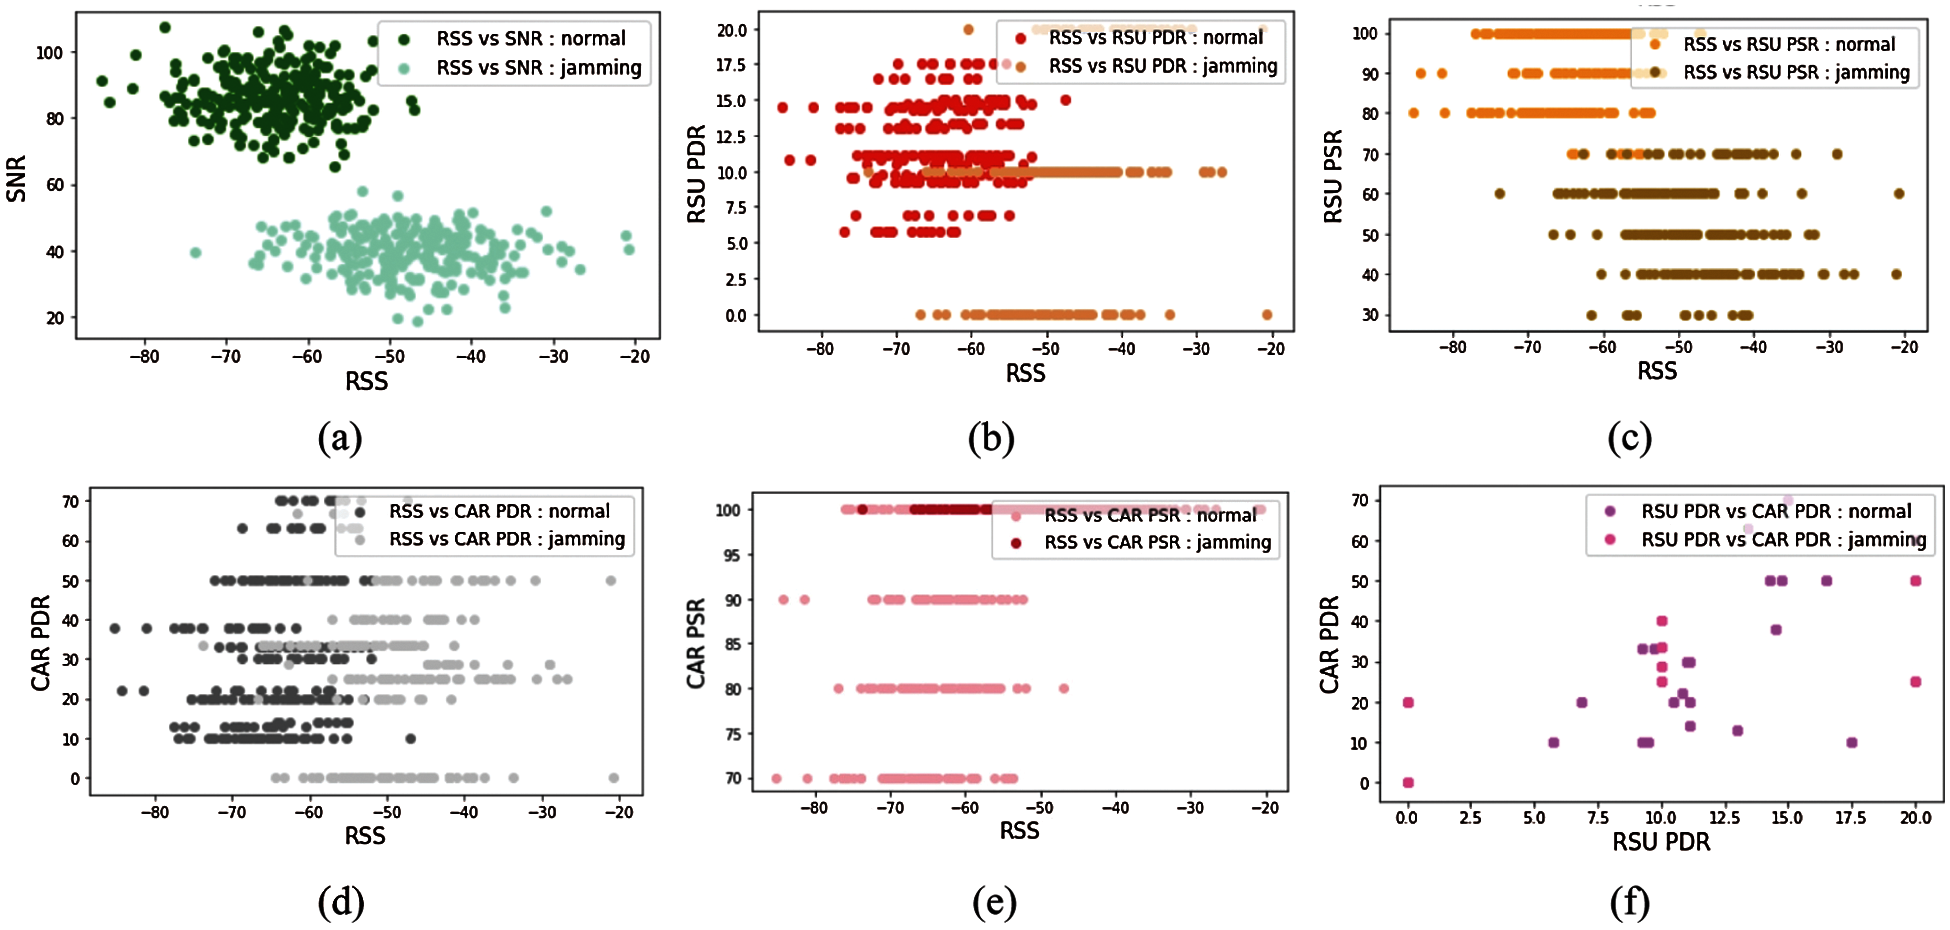
Figure 2: Correlation between features. (a) RSS vs. SNR, (b) RSS vs. RSU-PDR, (c) RSS vs. RSU-PSR, (d) RSS vs. CAR-PDR, (e) RSS vs. CAR-PSR, and (f) RSU-PDR vs. CAR-PDR
For feature selection, according to Fig. 3, the results of applying different kernels are presented.
Linear and polynomial kernels were considered in finding the most appropriate SVM kernels, where the rbf and second order polynomial kernels were able to achieve a high performance. The rbf kernel was applied to the training, and the performance was observed through iterative statements by substituting the values from 0.1 to 5 in order to find the optimal Gamma and C values.
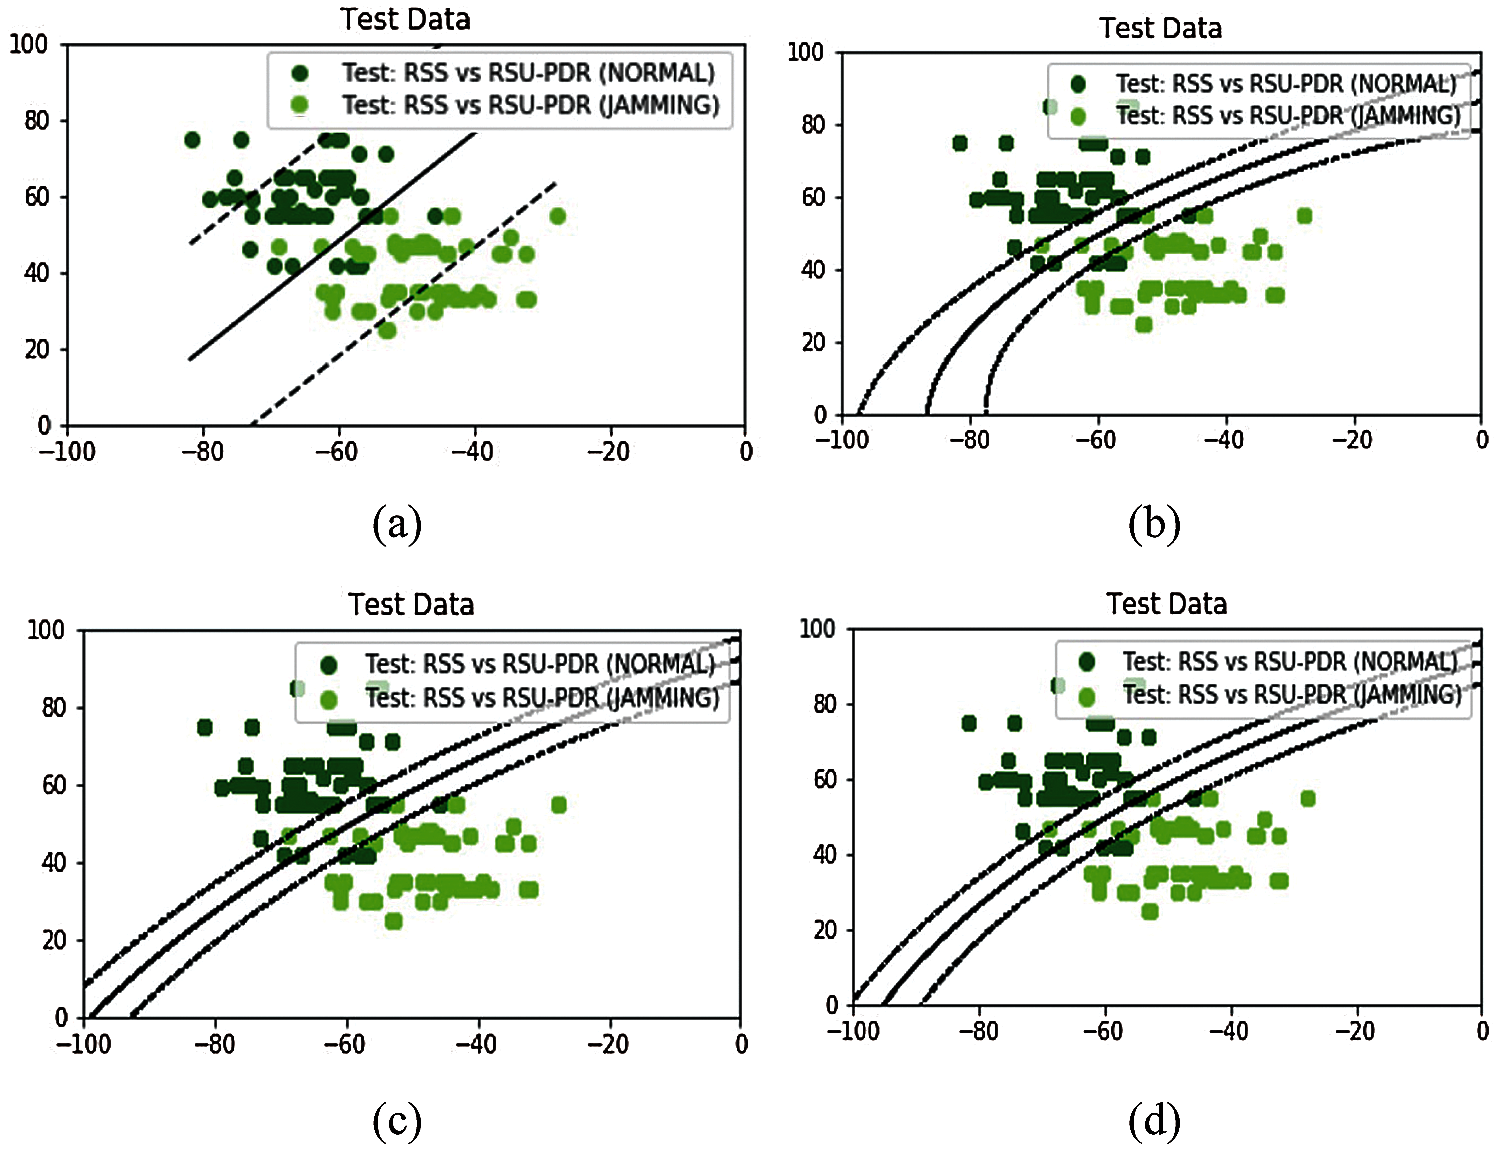
Figure 3: SVM kernel selection experiment results. (a) Linear kernel, (b) rbf kernel, (c) polynomial kernel (degree = 2), and (d) polynomial kernel (degree = 4)
In addition, 4 different features sets were applied to find the appropriate parameter set as presented in Tab. 2. For normal traffic, which represents relatively low density traffic environments, the parameter set {
According to the feature set {
For Case 1, as shown in Fig. 4, the test accuracy was 99.2% and the false alarm factor was

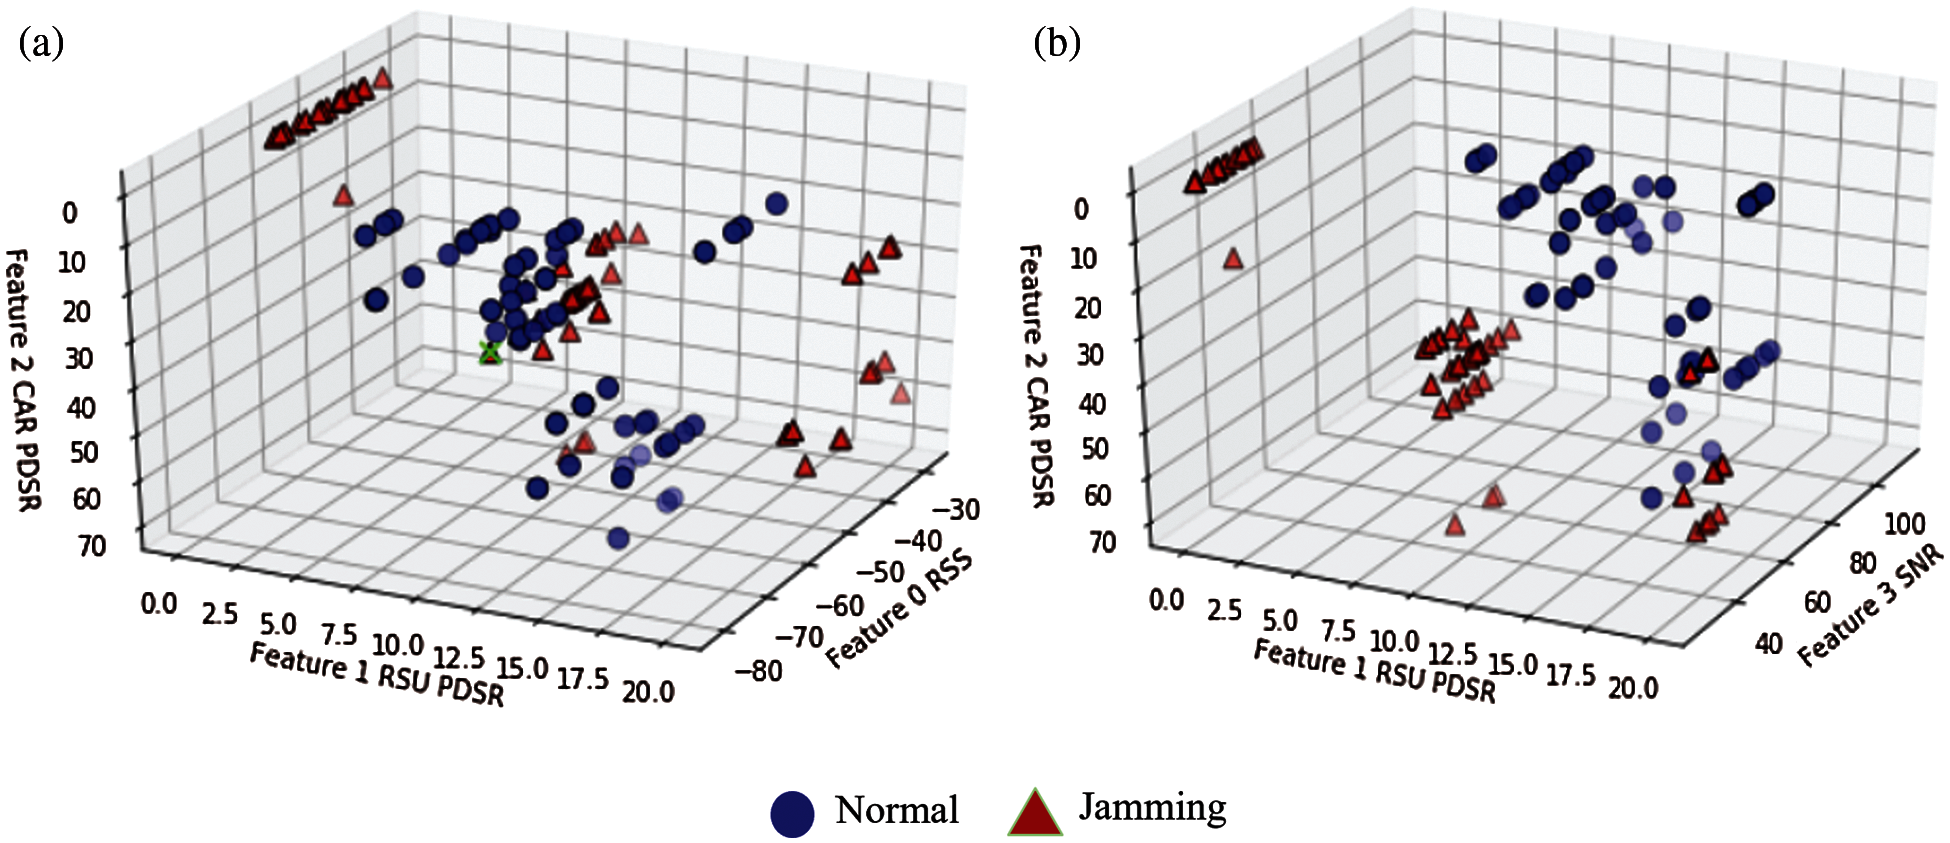
Figure 4: Case 1 SVM test result. (a) RSS vs. RSU-PDSR vs. CAR-PDSR and (b) RSU-PDSR vs. CAR-PDSR vs. SNR
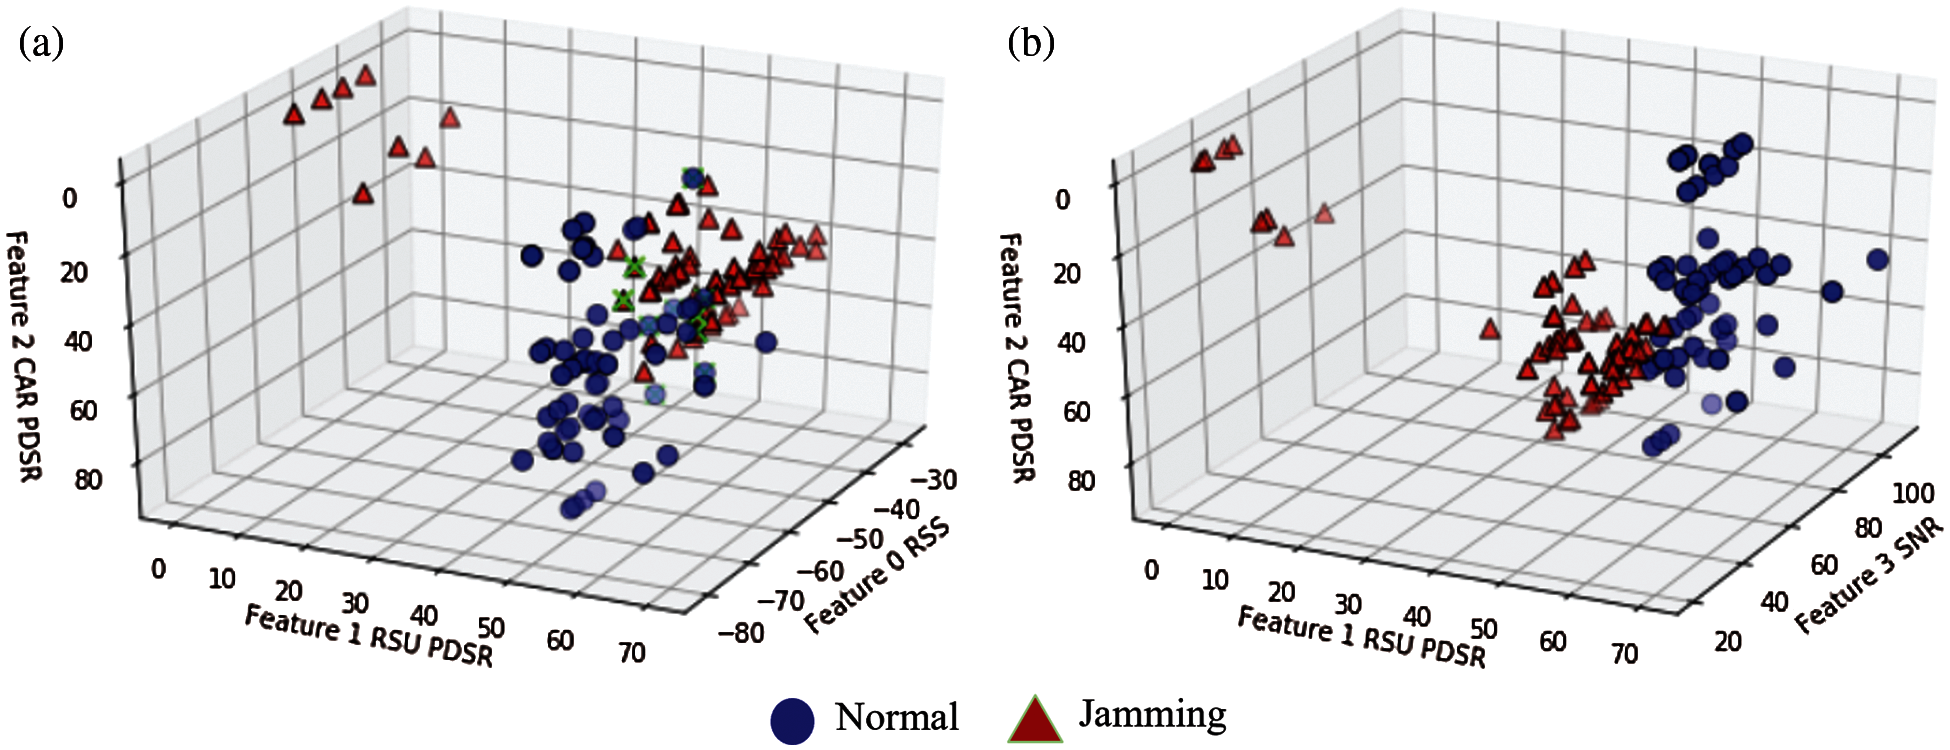
Figure 5: Case 2 SVM test result. (a) RSS vs. RSU-PDSR vs. CAR-PDSR and (b) RSU-PDSR vs. CAR-PDSR vs. SNR
4 Adversarial Attack and Defense
In the previous section, SVM classification was applied to distinguish jamming and non-jamming situations. In many cases, when a jammer conducts an advanced attack, the VANET can use past attack information to detect the jammer's behavior. For example, Wi-Fi based authentication procedures can be applied as public data records, and can be used for trainning based detection. In wireless communication environments, signal jamming attacks can occur anywhere and are very effective denial of service (DoS) attack tools, as the attacker is very difficult to find, attacks are much less costly, and these attacks have very low dependency to prior information compared to other spoofing and eavesdropping attacks [21]. To defend against an advanced jammer, it is important to determine the jamming situation quickly and accurately before selecting an anti-jamming strategy in order to increase the success rate of the packet transmission. Therefore, an additional algorithm is proposed to prevent misclassification situations when an attacker evolves in the test phase. In order to defend against adversarial attacks, a data sanitization scheme using DBSCAN is proposed in this paper.
Despite the high accuracy and performance of various machine learning algorithms, many schemes have been found to be vulnerable to subtle perturbation that has catastrophic consequences in security related environments. Adversarial Attacks can be categorized to several types [22].
Poisoning Attack patterns are known to contaminate the training data, which takes place during the training time. An adversary tries to poison the training data by injecting carefully designed samples to mislead the classifier.
Evasion Attack occurs by injecting malicious data or adversarial examples during the test phase.
Blackbox Attack is used when the attackers do not know the inner configuration and attacks the models by continuously feeding samples and observing the output.
Whitebox Attack occurs when the adversary has access to all the information of the target neural network, including the model architecutre and weights, etc.
In this paper, Evasion and Blackbox attacks are considered, where the attacker is constantly sending classifier confusing test data.
4.2 Adversarial Sanitation Defense
The attacker wants to cross the decision boundary towards the normal situation or place the points as close as possible to the boundary. So, the proposed adversarial defense is related to two ideas. First, as more attacks and defenses are repeated, the attacker will lower the PDR or/and PSR to the middle to look like a normal setup. Second, the jammer can't go to the normal point perfectly because it's presence alone acts as noise and lowers the SNR. In other words, the jammer can't control the SNR parameter accurately.
The proposed defense algorithm is based on data sanitization by using the DBSCAN algorithm [23]. It can identify the sparse data as noise and form clustering groups. Assume the attacker usually has a fixed budget and if the dataset is large enough, adversarial examples would be sparse outliers. The algorithm operates to find the DBSCAN optimal parameters which are epsilons and MinPts. Epsilons are the size of neighborhoods and MinPts are the minimum number of points in the neighborhood. The scheme performs outlier removal on the test dataset using DBSCAN. To improve the performance of DBSCAN, a K-Means clustering technique could be used. However, K-Means requires the number of clusters to be set in advance [24], and the DBSCAN scheme determines the number of clusters to use during its classification process, without having this number preset in advance. Since DBSCAN uses the density, and the noise value does not belong to any cluster, it is easy to apply a pre-processing step. In addition, DBSCAN can also form clusters with an arbitrary shape.
The proposed data sanitization scheme is analyzed using the vehicular parameters based on various characteristics, rather than trying to match the characteristics to a specific distribution shape [25]. Research in [13] uses DBSCAN to label the train data, whereas this paper uses it to pre-process the test data and remove data points that can reduce the accracy of the trained classifier in advance.
The scheme is tested separately when there are sufficient jamming data in the test samples and when there is little jamming data. Next, tests will be executed using the existing classifier on the cleaned data.
Fig. 6 illustrates the Data Sanitization process that pre-processes the data before the Test Phase. The condition of starting the initialization phase is to be able to adapt to changes in the vehicle density. Since the RSU collects road condition information (e.g., number of vehicles on the road and location of the vehicles), it can renew its process whenever changes in vehicle density and jamming conditions are detected. For initialization, the initial test set is used to acquire MinPts and epsilon parameters required for DBSCAN. The initial test set is divided based on the vehicle density and already has labels. The optimal parameters values of MinPts and epsilon are the minimum values that satisfy the 90% test accuracy, which are obtained based on a recursively increasing algorithm of the MinPts and epsilon values. Gathering data from a test environment helps to eliminate outliers within the data that are suspected of jamming or confuse the classification. Therefore, a clean dataset is used for the test phase.
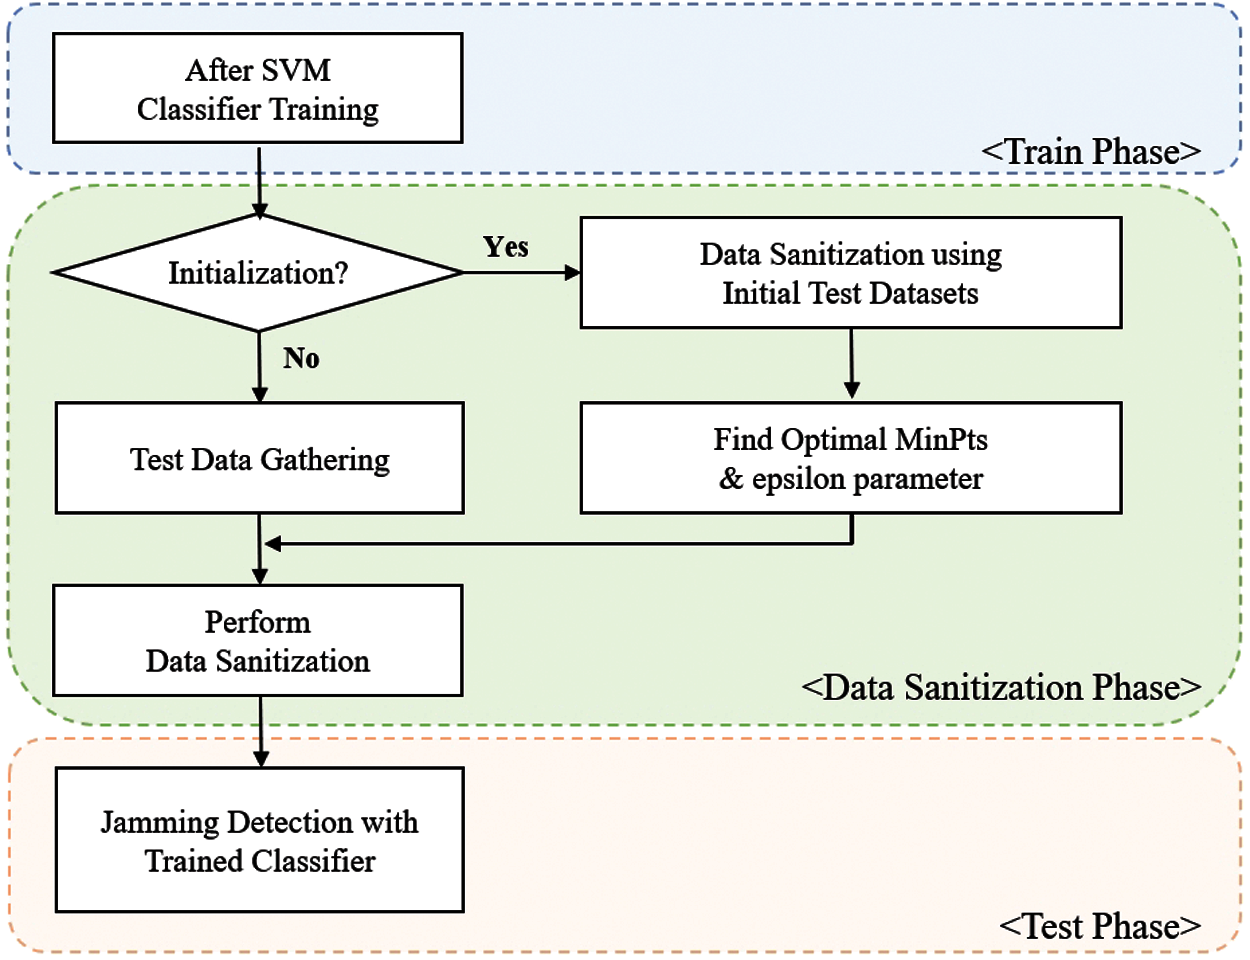
Figure 6: Flow chart of data sanitization
The experiments that lead to the results presented in Figs. 7 and 8 are based on the heavy traffic data, which has more than 80 vehicles with 1 RSU. According to the previously provided dataset, the false detection area among the existing jamming data patterns was randomly generated as a target. For example, RSS, SNR, CAR-PDSR, and RSU-PDSR sets for one point were moved close to the false detection region according to different random number values generated from a uniform distribution. Case 1 refers to a situation when there are sufficient jamming data. Jamming and normal test samples were respectively set to the same ratio of 50% and 50% based on a total of 630 samples. Fig. 7 represents the DBSCAN results for Case 1, the orange dots refer to the non-jamming normal situation, the green dots represent the jamming situation, and the blue dots refer to jamming but difficult to classify region. The DBSCAN parameters epsilons and MinPts are 14 and 17, respectively. As shown in Fig. 7, if the jamming test samples are sufficient, the attacker will insert a point mainly targeting the areas where errors occur, as it is close to the orange points, that is, the region which is difficult to determine. The jammer can adjust the number of jamming attacks and transmission power to make the RSS and PDSR parameters as similar as possible to the non-jamming situation, making detection difficult. As shown in the blue points region, the RSU-PDSR is similar to the non-jamming data, and the CAR-PDSR is close to jamming data at the same time. Since the RSU periodically collects road conditions and channel information to schedule the messages, RSU-PDSR tends to be more robust for jamming situations, as opposed to CAR-PDSR and RSU-PDSR, which can be measured accurately mostly in non-jamming situation. However, advanced attacks can also be detected by using the fact that the SNR is mostly low in the presence of a jamming signal. For example, the blue group has its RSS and PDSR located similar to the orange group, which reduces the detection accuracy to 96%. But clearing the blue group results in a detection test phase precision achieving 100%.
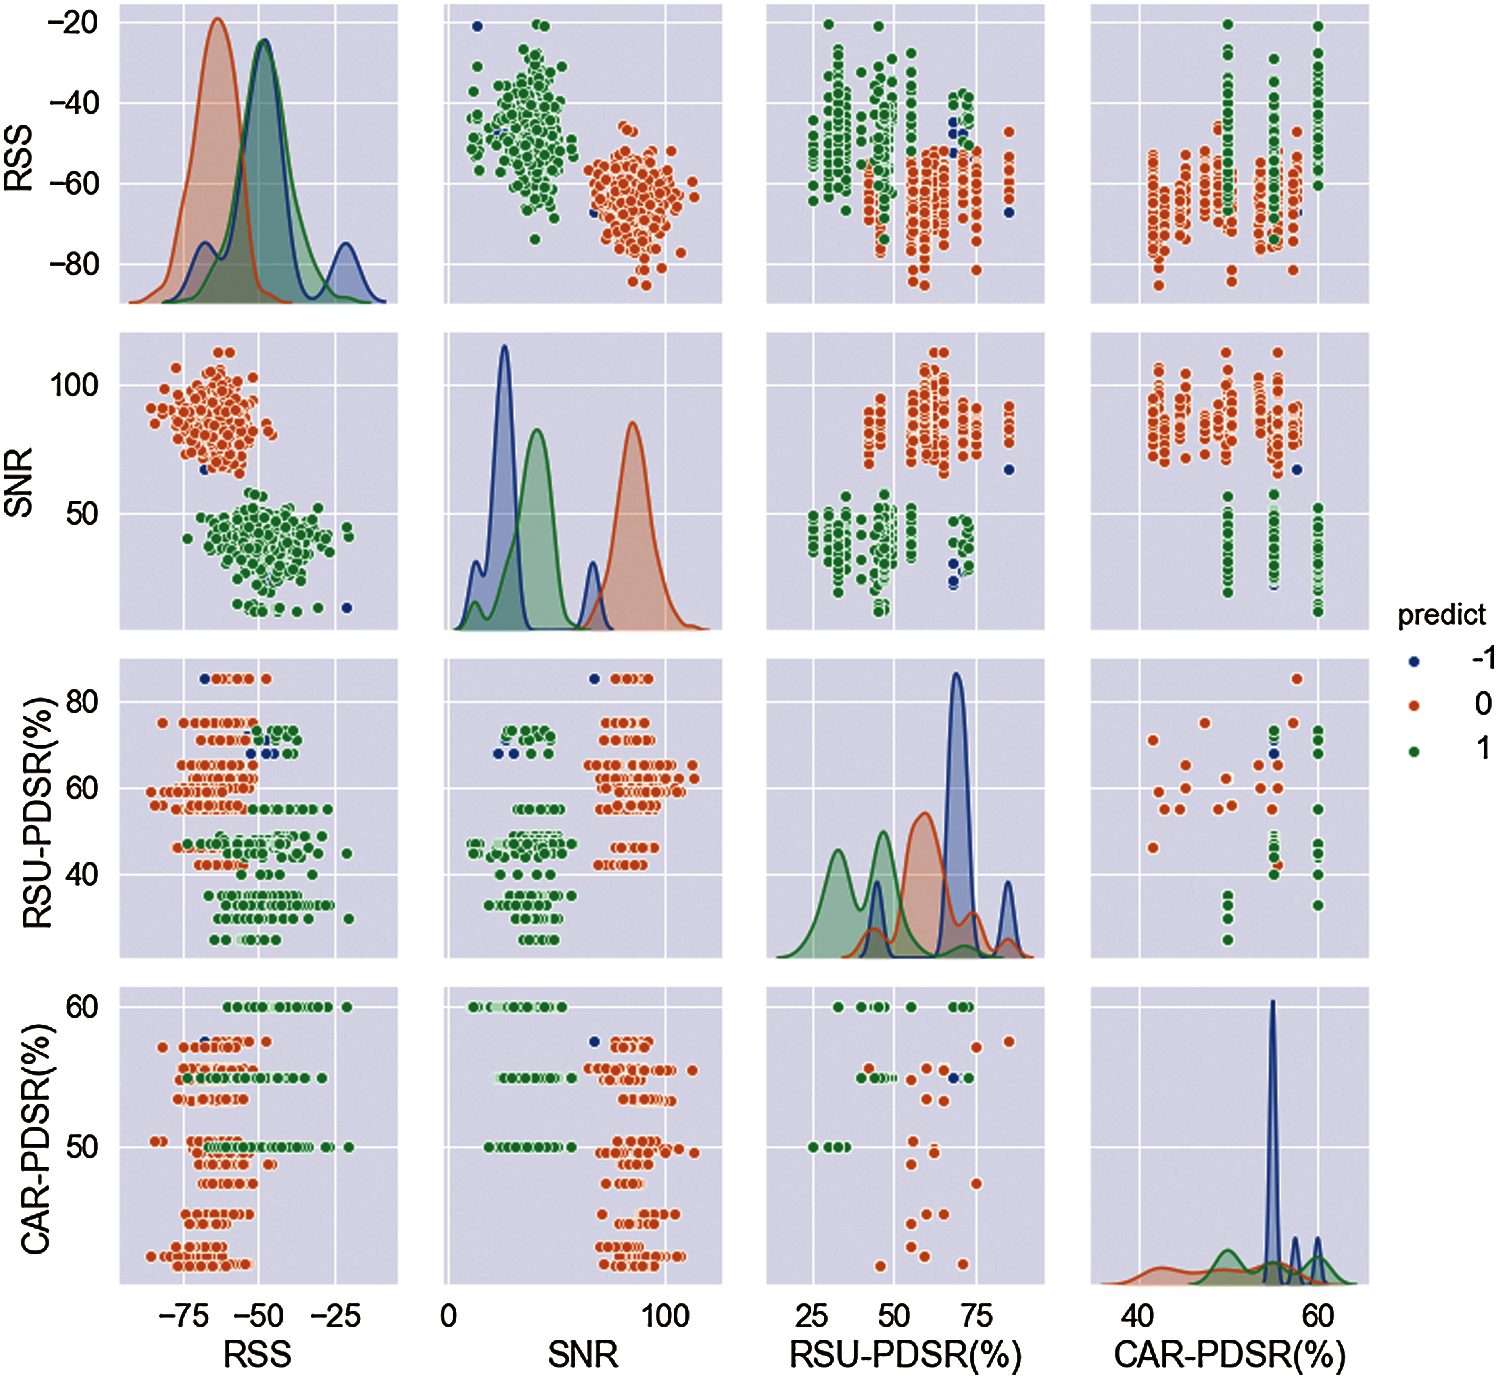
Figure 7: Case 1 DBSCAN results
Case 2 is a situation in which a small amount of jamming data is included in the test dataset. The total number of test samples is 420, of which contain less than 30% of jamming data samples. The DBSCAN parameters epsilons and MinPts for Case 2 are 14 and 8, respectively. The orange dots represent a non-jamming situation, and the green dots represent a jamming situation. If the jamming dataset is small, the number of points in a group will be small as well, where the points that are sufficiently far from the classifier can be removed (treated as outlier points), as shown in Fig. 8. In the case 2 experiment, the blue dots refer to the mean noise. After removing theses data points, the scheme can be tested as a clean dataset. After the data sanitization process, the detection precision of the test phase resulted to be 99%.
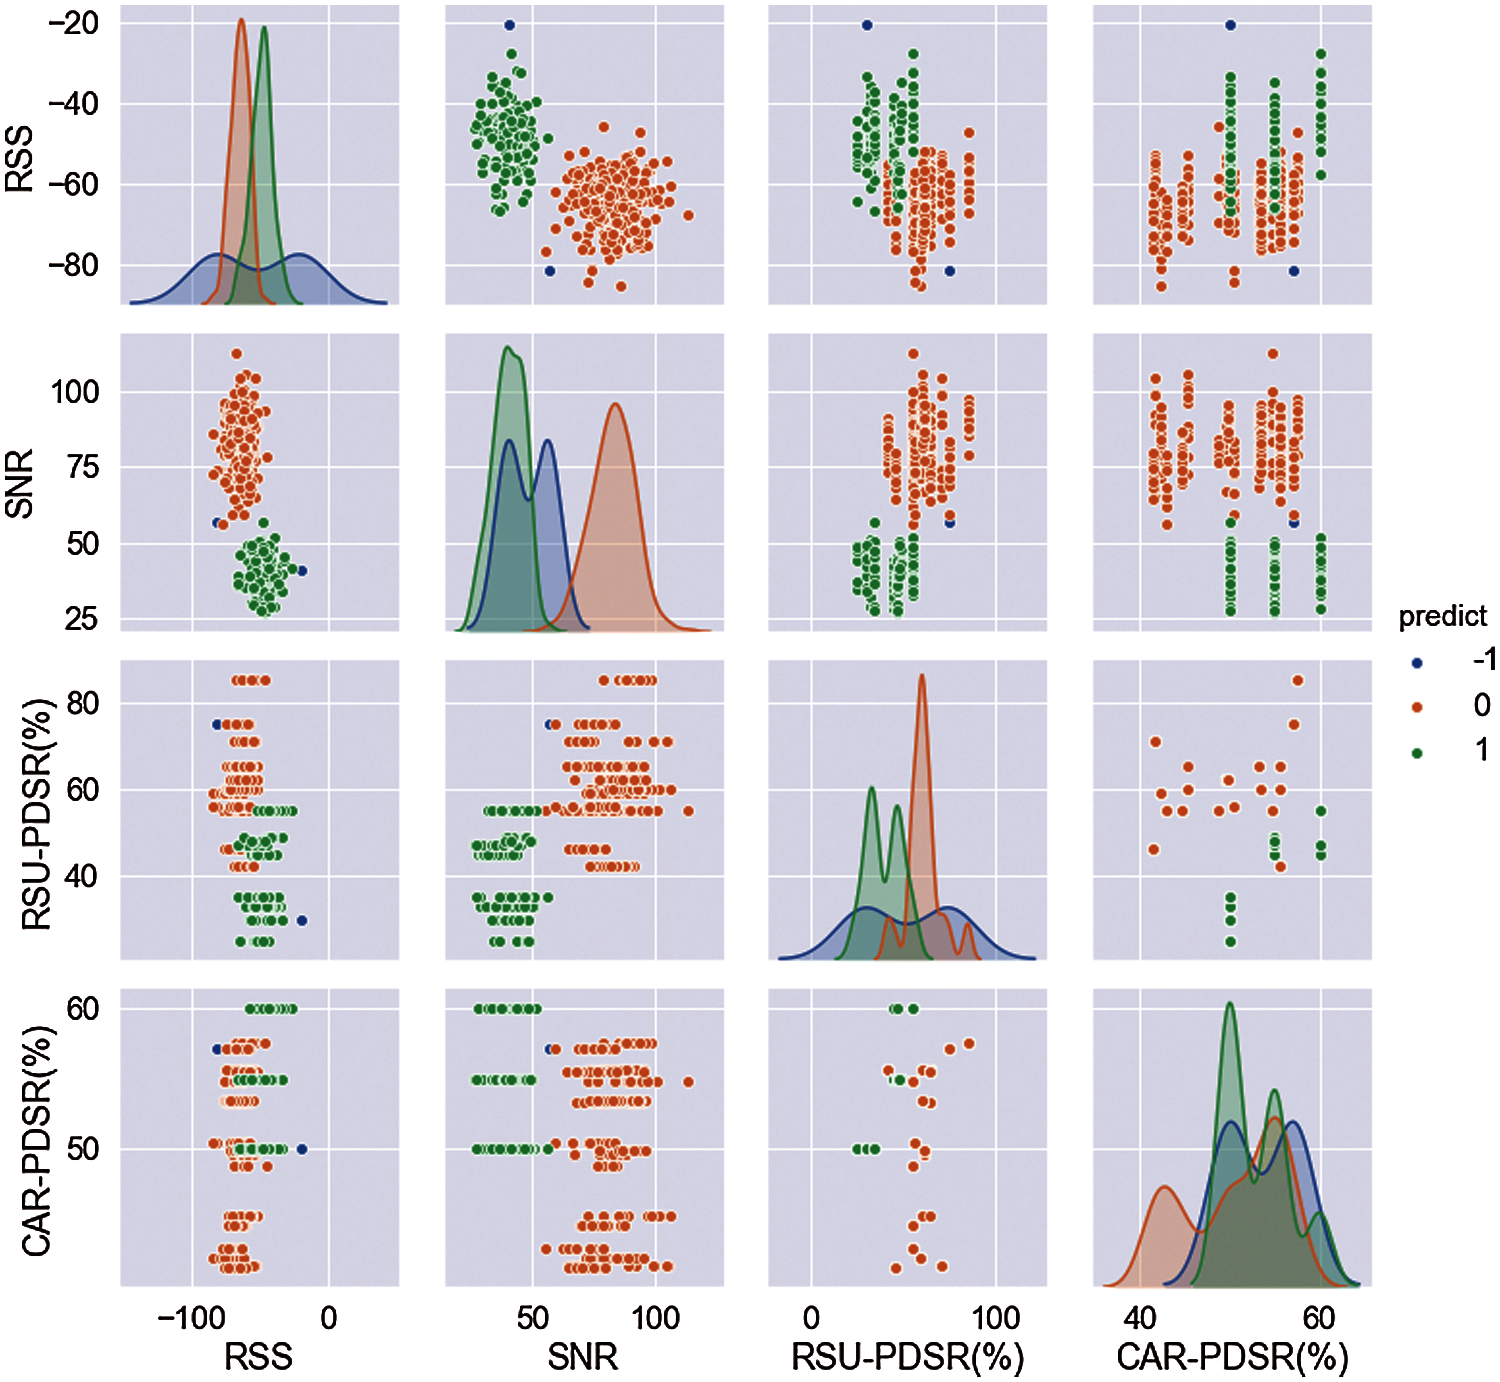
Figure 8: Case 2 DBSCAN results
In this paper, a jamming detection scheme to enhance the security of VANETs is proposed. When a jammer attacks, the measured values of the communication parameters, such as, RSS, SNR, PDR, and PSR change. Based on these parameters, SVM classification is performed using a dataset labeled with actual non-jamming and jamming data records. Furthermore, the results show that by using PDSR instead of using PDR and PSR helps to reduce the number of features, and a classification accuracy of 99% in normal traffic and 97% in heavy traffic can be obtianed. In addition, in this paper, a machine learning based adversarial defense algorithm for intelligent jamming detection is proposed. This scheme uses DBSCAN to detect intelligent jammer behavior that intentionally targets the decision region to reduce the accuracy of the SVM classification scheme. The DBSCAN based algorithm uses the fact that the SNR cannot be controlled by the jammer as the jamming signal is a type of noise. The clustering of DBSCAN allows the testing to be carried out with clean data, either by screening the jamming points near the decision region or by removing the outlier data points.
The proposed jamming detection scheme is evaluated with 1 reactive jammer in the coverage of the RSU in this paper. To extend the evaluation of VANET jamming detection and scheme development, it would be benefcial to design the proposed scheme into an embedded network simulator module. Then, the specific jamming scenario with more reactive jammers can be tested in an automated jamming detection simulation environment. Therefore, it is desired for future work to extend the proposed scheme into an embedded vehicular network simulator and improve the scheme to perform as an enhanced automated detection module against more diverse attack scenarios.
Funding Statement: This work was supported by the Institute for Information and communications Technology Promotion (IITP) grant funded by the South Korea government (MSIT, 2021-0-00040, Development of intelligent stealth technology for information and communication resources for public affairs and missions).
Conflicts of Interest: The authors declare that they have no conflicts of interest to report regarding the present study.
1. M. H. C. Garcia, A. Molina-Galan, M. Boban, J. Gozalvez, B. Coll-Perales et al., “A tutorial on 5G NR V2X communications,” IEEE Communications Surveys & Tutorials, vol. 23, no. 3, pp. 1972–2026, 2021. [Google Scholar]
2. X. Liu and A. Jaekel, “Congestion control in V2V safety communication: Problem, analysis, approaches,” Electronics, vol. 8, no. 5, pp. 540, 2019. [Google Scholar]
3. Z. Jin, Y. Xu, X. Zhang, J. Wang and L. Zhang, “Trajectory-prediction based relay scheme for time-sensitive data communication in VANETs,” KSII Transactions on Internet and Information Systems, vol. 14, no. 8, pp. 3399–3419, 2020. [Google Scholar]
4. S. Malebary, W. Xu and C. Huang, “Jamming mobility in 802.11p networks: Modeling, evaluation, and detection,” in IEEE 35th Int. Performance Computing and Communications Conf., Las Vegas, NV, USA, pp. 1–7, 2016. [Google Scholar]
5. S. Al-Sultan, M. M. Al-Doori, A. H. Al-Bayatti and H. Zedan, “A comprehensive survey on vehicular ad hoc network,” Journal of Network and Computer Applications, vol. 37, pp. 380–392, 2014. [Google Scholar]
6. H. Liu, Z. Liu, Y. Chen and W. Xu, “Localizing multiple jamming attackers in wireless networks,” in 31st Int. Conf. on Distributed Computing Systems, Minneapolis, MN, USA, pp. 517–528, 2011. [Google Scholar]
7. J. H. Cho and H. Lee, “Dynamic topology model of Q-learning LEACH using disposable sensors in autonomous things environment,” Applied Sciences, vol. 10, no. 24, pp. 9037, 2020. [Google Scholar]
8. A. Hamieh, J. Ben-Othman and L. Mokdad, “Detection of radio interference attacks in VANET,” in IEEE Global Telecommunications Conf., Honolulu, HI, USA, pp. 1–5, 2009. [Google Scholar]
9. N. Lyamin, A. Vinel, M. Jonsson and J. Loo, “Real-time detection of denial-of-service attacks in IEEE 802.11p vehicular networks,” IEEE Communications Letters, vol. 18, no. 1, pp. 110–113, 2014. [Google Scholar]
10. A. Israr, M. Ashraf, S. Jan and F. Q. Khan, “Detection and minimization of jamming attacks to enhance string stability in VANETs,” Journal of Information Communication Technologies and Robotic Applications, vol. 10, pp. 9–17, 2019. [Google Scholar]
11. H. Sedjelmaci and S. M. Senouci, “An accurate and efficient collaborative intrusion detection framework to secure vehicular networks,” Computers & Electrical Engineering, vol. 43, pp. 33–47, 2015. [Google Scholar]
12. H. Bangui, M. Ge, B. Buhnova and L. Hong Trang, “Towards faster big data analytics for anti-jamming applications in vehicular ad-hoc network,” Transactions on Emerging Telecommunications Technologies, vol. 32, pp. 1–18, 2021, http://10.1002/ett.4280. [Google Scholar]
13. H. S. Emadi and S. M. Mazinani, “A novel anomaly detection algorithm using DBSCAN and SVM in wireless sensor networks,” Wireless Personal Communications, vol. 98, no. 2, pp. 2025–2035, 2018. [Google Scholar]
14. K. Parlin, M. M. Alam and Y. L. Moullec, “Jamming of UAV remote control systems using software defined radio,” in 2018 Int. Conf. on Military Communications and Information Systems, Warsaw, Poland, pp. 1–6, 2018. [Google Scholar]
15. N. I. Mowla, N. H. Tran, I. Doh and K. Chae, “Federated learning-based cognitive detection of jamming attack in flying Ad-hoc network,” IEEE Access, vol. 8, pp. 4338–4350, 2020. [Google Scholar]
16. C. Dai, X. Huang and G. Dong, “Support vector machine for classification of hyperspectral remote sensing imagery,” in 4th Int. Conf. on Fuzzy Systems and Knowledge Discovery, Haikou, China, pp. 77–80, 2007. [Google Scholar]
17. H. Drucker, D. Wu and V. N. Vapnik, “Support vector machines for spam categorization,” IEEE Transactions on Neural Networks, vol. 10, pp. 1048–1054, 1999. [Google Scholar]
18. W. Li and Z. Liu, “A method of SVM with normalization in intrusion detection,” Procedia Environmental Sciences, vol. 11, pp. 256–262, 2011. [Google Scholar]
19. S. Malebary “DSRC vehicle communications dataset, center for machine learning and intelligent systems,” 2017. [Online]. Available: https://archive.ics.uci.edu/ml/datasets/DSRC+Vehicle+Communications. [Google Scholar]
20. SAE Standard J2735, “Dedicated short range communications (DSRC) message set dictionary,” SAE International, 2016, http://10.4271/J2735_201603. [Google Scholar]
21. Z. Li, Y. Lu, Z. Wang, W. Qiao and D. Zhao, “Smart anti-jamming mobile communication for cloud and edge-aided UAV network,” KSII Transactions on Internet and Information Systems, vol. 14, no. 12, pp. 4682–4705, 2020. [Google Scholar]
22. A. I. Newaz, N. I. Haque, A. K. Sikder, M. A. Rahman and A. S. Uluagac, “Adversarial attacks to machine learning-based smart healthcare systems,” in 2020 IEEE Global Communications Conf., Taipei, Taiwan, pp. 1–6, 2020. [Google Scholar]
23. M. Ester, H. Kriegel, J. Sander and X. Xu, “A density-based algorithm for discovering clusters in large spatial databases with noise,” in 2nd Int. Conf. on Knowledge Discovery and Data Mining, Portland, USA, pp. 226–231, 1996. [Google Scholar]
24. M. Hua, M. K. Lau, J. Pei and K. Wu, “Continuous K-means monitoring with Low reporting cost in sensor networks,” IEEE Transactions on Knowledge and Data Engineering, vol. 21, pp. 1679–1691, 2009. [Google Scholar]
25. A. Girma, M. Garuba and R. Goel, “Advanced machine language approach to detect DDoS attack using DBSCAN clustering technology with entropy,” Advances in Intelligent Systems and Computing, vol. 558, pp. 125–131, 2018. [Google Scholar]
 | This work is licensed under a Creative Commons Attribution 4.0 International License, which permits unrestricted use, distribution, and reproduction in any medium, provided the original work is properly cited. |