DOI:10.32604/cmc.2022.023167
| Computers, Materials & Continua DOI:10.32604/cmc.2022.023167 | |
| Article |
Machine Learning-Based Advertisement Banner Identification Technique for Effective Piracy Website Detection Process
1ISAA Lab., Department of AI Convergence Network, Ajou University, Suwon, 16499, Korea
2Department of Cyber Security, Ajou University, Suwon, 16499, Korea
*Corresponding Author: Jin Kwak. Email: security@ajou.ac.kr
Received: 30 August 2021; Accepted: 30 September 2021
Abstract: In the contemporary world, digital content that is subject to copyright is facing significant challenges against the act of copyright infringement. Billions of dollars are lost annually because of this illegal act. The current most effective trend to tackle this problem is believed to be blocking those websites, particularly through affiliated government bodies. To do so, an effective detection mechanism is a necessary first step. Some researchers have used various approaches to analyze the possible common features of suspected piracy websites. For instance, most of these websites serve online advertisement, which is considered as their main source of revenue. In addition, these advertisements have some common attributes that make them unique as compared to advertisements posted on normal or legitimate websites. They usually encompass keywords such as click-words (words that redirect to install malicious software) and frequently used words in illegal gambling, illegal sexual acts, and so on. This makes them ideal to be used as one of the key features in the process of successfully detecting websites involved in the act of copyright infringement. Research has been conducted to identify advertisements served on suspected piracy websites. However, these studies use a static approach that relies mainly on manual scanning for the aforementioned keywords. This brings with it some limitations, particularly in coping with the dynamic and ever-changing behavior of advertisements posted on these websites. Therefore, we propose a technique that can continuously fine-tune itself and is intelligent enough to effectively identify advertisement (Ad) banners extracted from suspected piracy websites. We have done this by leveraging the power of machine learning algorithms, particularly the support vector machine with the word2vec word-embedding model. After applying the proposed technique to 1015 Ad banners collected from 98 suspected piracy websites and 90 normal or legitimate websites, we were able to successfully identify Ad banners extracted from suspected piracy websites with an accuracy of 97%. We present this technique with the hope that it will be a useful tool for various effective piracy website detection approaches. To our knowledge, this is the first approach that uses machine learning to identify Ad banners served on suspected piracy websites.
Keywords: Copyright infringement; piracy website detection; online advertisement; advertisement banners; machine learning; support vector machine; word embedding; word2vec
In this age, following the miraculous advancement of technology, industries and individuals involved in digitally creating, connecting, and distributing works of art are earning more multi-dimensional benefits than ever. Nevertheless, countless piracy websites on the Internet illegally distribute digital content without the consent of copyright holders, using loopholes on the Internet [1–3]. Consequently, the creative industry faces substantial challenges against illegal and unauthorized distribution of its works; this includes damaged reputation, reduced production funding, and security risks. As several piracy sites join the network every day, billions of dollars worldwide are subject to loss each year [3].
Some tech giants are trying different approaches to weaken the piracy industry. Google, particularly through YouTube, attempts to combat infringement by providing easy access to legitimate music, videos, and other media [2,3]. Although this approach is effective in the long-term efforts to weaken the entities involved in this industry, the ever-increasing piracy sites still require serious attention. On the other hand, various studies have focused on detection and blocking of websites involved in the act of copyright infringement. For the detection purpose, two approaches, internet traffic analysis and webpage feature analysis, have been utilized so far [2,4–6]. Matthew et al. [6] performed website traffic analysis on legal video streaming websites such as Netflix, YouTube, and Twitch and various pirated websites. They used machine learning algorithms to detect the unique signature of both type of websites, based on network traffic features such as size and number of packets, source and destination port number, byte distribution, etc. Similarly, Kim et al. [4] and Choi et al. [5] proposed webpage feature analysis technique to automate the detection and blocking processes. The central idea of these works is to rely on scanning for the presence of features (keywords) that are related to illegal torrent sites, video streaming sites, and webtoons. However, the keyword analysis approaches used so far are mainly based on static comparisons between words extracted from intended websites and the dictionary of predefined keywords collected from suspected piracy sites.
Most piracy sites provide online advertising services to generate revenue [2]. These advertisements have some attributes that makes them unique compared to advertisements posted on normal or legitimate websites, as shown in Fig. 1 below. They usually encompass click-words (words that redirect to install malicious software), words that promise a free use, and suspicious contents that have a significant degree of similarity with frequently used words and sentences in illegal gambling, illegal sexual acts, and so on [2]. This makes them ideal to be used as one of the key features to successfully detect websites involved in the act of copyright infringement.

Figure 1: Illustration of Ads posted on suspected piracy websites
Kim et al. [4] analyzed Ad banners extracted from various websites and proposed a technique that distinguish between Ad banners extracted from normal sites and their piracy counterparts. The authors used statical keyword comparison approach and they were successful in doing so. However, after deeply analyzing the behavior of banners posted on randomly selected suspected piracy sites, we observed that the contents of Ads on piracy sites are highly dynamic and continue to change, to avoid being detected by static detection approaches. Consequently, these techniques become less accurate over time and fail to cope with the dynamic and adaptive nature of those features.
Therefore, we propose a machine learning-based technique that can continuously fine-tune itself and is intelligent enough to effectively overcome the aforementioned challenges. We propose this technique in the hope that it will help enhance the process of effectively identifying copyright infringement sites. In this work, we used support vector machines (SVMs) as our base machine learning model, along with a pretrained word2vec vectorization model. After performing analysis on Ad banners extracted from 98 suspected piracy and 90 normal sites, we were able to successfully distinguish between both domains with a 97% accuracy. The remainder of this paper is structured as follows: In Section 2, we review related works on word embedding and classification models, focusing on the particular models we selected to use; in Section 3, we discuss the proposed method in detail; in Section 4, we evaluate the performance of our proposed technique; finally, we provide concluding remark in Section 5.
In the process of classifying text using machine learning algorithms, the most important step after data cleaning is converting the words or documents into numerical data through a vectorization or embedding process. This process allows statistical classifiers to perform the required mathematical calculations on words, such as adding, subtracting, and finding the distances between words [7]. Unlike word encoding, word embedding attempts to capture the semantic, contextual, and syntactic meanings of each word in a vocabulary. It represents single words with a set of vectors that accurately groups similar words around one point in the vector space [8]. We can then calculate the cosine distance between any two target words to determine their relationship.
There are various commonly used approaches to perform this operation: frequency-based embedding approaches such as Count Vector, TF-IDF (Term Frequency—Inverse Document Frequency), and Co-Occurrence Vector; and prediction-based embedding approaches such as the continuous bag of words (CBOW) and Skip-gram [8,9]. Frequency-based embedding approaches are relatively easy to work with; however, they cannot identify semantic features and preserve the relationships between words. On the other hand, prediction-based embedding approaches are neural network (NN)-based architectures, which provide state-of-the-art solutions for this problem. The CBOW and Skip-gram models are widely used architectures in many text classification problems [10].
2.2 Vectorization Using word2vec Model
Word2vec, in general, is a technique that combines two prediction-based algorithms: Skip-gram and CBOW, and two moderately efficient training models: hierarchical SoftMax and negative sampling [11]. CBOW and Skip-gram models are mirrored versions of each other in which CBOW is trained to predict a single word from a fixed window size of context words, whereas Skip-gram performs the opposite, as illustrated in Fig. 2 [8].

Figure 2: Diagram of CBOW and skip-gram models
Unlike the CBOW, the Skip-gram is used to find a distributed word representation by learning word vectors that are good enough to predict nearby words [8]. For each estimation step, the model takes one word from the input as a center word and predicts words in its context up to a certain window size. In other words, it determines the conditional probability of context words (in each window size) given the center word. This is mathematically described in Eq. (1). The probability of prediction or the average log probability is maximized by efficiently choosing the vector representation of words [11].
Here
The problem with this model is that it is computationally intensive when the corpus contains a very large vocabulary. Reference [11] solved this problem using the hierarchical SoftMax model, which was then replaced by the negative sampling. Negative sampling is the process of sampling negative words (words out of context or out of the window size range) ensuring that the positive words (words in the context) are classified with a higher probability than their negative counterparts for given input words, as shown in Eq. (2). The Skip-gram with negative sub-sampling outperforms every other method and is used as part of the final word2vec model [11].
Eq. (2) maximizes the dot product between the center word
2.3 Support Vector Machines (SVM)
SVM is a supervised machine learning algorithm to find a hyperplane that classifies all training vectors into two classes. During this process, each data item is plotted as a point in an n-dimensional space (where n is the number of features) with the value of each feature being a particular coordinate [12]. Then, classification is performed by finding the hyperplane that differentiates the two classes very well. SVM works on vectorized data and can be used for both linear and nonlinear classification tasks such as text processing, image categorization, and hand-written recognition [13].
In the case of linear classification, the model creates a hyperplane with two parallel planes with distance d from the center hyperplane in such a way that one line passes through the nearest positive point and the other passes through the nearest negative point, as shown in Fig. 3 [14]. The points closest to the decision boundary are called support vectors. In this case, the classifier function is defined in Eq. (3).
where w indicates a weight vector used for defining the decision boundary, and b is a bias. If

Figure 3: Decision boundary and margin of SVM
On the other hand, nonlinear classification is achieved by changing the dimensionality of the input feature space using kernel functions such as polynomial, sigmoid, and RBF (Radial Bases Function) [15]. These functions are based on mapping input features to a much higher dimensional set of features. The input mapping assumes the generation of a new function,
Our objective was to build a machine learning model that can categorize sentences or texts extracted from Ad banners into their respective classes, class of suspected piracy sites and class of normal or legitimate websites. To do so, we proposed a machine learning-based technique that uses an SVM algorithm as a base architecture along with word2vec vectorization model. Our proposed technique goes through a three-stage process, which includes data collection and preprocessing, feature extraction (vectorization), and modeling and testing the classifier. The first process involves crawling Ad banners from the target web pages and extracting features from the Ad banners. The second process involves data cleaning and vectorization while the final process involves modeling, training, testing, and optimizing a statistical classifier. Fig. 4 illustrates the process of the proposed method. The detailed description of each stage is described in the following subsections.

Figure 4: Overall process of the proposed technique
We collected data from 98 suspected piracy sites and 90 normal or legitimate websites. We used Alexa Rank and the Google Transparency Report as our main sources of information to nominate websites for data collection. Alexa is a web traffic analysis company that provides information about the popularity index for various websites [17]. We selected top-rated websites based on the information acquired from this website. On the other hand, the Google Transparency Report provides information related to the involvement of websites in illegal acts such as copyright infringement [18]. Similarly, we identified suspected piracy sites based on this information.
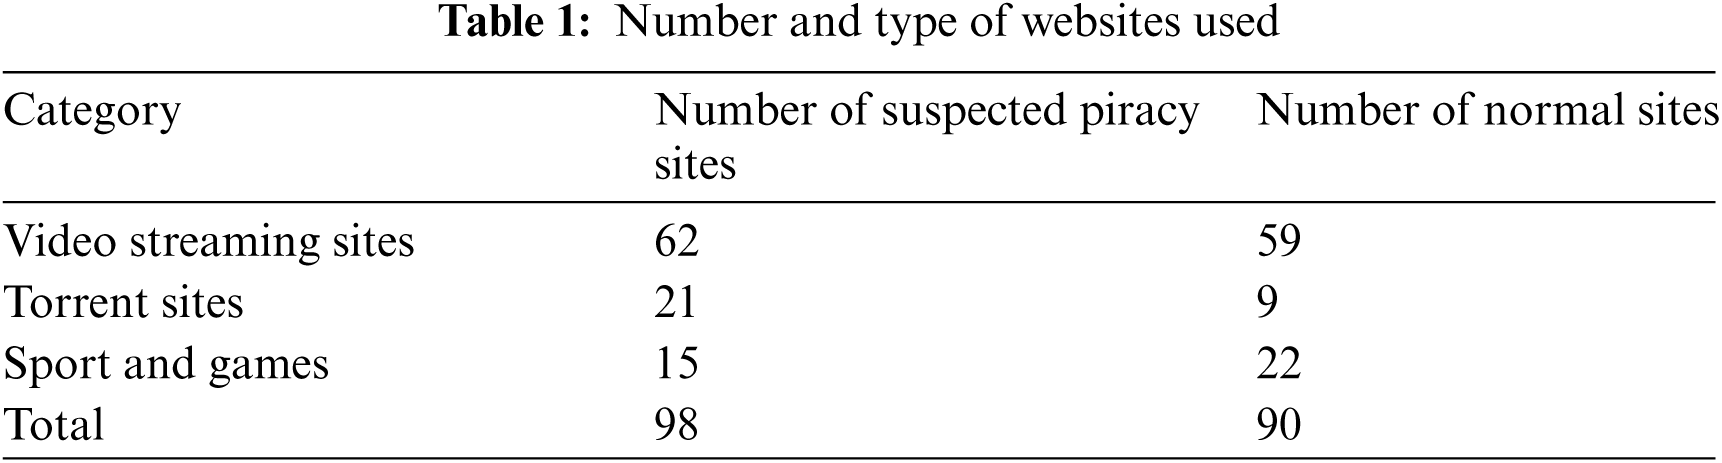
The data collection process involved three steps. The first step was identifying and crawling Ad banners from the target website by manually analyzing or inspecting the corresponding hypertext markup language (HTML) code. After confirming the existence of Ad banners, we extracted those banners using the Selenium web crawler tool based on their unique URL (unified resource locator). Selenium is an open-source tool that help automating the web crawling. The second step was extracting any text from the Ad banners using the Google Vision API (Application Peripheral Interface), as described in the Section 3.1.1. Finally, the third step involved preparing a dataset for further processing and classification operations. We were able to collect 1015 Ad banners from 188 websites, as given below in Tab. 1.
3.1.1 Text Extraction and Dataset Preparation
As mentioned in Section 1, the main purpose of this work was to identify Ad banners posted on suspected piracy sites based on the words or sentences that appear on them. However, Ad banners usually integrated in websites in the form of image. Consequently, we used an optical character recognition (OCR) tool, namely the Google Vision API, to recognize and extract characters from the Ad banners. The Vision API is a machine learning tool that helps detect and extract text from images [19]. The return value from requesting this operation is in JSON (JavaScript Object Notation) format and includes the entire extracted string as well as individual words and their bounding boxes. Because we were interested only in individual words rather than structured sentences, we filtered out the values for the bounding box and used the rest as they were. Finally, we labeled the data per their corresponding domain (“1” for data that comes from normal or legitimate sites and “0” for the data that comes from the suspected piracy sites) and stored them in a CSV (Comma-separated values) file for further data processing operations.
3.2 Preprocessing and Vectorization
In this stage, we first cleaned our data and then prepared a vector representation for each word in the dataset to make it ready for further classification operations. Text or sentences in various Ad banners usually includes more special characters such as “! @ # $ % & () *”, and misspelled words. Further, it contains fewer stop words such as “the,” “a,” “in,” “about,” hyperlinks, emails, and URLs. However, we removed all these attributes as they carry little or no useful information that can impact the decision of our machine learning model; in fact, they can reduce the quality of the classifier output. Removal of URLs and special characters was achieved through pattern matching with the help of the Python Regular Expression (RE) library. Similarly, removal of the stop words was carried out using the “NLTK (Natural Language Toolkit)” Python library. NLTK is a popular and widely used Python library for NLP (natural language processing). Finally, the dataset was split into training (75%) and test (25%) groups. Fig. 5 shows a partial appearance of the dataset after the data cleaning operation was performed.

Figure 5: Portion of the dataset after data cleaning operation
As described in Section 2.1, before applying the machine learning model to text documents, we first need to turn the text content into numerical feature vectors. For this purpose, after comparing most of the existing vectorization models, we found that the word2vec model is robust and outperforms other vectorization models in our context. Using this method, we tested two approaches: one was to train the word2vec vectorization model from scratch based on our dataset, and the other was to use pretrained vectorization models. We achieved a better result using the latter approach. The details are discussed in Section 4.2.
After formatting and preparing the dataset for further classification operation, the next step was to choose, model, and train the machine learning classifier until it was efficient enough to distinguish between the two classes (suspected piracy and legitimate sites). As we already had a labeled dataset, we needed a supervised machine learning model for efficient classification operation. Additionally, because our target was to perform classification, we required a model that could provide a deterministic output (such as deep learning, SVM, and naïve Bayes) rather than one with a probabilistic output. Therefore, we needed to carefully choose between these models to obtain a better result.
3.3.1 Selecting Classification Algorithm
We considered some conditions for the effective selection of our machine learning-based classifier models. The first condition was the size of the dataset. As described in Section 3.1, our dataset comprised sentences and words extracted from Ad banners, which limited its size. On the other hand, after deeply analyzing the nature of our dataset, we noted that there was a probability of overlapping between the two classes. For instance, a portion of sentences related to shopping advertisements sometimes had a probability of being served on both website classes; therefore, owing to the size and nature of our dataset, we chose SVM as the classifier model. Compared to the deep learning models, SVM works well when the dataset is relatively small; at times, it worked better than the neural network-based models [15]. Additionally, compared to the naïve Bayes model, SVM tries to find the best margin that separates the two classes and thus better reduces the risk of error due to overlapping [20].
3.3.2 Modeling and Training the Classifier
We used the Scikit-Learn (sklearn) machine learning library from the Python programming language and built our model using SVM. SVMs with various classification, regression, and clustering algorithms are included in this library with all their respective features [21]. This library greatly reduces the burden of modeling the classifier. We imported the support vector classifier (SVC) from the SVM module and initialized it with a random state of its parameters, such as regularization (C), gamma, and kernel function. The trick was to tune these parameters until we found the best classifier that could optimally categorize sentences or texts extracted from Ad banners into their respective classes. The regularization parameter is used to set the degree of ignorance for each misclassified training example, while the gamma parameter defines the influence of each training example on drawing the decision boundary [15]. On the other hand, the kernel function transforms the decision surface into a linear equation in a higher number of dimension spaces whenever there is nonlinearity in the distribution of the training dataset [15].
After deeply analyzing and visualizing the nature of our dataset, we observed that it was easily separable with a linear function and a small portion of its training elements would cross the decision boundary. Hence, we chose to use a linear kernel function with an optimally lower value for the regularization parameter and the default value for the gamma parameter. However, we found a better result after optimizing our parameters using a cross-validation function called “GridSearchCV( )” from the sklearn library. This is a function that helps to loop through predefined hyperparameters and optimally fit our model on the training dataset. We further examine this process in Section 4.3.
4 Evaluation of the Proposed Technique
4.1 Implementation and Evaluation Environment
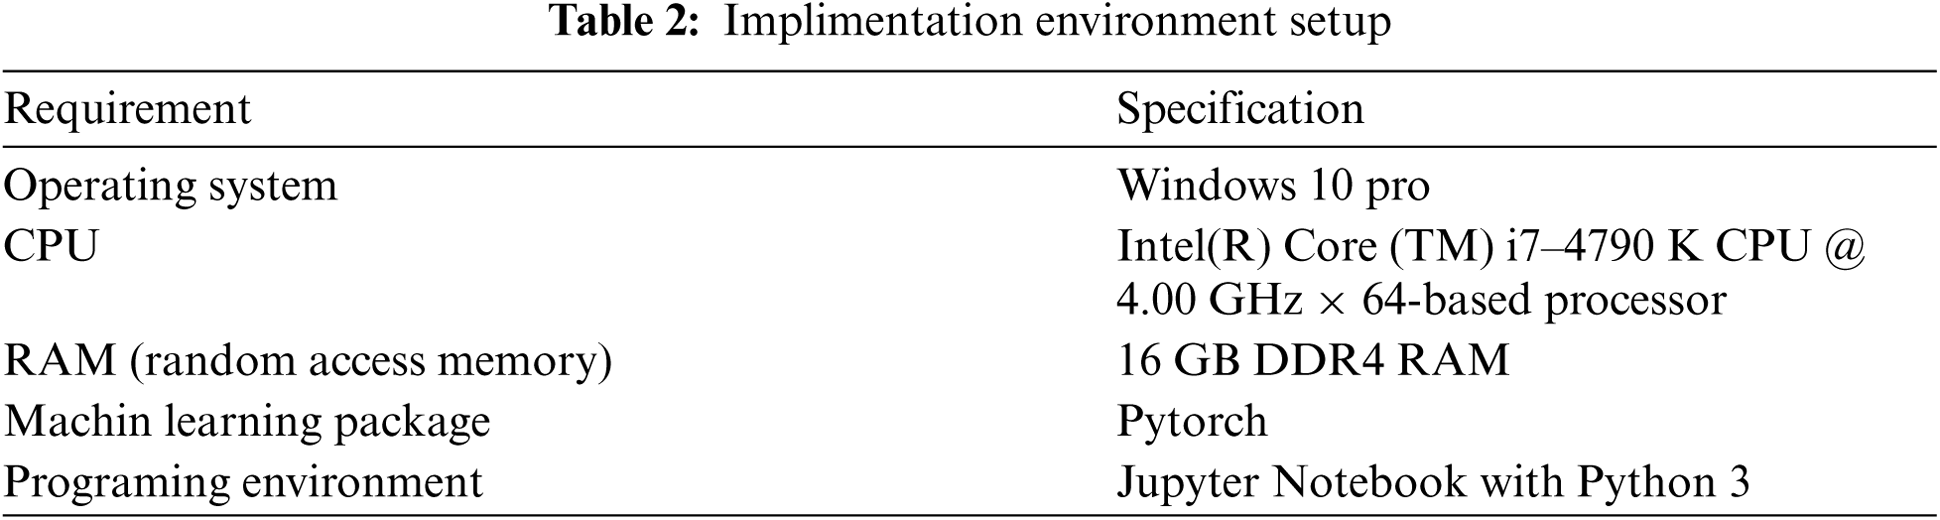
As we used a pretrained vectorization model, we needed our computational environment to be sufficiently fast and capable of accommodating all important data. Therefore, we set up the testing environment, as shown in Tab. 2.
As mentioned in Section 3.2, we used the word2vec model to vectorize our preprocessed dataset. However, owing to the size and nature of our dataset, we tested two approaches to find the best vectorization model that could efficiently distribute our dataset with an optimal cosine distance between each word. The first approach was to build the vectorization model from scratch, and the second was to use pretrained models that have been trained on a sufficiently large corpus. The second approach showed better results for successfully vectorizing our dataset.
In the first approach, we built our word2vec model using “Gensim”, which is an NLP library for Python that comes with word2vec class in it. We loaded our dataset and performed the preprocessing operation after installing all required libraries such as gensim and python-levenshtein on Jupyter notebook. Then, we built our word2vec model using a Skip-gram with a window size of 5, a minimum word count of 2 (owing to the smaller size of words per Ad banner), and 4 workers (number of CPU threads used in training the model). Finally, we prepared a vocabulary of unique words and trained our model for 10 epochs.
After the training phase was completed, we evaluated the performance of our model by finding the closest words for a randomly selected word from the dataset. However, we observed an embarrassing result, as shown in Fig. 6. This may be due to the relatively small data size compared to what is required to successfully train such models. In addition, we assumed that this might be due to the type and nature of texts, that is, unstructured and less correlated, used on various Ad banners. Therefore, we decided to test using a pretrained vectorization model that has been trained on a large dataset with sufficient vector dimensionality and an associated data domain.

Figure 6: Vectorization result using word2vec model trained on our dataset
In the second approach, we used a pretrained Google word2vec vectorization model, which is trained on a part of the Google news dataset containing approximately 100 billion words. The training is performed with a Skip-gram of window size 10 as the base architecture, uses negative sampling as the training algorithm, and contains 300-dimensional vectors for 3 million words and phrases. To accommodate the 3 million words (4 bytes per word), each represented by 300-dimensional vectors, it requires a RAM with at least 3.6 GB of free space (3 M × 300 × 4 bytes = ∼3.6 GB). To be safe, we set up our environment using 12 GB RAM with an Intel(R) Core (TM) i7-4790K CPU@4.00 GHz × 64-based processor. The vectorization results were satisfactory, as shown in Fig. 7.
However, there was still a gap in calculating the cosine distance between words in our corpus. For instance, as shown in Fig. 8, the cosine distance between the word “betting” and “gambling” is 0.6097108, which is somewhat unsatisfactory. Hence, we used “Spacy”, which is an NLP library for Python and provides various pretrained models in different languages with different sizes. We used a model trained on written blogs, news, and comments in English, and we were able to obtain a satisfactory result, as shown in Fig. 9. The portion of our vectorized dataset is shown in Fig. 10.

Figure 7: Vectorization result using google pretrained word2vec model

Figure 8: Cosine distance between 2 words using google pretrained word2vec model

Figure 9: Cosine distance between 2 words using pretrained model in spacy
We tested the performance of the SVM model using various combinations of its parameter values. The test was performed on 25% of the dataset. We achieved an accuracy of 97% through the optimization process. On the other hand, the worst performance was recorded when using the SVM with the sigmoid kernel function. The overall accuracy of this approach is 86%. It was the lowest compared to 95%, 95%, and 97% using methods 1, 2, and 3, respectively. The performance matrices were used are accuracy, precision, recall, and f1-score. The formulae used to calculate each performance matrix are given in Eqs. (5)–(8), respectively.

Figure 10: Vector representation of our dataset using pretrained model in spacy
4.3.1 Method 1: Using the Default SVM Configuration
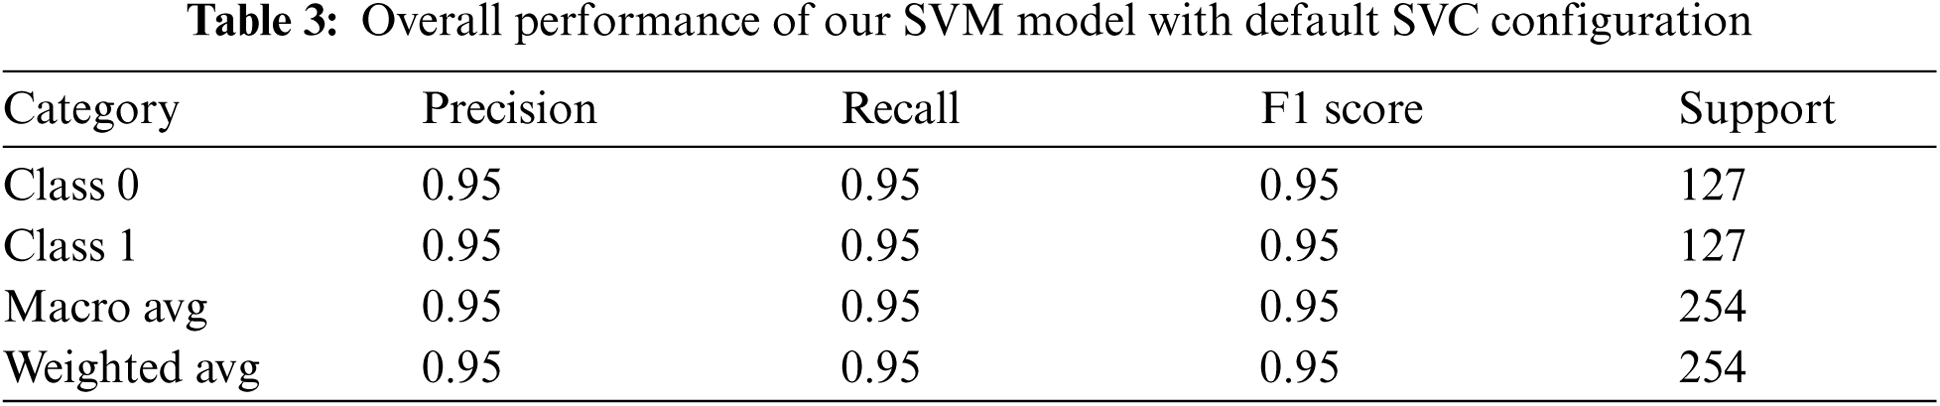
Here, we used the SVM with a default value for each parameter (C = 1, gamma = scale, kernel = rbf). The model was efficient enough to classify both domains, as shown in Fig. 11. The test was performed on 254 data elements, 127 from each class. An overall accuracy of 95% was achieved using this method. The results of measuring accuracy, precision, recall, and f1 score are given in Tab. 3.

Figure 11: Confusion matrix using SVC with default configuration
4.3.2 Method 2: Using SVM with Polynomial Kernel
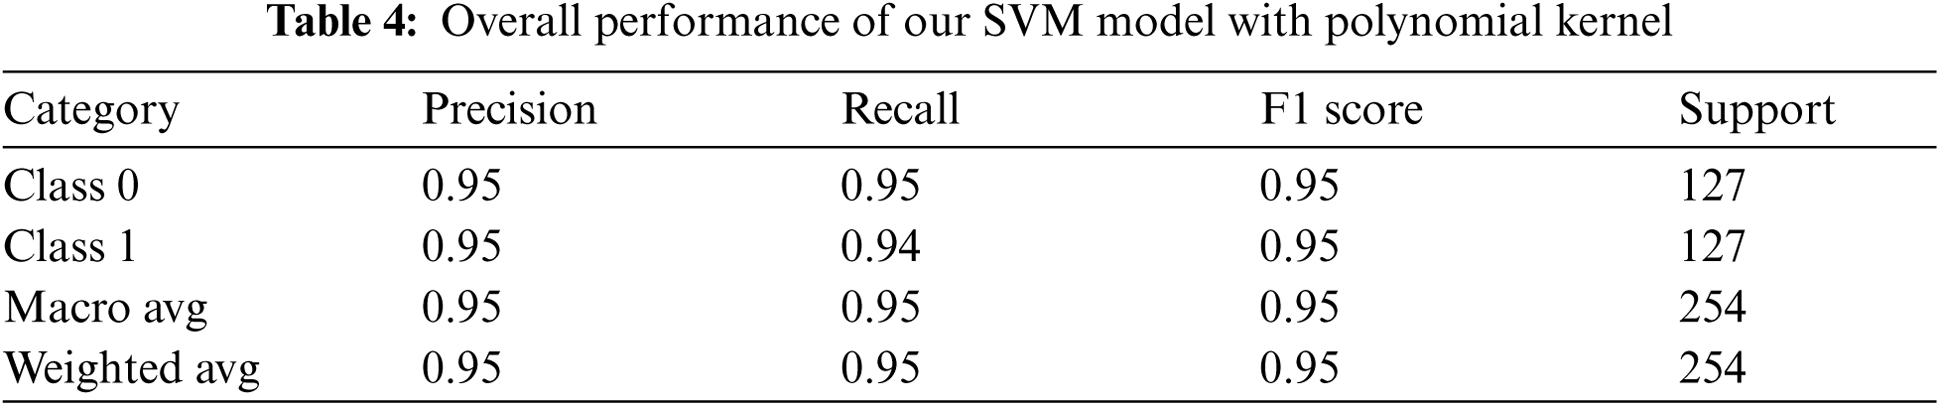
Using this approach, we modeled our classifier with a polynomial (poly) kernel function while taking the default values for the remaining parameters. This test was also performed on 254 data elements with 127 elements from each class. The overall result was quite similar to that obtained using method 1, as shown in Fig. 12. The results of measuring accuracy, precision, recall, and f1 score are given in Tab. 4.

Figure 12: Confusion matrix after using SVC with polynomial kernel
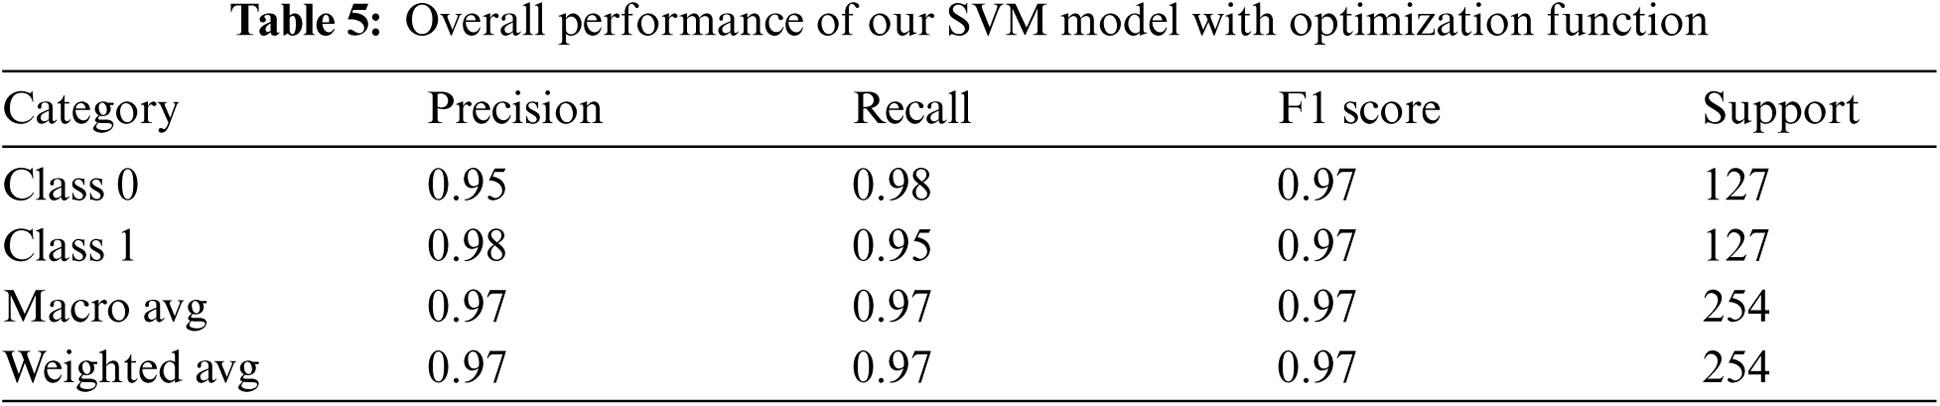
4.3.3 Method 3: Using Optimization Function
Here, we used the cross-validation function called “GridSearchCV( )” from the sklearn library to help our model optimally fit our training dataset. This was achieved by looping through predefined hyperparameters and obtaining an optimal value for each parameter. Our hyperparameters were {‘C': [0.5, 1, 10, 20, 30, 40, 50, 60, 70, 80, 90, 100], ‘gamma': [‘scale’, 1, 0.1, 0.01, 0.001, 0.0001], ‘kernel': [‘linear’, ‘poly’, ‘rbf’, ‘sigmoid’]} with the scoring matrix set to be “accuracy”. The size of the test dataset remained the same as that of the above methods. The outcome was more satisfactory compared to the aforementioned approaches, as shown in Fig. 13. The model was slightly better at understanding data from suspected piracy sites. Furthermore, 97% of the overall accuracy was achieved using this approach. The results of measuring accuracy, precision, recall, and f1 score are given in Tab. 5.

Figure 13: Confusion matrix after using optimization function
The graph, as shown in the Fig. 14, summarizes comparison of the accuracy, precision, recall, and F1-score values when using the SVM classifier with different parameter configurations.
In general, in the automated detection of suspected piracy websites, two approaches have been utilized so far, internet traffic analysis and webpage feature analysis [2,4–6]. However, as for the dynamic and adaptive nature of those websites, it is important to use these two approaches in aggregation for a better outcome. In this study, we conducted our research focusing on the webpage feature analysis approach, particularly analysis of Ad banners posted on various pirated and non-pirated websites. Even though there are some previous studies in this regard, none of them have used machine learning techniques. Our experimental result, conducted on data collected from various websites over time, showed the promise of using machine learning technique to overcome the aforementioned challenges. The limitation with this study, however, is that the experimental analysis was performed on a relatively smaller dataset. We believe that having a larger dataset will help improve the outcome in two ways. The first is to improve the representation of our data set in vector space, and the second is to enhance our classifier model by allowing us to apply more complex deep learning algorithms such as LSTM (long-short term memory) and BIRT (bidirectional encoder representations).

Figure 14: Summary of the experimental results
After analyzing the negative impact and dynamic nature of websites that are involved in the act of copyright infringement, we proposed in this paper a machine learning-based technique that can intelligently analyze and extract meaningful features from Ad banners and effectively categorize those Ad banners to determine whether they belong to suspected piracy sites. Due to the size and nature of our dataset, we chose SVM as our classifier model. As we already had a labeled dataset, we needed a supervised machine learning model for efficient classification operation. Again, compared to the deep learning models, SVM works well when the dataset is relatively small. Additionally, compared to the naïve Bayes model, SVM tries to find the best margin that separates the two classes and thus better reduces the risk of error due to domain overlapping. In general, the proposed technique involves three major steps. The first step is data collection, which includes the crawling of Ad banners from the target webpages and extraction of words or sentences existing on the Ad banners. The second step is data processing and feature extraction, which includes data cleaning using preprocessing operations and applying the word2vec algorithm for vectorization. The final step is classification, which includes building, training, and testing a classifier model that can classify between Ad banners collected from suspected piracy sites and those from normal or legitimate sites. Performance was evaluated by applying the proposed technique to 1015 Ad banners collected from 98 suspected piracy websites and 90 normal or legitimate websites. We used various approaches to model our SVM classifier and finally achieved an accuracy of 97 % using an SVM with optimization function. We believe that this work will be very useful as an input for effective piracy site detection processes. In the future, we plan to collect more dataset and apply various advanced deep learning models to enhance the research work.
Funding Statement: This research project was supported by the Ministry of Culture, Sports, and Tourism (MCST) and the Korea Copyright Commission in 2021(2019-PF-9500).
Conflicts of Interest: The authors declare that they have no conflicts of interest to report regarding the present study.
1. D. Dey, A. Kim and A. Lahiri, “Online piracy and the ‘longer arm’ of enforcement,” Management Science, vol. 65, no. 3, pp. 1173–1190, 2019. [Google Scholar]
2. European Union Intellectual Property Office: Office for Harmonization in The Internal Market, “Digital Advertising on Suspected Infringing Websites,” 2016. [Online]. Available: https://euipo.europa.eu/ohimportal/documents/11370/80606/Digital+Advertising+on+Suspected+Infringing+Websites. [Google Scholar]
3. Google, “How Google Fights Piracy,” 2018. [Online]. Available: https://www.blog.google/documents/27/How_Google_Fights_Piracy_2018.pdf. [Google Scholar]
4. E. Kim and J. Kwak, “Intelligent piracy site detection technique with high accuracy,” KSII Transactions on Internet and Information Systems (TII), vol. 15, no. 1, pp. 285–301, 2021. [Google Scholar]
5. S. Choi and J. Kwak, “Feature analysis and detection techniques for piracy sites,” KSII Transactions on Internet and Information Systems (TII), vol. 14, no. 5, pp. 2204–2217, 2020. [Google Scholar]
6. T. Matthew and B. Thomas, “Detecting video piracy with machine learning,” 2019. [Online]. Available: https://www.nctatechnicalpapers.com/Paper/2019/2019-detecting-video-piracy-with-machine-learning/download. [Google Scholar]
7. T. Mikolov, W. Yih and G. Zweig, “Linguistic regularities in continuous space word representations,” in Proc. of NAACL-HLT, Atlanta, Georgia, USA, pp. 746–751, 2013. [Google Scholar]
8. T. Mikolov, K. Chen, G. Corrado and J. Dean, “Efficient estimation of word representations in vector space,” in ICLR Workshop Papers, Mountain View, CA, USA, 2013. [Google Scholar]
9. N. Usman, R. Imran, K. Khalid and P. Mukesh, “A comprehensive survey on word representation models: From classical to state-of-the-art word representation language models,” ACM Transactions on Asian and Low-Resource Language Information Processing, vol. 20, no. 5, pp. 1–35, 2021. [Google Scholar]
10. J. Lilleberg, Y. Zhu and Y. Zhang, “Support vector machines and word2vec for text classification with semantic features,” in 2015 IEEE 14th Int. Conf. on Cognitive Informatics & Cognitive Computing (ICCI*CCBeijing, China, 2015, pp. 136–140. [Google Scholar]
11. T. Mikolov, I. Sutskever, K. Chen, G. Corrado and J. Dean, “Distributed representations of words and phrases and their compositionality,” in Neural Information Processing Systems (NeurIPS), Texas, USA, pp. 3111–3119, 2013. [Google Scholar]
12. N. Cristianini and J. Shawe-Taylor, “Support Vector Machine,” in An Introduction to Support Vector Machines: and other Kernel-Based Learning Methods, New York, NY, USA: Cambridge University Press, cha. 6, sec. 6.1, pp. 93–122, 2000. [Google Scholar]
13. J. Cervantes, F. Garcia-Lamont, L. Rodríguez-Mazahua and A. Lopez, “A comprehensive survey on support vector machine classification: Applications, challenges and trends,” Neurocomputing, vol. 408, pp. 189–215, 2020. [Google Scholar]
14. E. Leopold and J. Kindermann, “Text categorization with support vector machines. How to represent texts in input space?” Machine Learning, vol. 46, no. 1–3, pp. 423–444, 2002. [Google Scholar]
15. E. Alpaydin, “Kernel Machines,” In Introduction to Machine Learning, 2nd ed., London, England: The MIT press, pp. 309–341, 2010. [Google Scholar]
16. C. Savas and F. Dovis, “The impact of different kernel functions on the performance of scintillation detection based on support vector machines,” Sensors, vol. 19, no. 23, pp. 5219–5235, 2019. [Google Scholar]
17. “Alexa Top 500 Global Sites,” 2021. [Online]. Available: http://www.alexa.com/topsites [Accessed: 22-Jun-2021]. [Google Scholar]
18. Google, “Google Transparency Report,” 2021. [Online]. Available: https://transparencyreport.google.com/?hl=en [Accessed: 20-Jun-2021]. [Google Scholar]
19. Google, “Cloud Vision API-Detect Text in Images” 2021. [Online]. Available: https://cloud.google.com/vision/docs/ocr, 2021. [Accessed: 05-July-2021]. [Google Scholar]
20. K. Zubrinic, M. Milicevic and I. Zakarija, “Comparison of naive Bayes and SVM classifiers in categorization of concept maps,” International Journal of Computers, vol. 7, no. 3, pp. 109–116, 2013. [Google Scholar]
21. F. Pedregosa, G. Varoquaux, A. Gramfort, V. Michel, B. Thirion et al., “Scikit-learn: Machine learning in python,” Journal of Machine Learning Research, vol. 12, pp. 2825–2830, 2011. [Google Scholar]
 | This work is licensed under a Creative Commons Attribution 4.0 International License, which permits unrestricted use, distribution, and reproduction in any medium, provided the original work is properly cited. |