DOI:10.32604/cmc.2022.023195
| Computers, Materials & Continua DOI:10.32604/cmc.2022.023195 | |
| Article |
Evolution of Desertification Types on the North Shore of Qinghai Lake
1School of Geographical Sciences, Nanjing University of Information Science & Technology, Nanjing, 210044, China
2College of Hydrology and Water Resources, Hohai University, Nanjing, 210098, China
3School of Environmental Science & Engineering, Nanjing University of Information Science & Technology, Nanjing, 210044, China
4Public Meteorological Service Center, China Meteorological Administration, Beijing, 100081, China
5Center for Wind and Solar Energy Resources, China Meteorological Administration, Beijing, 100081, China
6China Huaneng Group Co., Ltd., Beijing, 100036, China
7China Huaneng Group Cleaning Energy Technology Academy Co., Ltd., 100081, China
8Faculty of Science, The University of Auckland, 1010, New Zealand
*Corresponding Author: Yanbo Shen. Email: shenyb@cma.gov.cn
Received: 30 August 2021; Accepted: 25 October 2021
Abstract: Land desertification is a widely concerned ecological environment problem. Studying the evolution trend of desertification types is of great significance to prevent and control land desertification. In this study, we applied the decision tree classification method, to study the land area and temporal and spatial change law of different types of desertification in the North Bank of Qinghai Lake area from 1987 to 2014, based on the current land use situation and TM remote sensing image data of Haiyan County, Qinghai Province, The results show that the area of mild desertification land and moderate desertification land in the study area has decreased, while the area of severe desertification land and extreme desertification land has increased significantly in the past 30 years. The area of desertification land decreased by 4.02 km2, of which the area of mild and moderate desertification land decreased by 39.73 km2 and 36.8 km2 respectively, and the area of severe and extreme desertification land increased by 32.78 km2 and 39.73 km2 respectively. As for the mutual transformation relationship, the transformation from severe desertification land to extreme desertification land is the main, and the junction of severe desertification land and extreme desertification land is the sensitive area of transformation. In the north shore of Qinghai Lake, the sandy land tends to expand eastward. The research provides reference basis for local land desertification monitoring, and has a great guidance for local effective land desertification and soil and water conservation.
Keywords: Qinghai Lake; desertification; evolution mechanism; remote sensing
Desertification is one of the serious ecological, social, and economic problems currently faced by arid and semi-arid regions worldwide [1,2]. It tremendously affects and disturbs the sustainable development of regional economy and society [3]. With global changes and regional economic and social development, the evolution mechanism and trends of regional desertification have become more complex [4–6]. Therefore, the classification and dynamic monitoring of regional desertification, and the study of its evolutionary laws, driving mechanisms, and so on, have also become the hotspots and key areas of academic research [1,7].
Since the 1990s, with the development of “3S” technology, regional desertification research has been further developed [8]. Meanwhile, the development of image analysis and intelligent algorithm also paves the way for the wide application of “3S” technology [9–11]. High-precision remote sensing images and spatial statistical analysis technology allow for the fine monitoring, evaluation, and classification of regional desertification [12,13]. Based on spectral hybrid analysis, to monitor desertification land changes, the difference between land surface temperature and normalized difference vegetation index (NDVI) is calculated to study and analyze the ecosystem of desertified areas [14,15]. Thematic indexes, such as the normalized exposure index, are widely used in classifying desertification. However, for remote sensing images of different scales, the accuracy of the classification results obtained by using thematic index may not be highly satisfactory [3,16]. Therefore, some scholars used multi-temporal moderate-resolution imaging spectroradiometer remote sensing data to dynamically monitor the desertification change in Egypt by adopting the spatio-temporal dynamic index of vegetation coverage [9,11,17]. The studies above unveiled that many indicators can reflect desertification. However, in the application of remote sensing monitoring, many desertification indicators must be selected, combined with the characteristics of land use in the study area, and an appropriate indicator system is selected to extract desertification information [3,13,14].
At present, the research on desertification in Qinghai Lake area focuses on the analysis of the spatial distribution pattern, the interdecadal changes of desertified land, and the evaluation of the stability and sensitivity of the desertification ecosystem [18,19]. However, studies on the evolution mechanism of desertification remain relatively scant. Thus, this paper mainly aims to quantitatively analyze the evolution mechanism and law of desertification on the north shore of Qinghai Lake using high-resolution images and “3S” technology. This paper might help us understand the development trend of desertification land in Qinghai Lake and provide decision support for preventing and controlling the desertification in Qinghai Lake.
The remainder of this paper is organized as follows. Section 2 describes the related data sources and processing method. Next, Section 3 demonstrates and discusses the research results in detail, and finally, Section 4 presents the conclusions.
2 Data Sources and Preprocessing
The study area is located in the northeast of Qinghai Tibet Plateau, Haiyan County, Qinghai Province, China (longitude 99°10′E–101°10′E, latitude 36°18′N–37°30′N, and altitude −3194–5174 m above MSL). The study area had a plateau continental climate, with an annual mean temperature of −3.4–6.3°C, annual sunshine hours of 2430–3330 h, and an annual evaporation with 1300–2400 mm. The annual average wind speed is 3.2–4.4 m/s, the gale days are 10.8–13.2 d, and the dust days are 10.8–13.2 d. The annual precipitation in the study area is 200–445 mm. Most of the rainfall is concentrated in May to September, and the rainfall is hot in the same period.
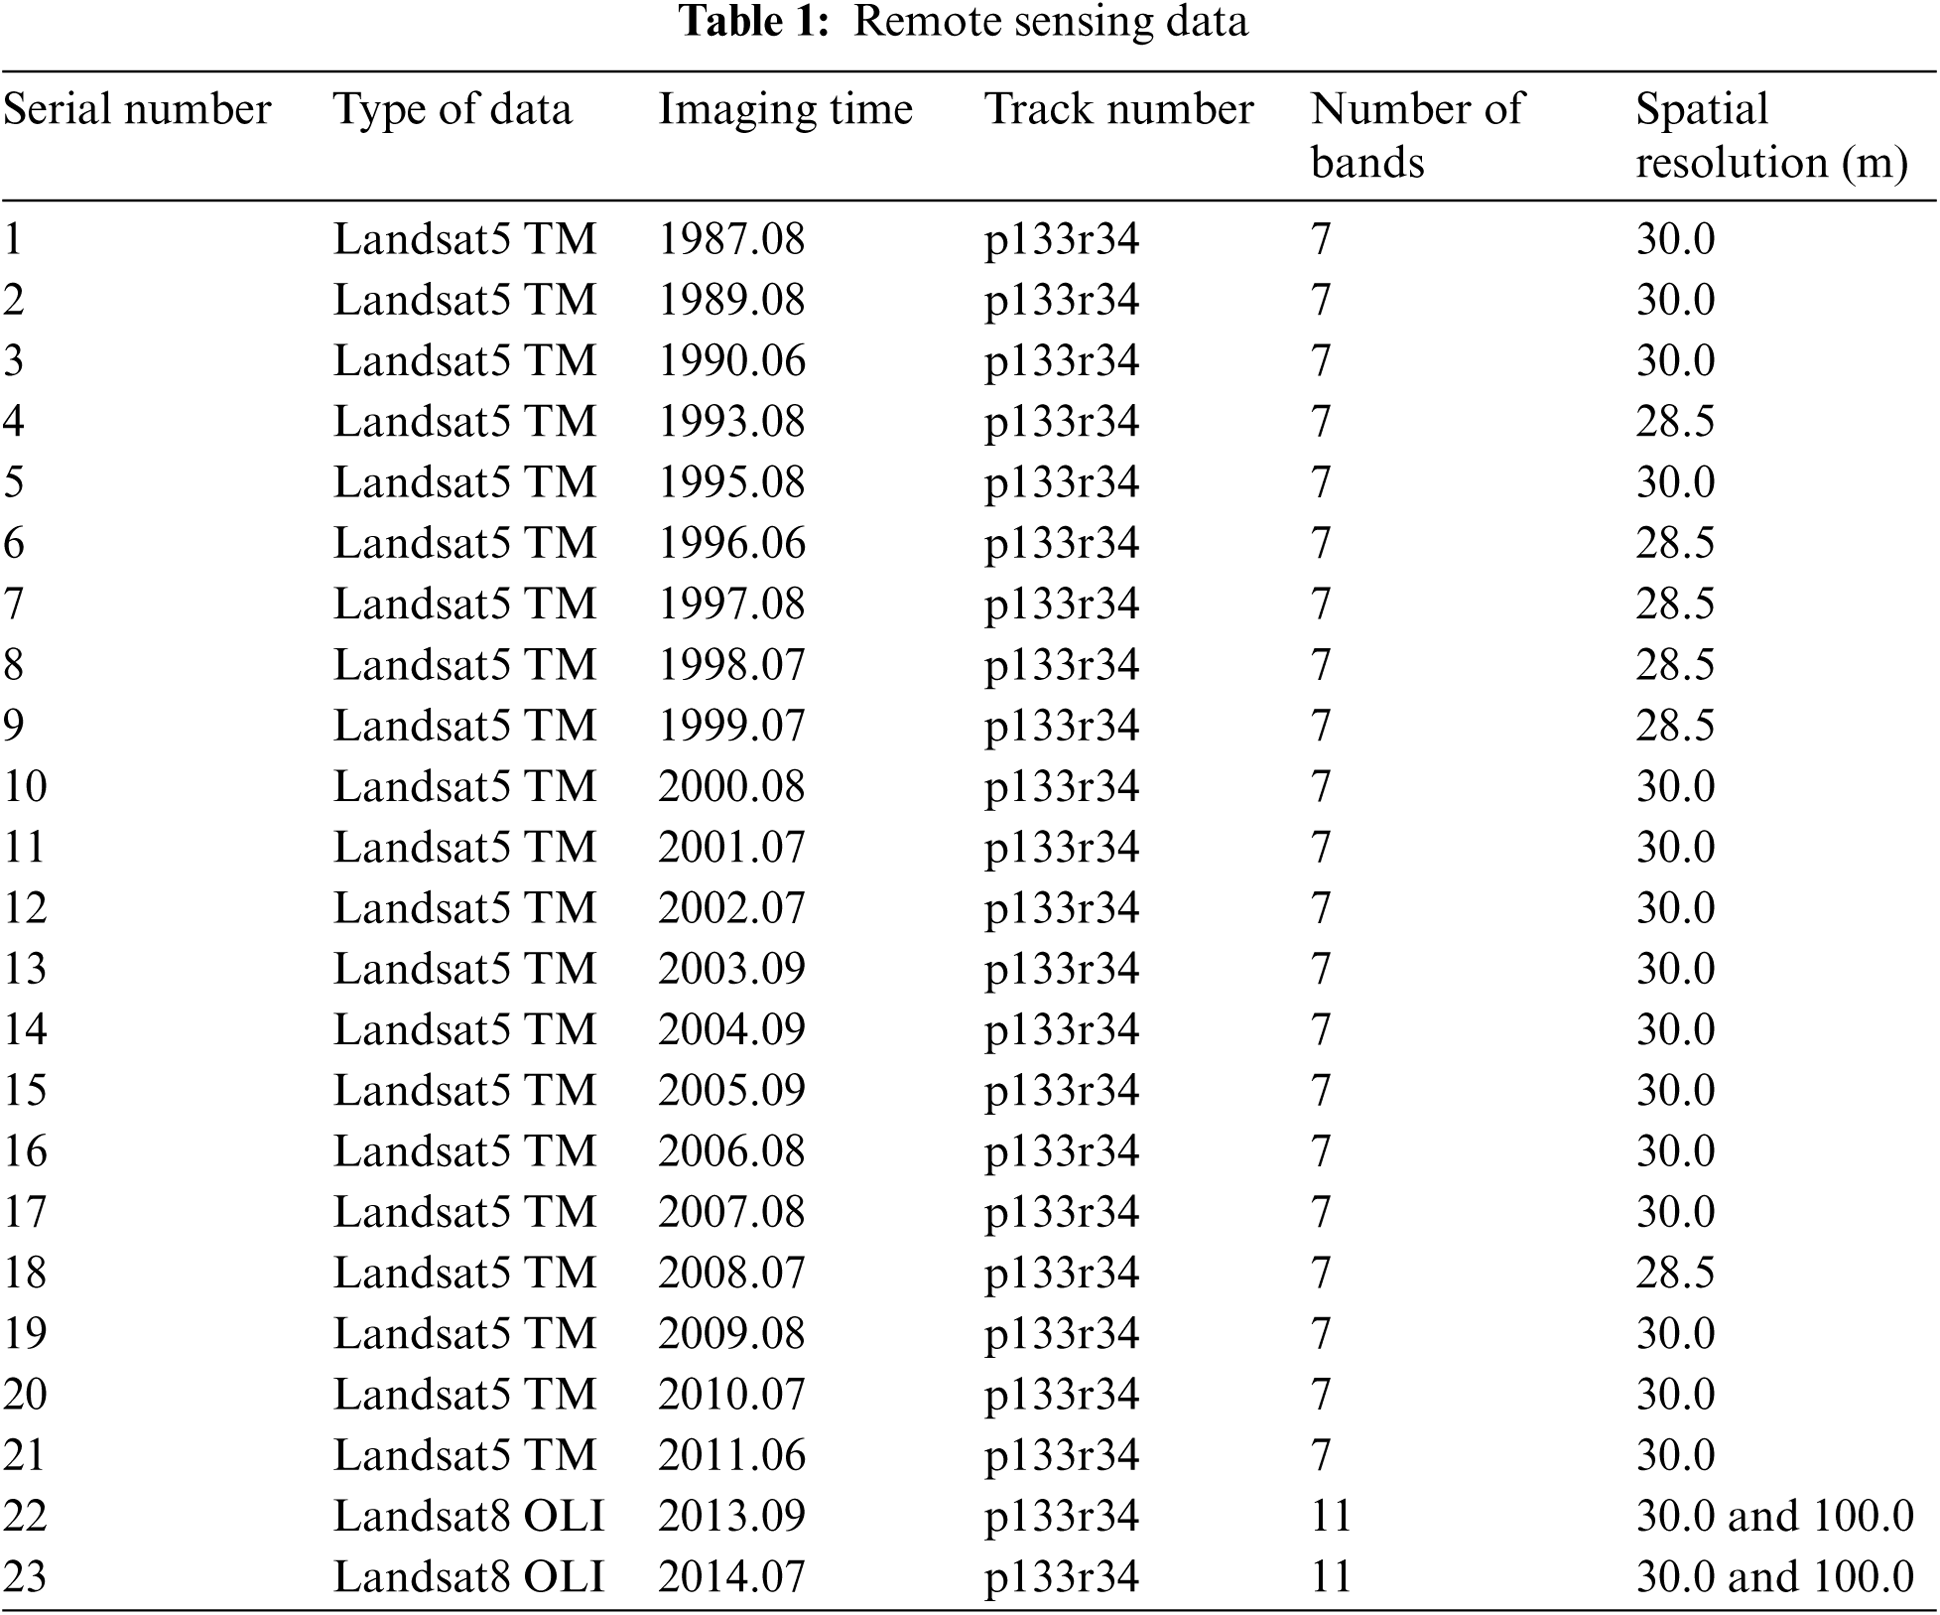
The data used in this paper are mainly remote sensing image data, including Landsat 5 TM image data and Landsat 8 OLI and TIRS image data, with the time span from 1987 to 2014. To better distinguish different types of surface features and monitor the vegetation coverage in the area, the selected image data are mainly concentrated from June to September, because during this period, the snow melts, the vegetation grows well, and the thermal radiation of various surface features significantly differ. The background information and specific parameters of remote sensing image are presented in Tab. 1.
2.3 Research Method Pretreatment
During remote sensing imaging, various systematic and random errors will occur. Before the analysis and information extraction of remote sensing image, the remote sensing image must be preprocessed, including radiometric calibration, geometric correction, and atmospheric correction. In this study, the gain and bias parameters given by USGS are used for image radiometric correction, which was calculated by the following equation:
where L is the radiance, DN is the pixel brightness value of the image, G is the image gain value, and B is the image bias value. The calibration parameters of Landsat 8 image are queried in the MTL file attached to the image.
In geometric correction, taking TM L4 products as the benchmark, quadratic polynomial and nearest neighbor resampling methods are used for geometric correction of the image. In this study, 55 geometric correction points are selected, all of which are evenly distributed on the image, and the error is controlled within one pixel.
In this study, the environment for visualizing images software with fast line-of-sight atmospheric analysis of spectral hypercubes module for atmospheric correction is used. The relevant parameters can be obtained from the MTL file attached to the image.
2.4 Desertification Information Extraction
NDVI is a comprehensive reflection of vegetation type, growth status, and cover morphology in a unit pixel. When the pixel is completely covered by vegetation, the vegetation index is 1; when no vegetation cover exists, the NDVI value is between −1 and 0, such as water, desert, and so on; If the vegetation fails to cover the whole pixel completely, the NDVI value is between 0 and 1, and this kind of pixel is called mixed pixel. NDVI was given as:
where NIR and R are near infrared band and red band of image, respectively.
In this study, the land cover types are divided into the following seven categories: water body, severe desertification land, severe desertification land, moderate desertification land, mild desertification land, non-desertification land, and others (including cloud and snow). NDVI can well distinguish vegetation area and non-vegetation area. Vegetation coverage can well distinguish non desertification land, mild desertification land, moderate desertification land, and severe desertification land, whereas surface temperature can well distinguish water body and severe desertification land, albedo can separate cloud and snow from non-vegetation area, soil moisture and modified soil adjusted vegetation index can further distinguish the desert, water, cloud, and snow in the areas with no vegetation or less vegetation. On the basis of the above characteristics, the decision tree is constructed, and the specific process is shown in Fig. 1.
3.1 Temporal and Spatial Changes of Desertified Land
On the basis of the interpretation of the desertification results, the desertification vector diagrams of 1990 and 2000, 2000 and 2009, and 2009 and 2014 were superimposed and calculated to obtain the years 1990 to 2000, 2000 to 2009, and the transfer matrix of various types of desertified land in the three periods from 2009 to 2014 analyzes the evolution mechanism of different types of desertified land in two different time dimensions: interdecadal and interannual.
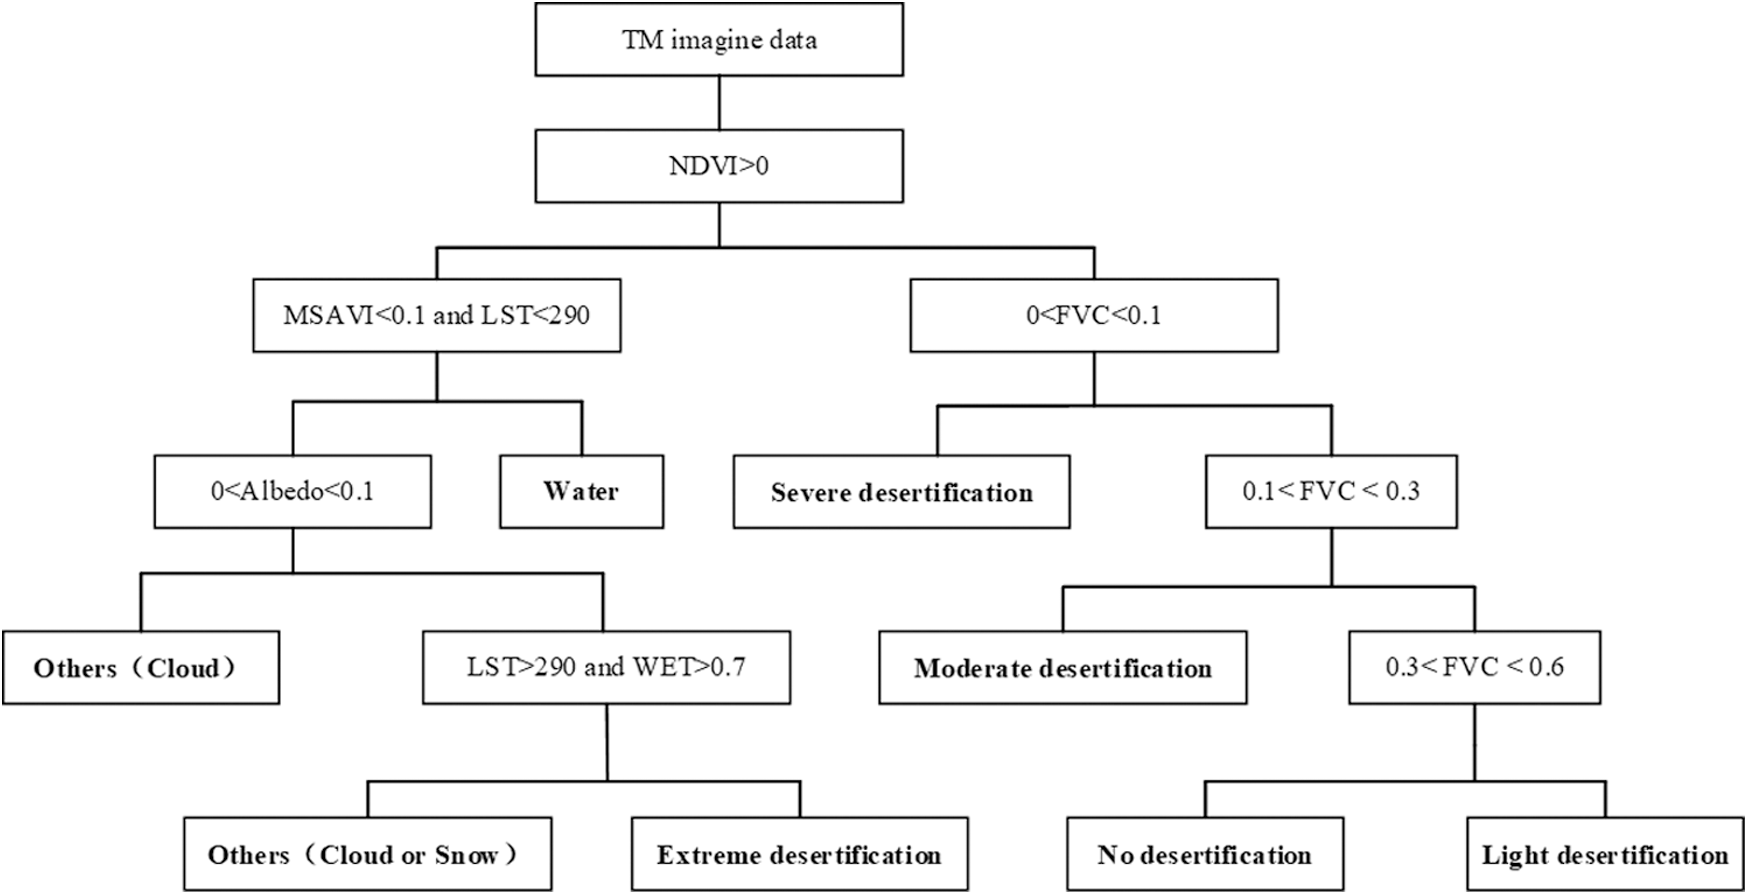
Figure 1: Decision tree classification flow chart
3.1.1 Spatiotemporal Evolution Mechanism of Desertified Land from 1990 to 2000
Tab. 2 and Fig. 2 show that the area of lightly and moderately desertified land in the lake basin area of Haiyan County decreased significantly from 1990 to 2000, whereas the area of severely and extremely desertified land showed an increasing trend. Among them, moderately desertified land is mainly developed from undesertized land, with a conversion area of 43.11 km2, and the area of lightly desertified land converted to non-desertified land is 55.37 km2. The reduction of lightly desertified land mainly developed into moderately and severely desertified land, with conversion areas of 166.07 km2 and 68.98 km2, respectively. The areas of moderately and severely desertified lands that were reversed to lightly desertified land were 65.55 km2 and 24.04 km2, respectively. Only 39.47% and 34.85% of the former. The moderately desertified land is mainly developed into severely desertified land, with a conversion area of 222.16 km2. Severely desertified land is mainly developed into extremely desertified land, with a conversion area of 33.87 km2. The area of lightly desertified land developed into moderately and severely desertified land is greater than that of moderately and severely desertified land developed into lightly desertified land. In addition, the increase in the area of extremely desertified land mainly comes from moderately and severely desertified land: the area of non-desertified land developed into desertified land is 46.35 km2, and the area of desertified land converted to non-desertified land is 60.2 km2. Therefore, from 1990 to 2000, the total area of desertified land on the northern shore of Qinghai Lake District has increased, and the degree of desertification has increased. The order of desertification land changes from large to small is: extremely desertified land > severely desertified land > moderately desertified land > lightly desertified land.
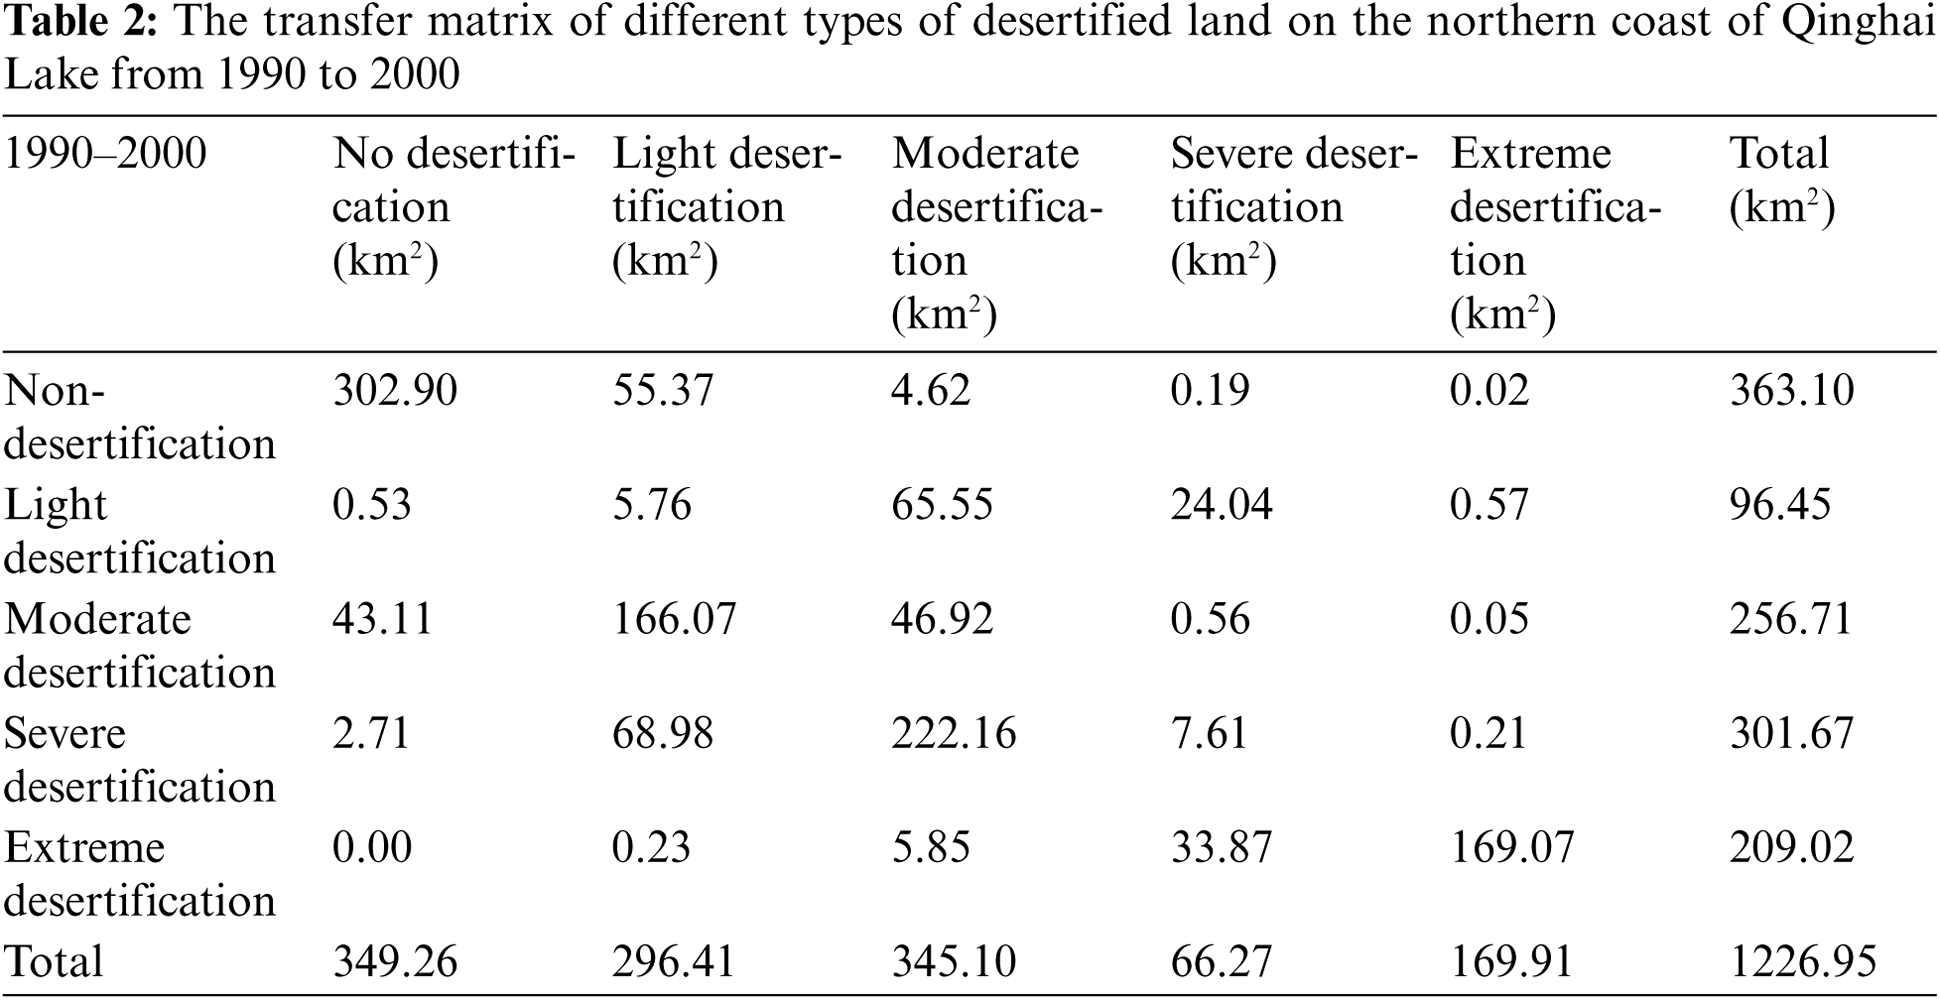
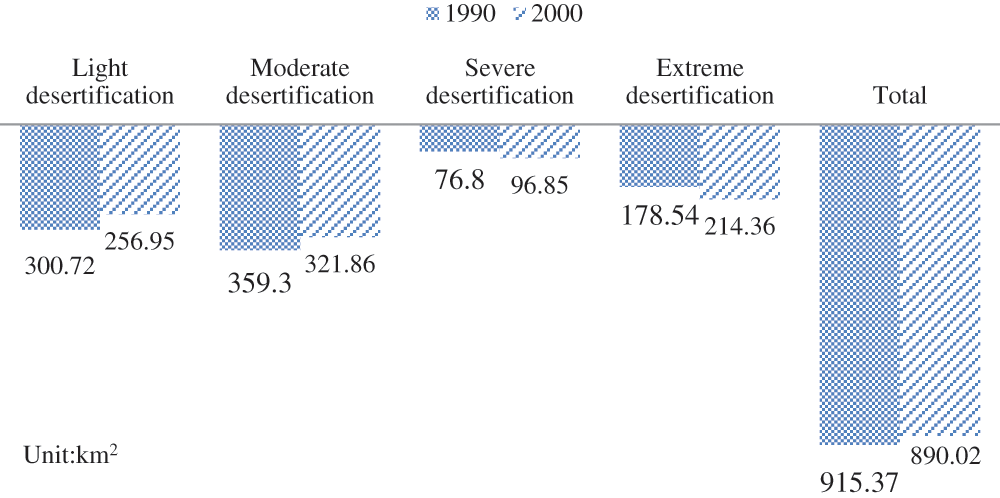
Figure 2: The evolution mechanism of different types of desertified land on the northern coast of Qinghai Lake from 1990 to 2000
3.1.2 Temporal and Spatial Evolution Mechanism of Desertified Land from 2000 to 2009
Tab. 3 and Fig. 3 exhibit that the area of lightly and moderately desertified land in the lake basin area of Haiyan County decreased significantly from 2000 to 2009, whereas the area of severely and extremely desertified land increased. Among them, the non-desertified land is mainly developed into lightly desertified land, with a conversion area of 24.82 km2, and the area of lightly desertified land developed into non-desertified land is 68.63 km2. Lightly desertified land is mainly developed into moderately desertified land, with a conversion area of 42.32 km2, and the area of moderately desertified land developed into lightly desertified land is 44.61 km2. Moderately desertified land is mainly developed into severely desertified land, with a conversion area of 37.98 km2. The area of severely desertified land developed into moderately desertified land is 30.47 km2, the latter being 80.23% of the former. Severely desertified land is mainly developed into severely desertified land, with a conversion area of 13.75 km2. The area of lightly desertified land developed into non-desertified land is greater than that of non-desertified land developed into lightly desertified land; the area of moderately desertified land developed into lightly desertified land is greater than that of lightly desertified land developed into moderately desertified land; the area of moderately desertified land developed into severely desertified land is larger than the area of severely desertified land developed into moderately desertified land. In addition, the area of non-desertified land developed into desertified land is 28.89 km2, whereas the area of desertified land developed into non-desertified land is 73.86 km2. Therefore, from 2000 to 2009, the total area of desertified land in the lake basin area of Haiyan County has decreased, and lightly and moderately desertified lands are in a state of reversal. However, severely and extremely desertified lands continue to expand further, and the degree of desertification has increased. The overall trend is deteriorating; the order of desertification land changes during this period is from large to small: extremely desertified land > severely desertified land > moderately desertified land > lightly desertified land.
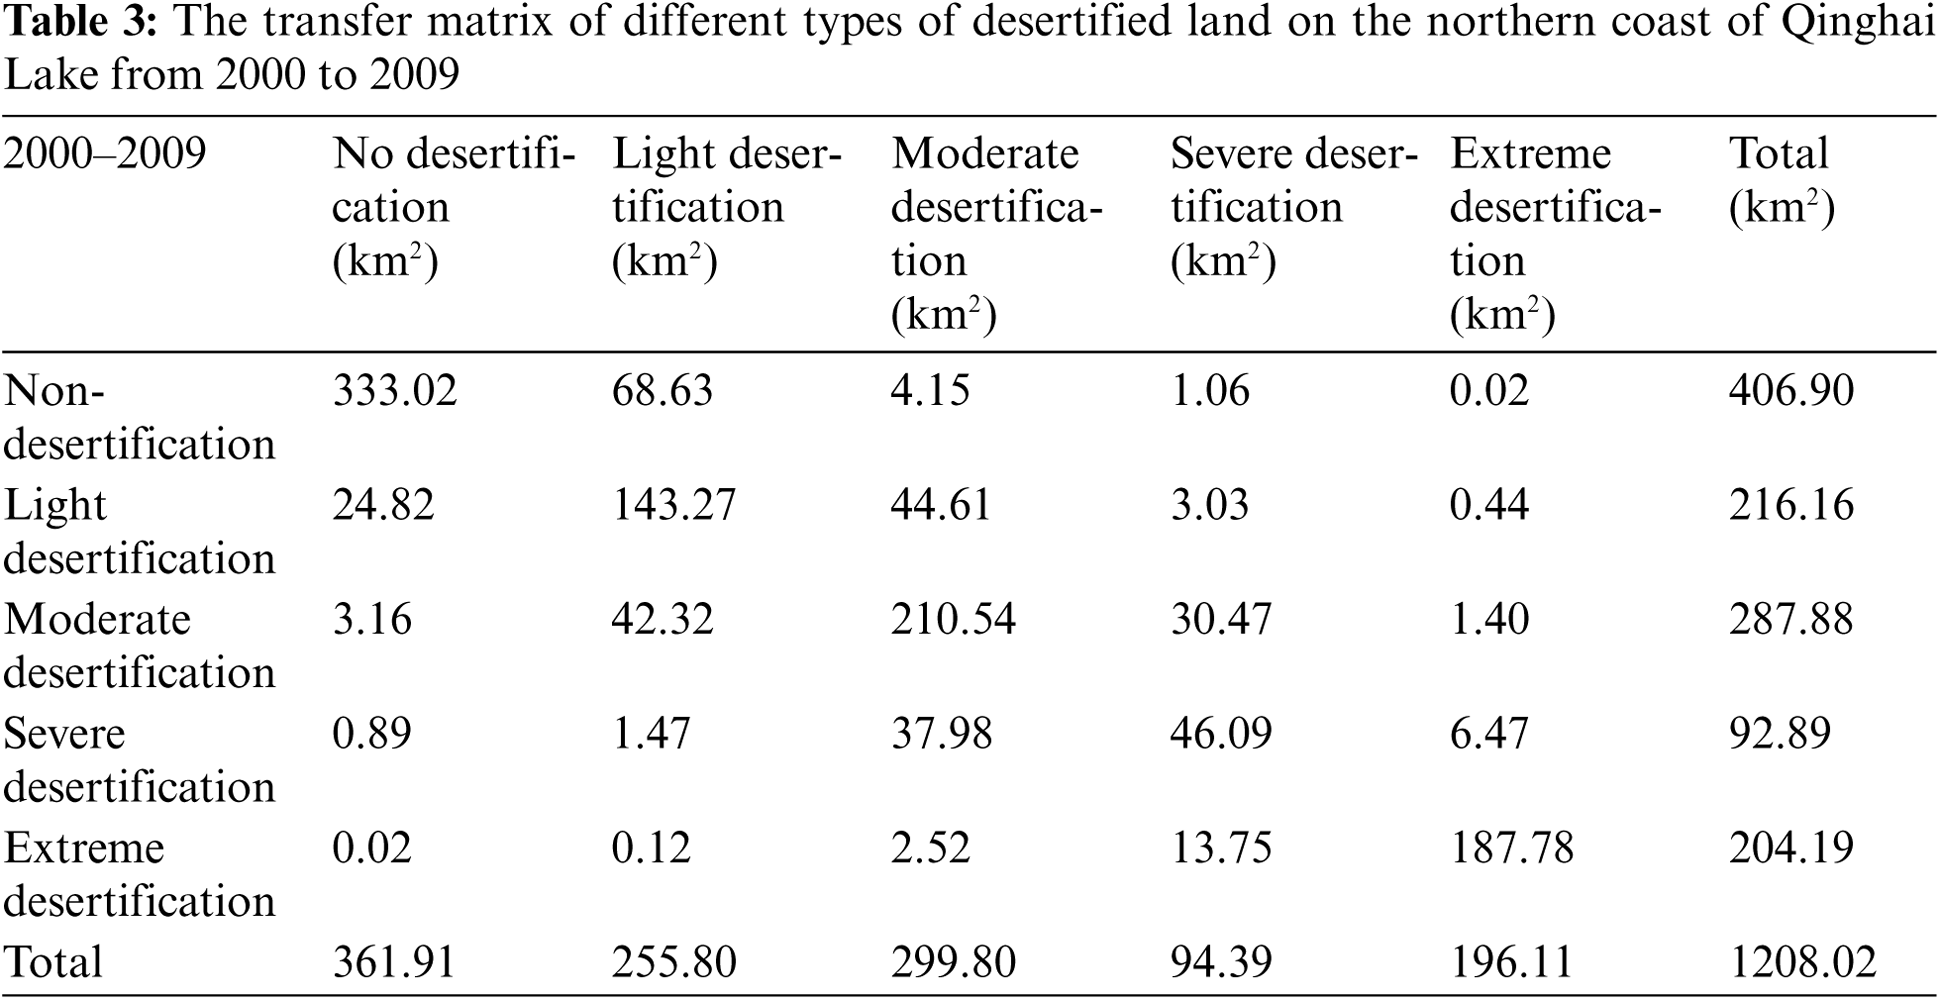
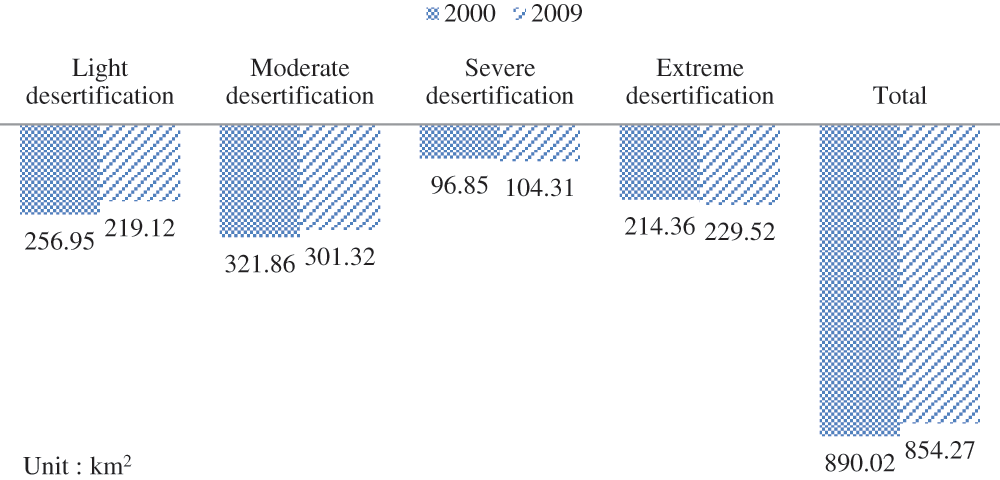
Figure 3: The evolution mechanism of different types of desertified land on the northern coast of Qinghai Lake in 2000 and 2009
3.1.3 Temporal and Spatial Evolution Mechanism of Desertified Land from 2009 to 2014
Tab. 4 and Fig. 4 present that the area of moderately desertified land on the northern coast of Qinghai Lake decreased significantly from 2009 to 2014, whereas the area of severely and extremely desertified land continues to increase, whereas the area of lightly desertified land has not changed much. Among them, the non-desertified land is mainly developed into lightly desertified land, with a conversion area of 32.2 km2, and the area of lightly desertified land developed into non-desertified land is 33.75 km2. Lightly desertified land is mainly developed into moderately desertified land, with a conversion area of 34.2 km2, and the area of moderately desertified land developed into lightly desertified land is 46.52 km2. Moderately desertified land is mainly developed into severely desertified land, with a conversion area of 51.5 km2. The area of severely desertified land developed into moderately desertified land is 23.29 km2, the latter being 45.22% of the former. Severely desertified land is mainly developed into extremely desertified land, with a conversion area of 17.56 km2. The area of lightly desertified land developed into non-desertified land is greater than that of non-desertified land developed into lightly desertified land; the area of moderately desertified land developed into lightly desertified land is greater than that of lightly desertified land developed into moderately desertified land. The area of land; the area of moderately desertified land developed into severely desertified land is larger than the area of severely desertified land developed into moderately desertified land. In addition, the area of non-desertified land developed into desertified land is 40.55 km2, and the area of desertified land developed into non-desertified land is 37.2 km2. Therefore, from 2009 to 2014, the total area of desertified land on the north shore of Qinghai Lake did not change significantly, but the area of severely and extremely desertified land continues to increase, the degree of desertification continues to increase, and the deterioration trend persists. In the past five years, the order of desertification land changes from large to small is as follows: severely desertified land > extremely desertified land > lightly desertified land > moderately desertified land.
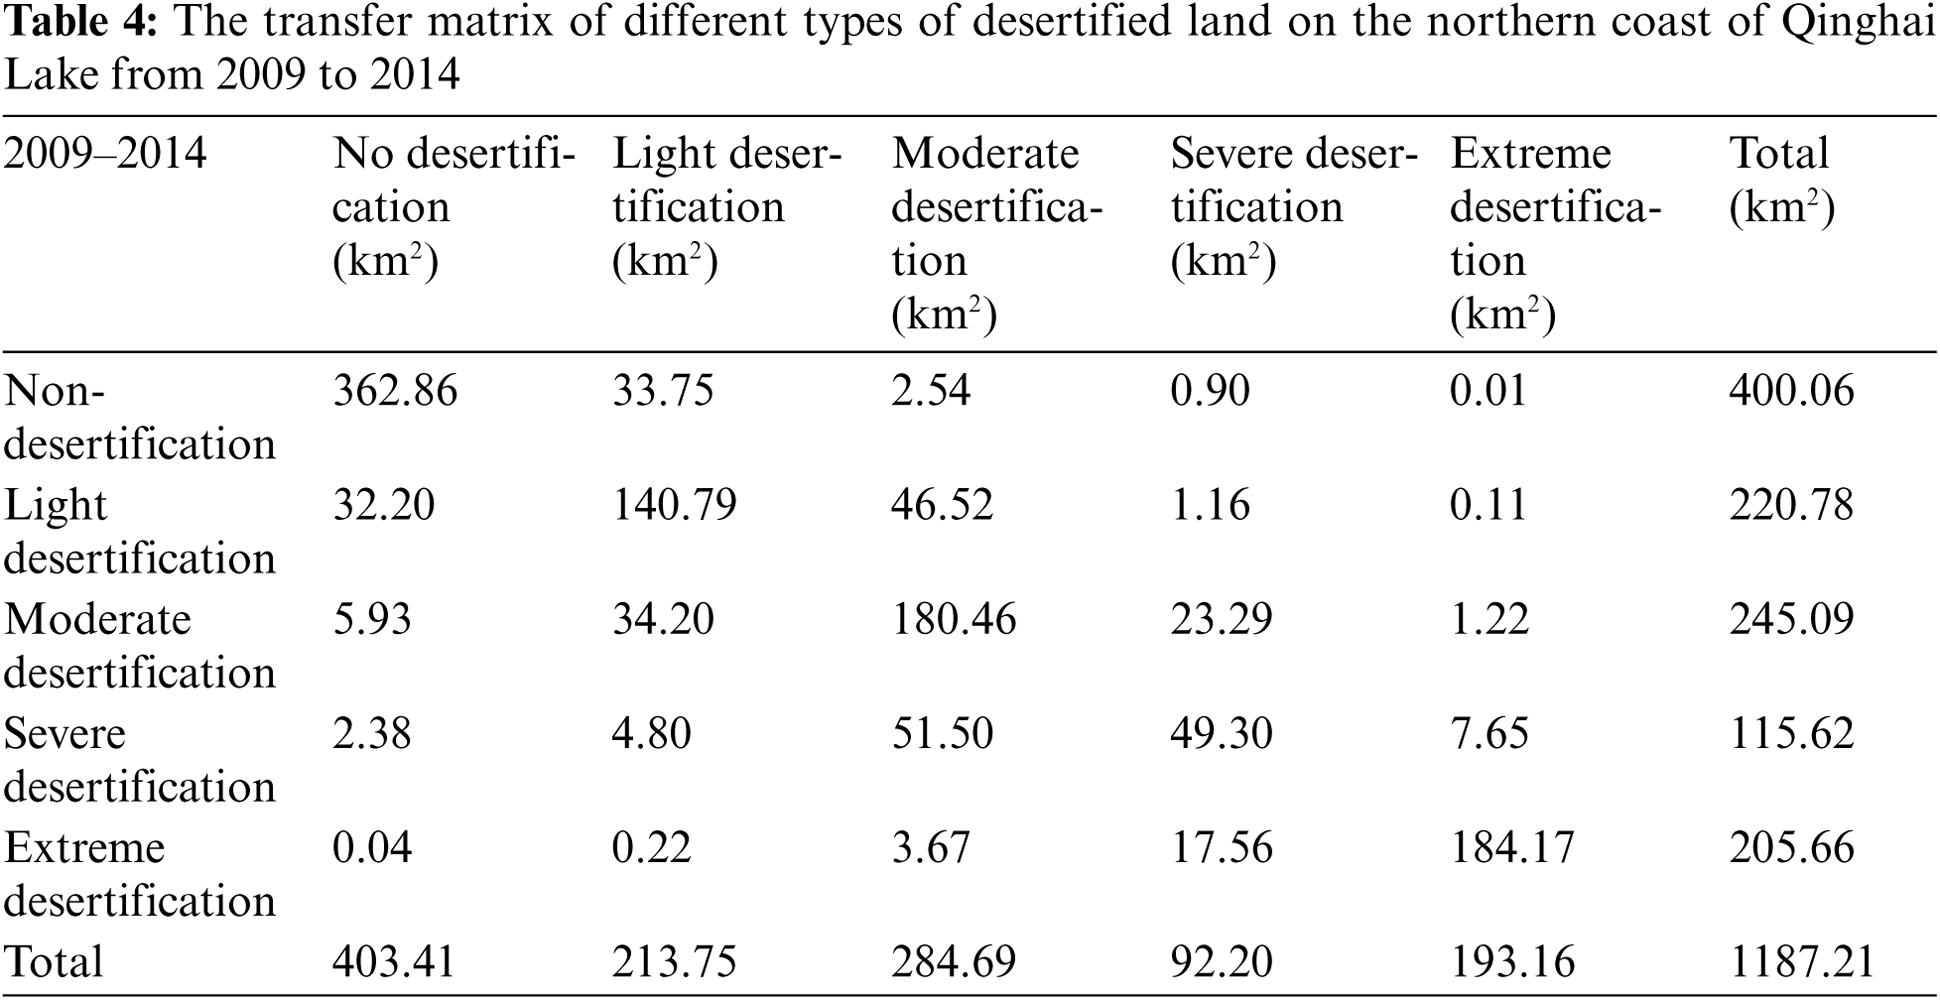
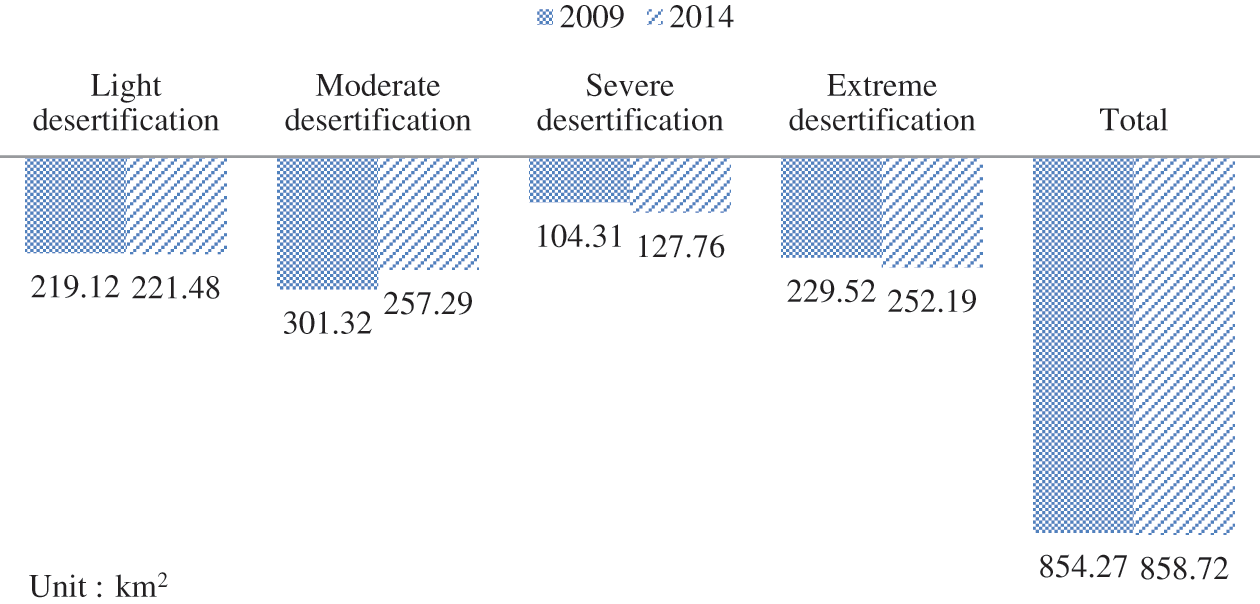
Figure 4: Evolution mechanism of different types of desertified land on the northern coast of Qinghai Lake in 2009 and 2014
3.2 Spatial Change Trend of Desertified Land
On the basis of the interpretation results, remote sensing software was used to analyze the spatial changes of different types of desertified land from 1987 to 2014. The results are shown in Fig. 5. The classification result map unveils that the spatial distribution of different types of desertified lands on the northern coast of Qinghai Lake is extremely obvious. The distribution from west to east is followed by extremely desertified land, severely desertified land, lightly and moderately desertified land, and non-desertified land.
Fig. 5 presents that from 1987 to 2014, the lightly and moderately desertified land on the northern coast of Qinghai Lake had a decreasing trend, whereas the severely and extremely desertified land had an increasing trend. Given that a part of lightly and moderately desertified land is being reversed into non-desertified land, this part of lightly and moderately desertified land is mainly distributed in the northern part of the study area. The lightly and moderately desertified land located in the central and southern part of the study area is developing into severely desertification land. The junction of lightly, moderately, and severely desertified land is a sensitive area for further development of desertification. The most significant contribution to extremely desertified land is severely desertified land, and the junction of the two is a sensitive area for further development of desertification. In addition, extremely desertified land has also appeared along the Qinghai Lake. The reason for this evolution trend is that, on the one hand, the water level of Qinghai Lake continues to drop, causing the original sand belt at the bottom of the lake to emerge, thereby expanding the area of desertification [19–21]; on the other hand, it may be caused by global climate change or regional microclimate changes [4], [22–24]. The driving mechanism will be further discussed in later research.
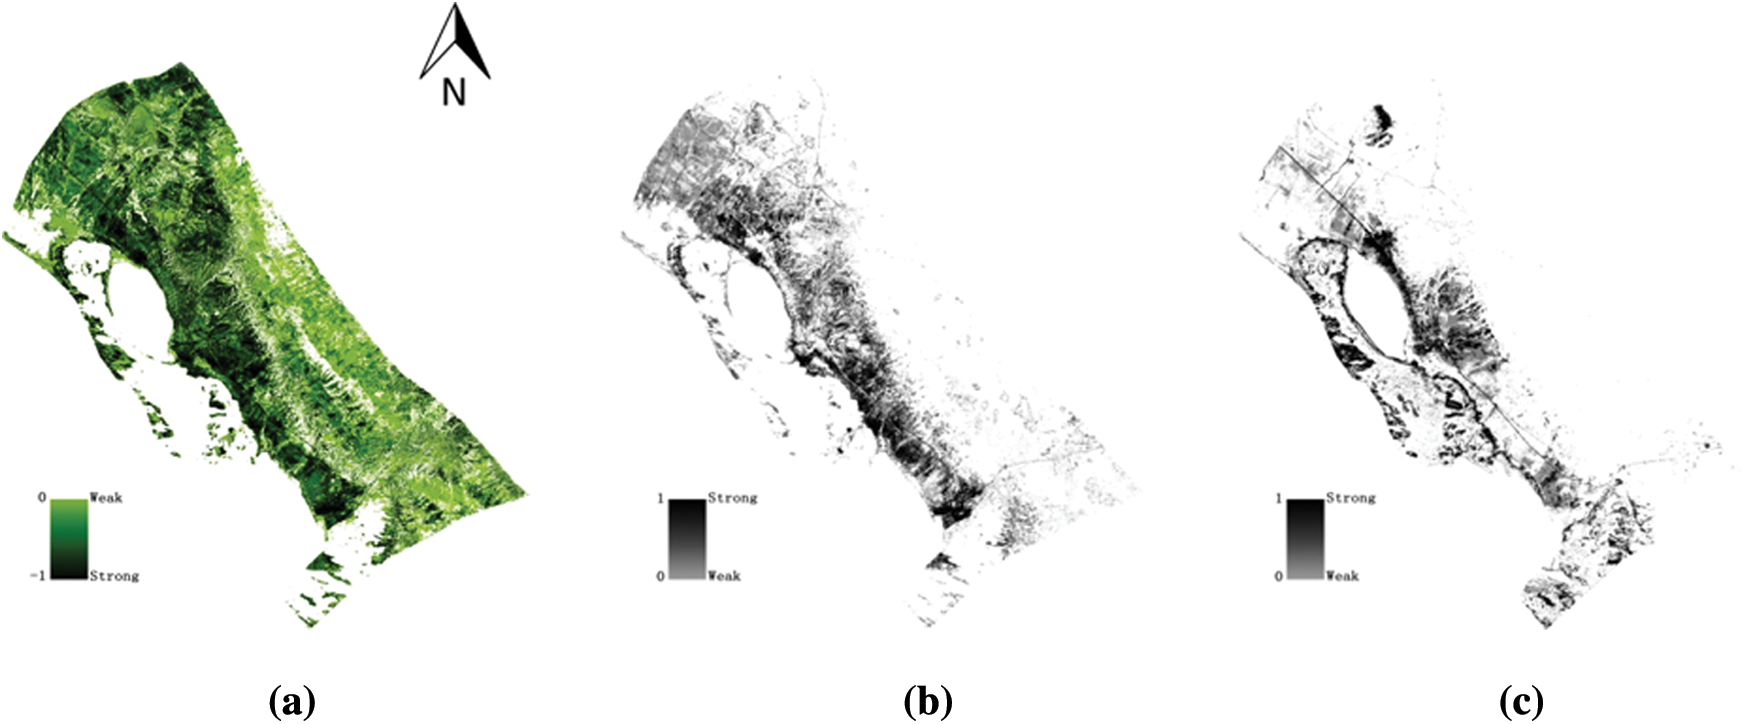
Figure 5: Trends of (a) Lightly and moderately desertified land, (b) Severely desertified land and (c) Extremely desertified land on the northern coast of Qinghai Lake from 1987 to 2014. Note: (−1, 0) represents that the desertified land has a decreasing trend, (0, 1) represents the trend of increasing desertified land
Taking the north shore of Qinghai Lake District as the research object, this paper interprets the TM remote sensing images from 1987 to 2014 by using remote sensing technology and referring to the land use status map of Haiyan County in Qinghai Province. On the basis of the decision tree classification method and the interpretation of desertification information, the land area and temporal and spatial transformation rules of the different types of desertification in the study area in recent 30 years were obtained. Based on the research findings, in the past 30 years, the area of desertified land in the study area has decreased by 4.02 km2, of which the area of lightly desertified land has decreased by 39.73 km2, the area of moderately desertified land has decreased by 36.8 km2, and the area of severely desertified land has increased by 32.78 km2. The land area has increased by 39.73 km2, and the overall characteristic is that lightly and moderately desertified lands have a reversal trend, whereas severely desertified land and severely desertified land have a significant increasing trend. In addition, from the perspective of mutual transformation relationship, the desertified land is mainly transformed into severely desertified land. The junction of the severely desertified land and severely desertified land is a sensitive area for transformation. Third, the desertified land in the study area has an eastward development and expansion trend. Finally, this paper only analyzed the spatial-temporal evolution mechanism of desertification from 1987 to 2014 using TM images. The spatial-temporal evolution mechanism of desertification from 2015 to 2020 and the driving mechanism of the spatial-temporal evolution of desertified land in recent 35 years in this region will be further studied.
Acknowledgement: This research was supported by the National Nature & Science Foundation of China “Study on the dynamic mechanism of grassland ecosystem response to climate change in Qinghai Plateau”(No. U20A2098), the second Tibetan plateau scientific expedition and research program (STEP, No. 2019QZKK0804) and China Huaneng Group Co. Science and Technology Program “The research development and implement on the evaluation technology of wind resource” (No. HNKJ18-H31).
Funding Statement: This work was supported by the National Nature & Science Foundation of China “Study on the dynamic mechanism of grassland ecosystem response to climate change in Qinghai Plateau” (No. U20A2098), the second Tibetan plateau scientific expedition and research program (STEP, No. 2019QZKK0804) and China Huaneng Group Co. Science and Technology Program “The research development and implement on the evaluation technology of wind resource” (No. HNKJ18-H31).
Conflicts of Interest: The authors declare that they have no conflicts of interest to report regarding the present study.
1. L. Jiang, A. Bao, G. Jiapaer, H. Guo and G. Zheng, “Monitoring land sensitivity to desertification in Central Asia: Convergence or divergence?,” Science of the Total Environment, vol. 658, pp. 669–683, 2019. [Google Scholar]
2. Y. Y. Zhao, H. Y. Wu, G. D. Ding, G. L. Gao and W. Z. Tu, “A review on the Aeolian desertification in the Otindag Sandy Land,” Journal of Desert Research, vol. 40, no. 5, pp. 101–111, 2020. [Google Scholar]
3. H. An, Z. Tang, S. Keesstra and Z. Shangguan, “Impact of desertification on soil and plant nutrient stoichiometry in a desert grassland,” Scientific Reports, vol. 9, no. 1, pp. 9422, 2019. [Google Scholar]
4. A. L. Burrell, J. P. Evans and M. G. Kauwe, “Anthropogenic climate change has driven over 5 million km2 of drylands towards desertification,” Nature Communications, vol. 11, no. 1, pp. 3853, 2020. [Google Scholar]
5. H. Duan, T. Wang, X. Xue and C. Yan, “Dynamic monitoring of Aeolian desertification based on multiple indicators in Horqin Sandy Land,” China Science of the Total Environment, vol. 650, pp. 2374–2388, 2019. [Google Scholar]
6. J. Guo, W. Wang, Y. L. Zhang and Y. C. Shi, “Analysis on dynamic variation and its impact factors of desertification land in Hetao plain,” China Resources Comprehensive Utilization, vol. 38, no. 8, pp. 74–79, 2020. [Google Scholar]
7. J. Y. Ma, “Estimating the desertification boundary of remote sensing using vegetation abundance derived from MODIS data based on pixel unmixing,” Ph.D. dissertation, Zhejiang University, Hangzhou, 2018. [Google Scholar]
8. T. Wang, X. Song, C. Z. Yan, S. Li and J. L. Xie, “Remote sensing analysis on Aeolian desertification trends in northern China during 1975–2010,” Journal of Desert Research, vol. 31, no. 6, pp. 1351–1356, 2011. [Google Scholar]
9. X. Liu, J. Yu, W. Song, X. Zhao, L. Zhao et al., “Remote sensing image classification algorithm based on texture feature and extreme learning machine,” Computers, Materials & Continua, vol. 65, no. 2, pp. 1385–1395, 2020. [Google Scholar]
10. H. Wu, Q. Liu and X. Liu, “A review on deep learning approaches to Image classification and object segmentation,” Computers, Materials & Continua, vol. 60, no. 2, pp. 575–597, 2019. [Google Scholar]
11. M. B. Nejad and M. E. Shir, “A new enhanced learning approach to automatic image classification based on SALP swarm algorithm,” Computer Systems Science and Engineering, vol. 34, no. 2, pp. 91–100, 2019. [Google Scholar]
12. A. Chen, X. Yang, B. Xu, Y. Jin, J. Guo et al., “Monitoring the spatiotemporal dynamics of Aeolian desertification using google earth engine,” Remote Sensing, vol. 13, no. 1730, pp. 1730, 2021. [Google Scholar]
13. X. Qi, C. Zhang and K. Wang, “Comparing remote sensing methods for monitoring karst rocky desertification at sub-pixel scales in a highly heterogeneous karst region,” Scientific Reports, vol. 9, no. 7, pp. 13368, 2019. [Google Scholar]
14. Z. Jia, Q. Han, Y. Li, Y. Yang and X. Xing, “Prediction of web services reliability based on decision tree classification method,” Computers, Materials & Continua, vol. 63, no. 3, pp. 1221–1235, 2020. [Google Scholar]
15. X. Y. Han, G. Yang, F. C. Qin, G. P. Jia, X. Ling et al., “Spatial and temporal dynamic patterns of sandy land in Mu Us in the last 30 years,” Research of Soil and Water Conservation, vol. 26, no. 5, pp. 144–150, 2019. [Google Scholar]
16. Y. C. Daza, M. F. Laguna, J. A. Monjeau and G. Abramson, “Waves of desertification in a competitive ecosystem,” Ecological Modelling, vol. 396, no. 2, pp. 1–17, 2019. [Google Scholar]
17. Y. J. Duan, Z. W. He, Y. Q. Wang, J. F. Liu and G. Huang, “Monitoring land desertification of Tibet autonomous region based on remote sensing,” Journal of Arid Land Resources and Environment, vol. 28, no. 1, pp. 55–61, 2014. [Google Scholar]
18. L. Chen, W. Yu, F. Han, Y. Lu and T. Zhang, “Effects of desertification on permafrost environment in Qinghai-Tibetan Plateau,” Journal of Environmental Management, vol. 262, no. 8, pp. 110302, 2020. [Google Scholar]
19. M. Zhang, “Indicator system and assessment of land desertification in Qinghai-Lake area based on remote sensing,” Territory & Natural Resources Study, vol. 2016, no. 3, pp. 35–37, 2016. [Google Scholar]
20. C. Zhao, R. J. Lu and J. F. Li, “Land desertification and grain size characteristics of land surface deposits in the Qinghai lake watershed,” Journal of Desert Research, vol. 35, no. 2, pp. 276–283, 2015. [Google Scholar]
21. C. Ding, L. Zhang, M. Liao, G. Feng, J. Dong et al., “Quantifying the spatio-temporal patterns of dune migration near Minqin Oasis in northwestern China with time series of Landsat-8 and Sentinel-2 observations,” Remote Sensing of Environment, vol. 236, pp. 111498, 2020. [Google Scholar]
22. S. M. Vicente-Serrano, S. M. Quiring, M. Peña-Gallardo, S. Yuan and F. Domínguez-Castro, “A review of environmental droughts: Increased risk under global warming?” Earth-Science Reviews, vol. 201, no. 42, pp. 102953, 2020. [Google Scholar]
23. X. F. Ma, J. T. Zhu, W. Yan and C. Y. Zhao, “Projections of desertification trends in Central Asia under global warming scenarios,” Science of the Total Environment, vol. 781, no. 2, pp. 146777, 2021. [Google Scholar]
24. Z. Di and D. Hui, “Historical human activities accelerated climate-driven desertification in China’s Mu Us Desert,” Science of the Total Environment, vol. 708, pp. 134771, 2020. [Google Scholar]
 | This work is licensed under a Creative Commons Attribution 4.0 International License, which permits unrestricted use, distribution, and reproduction in any medium, provided the original work is properly cited. |