DOI:10.32604/cmc.2022.023293
| Computers, Materials & Continua DOI:10.32604/cmc.2022.023293 | |
| Article |
Correlation Analysis of Energy Consumption of Agricultural Rotorcraft
1School of Mechanical Engineering, Nanjing University of Science and Technology, Nanjing, 210094, China
2Department of Electrical and Electronic Engineering, Colorado State University, Fort Collins, USA
*Corresponding Author: Lihua Zhu. Email: zhulihua@njust.edu.cn
Received: 02 September 2021; Accepted: 11 October 2021
Abstract: With the rapid development of unmanned aerial vehicle technology, unmanned aerial vehicles (UAVs) have been widely used in the field of agricultural plant protection. Compared with fuel-driven UAVs, electrically driven rotorcrafts have many advantages such as lower cost, simpler operation, good maneuverability and cleaner power, which them popular in the plant protection. However, electrical rotorcrafts still face battery problems in actual operation, which limits its working time and application. Aiming at this issue, this paper studied the influence of rotorcraft flight parameters on energy consumption through series of carefully designed flight experiments. First of all, the linear motion experiments have been designed that the rotorcraft was made to perform speed tests and acceleration test with the speed varied from 2∼9 m/s. Secondly, the turning maneuver experiments are carried out under the different circular routes, a rotorcraft was made to conduct successive steering maneuvers at a certain speed of 2 m/s. With the collected tests data, the relation of the energy consumption and the flight dynamic parameter are analyzed through correlation analysis, and the test results of different pairs of experiments have been compared. The research results of this paper would encourage the agricultural rotorcraft to make less maneuvers during operation, which can also provide practical experience and data support for subsequent optimization of flight parameters and reduction of energy consumption.
Keywords: Plant protection UAV; energy consumption; correlation analysis; flight speed; flight maneuver
With fast development of automation technology, agricultural plant protection with UAVs is gradually replacing traditional methods of manual operation [1–3]. Since rotorcrafts have the advantages of simple operation, vertical take-off and landing, hovering, strong maneuverability, and low cost [4] it is popular in the nowadays agriculture application. As rotorcraft usually use batteries for power supply, and their endurance issues severely restrict their performance [5]. For example, due to energy limitations, rotorcraft may return midway or make emergency landings due to out-of-power during operation. There is even the risk of sudden loss of control and crashes, which will also lead to various problems, such as the energy waste, low operating efficiency, and safety issues [6]. Therefore, the research on the energy consumption of the battery-powered rotorcraft has attracted great attention.
Scholar all over the world have been investigated the issue in decades. Aleksandrov et al. [7] compared the difference of the energy consumption of mini UAV helicopters with different number of rotors by their efficiency and flight duration. In [8], a power and energy consumption model of multirotor agricultural UAV has been built to evaluate the endurance time, and the evaluation accuracy was verified via experiments. Yacef et al. [9] introduced an energetic model composed of quadrotor movement dynamic, motors dynamic and battery dynamic, and tried to find an optimal control inputs and vehicle trajectory between initial and final configurations that minimize the consumed energy during a specific mission. Xu et al. [10] designed a scheme for flight duration of plant protection UAV based on solar energy. Feasibility of this scheme was tested on the six-rotor platform. The results showed that the flight time of UAV equipped with solar module was averagely increased 70 s compared with that before the equipment. Abdullah et al. [11] created an equivalent circuit model (ECM) that helped to depict the battery pack for an unmanned aerial system (UAS), and flight tests were carried out to examine the accuracy of that model. Li et al. [12] targeted for the compromise of short path, payload and safe operation, a combined planning algorithm for a spraying UAV based on energy optimization was studied, which reduced energy consumption rate of UAV from route and path and improved operational efficiency.
Abeywickrama et al. [13] presented a consistent energy consumption model for UAVs based on empirical studies of battery usage in various flight scenarios, which can be used for energy efficient UAV mission planning. Franco et al. [14] built an energy model in terms of the battery measurements, and proposed an energy-aware path planning algorithm that minimizes energy consumption while satisfying the coverage and resolution requirements. Tran et al. [15] also needed to take energy consumption to design the UAV trajectory, in which, energy consumption had been evaluated from the propulsion and communication perspectives. Elloumi et al. [16] presented energy saving method for UAVs tracking of a mobile target. And a criterion in terms of the velocity, altitude and acceleration changes has been established to evaluate the energy consumption.
There are many factors that could affect the energy consumption of rotorcraft, such as the weight, flight speed, flight status, and battery performance [17–19], and plenty of theoretical rese-arches about them. However, the practice is always difficult to correspond to modelling. Given the needs to practical application, this paper contributes to propose an experimental method that unconventionally uses the carefully designed flight tests to study the relationship between the energy and the flight dynamics. Through the orthogonal experiments with energy consumption among flight speed, linear acceleration, and the angular maneuvers, the correlation were analyzed with regression theory. The results could provide instructions and data support for operation trajectory of the agricultural UAV so as to reduce energy consumption and enhance the efficiency.
The organization of this paper is as follows. Section 2 reviews the principle and theory of linear regression, including the estimation of model parameters, significance test and goodness of fit test. Section 3 describes the experimental platform with hardware configuration and the flight scheme for the analysis of energy consumption factors. Section 4 presents correlation analysis of experimental results. Section 5 concludes the paper.
In practical problems, there are a large number of non-deterministic relations between variables. Although there are close relations between them, their closeness cannot be described by the exact relations. We summarize this relationship as: there is a close relationship between variables, but it is not close enough that one variable can be used to confirm another variable. There is a non-deterministic relationship between them. We call this relationship a statistical relationship or relationship. And regression analysis is a statistical method to discuss the statistical relationship between variables [20,21]. Among them, the regression analysis between a dependent variable and multiple independent variables is called one-to-many regression analysis, and the regression analysis between multiple dependent variables and multiple independent variables is called many-to-many regression analysis. It can also be divided into linear regression and nonlinear regression. Regression method, nowadays, is a very important branch of statistics. It consists of a set of techniques to explore the relationship among variables and has been widely used in many disciplines. With the increasing popularity of computers and related statistical software in recent years, it provides a powerful means for large-scale, fast and accurate regression analysis in practical problems [22,23].
Linear regression can be divided into unary linear regression and multiple linear regression. Unary linear regression is a linear regression problem with only one explanatory variable, which is a special case of multiple regression. Multiple linear regression model refers to a regression model containing multiple independent variables, and is used to explain the linear relationship between the dependent variable and other multiple independent variables. The general form of the multiple linear regression model is as follows:
In Eq. (1), a is the regression constant, b1, b2, …, bk are the regression coefficient, ε is the random error, y is the dependent variable, and x1, x2, …, xk are the independent variables. The regression constants, regression coefficients, and error terms in the multiple linear regression model are generally unknown and need to be estimated through sample observation data. If n times observation data (yi, x1i, x2i, …, xki) are obtained, i = 1, 2, …, n, the general form of the multiple linear regression model can be used to obtain its matrix form:
where:
Finally, the least square method is used to estimate the parameters, and the parameter estimated value of the regression model is obtained:
After completing the parameter estimation to obtain the regression model, a significance test is required. Significance test is a statistical process to examine whether the independent variable of the model has a remarkable effect on the dependent variable under a certain level, that is, it is used to evaluate closeness of the relationship between all independent variables and the dependent variable From the perspective of the regression model, even if the linear relationship of the overall regression equation is significant, it does not mean that each independent variable has a significant impact on the dependent variable. Therefore, a significance test is required to screen the independent variables and eliminate them. If the impact is not significant, a simpler and more reasonable multiple linear regression model should be established. The commonly used inspection methods are t-test and F-test.
The necessary goodness-of-fit test comes after the significance test, to determine the fitting effect of the regression equation. The difference between the observed values of the explained variables in the regression equation is mainly caused by two reasons: one is the influence of different value changes on the explanatory variable, and the other is caused by random factors. After all, the explained sum of squares (ESS) and the residual sum of squares (RSS) make up the variance sum of squares.
Then, the sum of squared deviations of the dependent variable is equal to the sum of the regression sum of squares and the remaining sum of squares, which is recorded as total sum of squares (TSS), which is:
In statistics, the total variation of the dependent variable in multiple linear regression is defined as the coefficient of determination R2, which is the amount of variance explained by the line equation, and its calculation formula is:
In Eq. (6), the coefficient of determination R2 is the proportion of the regression sum of squares in the total deviation of squares, reflecting the proportion of variation that can be explained by the regression equation. Its value is between 0∼1. The larger the value, the greater the higher the goodness of fit of the regression equation to the sample data points, and vice versa, the smaller the value, indicating that the regression equation has a lower goodness of fit to the sample data points.
The basic components of the rotorcraft used in the experiment include frame, motor, propeller, electronic speed control (ESC), global position system (GPS), battery, flight control, remote control receiver, digital antennae, as shown in Fig. 1a. The power supply of the rotorcraft uses a lithium battery with a capacity of 2200 mah, and its output voltage is 14.8 V, which is a 4 series (4S) kind battery with a large voltage and a small current. The battery not only provides power source for the rotorcraft, but also enable the onboard equipment such as the flight controller and the digital transmission.
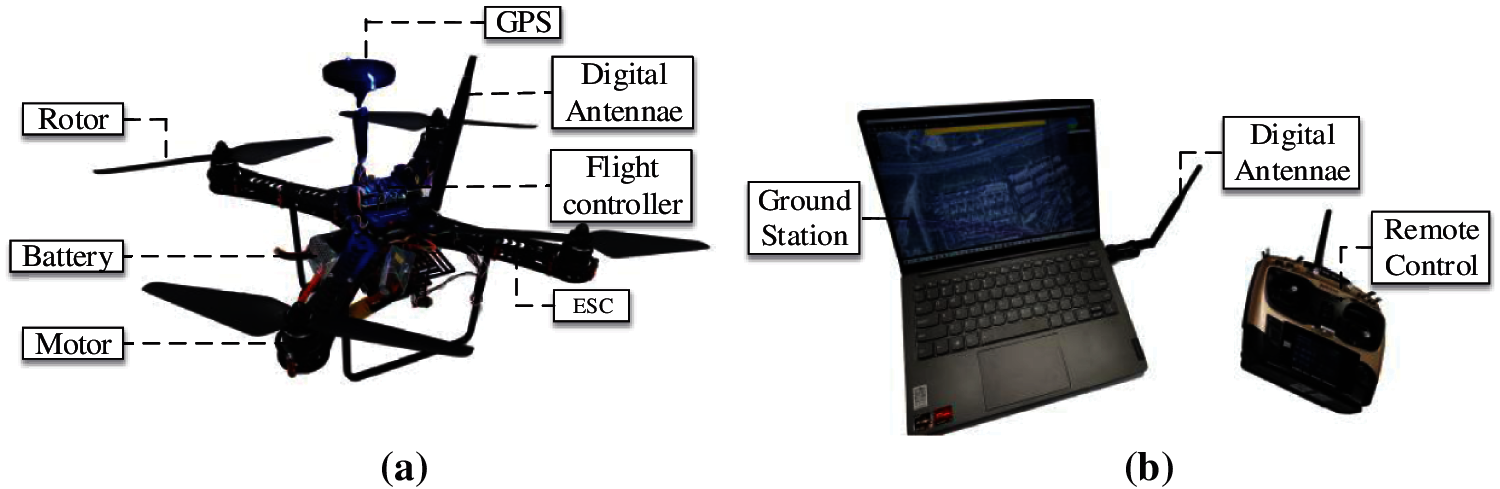
Figure 1: Equipment used in the experiments (a) Rotorcraft used in the experiments (b) Telecommunication control system
The rotorcraft can be control mainly through the ground station and the remote, as shown in Fig. 1b. The rotorcraft receives control instructions from the ground station or the remote control through wireless transmission module, to realize the real-time control of the rotorcraft. And the rotorcraft can perform the six-degree-of-freedom movement by adjusting the rotation speed of the four motors. It has good maneuverability and can efficiently fulfill planned mission.
3.2 Primary Influential Factors in Flight Parameters
This paper mainly studies the influence of rotorcraft's motion parameters on its energy consumption. Among all the motion parameters, the flight speed and maneuvering acceleration have been selected to perform the correlation analysis.
(1) Flight speed
The flight speed of the rotorcraft is closely related to the motor speed, air density, propeller diameter and pitch, and the output power of the battery is different at different flight speeds. For a rotorcraft flies at different speeds within the same distance, the output power is different, so that it is used to study the energy consumption during operation.
(2) Maneuvering acceleration
During the flight of a rotorcraft, there are certainly maneuvers such as the accelerative movement, decelerating movement or turning maneuvers, every time the flight status is changed. According to the control principle of rotorcraft, when the flight status is about to change, the control system would adjust the speed of the motors to generate an acceleration, which would cause changes on the output current and voltage of the battery. That is to say, the energy consumption is easily affected by the maneuvering acceleration.
Based on the analysis and the influential parameters’ selection of the Section 3.2, a serial of experiments had been carefully designed to test the relation between those parameters and the energy cost of the rotorcraft. The rotorcraft is set to autonomous flight mode during tests, which operates at a certain height and track the waypoints uploaded from the ground station before takeoff. Two scenarios of flight tests were carried out that included the uniform motion flight, acceleration maneuvers and turning movements, the details are given below:
(1) linear flight with fixed distance
In this scenario, the rotorcraft is instructed to fly straightly from start point to the end point, and then get back from end to the start, as shown in Fig. 2. The flying distance between start and end is 80 m. In such distance, the rotorcraft was set to fly at different speed from 2 m/s to 9 m/s, increasing at 1 m/s for each test. And for each test, the rotorcraft went through three status: namely, the accelerating stage (from 0 m/s to the designed speed), uniform motion flight, and the decelerating stage (from the designed speed to 0 m/s). That is to say, through the straight line flight tests could, the energy change data with different sets of speed and various accelerations can be obtained.
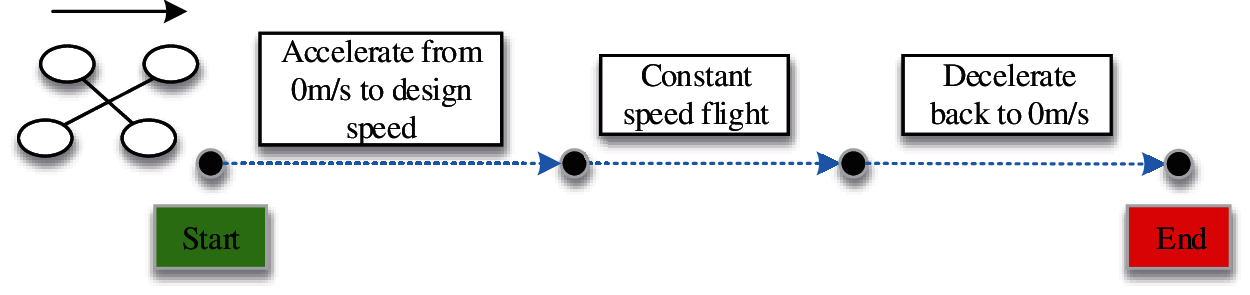
Figure 2: Rotorcraft straight flight schematic diagram
(2) Turning flight tests
In order to study the influence of turning maneuvers on the energy consumption of rotorcrafts, four sets of turning flights were carried out with same constant speed of 2 m/s. As shown in Fig. 3, the rotorcraft was prepared to fly in four circular paths with radius (r) of 5, 10, 20, and 50 m, respectively. And the paths are composed of equally arc length with set waypoints of 6, 8, 12, and 24 respectively. The corresponding heading changes were 60°, 45°, 30° and 15°, respectively. In each test, the rotorcraft set off from the starting point, went through every turning point with steering maneuvers, until got back to the start to complete the mission. In those tests, we also could get energy change data with the flight dynamical data to reveal their relevance.
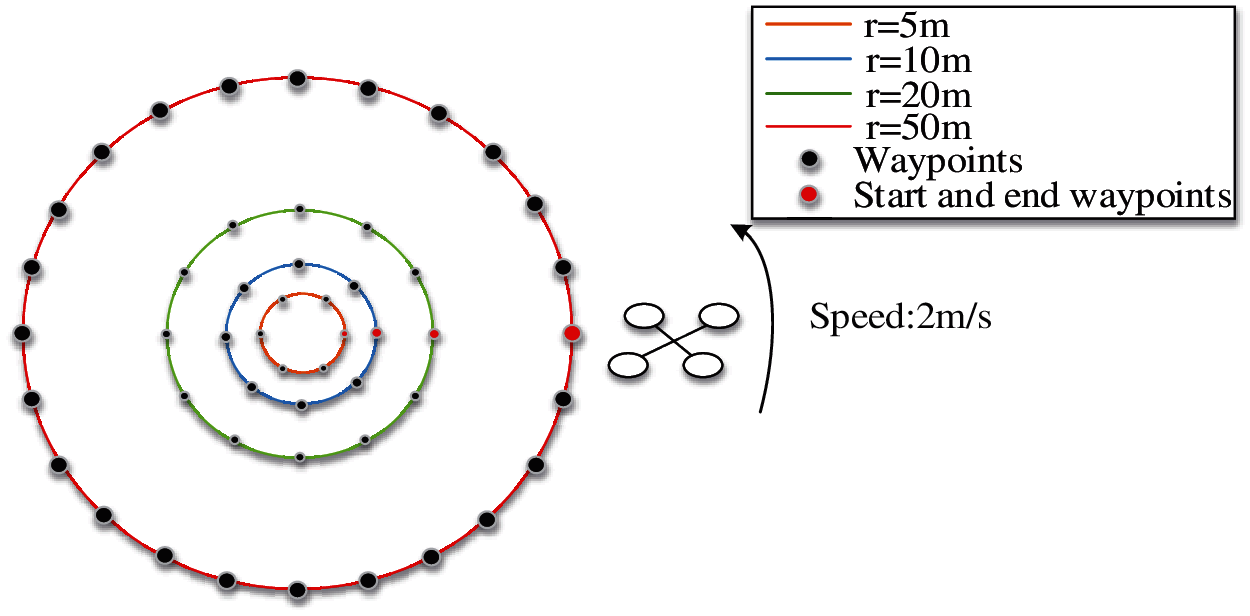
Figure 3: Schematic diagram turning flight tests
3.4 Data Acquisition and Processing
After the experiment, the flight log stored in the secure digital (SD) card is converted into a csv format file. Based on MATLAB, the files had been read to analyze how did the energy consumption change with the selected dynamic parameters. Furthermore, the correlation between energy consumption and flight parameters has been studied with linear regression.
4 Experimental Results and Correlation Analysis
In this section, data analysis and the linear regression are carried out with respect to all kinds of the experimental scenarios, the details are present in the subsections.
4.1 Energy Consumption Analysis of Linear Motion
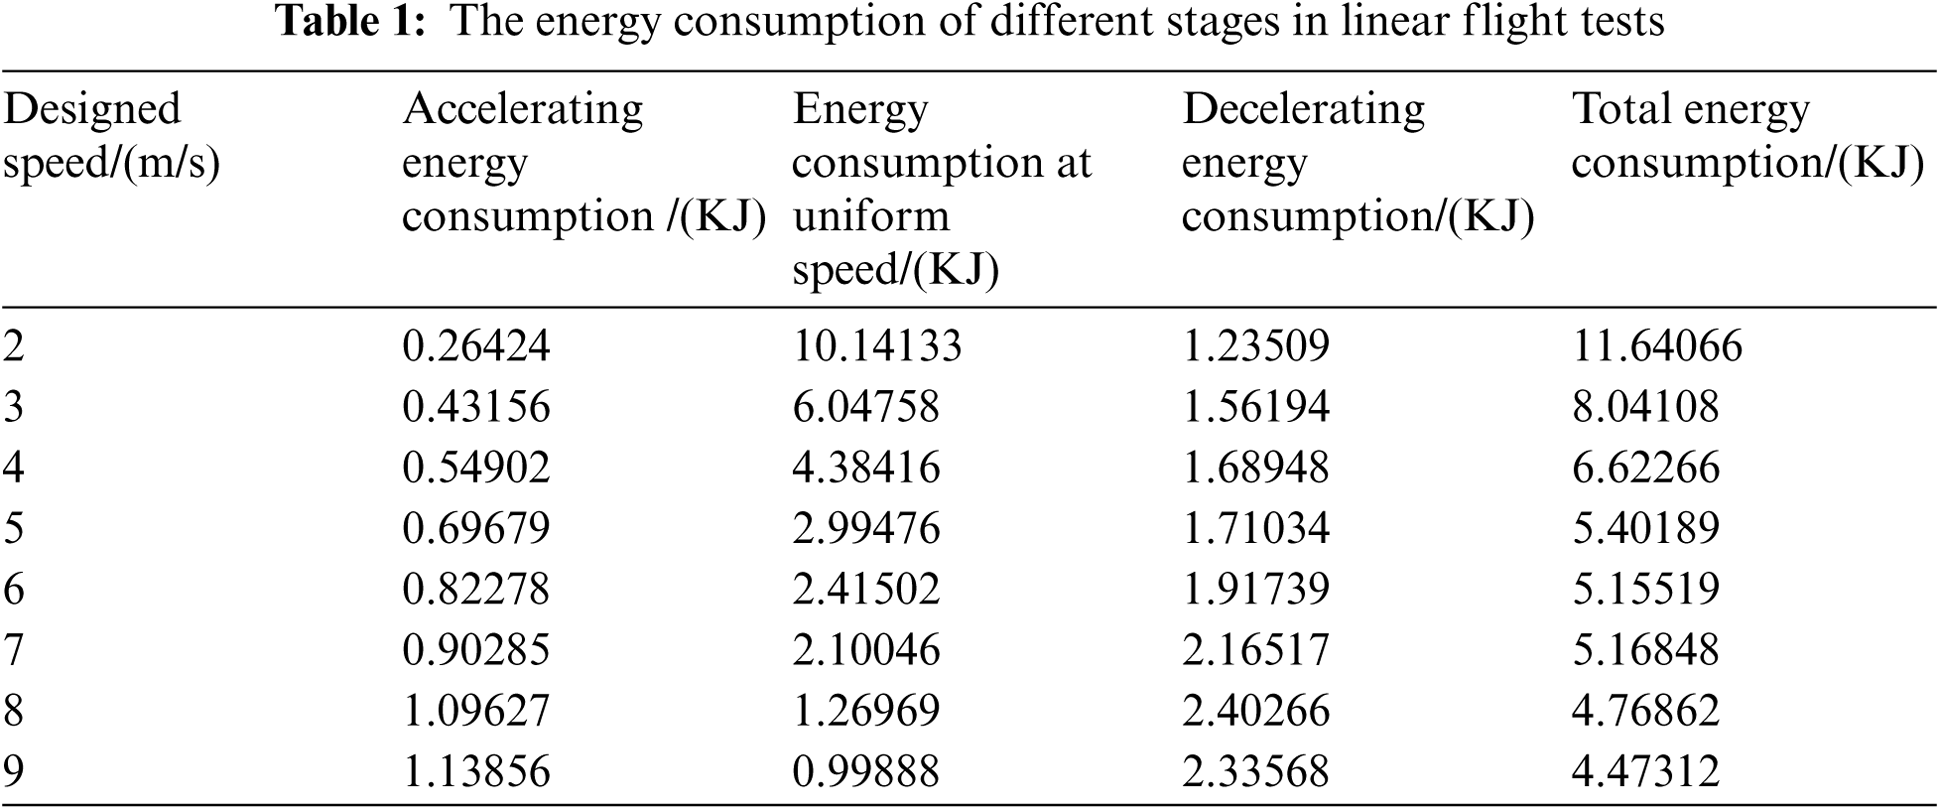
The experimental results of the linear flights are shown in Tab. 1, it shows the energy consumption of the three stages of the linear motion under different test speeds. Where the energy consumption is calculated through integration of the battery power log with time. Obviously, as the speed increases, the total energy consumption gradually decreases, the energy consumption of the uniform motion period decreases, while the energy consumption in both the acceleration and the deceleration stages increases. Besides, at the same speed, the energy consumption of the deceleration stage is generally greater than that of the acceleration stage, indicating that the deceleration maneuvers of the rotorcraft consume more energy than the acceleration maneuvers. The specific analysis of the three stages is present in the following paragraphs.
First of all, the energy consumption of different constant speeds per distance is shown in Fig. 4. It can be seen that the energy consumption decreases with the increase of speed, and the downward trend is gradually slowing down. Correlation analysis of energy consumption and speed is carried out and the results verifies the negative correlation. The correlation coefficient r = −0.901, and the significance level S = 0.002 < 0.05, indicating that the correlation is significant.
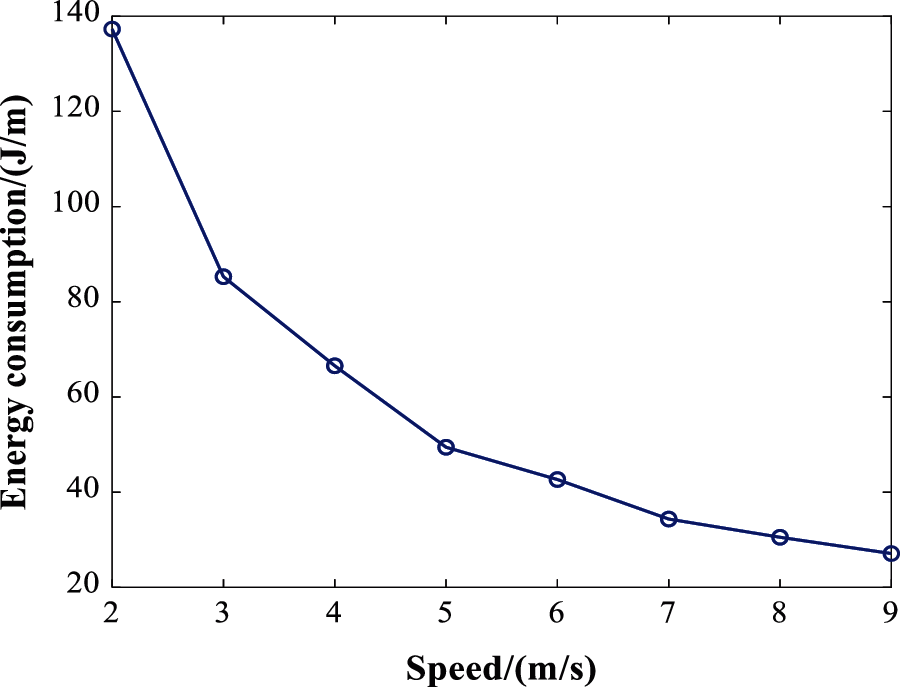
Figure 4: Energy-speed profile of the uniform motion
A regression model was established using unary linear regression, as in Eq. (7). Where Eus (J/m) denotes the power consumption per distance and v is the speed. And the negative coefficient of speed also demonstrate that higher speed flight saves more operation energy.
Correlation analysis of energy consumption and speed is also carried out and the results to test how much they are correlated. The correlation coefficient r = −0.901, and the significance level S = 0.002 < 0.05, indicating that the correlation is significant.
Besides, the average power consumption is also applied to analysis for eliminating the impact of flight time. Fig. 5 shows the average power decreases with the increase of the speed, the average power at 9 m/s reduces about 13.82% than that of 2 m/s.
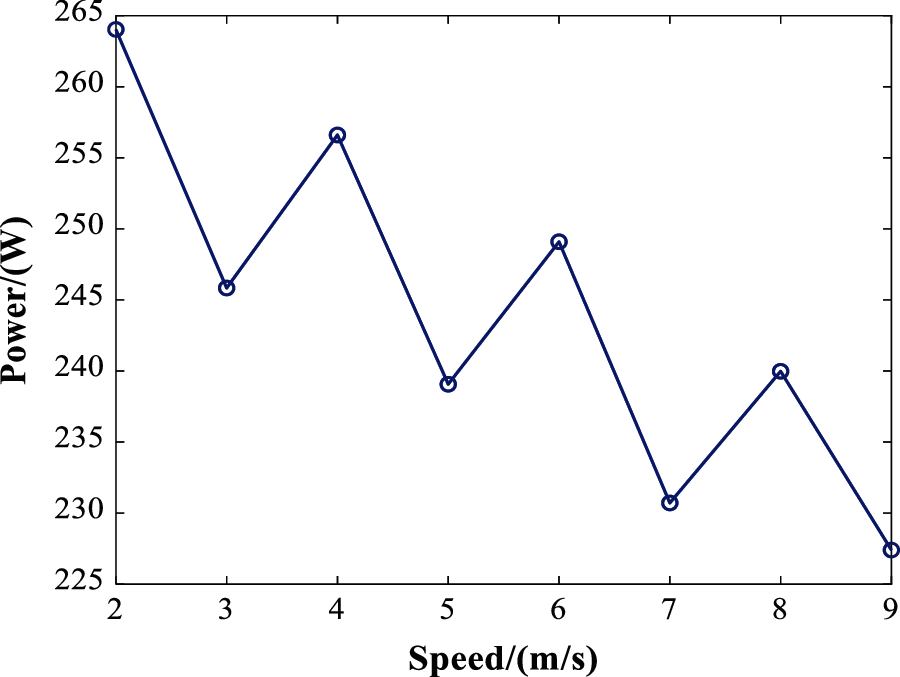
Figure 5: Power-speed profile of uniform motion
Correlation analysis also shows that average power and flight speed are negatively correlated, as shown in Eq. (8), the correlation coefficient r = −0.829, and the significance level S = 0.011 < 0.05, indicating that the correlation is significant.
Generally speaking, the operation speed of the agricultural rotorcraft is 4∼6 m/s with respect to different model size. Faster speed may cause inadequate spraying, while slower speed might affect operation efficiency, waste chemicals and result in pollution [24]. With our designed tests and above-mentioned result analysis, both the energy consumption in unit time and in unit distance are negatively correlated with the flight speed. Therefore, the agricultural rotorcraft is suggested to fly as fast as possible in the operation speed range.
The energy consumption of the maneuver accelerating scenarios and the deceleration are shown in Figs. 6a and 6b respectively. It is clear seen that the energy consumption decreases with the increase of the speed. It explains the fact that the greater the speed, the more energy would be consumed to decelerate during the waypoints tracking, which is congenial with common sense. For further analysis, the acceleration and the flight time are used as the variable to perform regression analysis on energy consumption. The regression model of energy consumption during acceleration and deceleration stages can be obtained, as in Eq. (9). Where, Ea (KJ) is the energy consumption of the accelerating stage, Ed (KJ) is the energy consumption of the decelerating stage, ta(s) and td(s) are flight time of corresponding stages, aa (m/s2) and ad (m/s2) are acceleration and deceleration respectively.
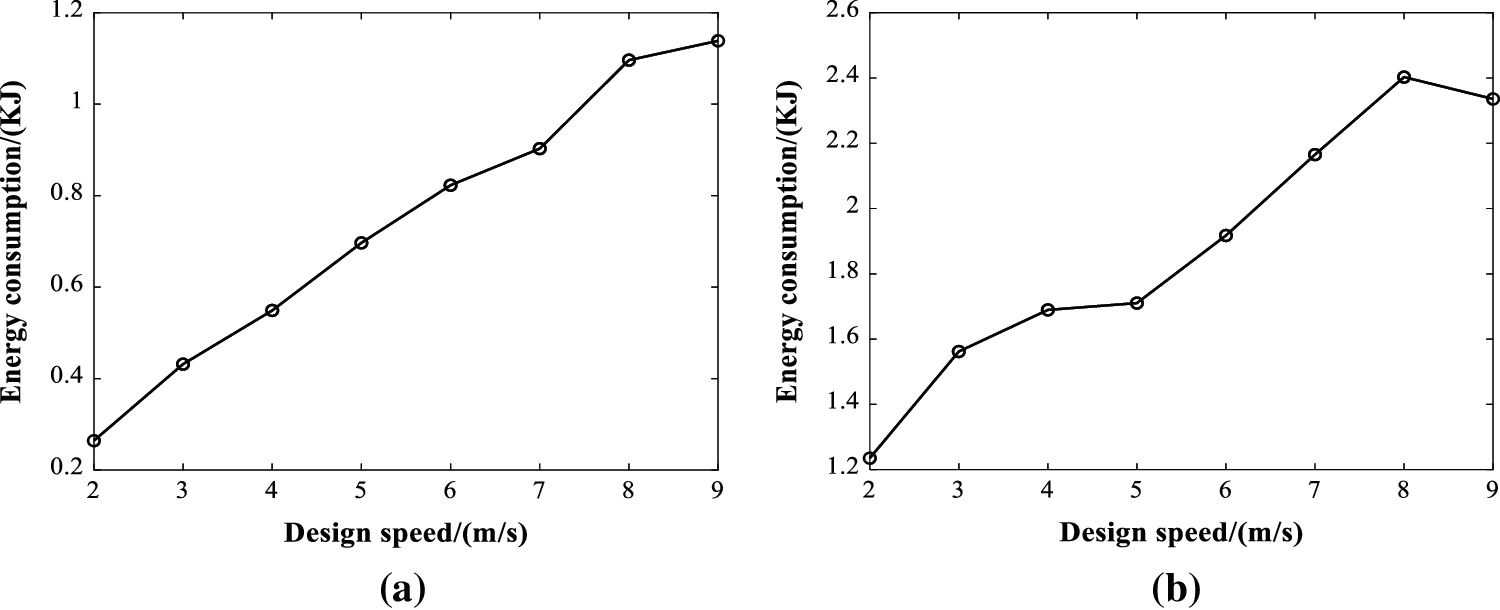
Figure 6: Energy consumption on different speed during the maneuvering accelerating scenario (a) Acceleration section (b) Deceleration section
It can be seen that in the regression model of maneuver acceleration, both the acceleration coefficient and the flight-time coefficient are over zero, which means that the energy consumption in the accelerating stage is positively correlated with the acceleration and the flight time. In other words, the greater the acceleration, the longer the flight time, and the more the energy consumption. For the decelerating stage, the flight time coefficient is over zero, while the deceleration coefficient is negative, suggesting that the energy consumption in the deceleration phase is positively correlated with the flight time, and negatively correlated with deceleration. Besides, the absolute value of deceleration coefficient is very small, so that the flight time in the deceleration stage has a greater impact on energy consumption.
In order to compare the energy consumption of the acceleration scenario and the uniform motion scenario, the acceleration is integrated with maneuver time to approximate a speed, named as the equivalent speed. Then the power consumption of the equivalent speed is calculated by Eq. (8), and compare with the actual acceleration power consumption, as shown in Fig. 7.
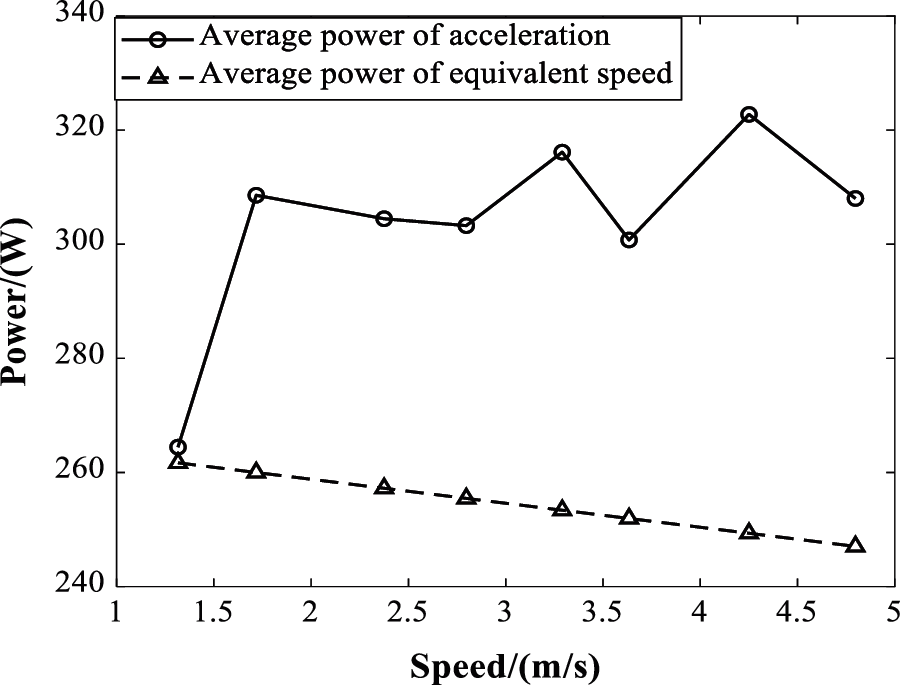
Figure 7: Comparison of power consumption on acceleration and equivalent speed
From Fig. 7, it can be seen that the acceleration process cost more power than the approximate speed process. Along with the speed grows, the power consumption gap between two curves grows. That is to say, even with the same speed, the acceleration maneuvers are more power-consuming than cruise flight. Therefore, in agricultural operations, it is necessary to keep the rotorcraft moving at a constant speed as much as possible to avoid maneuver acceleration.
4.2 Analysis of Energy Consumption for Turning Flight
The actual flight trajectory turning flight experiment is shown in Fig. 8. Compared with Fig. 3, It can be seen that the rotorcraft has completed the preset flight trajectory well, the distance and heading changes between the waypoints are rather even, showing four polygonal trajectories. The flight speed set in all the turning tests is 2 m/s. The speed curves of the four tests are given in Fig. 9.
First of all, from Fig. 9, we can see that the continuous setting of turning waypoints would cause not only changes in the moving direction, but also speed fluctuation between the waypoints. Furthermore, in the turning test at radius of 5 m, there was no moment of uniform motion, the set speed 2 m/s has been reached, but within the peak of the maneuver acceleration motion between two adjacent waypoints, as shown in Fig. 9a. While, with turning radius of 10 m, the speed curve of such flight test shows visible 2 m/s uniform motion in short time, as in Fig. 9b. And the situation has gradually improved with the growth of the turning radius. As shown in Figs. 9c and 9d, the uniform motion is getting longer and more stable. After calculation, the average distance between the two waypoints of four groups of tests are about 5, 7, 10, and 12 m, respectively. It is saying that, during the waypoint tracking process of the open source autopilot P × 4, small distance easily lead to unstable speed or even a maneuvering accelerating movement between waypoints. The acceleration and deceleration will cause excessive consumption of energy. However, from the previous sections, it is known that the acceleration maneuvers are for energy saving of the rotorcraft. Therefore, it is very important to balance the waypoints design and the flight speed to avoid acceleration and deceleration maneuvers and the unnecessary energy consumption of the rotorcraft.
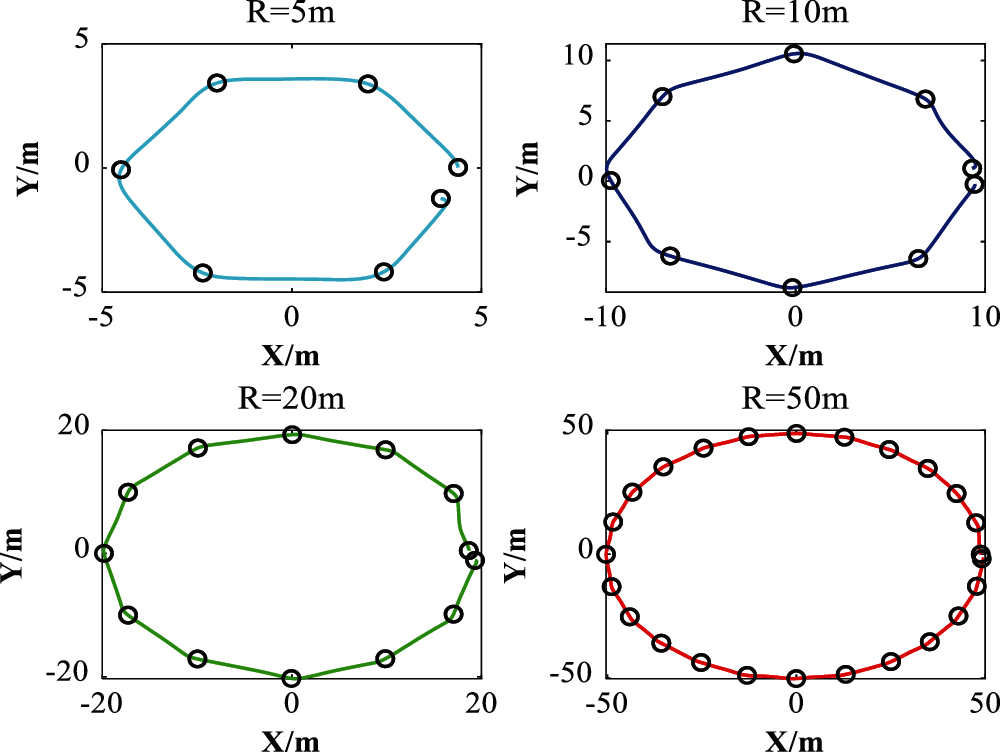
Figure 8: Actual trajectories of the turning flight tests
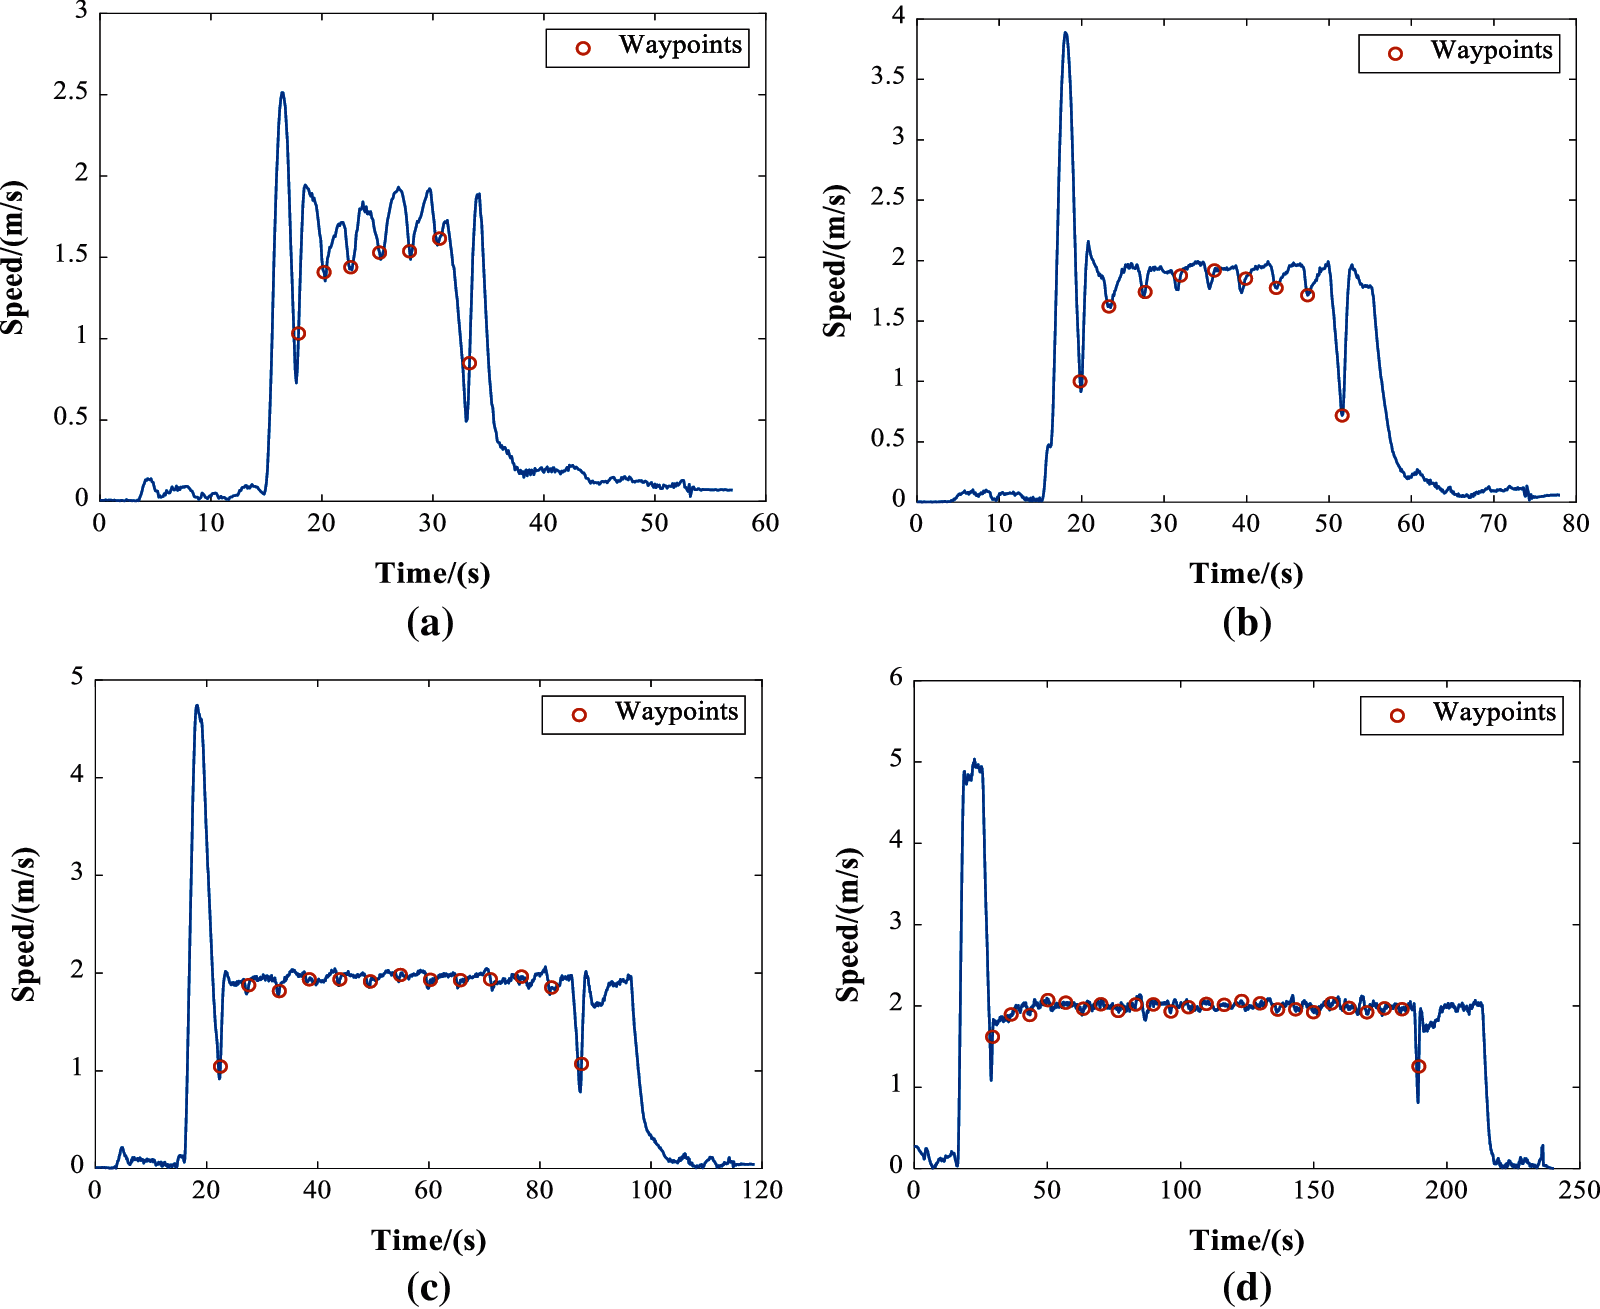
Figure 9: The speed curves of the turning flight test (a) Speed curve at turning radius of 5 m (b) Speed curve at turning radius of 10 m (c) Speed curve at turning radius of 20 m (d) Speed curve at turning radius of 50 m
The power consumption of different turning tests is also studied that average power with the corresponding turning rate ω(rad/s) of four group's tests are compared in Tab. 2. Correspondence of the average power and turning rate. Obviously, the average power increases with the turning rate.
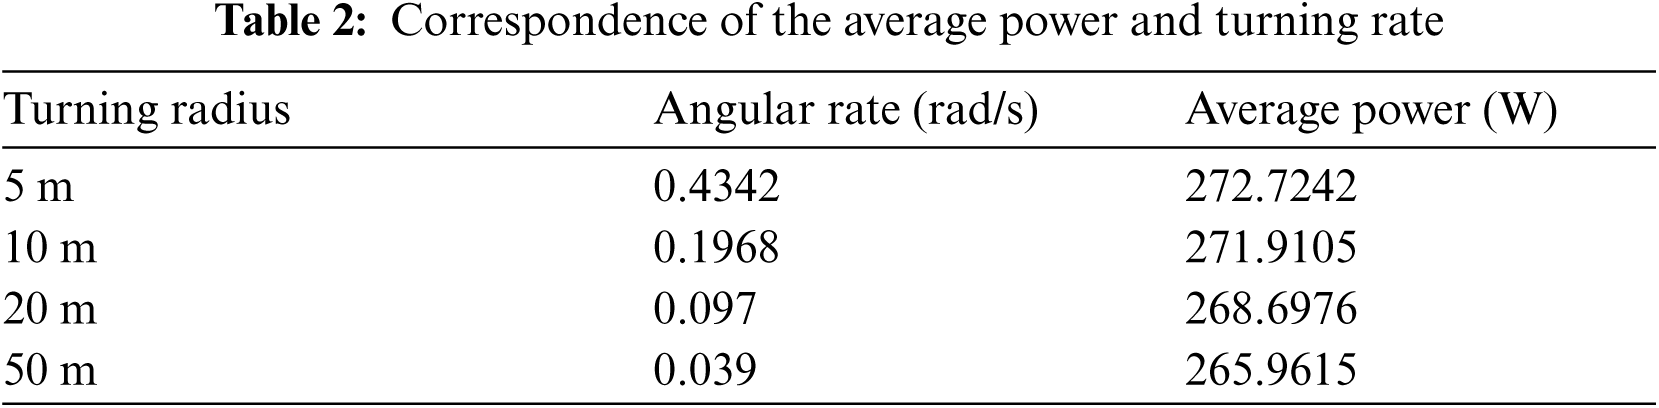
Correlation analysis on the average power and turning rate shows that the two factors are negatively correlated. The correlation coefficient is r = 0.887, the significance level P = 0.045 < 0.05, indicating that the correlation is significant. And a linear regression model has been built in Eq. (10) to better show their relationship.
where, the coefficient of turning rate is positive and rather large. That is, greater turning maneuvers would cost more power during the operation of the rotorcraft. Therefore, the operator ought to take care of the turning times and turning waypoint during the path planning.
In this paper, the author studied the relations of the energy consumption and the flying dynamical parameters of the rotorcraft. From the engineering point of view, various testing scenarios were design to analyze the impact of the flight speed, maneuver acceleration and maneuver turns on the energy change. From the tests results, it is found that, the greater the speed, the shorter the time and the lower the energy consumption. Compared with uniform motion, the maneuver accelerating movement and turning motion will cause more energy consumption. Therefore, for agricultural rotorcraft operations, the waypoints should be arranged in a straight line as far as possible, and the distance between the waypoints should be as large as possible to avoid turning and acceleration. As for the operating speed, it is related to the distance between the waypoints and the distribution of the waypoints, and which should be carefully designed. In the follow-up work, the author will further study the way to optimize the operation speed between the waypoints.
Funding Statement: This work was supported by the National Natural Science Foundation of China (No. 61803203)
Conflicts of Interest: The authors declare that they have no conflicts of interest to report regarding the present study.
1. Q. X. Yao, “Application status and prospects of agricultural plant protection drones in my country,” Agriculture Mechanization Research, vol. 51, no. 12, pp. 38, 2020. [Google Scholar]
2. Y. Z. Dong, J. X. Li, Y. T. Shi, Y. S. Zhang and Y. Li, “Thoughts on the future development of plant protection drones,” Shaanxi Journal of Agricultural Sciences, vol. 62, no. 3, pp. 119–121, 2016. [Google Scholar]
3. Y. B. Lan and G. B. Wang, “China's plant protection drone industry development overview and development prospects,” Agricultural Engineering Technology, vol. 62, no. 3, pp. 119–121, 2016. [Google Scholar]
4. J. Y. Jing, Y. Zhu and S. T. Zeng, “Research on the endurance of small multi-rotor UAV,” Computer Knowledge and Technology, vol. 13, no. 16, pp. 197–199, 2017. [Google Scholar]
5. X. M. Yuan, L. Li, H. D. Guo and T. Dong, “Energy and environmental impact of battery electric vehicle range in China,” Applied Energy, vol. 157, pp. 75–84, 2015. [Google Scholar]
6. S. B. Wang and J. Chen, “Research on flight safety of plant protection UAV,” China Aerospace Security Conference, Dalian, China, 2017. [Google Scholar]
7. D. Aleksandrov and I. Penkov, “Energy consumption of mini UAV helicopters with different number of rotors,” in 11th Int. Symp. Topical Problems in the Field of Electrical and Power Engineering, Parnu, Estonia, pp. 259–262, 2012. [Google Scholar]
8. J. L. Lin, Y. B. Lan, F. Ouyang, J. Y. Li and P. C. Chen, “Construction and experimental verification of power consumption model for multi rotor agricultural UAV,” Transactions of the Chinese Society for Agricultural Machinery, vol. 5, pp. 143–149, 2020. [Google Scholar]
9. F. Yacef, N. Rizoug, O. Bouhali and M. Hamerlain, “Optimization of energy consumption for quadrotor UAV,” in Proc. of the Int. Micro Air Vehicle Conf. and Flight Competition, Toulouse, France, pp. 18–21, 2017. [Google Scholar]
10. W. C. Xu, K. Chen and M. Zhang, “Life lifting scheme for plant protection UAV based on solar,” Journal of Agricultural Science and Technology, vol. 20, no. 11, pp. 68–74, 2018. [Google Scholar]
11. A. Abdullah, “Online prediction of battery discharge and flight mission assessment for electrical rotorcraft,” AIAA Aerospace Sciences Meeting, Kissimmee, America, pp. 8–12, 2018. [Google Scholar]
12. J. Y. Li, H. Y. Luo, C. W. Zhu, Y. F. Li and F. Tang, “Research and implementation of combination algorithms about UAV spraying planning based on energy optimization,” Transactions of the Chinese Society for Agricultural Machinery, vol. 50, no. 10, pp. 106–115, 2019. [Google Scholar]
13. H. V. Abeywickrama, B. A. Jayawickrama, Y. He and A. E. Dutkiewicz, “Comprehensive energy consumption model for unmanned aerial vehicles, based on empirical studies of battery performance,” IEEE Access, vol. 6, pp. 58383–58394, 2018. [Google Scholar]
14. C. Di Franco and G. Buttazzo, “Energy-aware coverage path planning of UAVs,” in IEEE Int. Conf. on Autonomous Robot Systems and Competitions, Espinho, Portugal, pp. 111–117, 2015. [Google Scholar]
15. D. H. Tran, T. X. Vu and S. Chatzinotas, “Coarse trajectory design for energy minimization in UAV-enabled,” IEEE Transactions on Vehicular Technology, vol. 69, no. 9, pp. 9483–9496, 2020. [Google Scholar]
16. M. Elloumi, B. Escrig, R. Dhaou, H. Idoudi and L. Azzouz, “Designing an energy efficient UAV tracking algorithm,” in 2017 13th Int. Wireless Communications and Mobile Computing Conf., Valencia, Spain, IEEE, pp. 127–132, 2017. [Google Scholar]
17. Z. X. Zhang, Q. F. Xia and Y. Cao, “Multi-rotor UAV endurance optimization,” Ordnance Industry Automation, vol. 39, no. 10, pp. 93–96, 2020. [Google Scholar]
18. M. Q. Zhang and H. X. Chen, “Estimated model of range and endurance of small electric UAVs,” Acta Aeronautica et Astronautica Sinica, vol. 42, no. 3, pp. 625085, 2021. [Google Scholar]
19. F. Xiao, W. Liu, Z. T. Li, L. Chen and R. Wang, “Noise-tolerant wireless sensor networks localization via multi-norms regularized matrix completion,” IEEE Transactions on Vehicular Technology, vol. 67, no. 3, pp. 2409–2419, 2018. [Google Scholar]
20. D. Li, M. Cheng, Y. Yang, M. Lei and L. Shen“ “a fast two-stage black-box deep learning network attacking method based on cross-correlation,” Computers, Materials & Continua, vol. 64, no. 1, pp. 623–635, 2020. [Google Scholar]
21. Z. T. Li, B. M. Chang, S. G. Wang, A. F. Liu, F. Z. Zeng et al., “Dynamic compressive wideband spectrum sensing based on channel energy reconstruction in cognitive internet of things,” IEEE Transactions on Industrial Informatics, vol. 14, no. 6, pp. 2598–2607, 2018. [Google Scholar]
22. T. Q. Nguyen, T. T. D. Nguyen, H. Nguyen-Xuan and N. K. Ngo, “A correlation coefficient approach for evaluation of stiffness degradation of beams under moving load,” Computers, Materials & Continua, vol. 61, no. 1, pp. 27–53, 2019. [Google Scholar]
23. C. Zhang, J. Cheng, X. Tang, V. Sheng, Z. Dong et al., “Novel DDoS feature representation model combining deep belief network and canonical correlation analysis,” Computers, Materials & Continua, vol. 61, no. 2, pp. 657–675, 2019. [Google Scholar]
24. N. Lei, C. Z. Jing and J. B. Li, “Optimizing methods of improving UAV operation quality for plant protection,” Modern Agricultural Technology, vol. 13, pp. 140–143, 2017. [Google Scholar]
 | This work is licensed under a Creative Commons Attribution 4.0 International License, which permits unrestricted use, distribution, and reproduction in any medium, provided the original work is properly cited. |