DOI:10.32604/cmc.2022.022153
| Computers, Materials & Continua DOI:10.32604/cmc.2022.022153 | |
| Article |
Sparse Crowd Flow Analysis of Tawaaf of Kaaba During the COVID-19 Pandemic
1Department of Computer Systems Engineering, University of Engineering and Technology, Peshawar, Pakistan
2Department of Computer Science, College of Computer, Qassim University, Buraydah, Saudi Arabia
3Department of Information Technology, College of Computer, Qassim University, Buraydah, Saudi Arabia
4Department of Information Technology and Computer Science, Pak-Austria Fachhochschule, Institute of Applied Sciences and Technology, Haripur, Pakistan
5Department of Electrical Engineering, College of Engineering and Information Technology, Onaizah Colleges, Al-Qassim, Saudi Arabia
*Corresponding Author: Ali Mustafa Qamar. Email: al.khan@qu.edu.sa
Received: 29 July 2021; Accepted: 02 September 2021
Abstract: The advent of the COVID-19 pandemic has adversely affected the entire world and has put forth high demand for techniques that remotely manage crowd-related tasks. Video surveillance and crowd management using video analysis techniques have significantly impacted today's research, and numerous applications have been developed in this domain. This research proposed an anomaly detection technique applied to Umrah videos in Kaaba during the COVID-19 pandemic through sparse crowd analysis. Managing the Kaaba rituals is crucial since the crowd gathers from around the world and requires proper analysis during these days of the pandemic. The Umrah videos are analyzed, and a system is devised that can track and monitor the crowd flow in Kaaba. The crowd in these videos is sparse due to the pandemic, and we have developed a technique to track the maximum crowd flow and detect any object (person) moving in the direction unlikely of the major flow. We have detected abnormal movement by creating the histograms for the vertical and horizontal flows and applying thresholds to identify the non-majority flow. Our algorithm aims to analyze the crowd through video surveillance and timely detect any abnormal activity to maintain a smooth crowd flow in Kaaba during the pandemic.
Keywords: Computer vision; COVID sparse crowd; crowd analysis; flow analysis; sparse crowd management; tawaaf video analysis; video processing
Public places like theme parks, airports, and even mosques used to be crowded in general. With the emergence of the COVID-19 pandemic and the enforcement of social distancing policies, the crowds have now reduced and are primarily organized [1]. The first case of COVID-19 was reported in Wuhan, China, in December 2019 [2]. The World Health Organization declared COVID-19 as a pandemic on March 11, 2020. The number of coronavirus cases stands at more than 211 Million as of August 23, 2021. Moreover, more than 4.4 million have died from COVID-19 [3].
The automatic monitoring of crowds has become even more critical from a security and health point of view. Among the most effective measures to limit the spread of coronavirus are face masks and the implementation of social distancing. Crowd density, the average number of people in a scene, could be exploited to determine the crowd's direction [4]. Crowd events such as local dispersion, running, crowd splitting, evacuation, and crowd formation must be identified quickly [5].
Makkah and Medina are the two holiest places for Muslims. Makkah is home to the Kaaba, the most sacred site in Islam. Muslims around the world pray in the direction of the Kaaba. Circling the Kaaba seven times in a counter-clockwise direction, also referred to as Tawaaf, is obligatory to complete Umrah and Hajj pilgrimages. In this research, we analyze the flow of the crowd while performing Tawaaf during the COVID-19 pandemic. The dynamics of the crowd have dramatically changed during the COVID-19 pandemic. The crowds are now generally sparse in nature because of social distancing. The same trend is observed during Tawaaf. More than 2.5 Million Muslims gather in Makkah yearly to perform Hajj. However, only 1000 worshipers were allowed to proceed for Hajj in 2020 and around 60000 in 2021 due to the ongoing COVID-19 pandemic. This research presents a novel data set related to Tawaaf, gathered during the COVID-19 pandemic. We developed a system to detect the movement of the crowd along with finding different kinds of anomalies.
The rest of the paper is organized as follows: the motivation is provided in Section 2, and the contributions along with the research gap are given in Section 3. Similarly, the state-of-the-art is discussed in Section 4, followed by the proposed methodology in Section 5. Section 6 presents the experimental setup, while the results and discussion are provided in Section 7. Some applications of anomaly detection are discussed in Section 8. The article is concluded in Section 9, along with giving some future directions.
Before COVID-19, the congestion and crowding in the two holy mosques were normal and acceptable. However, after the emergence of COVID-19, the situation became precarious due to the possibility of infection spread between pilgrims and visitors. The flow of people within the holy mosques must be well organized and monitored to ensure the physical distancing during the crowd motion.
The motivation of the crowd motion in this article is to propose a vertical and horizontal-based framework for automating the task of monitoring social distancing during the Tawaaf of Kaaba.
The proposed framework utilizes a combination of Shi-Tomasi and Lucas-Kanade models to detect moving pedestrians. An algorithm has been developed to segregate humans from the background and track the identified people with the help of horizontal and vertical flows to identify the non-majority flow. Motivated by this, in this present work, the authors are attempting to check and compare the performance of object detection by using the histogram to monitor social distancing.
3 Contributions and the Research Gap
In this paper, the authors analyzed the moment behavior related to factors affecting the risk of COVID-19 moment in the crowd during Tawaaf in Kaaba. Since one of the most important ways to avoid exposure is to reduce contact with other people, the authors measured the distance between the people during the Tawaaf. For this purpose, the research obtained preferences between a crowded-but-low-wait-time and a less crowded but higher wait time alternative. The research gap is presented in the context of exposure duration (operationalized as the moment time of the alternatives) and infection rate to examine the effects of these risk-contributing factors on choice behavior. The data were collected from the Kaaba during Tawaaf at the end of the first infection wave, just as the first restrictions were being lifted and new regulations were set up for Umrah in Kaaba travel. The authors believe that behavioral insights from this study will not only contribute to better demand forecasting but will also be valuable in informing the pandemic decisions for Umrah.
Hajj and Umrah crowd management is a challenging task even in the normal situations before the COVID-19 pandemic, which is due to different reasons. People gather in very limited areas coming from all over the world with different languages and cultures [6]. Most of them have not been to the two holy cities of Makkah and Madina before, and they do not have experience with the environment, which is often reflected in people's behaviors during Hajj and Umrah. Due to this, pilgrims usually move as groups of people with a guide to provide them with instructions and rules and answer their queries about performing the worship activities. This makes the movements of such groups represent another challenge to crowd management.
Anees et al. [4] developed an approach to determine the direction of the global movement of the crowd. The dense areas were identified using key-point descriptors, which ultimately contributed to finding the flow direction. Many researchers have performed extensive surveys related to crowd analysis using surveillance videos. One such survey was performed by Zhang et al. [7], where the researchers focused only on physics-based methods. Just like physics, a crowd video could be analyzed from three different angles: microscopic, mesoscopic, and macroscopic. In microscopic methods, the behavior of each individual is analyzed. Such methods could be applied to a small crowd but become too tedious to handle for a large-scale crowd. On the other hand, macroscopic approaches treat the crowd as a whole. Such techniques determine the crowd's behavior by the collective performance and are most suited for large-scale crowds with the same movement pattern. Mesoscopic methods could be considered hybrid and consider the pros and cons of microscopic and macroscopic levels [8].
Fradi [9] developed a hybrid method while considering the long-term trajectories to consider local and global attributes. In this way, he was able to determine the motion in the given video. The local crowd density was used along with crowd speed and orientation. He discussed that running events are generally characterized by calculating the speed. Nevertheless, it is also essential to determine the number or density of people implicated in these events. The evacuation event was identified using attributes like speed, direction, and crowd density. This event can be detected using four principal directions, which have to be distant from one another. A reduction in the density, an increase in speed, and the motion area indicate that evacuation is being done. However, a crowd formation event occurs when many persons from different directions merge at the same location. Here, an increase in the density and a decrease in the motion area are observed. 100% precision and a recall value of 92.5% were observed for crowd change detection. Similarly, the crowd event recognition method achieved accuracy values of 100% for splitting, 99.8% for evacuation, and 99.5% for formation.
Nam [10] developed an approach to detect abnormal events from structured and unstructured motion and flows of crowds. He considered features like the speed and the direction of moving objects in videos. The experiments are conducted on highways, crosswalks, and escalators. The flux analysis yielded the types of moving patterns. The proposed algorithm was able to detect wrong-way driving on a T-junction. Anomalies were detected in crowds by Irfan et al. [11]. The researchers classified the movement patterns into normal and abnormal activities using the Random Forest algorithm. The videos were made using mobile phones, and the system was presented as an alternative to video sensors. In another research, Li [12] developed a crowd density estimation algorithm specific to touristic places. She discussed that business managers neither want too high crowd density nor need too-small density. A too big value can lead to a stampede, and a too-small value might not be commercially feasible. The crowd density monitoring could be performed in real-time by analyzing the behavior of the crowd movement. The author combined the agglomeration and the crowd density to get a novel algorithm. Whereas aggregation refers to the degree to which a person participates in a group movement, agglomeration represents the crowd's density and is directly proportional to the density [13]. Baqui et al. [14] developed a model to perform real-time monitoring of the Hajj. The researchers used the footage obtained from the closed-circuit television (CCTV) cameras in the Tawaaf area. Six hundred image segments were manually annotated using dot annotation. In this technique, a dot is placed on all the heads present in a segment. The input images were divided into 100 parts. It took 32.79 s to process just two frames of the dataset.
Löhner et al. [15] developed two models to describe the motion in the Mataaf region. The first model allocates a preferred distance from the Kaaba to each pilgrim. In this way, the model could be used to enforce social distancing in the context of COVID-19. The second model assumes that the pilgrim wants to get closest to the Kaaba until a tolerable density is achieved. The models were implemented in PEDFLOW [16], a pedestrian flow and crowd simulation software. Lohner et al. [17] ran an experimental campaign to measure the flow of the pilgrims during the Hajj season of 2014 and 2015. An increase in velocity was observed in the high-density regions. This increased velocity pointed to an increase in the flux for higher density regions (more than eight persons/m2). The flux increased to more than 3.2 persons/meter/second, more than any flux reported to date.
In a recent study, Kolivand et al. [18] simulated crowd movements at the Tawaf area using a high-density model. The model was more realistic by considering some attributes of people such as gender, movement speed, and stopping in the crowd. One of the study's interesting findings is that as many people in the group as many stops will occur in the crowd. However, the study was short in identifying the potential bottleneck locations in the Tawaf area where frequent stops of pilgrims happen. Bouhlel et al. [19] developed macroscopic and microscopic techniques using convolutional neural networks to monitor social distancing using UAVs. The macroscopic method focuses on crowd density and crowd flow and categorizes aerial frames into dense, medium, sparse, and none. Similarly, in sparse crowds, the microscopic method helps to find the distance between humans.
In this section, we discuss the details of the proposed methodology.
5.1 Sparse Optical Flow Analysis
The optical flow analysis mechanism proposed in this work is used for predicting and analyzing the direction, position, and velocity of the crowd in the video. The optical flow in a video is termed the motion of objects between consecutive frames. We assume that the pixel intensities are constant between frames. The motion in the x (horizontal) and y (vertical) directions is expressed mathematically in Eq. (1).
where I represent the intensity, x and y are the horizontal and vertical space coordinates, t is the time slot, and dx, dy, and dt are the changes in the mentioned coordinates. The Taylors series approximation and division on dt are used to get the optical flow equation as shown in Eq. (2).
where u = dx/dt, v = dy/dt, and ∂I/∂x, ∂I/∂y, and ∂I/∂t are the image gradients along the horizontal and vertical axis and time parameters. To solve the optical flow equation as shown in Eq. (2), we need to solve the equation for ∂I/∂xu and ∂I/∂yv to attain movement over time. This requires solving for two unknowns ∂I/∂xu and ∂I/∂yv, which is not a straightforward process. Hence, we apply the Lucas-Kanade technique [20] and the one developed by Manenti et al. [21] to find these unknowns.
5.2 Sparse Features Analysis: Shi-Tomasi Corner Detector Technique
The features that are used for sparse crowd videos are edges and corners. The Shi-Tomasi [22] and Olson [23] techniques compute the flow over small patches taking the local method and considering the flow constant for all pixels. Shi-Tomasi corner detector tracks pixels locally to track the motion of the feature set of all pixels. The Shi-Tomasi technique first determines the windows of small patches with large gradients, i.e., image intensity variations when translated in x and y directions. We later compute the R score to identify the window as flat, edge, or corner in the Shi-Tomasi scoring function, mathematically shown in Eq. (3).
where λ1 and λ2 are Shi-Tomasi window space, which means that if R is greater than a threshold, it is classified as a corner. For Shi-Tomasi, only when λ1 and λ2 are above a minimum threshold (λmin), is the window classified as a corner, while in case λ1 > λ2 or λ1 < λ2 then the window is considered to be an edge and uniform or a flat region otherwise. Fig. 1 gives an illustration of Shi-Tomasi corner detection in λ1–λ2 space. The key considerations by the Shi-Tomasi technique for each pixel are that each pixel has the following properties:
1) Color Constancy
2) Brightness Constancy
3) Small motion with respect to nearby pixels
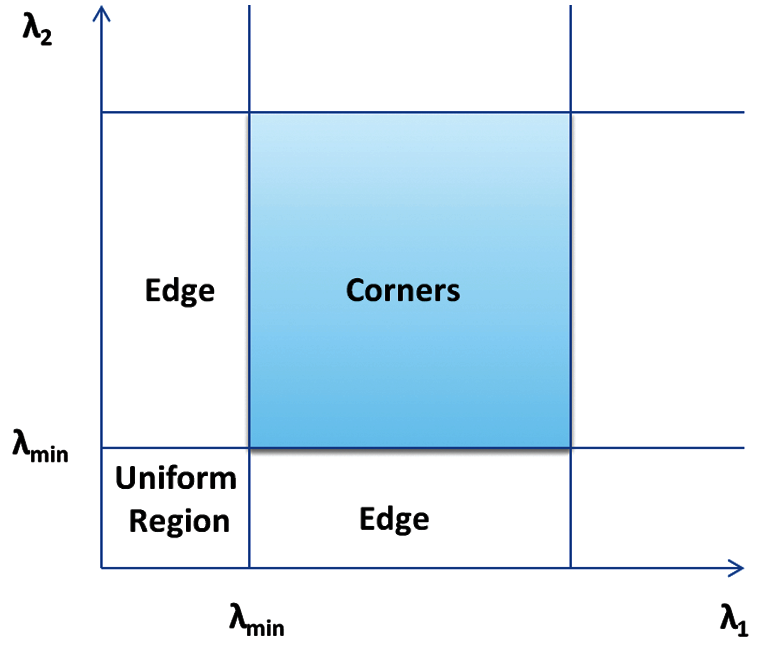
Figure 1: An illustration of Shi-Tomasi corner detection in λ1–λ2 space
5.3 Tracking Specific Object: Lucas-Kanade Technique
For tracking a specific object in a frame, a previous frame with extracted features is used. The features of the previous frame are compared with the current frame for tracking specific objects. This comparison provides information about the motion of interesting features by comparing the consecutive frames. Iterative image registration is carried out with the Lucas-Kanade method that estimates motion in Tawaaf videos. The Lucas-Kanade technique, also known as the Lucas-Kanade translational warp model, uses the image frame-by-frame for three kinds of analysis [20]. These three kinds of analysis include spatial analysis as depicted in Eqs. (4) and (5), optical flow analysis as shown in Eqs. (6) and (7), and temporal analysis as shown in Eq. (8).
The Lucas-Kanade translational warp model takes two consecutive frames separated by a short time interval (dt) that is kept short on purpose for attaining good performance on slowly moving objects. A small window is taken within each frame to be used around the features detected by the Shi-Tomasi corner detecting filter. The motion is detected from each set of consecutive frames if single or multiple points within the window are moving. It is assumed that the whole frame is moving if a movement in the window is detected. This way, the movement is detected at the lowest resolution and systematically moved to the whole image frame, i.e., higher resolution. Fig. 2 illustrates the windowing process (N × N neighborhood) of Lucas-Kanade around Shi-Tomasi features. The whole N × N window is assumed to have the same motion.
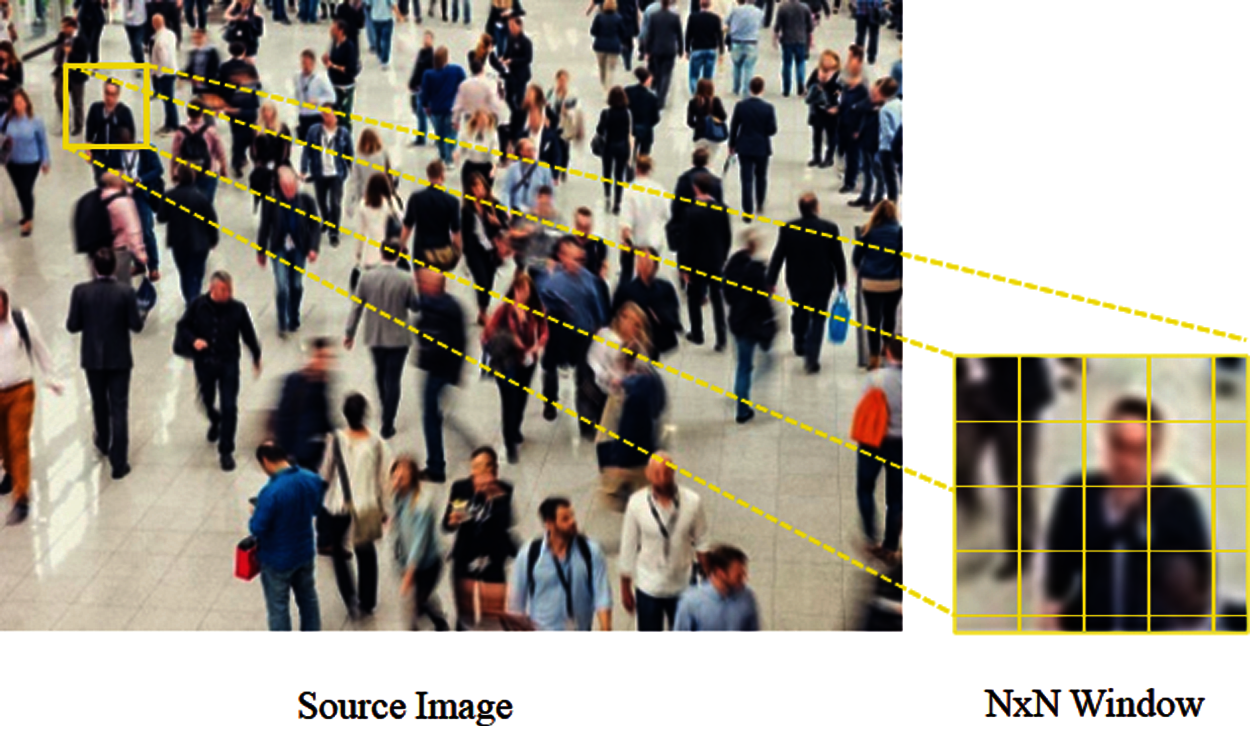
Figure 2: An illustration of the windowing process (N×N neighborhood) of Lucas-Kanade around Shi-Tomasi features
The Lucas-Kanade N×N pixels’ intensities can be represented in Eqs. (9), (10), and (11).
where p1, p2, …, pn are the pixels inside each window, and Ix (pi), Iy (pi), and It (pi) represent the partial derivatives of the image I with respect to the position (x, y) and time t. For instance, if a window of size 3 × 3 is used, the value for n = 9 and N = 3. Vx= u = dx/dt, as discussed earlier, is the horizontal movement of x over time and Vy= v = dy/dt is the vertical movement of y over dt. In short, we identify some interesting features to track and iteratively compute the optical flow vectors of these points. The Lucas-Kanade method goes stepwise from a small-level view to a high-level view, where small motions are neglected and large motions are reduced to small motions. This is the shortcoming of the method as it works for small movements only and fails to optimally detect the large movements as the short movements do not represent the large movements.
5.4 Detecting Abnormal Flow: Maximum Histogram Technique
Once the flow coordinates are attained through Shi-Tomasi and Lucas-Kanade techniques, separate histograms are generated for each horizontal and vertical motion. These histograms are taken to analyze the maximum flow in the video while using this information to detect any motion not in the same direction as that of the maximum flow. As in Tawaaf, the maximum crowd moves in a similar direction; this feature can detect an anomaly or abnormal movement in the crowd. We take manual thresholds for each video as each video has a different crowd and behavior, and as future enhancement of this work, we propose to deploy ML algorithms to automate the value of these thresholds for all kinds of videos. Our proposed algorithm detects any unusual flow against the standard anticlockwise flow and spots any lateral movements, such as the pilgrims weaving to the left or right. The notations used in this paper are summarized in Tab. 1.

5.5 Proposed Algorithm and Flowchart
In order to analyze the Tawaaf video for crowd analysis and anomaly detection, we take the video frame-by-frame and track the movement of the crowd in the vertical and horizontal directions. These motions are traced using the iterative Shi-Tomasi algorithm's corner detection mechanism for finding the strongest corners in the frame. The details are presented in Fig. 3. After finding the corners in the first frame, an iterative algorithm is applied to each consecutive set of frames to compute the flow in x (vertical) and y (horizontal) directions. The Lucas-Kanade technique is used for flow computation. The coordinates for x and y direction motions are tallied and stored into histograms to analyze the maximum motion quickly. These histograms are deployed to detect any motion in a non-majority direction and mark it as abnormal flow. The thresholds are selected manually by thoroughly analyzing the histograms while focusing on the regions of condensed displacements in the vertical and horizontal directions. The regions in histograms where the displacements become low are marked as limits for the thresholds. After marking the thresholds, the response is observed and verified in the video. This process is repeated unless the optimal thresholds are selected and improved results are obtained. Initially, the thresholds are set manually for each video and utilized to automate the normal vs. abnormal flow.
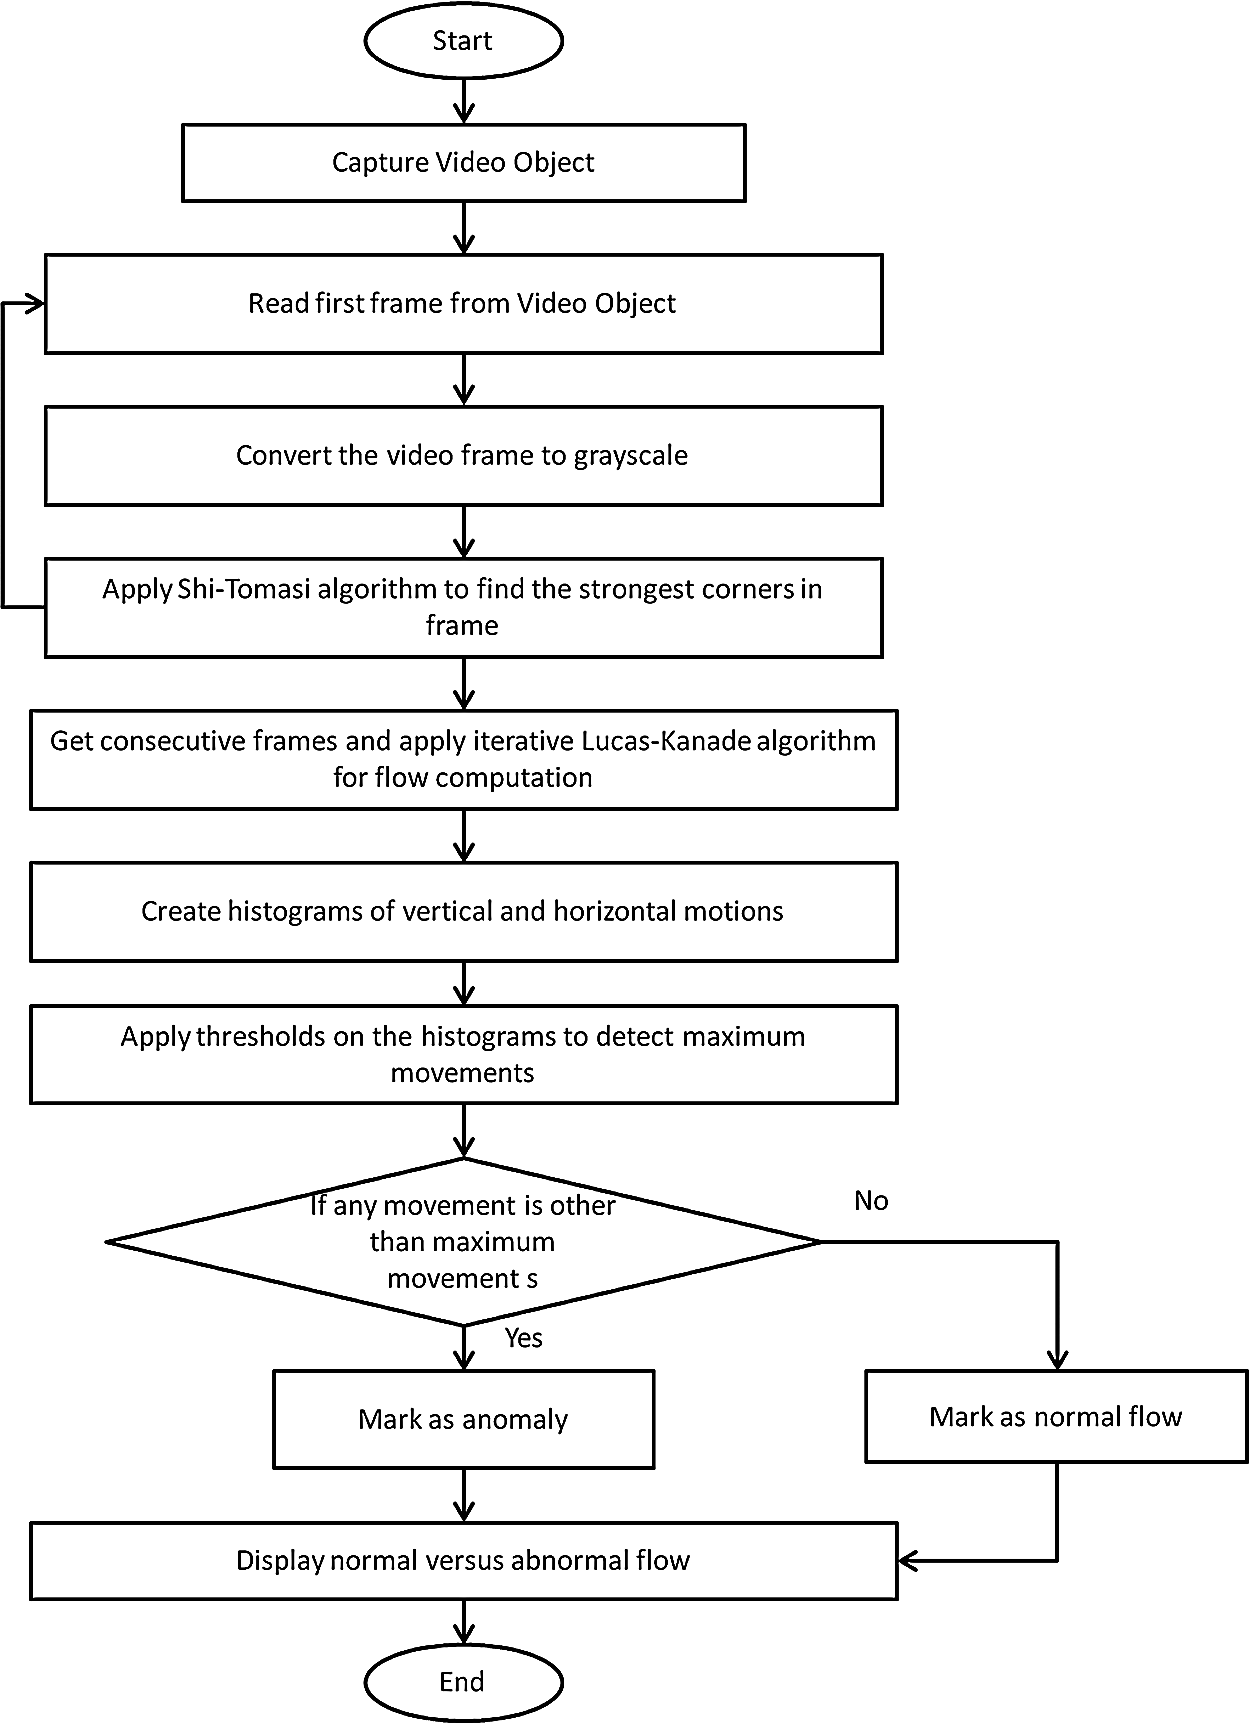
Figure 3: Flowchart of the proposed approach
The stepwise implementation of the proposed algorithm in the form of Pseudo-Code is provided in Algorithm 1.

Python libraries are employed to implement our algorithms, such as OpenCV-python libraries, to read the video file and set up various parameters to pre-process the video files. The video files are initially converted to the grayscale frame-by-frame so that the algorithms and methods can be applied to them. The Shi-Tomasi technique selects the pixels for tracking and finds the strongest corners in a frame using cv.goodFeaturesToTrack() implementation in OpenCV. For the detection of motion of an object, the Lucas-Kanade algorithm is applied on consecutive frames over a small-time duration dt. The OpenCV implementation of Lucas-Kanade calcOpticalFlowPyrLK() is employed for flow analysis. calcOpticalFlowPyrLK() returns the next frame, status of a motion, and error message determining if the frame is not suitable for detecting the motion. The function takes as input the previous frame, its grayscale value, previous frame good features, and other parameters for the Lucas-Kanade technique. Both the corners and the motions are traced in separate masks, and frame overlays through cv.line() and cv.mask() functions are added on each video frame after computation of motion using cv.add() function. The evaluation was performed on a set of Tawaaf videos obtained from YouTube. The videos are collected during Hajj 2020 and regular Umrah being performed after the emergence of COVID-19. The videos contain only a sparse crowd owing to the social distancing rules implemented since COVID-19. Each video is of 20 s duration and is in MP4 format. The frames are taken at each 10 ms, i.e., 100 frames per second are taken. We have analyzed seven different video samples of Tawaaf and provided the results of four videos in Section 7.
We have evaluated various short videos from Tawaaf of the Kaaba during the COVID-19 pandemic when the crowd is sparse and maintains social distancing. The annotation is added in the video through coding by marking the majority flow of each object (crowd) in green trails and showing the track of the flow while processing the video. The video is analyzed through histograms to evaluate the maximum flow, and thresholds are applied on the flow counts to separate the abnormal movement marked through coding annotation in a red circle.
Fig. 4 shows the screenshots from the first video analysis of Tawaaf that illustrate the crowd tracks in majority directions marked in green and minority movements are marked red and depict abnormal or anomaly movements. These annotations are done through coding, whereas the squares to highlight the abnormal movements are inserted manually, which can be automated later on. It can be observed from the tracks in Fig. 4 that the objects (people) marked inside the squares are either still or moving in directions that are not the same as the majority. In Tawaaf, the crowd flow follows similar tracks with respect to each other and does not follow the same directions in general because the flow around Kaaba is circular, i.e., forward, backward, upward, and downward. Hence, specifying a particular direction as an anomaly does not imply in the case of Kaaba crowd analysis, but specifying the majority flow and tracking the flow against the majority does imply. Some of the movements that are not characterized correctly are highlighted with red dotted squares, which we aim to improve in the future as an extension of this work using machine learning techniques.

Figure 4: Flow analysis of sparse crowd in Tawaaf showing the majority (marked green) flow vs. abnormal flow (marked red) in Video 1
Figs. 5 and 6 show the histograms of horizontal and vertical flow, respectively. The histograms are taken while the video frames are being read. It can be observed from the histograms that the aggregate of the individual movement increase as more frames are read, but there are regions where the aggregates are very minute and not changing much. We target these minute movements and applied thresholds on such small movements. For instance, in Video 1, the horizontal flow is concentrated between 150 and 550, and the vertical flow is concentrated around 330. We use the vertical threshold in Video 1 as the vertical histograms are more intricate than the horizontal ones.

Figure 5: Histogram of horizontal flow in Video 1

Figure 6: Histogram of vertical flow in Video 1
Fig. 7 shows the results from the second video analysis of Tawaaf. It illustrates the crowd tracks in majority directions marked in green, and minority movements are marked red to show abnormal or anomaly movements. It is observed from the tracks in Fig. 7 that the objects (people) marked inside the red squares are either still or moving in the directions that are not the same as the majority, while the majority follows the green tracks programmed to show the normal flow. In Video 2, we used a threshold <180 on horizontal flow as most of the movements are concentrated above <180, and in vertical flow, we used the thresholds <230. The horizontal and vertical histograms for Video 2 are shown in Figs. 8 and 9.

Figure 7: Flow analysis of sparse crowd in Tawaaf showing the majority (marked green) flow vs. abnormal flow (marked red) in Video 2

Figure 8: Histogram of horizontal flow in Video 2

Figure 9: Histogram of vertical flow in Video 2
The details for Video 3 are provided in Fig. 10, and the histograms are presented in Figs. 11 and 12. The threshold values are engineered manually by observing the histograms that we aim to automate as an extension of this work.
Another video (Video 4) is analyzed for the sparse crowd. The results are provided in Fig. 13 and the histograms in Figs. 14 and 15. It is observed in all Tawaaf videos that sharp changes are present either in horizontal or vertical directions or in some cases in both directions. We exploited these sharp changes and devised the thresholds for cutting off the anomalies as any flow is detected in unusual directions.

Figure 10: Flow analysis of sparse crowd in Tawaaf showing the majority (marked green) flow vs. abnormal flow (marked red) in Video 3

Figure 11: Histogram of horizontal flow in Video 3

Figure 12: Histogram of vertical flow in Video 3

Figure 13: Flow analysis of sparse crowd in Tawaaf showing the majority (green tracks) flow vs. abnormal flow (marked red) in Video 4

Figure 14: Histogram of horizontal flow in Video 4

Figure 15: Histogram of vertical flow in Video 4
8 Applications of Anomaly Detection
In video analysis, anomaly detection equates to outlier detection in sequences. It is a rare event detection in video sequences based on specific variables, and to flag it as the anomalous state; certain conditions must be satisfied. The goal is to signal an activity that deviates from normal behavior and identifies the anomalous action time window. Thus, anomaly detection is coarse level scene analysis that filters the abnormal pattern from the normal ones. The detection of such rare events and conditions has several applications. It can be helpful in road safety and traffic accidents. In such situations, autonomous anomaly detection can save lives and help avoid congestion in roads having such incidents. Another application is related to crime. This kind of autonomous detection of anomalous events can guide the police and law enforcement agencies towards criminal acts. Anomalous detection of events in such cases can help stop certain crimes and provide justice if the crime has been committed.
Furthermore, anomaly detection can help on several occasions in a mass gathering. Especially for Hajj and Umrah, where autonomous detection of anomalous behavior can help control the crowd. Also, this can help in avoiding stampedes, which can save thousands of lives. Moreover, in Hajj and mass gatherings, abnormal behavior detection can help medical services to focus on particular conditions and special people during the active Hajj activities. This detection can help save thousands of lives and provide quality services to the pilgrims.
Similarly, anomalous behavior detection can also help in different occasions, for example, sports and political gatherings. In these gatherings, anomalous behavior detection can help in pinpointing criminal or unwanted acts. Also, abnormal behavior detection can help in improving the quality of services on such occasions.
With the advent of the COVID-19 pandemic, the scenarios for the crowd have been significantly affected. On one side, many dense crowd situations have been converted into sparse crowd situations. Conversely, the disease has put forth high demand for managing the crowd remotely, i.e., without any physical distance. Since the nature of crowds has changed worldwide, the manner in which we address the crowd has also been affected. In the Muslim world, managing Kaaba rituals has been a crucial task since the crowd gathers from around the world and requires to be analyzed differently in the days of the pandemic. In this research, we have considered the case study of Muslim rituals in Kaaba during the COVID-19 pandemic and analyzed the sparse crowd flow. We have analyzed the Umrah videos and monitored the sparse flow of the crowd. The tracks of objects/people are monitored and grouped as normal and abnormal flow. This grouping is done by observing the histograms of the flow in vertical and horizontal directions and applying thresholds on the maximum flow. The majority movement is considered to be normal, while other movements are classified as abnormal or anomaly. We have worked on these videos to track the maximum crowd flow and detect any object (person) moving opposite the significant flow. This detection finds any movement that maintains smooth flow in Kaaba and detects and controls any abnormal activity through video surveillance. The work presented in this paper is initial, and as a future enhancement of this work, we aim to develop an adaptive method for selecting thresholds for anomaly detection and applying machine learning techniques to generalize the algorithm. We also intend to diversify the proposed algorithm's application by applying it to other crowd videos and extending the work from sparse to dense crowd analysis using deep learning techniques. More specifically, we plan to apply our approach to dense Tawaaf and Sa'i videos collected before the pandemic of COVID-19.
Funding Statement: The authors extend their appreciation to the Deputyship for Research and Innovation, Ministry of Education in Saudi Arabia for funding this research work through the Project Number QURDO001. Project title: Intelligent Real-Time Crowd Monitoring System Using Unmanned Aerial Vehicle (UAV) Video and Global Positioning Systems (GPS) Data.
Conflicts of Interest: The authors declare that they have no conflicts of interest to report regarding the present study.
1. C. Baraniuk, “Covid-19: People are gathering again, but can crowds be made safe?,” British Medical Journal, vol. 371, m3511, 2020. [Google Scholar]
2. Listings of WHO's response to COVID-19, (2020). [Online]. Available: https://www.who.int/news/item/29-06-2020-covidtimeline. [Google Scholar]
3. World Health Organization Coronavirus Disease (COVID-19) Dashboard, (2021). [Online]. Available: https://covid19.who.int/. [Google Scholar]
4. V. M. Anees and G. S. Kumar, “Direction estimation of crowd flow in surveillance videos,” in Proc. 2017 IEEE Region 10 Symposium (TENSYMP), Cochin, India, pp. 1–5, 2017. [Google Scholar]
5. E. Felemban, F. Rehman, S. A. A. Biabani, A. Ahmad, A. Naseer et al., “Digital revolution for hajj crowd management: A technology survey,” IEEE Access, vol. 8, pp. 208583–208609, 2020. [Google Scholar]
6. M. Osman and A. Shaout, “Hajj guide systems-past, present and future,” International Journal of Emerging Technology and Advanced Engineering, vol. 4, no. 8, pp. 25–31, 2014. [Google Scholar]
7. X. Zhang, Q. Yu and H. Yu, “Physics inspired methods for crowd video surveillance and analysis: A survey,” IEEE Access, vol. 6, pp. 66816–66830, 2018. [Google Scholar]
8. S. Basalamah and F. Rehman, “A survey on hajj mobile applications,” International Journal of Computer Science and Network Security, vol. 20, pp. 15–30, 2020. [Google Scholar]
9. H. Fradi, “New insights into crowd density analysis in video surveillance systems,” Ph.D. dissertation, TELECOM ParisTech, France, 2014. [Google Scholar]
10. Y. Nam, “Crowd flux analysis and abnormal event detection in unstructured and structured scenes,” Multimedia Tools and Applications, vol. 72, pp. 3001–3029, 2013. [Google Scholar]
11. M. Irfan, L. Tokarchuk, L. Marcenaro and C. Regazzoni, “Anomaly detection in crowds using multi sensory information,” in Proc. 15th IEEE Int. Conf. on Advanced Video and Signal Based Surveillance (AVSS), Auckland, New Zealand, pp. 1–6, 2018. [Google Scholar]
12. L. Li, “A crowd density detection algorithm for tourist attractions based on monitoring video dynamic information analysis,” Complexity, vol. 2020, pp. 1–14, 2020. [Google Scholar]
13. S. Eldursi, N. Alamoudi, F. Haron, F. Aljarbua and G. Albakri, “Crowd density estimation system for al-masjid al-haram,” International Journal of Computing, Communications & Instrumentation Engineering, vol. 4, no. 1, pp. 60–63, 2017. [Google Scholar]
14. M. Baqui and R. Löhner, “Towards real-time monitoring of the hajj,” Collective Dynamics, vol. 5, pp. 394–402, 2020. [Google Scholar]
15. R. Löhner, E. Haug and B. Muhamad, “Social force modeling of the pedestrian motion in the Mataf,” Collective Dynamics, vol. 5, pp. 528–530, 2020. [Google Scholar]
16. R. Kukla, J. Kerridge, A. Willis and J. Hine, “Pedflow: Development of an autonomous agent model of pedestrian flow,” Transportation Research Record, vol. 1774, no. 1, pp. 11–17, 2001. [Google Scholar]
17. R. Lohner, B. Muhamad, P. Dambalmath and E. Haug, “Fundamental diagrams for specific very high density crowds,” Collective Dynamics, vol. 2, pp. 1–15, 2018. [Google Scholar]
18. H. Kolivand, M. S. Rahim, M. S. Sunar, A. Z. A. Fata, and C. Wren, “An integration of enhanced social force and crowd control models for high-density crowd simulation,” Neural Computations and Applications, vol. 33, pp. 6095–6117, 2021. [Google Scholar]
19. F. Bouhlel, H. Mliki and M. Hammami, “Crowd behavior analysis based on convolutional neural network: Social distancing control COVID-19,” in Proc. of the 16th Int. Joint Conf. on Computer Vision, Imaging and Computer Graphics Theory and Applications (VISIGRAPP), Online streaming, pp. 273–280, 2021. [Google Scholar]
20. B. D. Lucas and T. Kanade, “An iterative image registration technique with an application to stereo vision,” in Proc. 7th Int. Joint Conf. on Artificial Intelligence-Volume 2, IJCAI’81, San Francisco, CA, USA, pp. 674–679, 1981. [Google Scholar]
21. L. Manenti, S. Manzoni, G. Vizzari, K. Ohtsuka and K. Shimura, “An agent-based proxemic model for pedestrian and group dynamics: Motivations and first experiments,” in Proc. Multi-Agent-Based Simulation XII, Berlin, Heidelberg, pp. 74–89, 2012. [Google Scholar]
22. J. Shi and C. Tomasi, “Good features to track,” in Proc. IEEE Conf. on Computer Vision and Pattern Recognition (CVPR), Seattle, WA, USA, pp. 593–600, 1994. [Google Scholar]
23. C. Olson, “Maximum-likelihood template matching,” in Proc. IEEE Conf. on Computer Vision and Pattern Recognition (CVPR), vol. 2, Hilton Head, SC, USA, pp. 52–57, 2000. [Google Scholar]
 | This work is licensed under a Creative Commons Attribution 4.0 International License, which permits unrestricted use, distribution, and reproduction in any medium, provided the original work is properly cited. |