DOI:10.32604/cmc.2022.022686
| Computers, Materials & Continua DOI:10.32604/cmc.2022.022686 | |
| Article |
Design of Intelligent Alzheimer Disease Diagnosis Model on CIoT Environment
1Department of Computer and Self Development, Preparatory Year Deanship, Prince Sattam bin Abdulaziz University, Al-Kharj, 16278, Saudi Arabia
2Department of Computer Science, King King Khalid University, Muhayel Aseer, 62529, Saudi Arabia
3Faculty of Computer and IT, Sana'a University, Sana'a, 61101, Yemen
4Department of Computer Science, College of Computer, Qassim University, Al-Bukairiyah, 52571, Saudi Arabia
5Department of Information Systems, College of Computer and Information Systems, Prince Sultan University, Saudi Arabia
6Department of Information Systems, King King Khalid University, Muhayel Aseer, 62529, Saudi Arabia
7Department of Natural and Applied Sciences, College of Community-Aflaj, Prince Sattam bin Abdulaziz University, Al-Kharj, 16278, Saudi Arabia
*Corresponding Author: Manar Ahmed Hamza. Email: ma.hamza@psau.edu.sa
Received: 15 August 2021; Accepted: 13 December 2021
Abstract: Presently, cognitive Internet of Things (CIoT) with cloud computing (CC) enabled intelligent healthcare models are developed, which enables communication with intelligent devices, sensor modules, and other stakeholders in the healthcare sector to avail effective decision making. On the other hand, Alzheimer disease (AD) is an advanced and degenerative illness which injures the brain cells, and its earlier detection is necessary for suitable interference by healthcare professional. In this aspect, this paper presents a new Oriented Features from Accelerated Segment Test (FAST) with Rotated Binary Robust Independent Elementary Features (BRIEF) Detector (ORB) with optimal artificial neural network (ORB-OANN) model for AD diagnosis and classification on the CIoT based smart healthcare system. For initial pre-processing, bilateral filtering (BLF) based noise removal and region of interest (RoI) detection processes are carried out. In addition, the ORB-OANN model includes ORB based feature extractor and principal component analysis (PCA) based feature selector. Moreover, artificial neural network (ANN) model is utilized as a classifier and the parameters of the ANN are optimally chosen by the use of salp swarm algorithm (SSA). A comprehensive experimental analysis of the ORB-OANN model is carried out on the benchmark database and the obtained results pointed out the promising outcome of the ORB-OANN technique in terms of different measures.
Keywords: Cognitive internet of things; machine learning; parameter tuning; alzheimer's disease; healthcare; decision making
During this digital age of modern technology, the state-of-art growths from Internet of Things (IoT) in 5G telecommunication networks, an artificial intelligence (AI) which contains Machine Learning (ML) techniques (Extreme Learning Machine (ELM), Reinforcement learning (RL), Random Forest (RF), Convolution Neural Networks (CNN), Decision Tree (DT), Long Short-term Memory Network (LSTM), Naive Bayes (NB), etc.) and deep learning (DL) approaches giving long-term solution for tackling the COVID-19 epidemic [1,2]. This technology was used for improving the analysis and cure along with help in the prevention of extent of this disease. This connected technology is support by the group of real-time data in person at remote location utilizing IoT; process, interpret, predict, and decision-making utilizing AI and big data analytics (BDA); back-up the information utilizing cloud computing (CC); and it can be improved using blockchain technology to protect data network [3].
An IoT that is assumed as an interrelated network of intelligence sensor devices frequently is restricted storing and minimum processing power ability [4]. IoT, along with CC that is enamors storing and enough processing power ability is made important services namely smart healthcare [5], feasible in the smart city environments. But the monitor and communicate remotely with patients is essential in such an environment [6]. Besides, integrate of IoT and cloud technology is given a seamless and ubiquitous structure to smart health care observing. With big data and their real-time processing approaching as to picture, the investigation community faces several problems for developing a smart and intelligent IoT–cloud structure that is capable of making their individual decisions. Therefore, the cognitive computing structure is established and presented for turning IoT as to brain-powered cognitive IoT (CIoT) [7] that retains a higher level of intelligence. Taking a cognitive IoT–cloud smart health care structure will need that IoT device within patient body (for instance, involved or around him/her) cooperates for sensing his or her disease biomarker, movement, body signal, voice, or monitored signal like electroencephalography (EEG) as well as electrocardiography (ECG); and realize the state of patient. The cognitive healthcare structure has been appropriately intelligent for making the equivalent decisions for making the patient relaxed and chooses the forthcoming course of actions by concerning distinct shareholders of smart cities.
Alzheimer disease (AD) is an advanced and progressive disease which affect brain cell, and their initial analysis is an important to suitable intervention by health professional [8,9]. Non-invasive in vivo neuroimaging approaches namely magnetic resonance imaging (MRI) and positron emission tomography (PET) were mostly used for analyzing and monitoring the development of disease and the results of treatment. The issue of evolving computer-aided diagnosis (CAD) tool for distinguishing images with AD from individuals of healthy brain is widely addressed from the previous years [10].
Aruchamy et al. [11] present novel techniques for detection of AD utilizing first order statistic features from 3D-brain Magnetic Resonance Imaging (MRI). The presented work utilizes 3D structural brain MRI for separating the white as well as grey matter MRI, remove 2D slices under the axial directions, coronal, and sagittal and elect the key slice for carrying out feature extraction. During the classification stage, distinct classifiers make the selective feature their input for predicting the classes AD or HC (Healthy Control) dependent upon observation under the validation set. Venugopalan et al. [12] utilize DL to essentially analyse imaging (MRI), genetic (single nucleotide polymorphism (SNP)), and medical tested data for classifying persons into AD, mild cognitive impairment (MCI), and control (CN). It can be utilize stacked denoising auto-encoders (AE) for extracting feature in the medical and genetic data and utilize 3D CNN to image data.
Lella et al. [13] progress an ML structure to the classifier and feature significance study of AD dependent upon communicability at the entire brain level. It is properly related to the efficiency of 3 recent classifier techniques such as support vector machine (SVM), RFs, and ANN, on the connectivity network of balanced cohort of health controlling issues and AD patient from ADNI databases. Asim et al. [14] studies separating the brain depends on distinct atlases and relating the feature removal from this anatomical parcellation to further holistic as well as robust representation. Then, it can be classification AD, MCI, and cognitively normal (CN) issues utilizing those features removed from all atlas templates and the joined features of both atlases. Lahmiri et al. [15] assess the degree to that particular features containing fractals attained from MRI.
Presently, the analytic conditions for AD are dependent upon clinical and psychometric assessment tests such as clinical dementia rate (CDR) and mini-mental state examination (MMSE) however the decisive analysis of diseases is complete by analysis of brain. There exist an immense essential to the progress of novel techniques to primary identification of AD, the amount of brain imaging approaches facilitate providing non-invasive manners to visualize of brain atrophy [10]. The situation previous analysis is not only challenging apart from vital for more treatment.
This paper presents a new Oriented Features from Accelerated Segment Test (FAST) with Rotated Binary Robust Independent Elementary Features (BRIEF) Detector (ORB) with optimal artificial neural network (ORB-OANN) for AD diagnosis and classification on the CIoT based smart healthcare system. For initial pre-processing, bilateral filtering (BLF) based noise removal and region of interest (RoI) detection processes are carried out. In addition, the ORB-OANN model includes ORB based feature extractor and principal component analysis (PCA) based feature selector. Moreover, ANN model is utilized as a classifier and the parameters of the ANN are optimally chosen by the use of salp swarm algorithm (SSA). A comprehensive experimental analysis of the ORB-OANN model is carried out on the benchmark dataset.
In short, the paper contribution is given as follows.
• Proposes a new ORB-OANN model for AD diagnosis and classification on the CIoT based smart healthcare system.
• Design a BLF based noise removal and RoI detection processes as a pre-processing step
• Present an ORB based feature extractor and PCA based feature selector for effective classification process
• Employ an SSA-ANN technique as a classifier and the parameters of the ANN are optimally chosen by the use of SSA
• Validate the efficacy of the ORB-OANN model on the benchmark dataset and inspect the results in terms of different measures.
The rest of the paper is arranged as follows. Section 2 briefs the ORB-OANN technique and Section 3 validates the performance of the ORB-OANN technique. Finally, Section 4 concludes the paper.
Fig. 1 demonstrates overall block diagram of proposed ORB-OANN method. In this study, a novel ORB-OANN technique was designed to diagnose AD in the CIoT enabled healthcare environment. Initially, the data acquisition process takes place using smart computed tomography (CT) scanners.
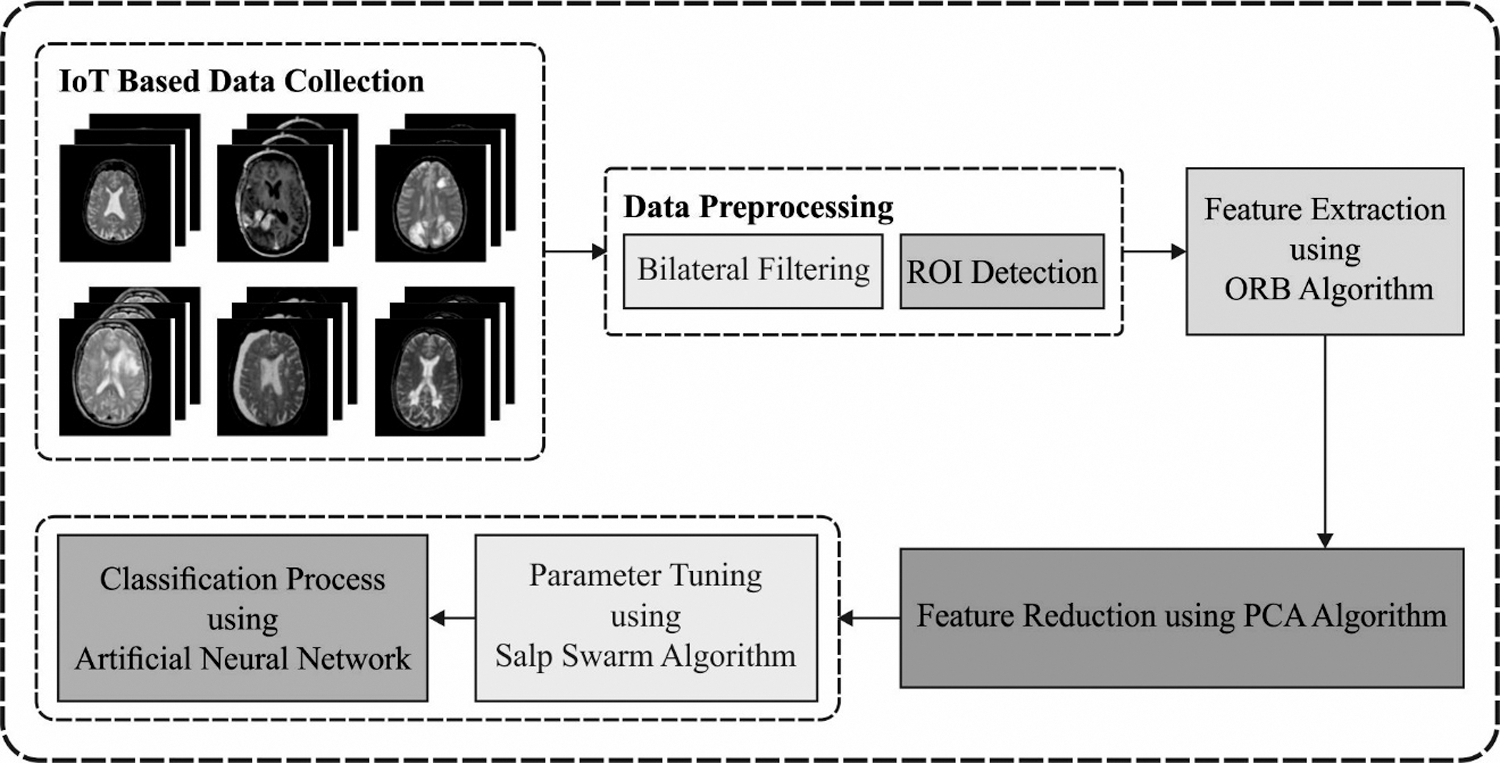
Figure 1: Block diagram of ORB-OANN model
They are linked into the network and each scanner acts as an individual node. The node transmits the sensed data to the cloud and then actual processing takes place. Then, the ORB-OANN method contains distinct stages of operations namely BLF based preprocessing, RoI detection, ORB based feature extraction, PCA based feature selection (FS), ANN based classification, and SSA based parameter tuning.
ROI could not be divisible in their surroundings, due to gray level irregularities and inexistence of solid edge beside their fringe. An image usually has noise that alters the power of pixel pointing at a state, in which the classifier winds up as indeterminate. As, the region based medicinal image compression was implemented the ROI as well as non-ROI were separated independently for expanding the steadiness of the image.
Next, the BLF technique is employed for eradicating the noise to be image. Since non-linear, edge preserving image filter technique, a BLF handle the intensity value at all the pixels as weighted average of their adjacent pixel intensity values [16]. The BLF can able to fix the issue of Gaussian blur in conventional Gaussian convolutional image filter technique since it integrates 2 elements: Euclidean distance and radiometric variance are given as:
where
In (3),
The BLF exceeds several image filtering methods because of the capacity to attain better filtering performance when maintaining crisp edges. It can be attained by integrating the range and spatial kernels in (1). In smooth areas, BLF executes as Gaussian low pass filter by average away from the smaller, weak connected variances among pixel values affected by noise, because of spatial kernel. But, it could not trivial for BLF to differentiate among thin vessels and noises while employing it in retinal image. This is affected by various features of the certain structure of thin vessels related to a general image edge that is created by dark as well as bright areas. Initially, the pixels of thin vessels conquer small parts of the pixel in local window, producing the vessel pixel to be averaging away by the spatial kernel. Later, the spatial dispersal of vessel pixel is considerably distinct from autonomous, separated image noise, however, the BLF lack functions to entirely capture the relevant features.
2.2 ORB Based Feature Extractor
The preprocessed image is passed into the ORB based feature extractor to generate a useful set of features. It works by involving an accurate orientation model for FAST utilizing Intensity Centroid Cloud (ICC) approach and reduces BRIEF rotation invariance by making a variance named steered BRIEF and then improves to
where
Assume the moment in Eq. (4), the centroid is achieved as follows:
A vector is made from the center to centroid
where atan2 denotes quadrant aware version of arc tan. Consider that consequence of illumination parameter of the corner that is not deliberated because of the angle measures remain same irrespective of the corner. The rotational invariant is enhanced by assuring the moment i.e., evaluated with respect to
Whereas
Consequently, the features are a patch function consider as vector of n binary test is given by:
In this discussion, they use Gaussian distribution near the center of patch and election of vector length
Consider that given feature set of n binary tests at certain position
Then, using
Subsequently, the BRIEF steering function is given by:
They differentiate the angle to increase
2.3 PCA Based Feature Selection
The removed feature F was possibly massive in dimension and so it is needed the reduction. The PCA was well-known approach to reduction dimension as it resolve this challenge of “curse of dimensionality” with no loss of data. The arithmetical model of PCA approach was given consecutively.
Mean
It can be measure of central tendencies. The mathematical procedure to mean is written in Eq. (12). Now, Q implies the random number and size of samples were demonstrated as l.
Standard deviation (SD)
It depicts the speed of data. The average distance among the mean as well as point at that data is computed by squaring them [18]. It could be arithmetically expressed as Eq. (13).
Covariance
It determines the quantity of variances from dimensional in the mean. The mathematical process to covariance has written in Eq. (14).
If the removed feature was reduced with their dimension, it is normalization and showing to classification.
The chosen features are given as input to the OANN model to classify the existence of AD. The network of Artificial Neuron has layers and neurons attached to the synapses that are weighted. The weights are modified with BP allowing the network to learned. The strength of neurons is controlled by activation function. It is also required to have non-linearity. Assume x is the value of weighted sum of an inputs
Instances of activation functions contain of sigmoid function (Eq. (16)
where n represents the count of resultant classes, i and j implies the
Another version of ReLU like Parametric ReLU (PReLU) (Eq. (19)) and Leaky ReLU resolves the zero-gradient issue.
where
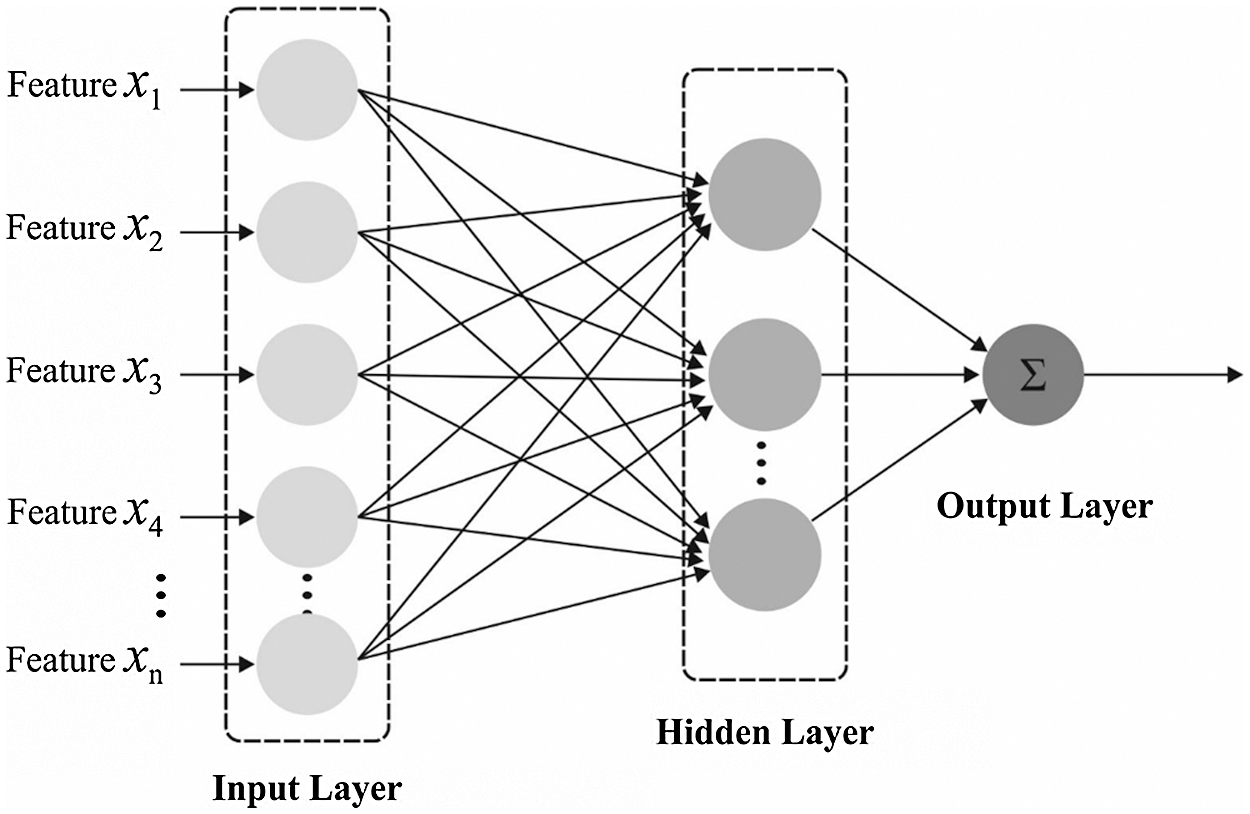
Figure 2: ANN structure
or
In order to add read on to choose activation functions, readers are stimulated for reading the work.
Another essential model of NN is computation of the cost function. The perceptron learned as computing a cost function mentioned as Mean Square Error (MSE). It is several other varieties of cost functions which are utilized for determining the resultant error. In gradient descent (GD) is helpful to this light. But, it needs the cost function is convex resultant in established of Stochastic Gradient Descent (SGD). For tuning the parameter of the ANN technique, the SSA is used and thereby enhances the detection outcomes.
SSA is determined as an arbitrary population based approach proposed by [20]. It is utilized to accelerate the swarming procedure of salp when foraging in the ocean. In the SSA method, the dominants are salps facing the chain, and balances salp is called as follower. The salp locations could be stored in a two dimensional matrix called as z. Furthermore, the food sources are represented as P in search space as the swarm destination. The arithmetical method for SSA is given as follows: The leading salps would change the position in the applications of provided equation:
The coefficient
Whereas
The summary of step-by-step definitions of this method is provided below:
1. Upload the variables of SSA such as amount of salps
2. Upload a population of S salp location randomly.
3. Evaluate the fitness of each salp.
4. Set amount of iterations to zero.
5. Update r1.
6. For each salp,
a) When
b) Otherwise, upgrade the place of followers’ salp using Eq. (25).
c) Define the fitness of each salp.
d) Update
7. Rise a to one.
8. Follow Steps 5 to 7 until
9. Offer an optimum solution
This section examines the performance analysis of the ORB-OANN technique on the diagnosis of AD. The dataset utilized to train our model was gathered from OASIS. The site suggestions a public data repository for study resolves. The dataset covers the cross-sectional brain MRI scan of different issues from the age of 18–96. An image was covering image in the sagittal, coronal, and axial planes of human brain. For testing the presented technique, MRI scan in the smart CT scanner was developed that are utilized at several hospitals linked on the Internet. Fig. 3 illustrates some sample images.
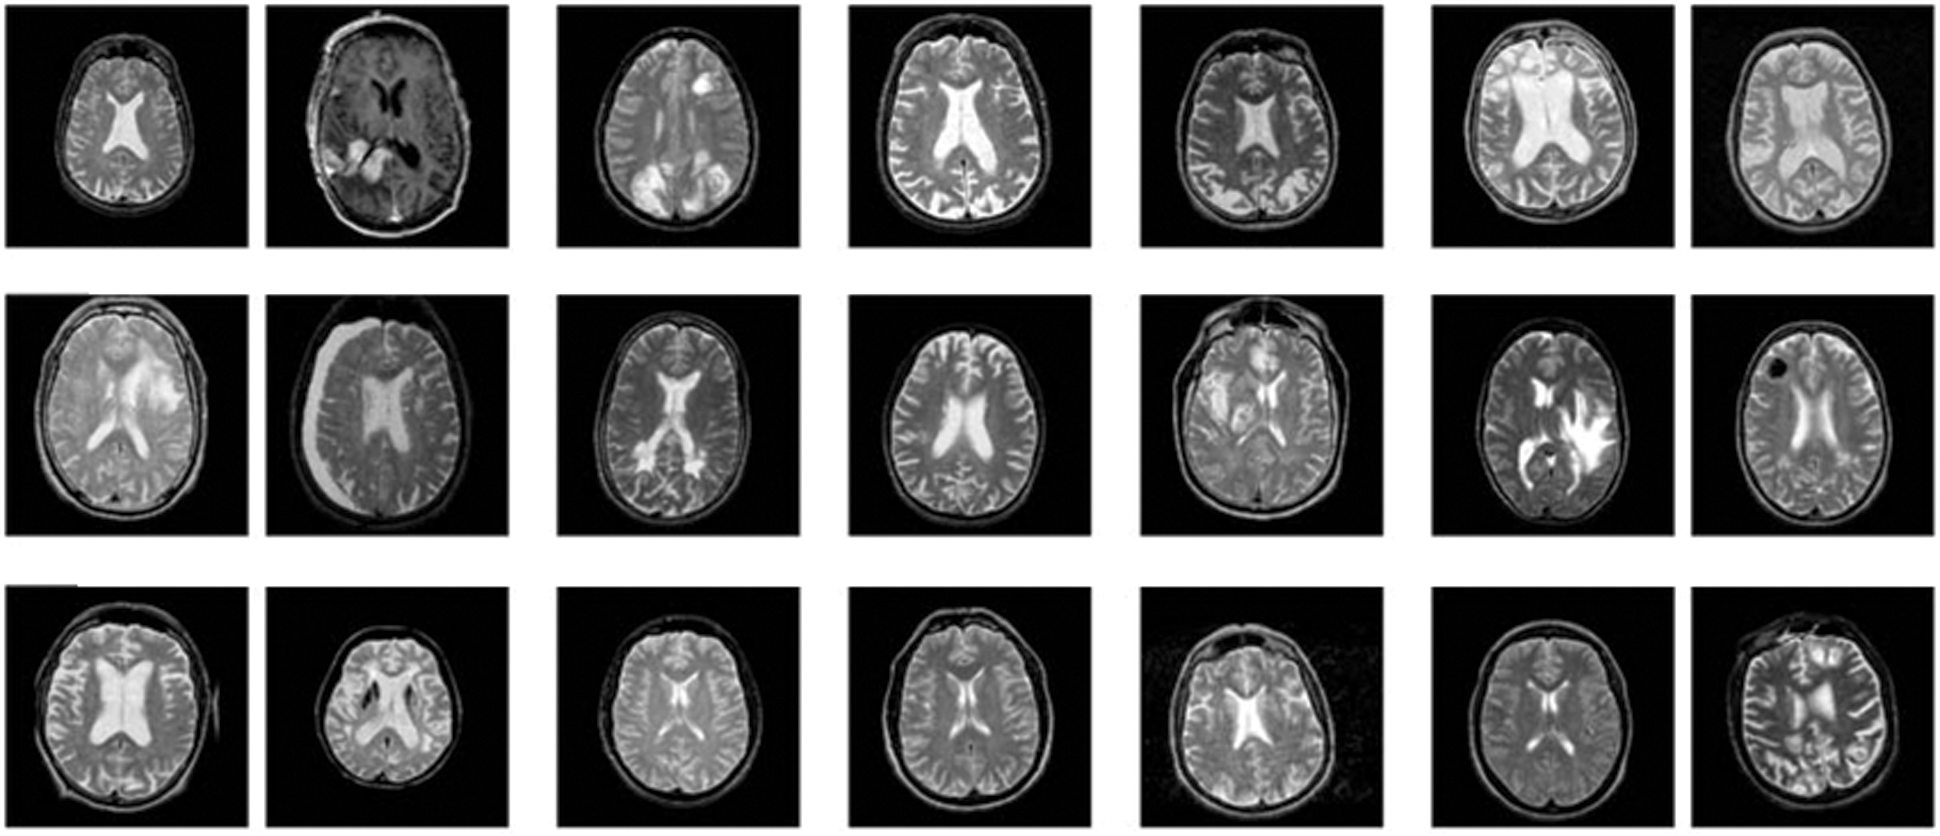
Figure 3: Sample images
Fig. 4 showcases the confusion matrix offered by the ORB-OANN technique with the other two techniques. The ANN technique has classified a set of 86 images into class 1, 103 images into class 2, and 91 images into class 3. Moreover, the PCA-ANN approach has classified a set of 87 images into class 1, 104 images into class 2, and 91 images into class 3. Eventually, the ORB-OANN method has classified a set of 87 images into class 1, 104 images into class 2, and 92 images into class 3.
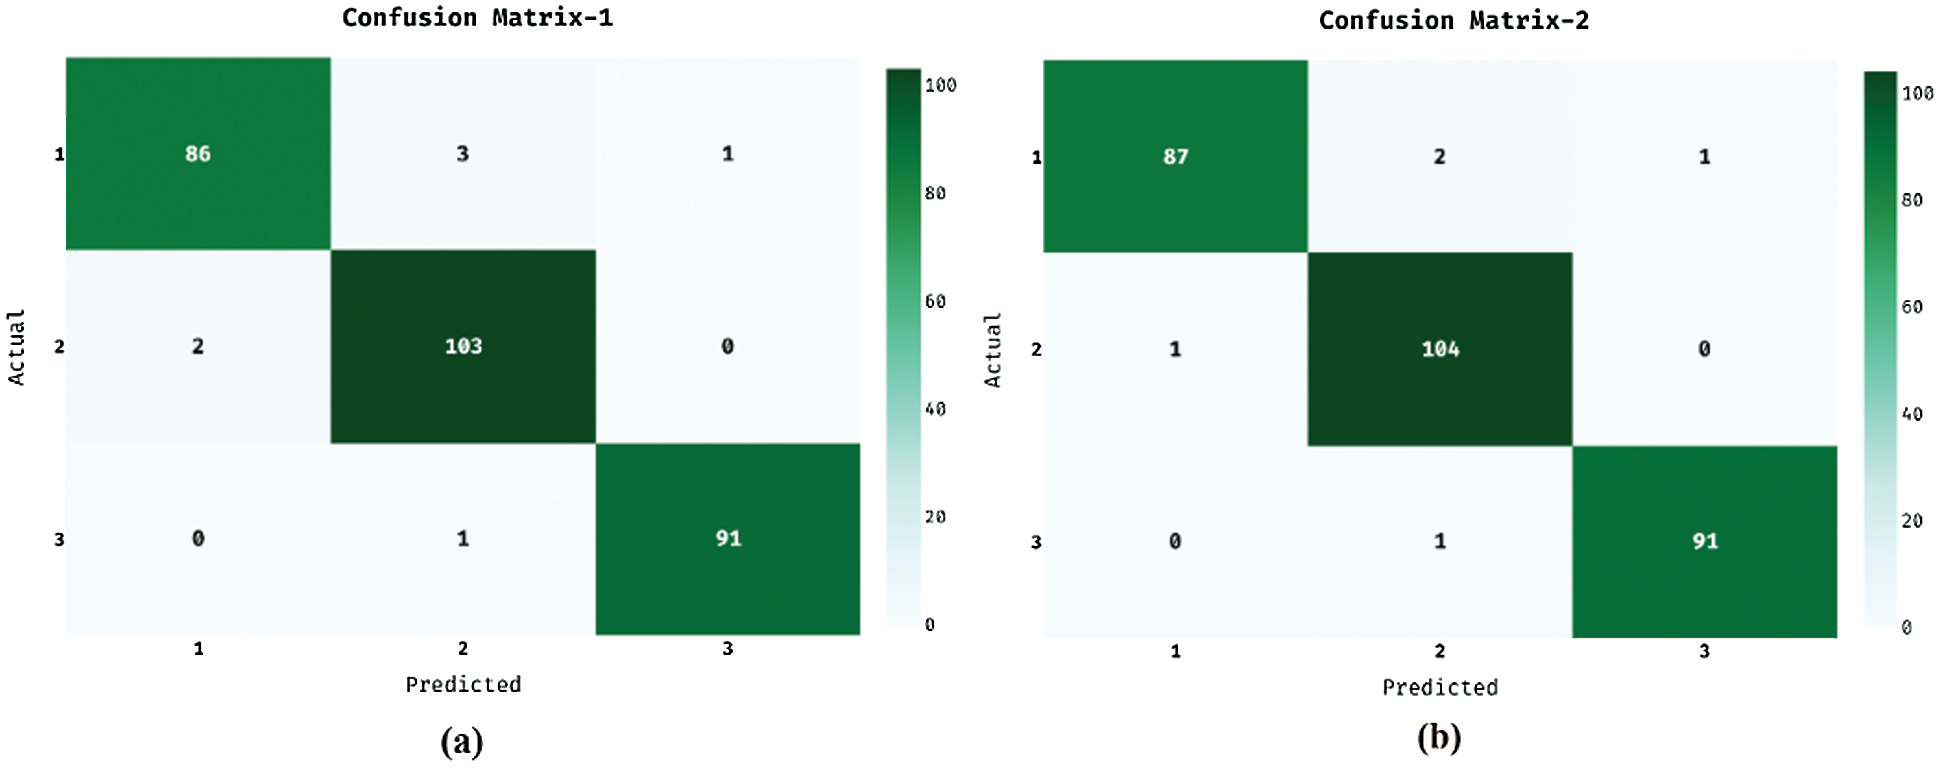
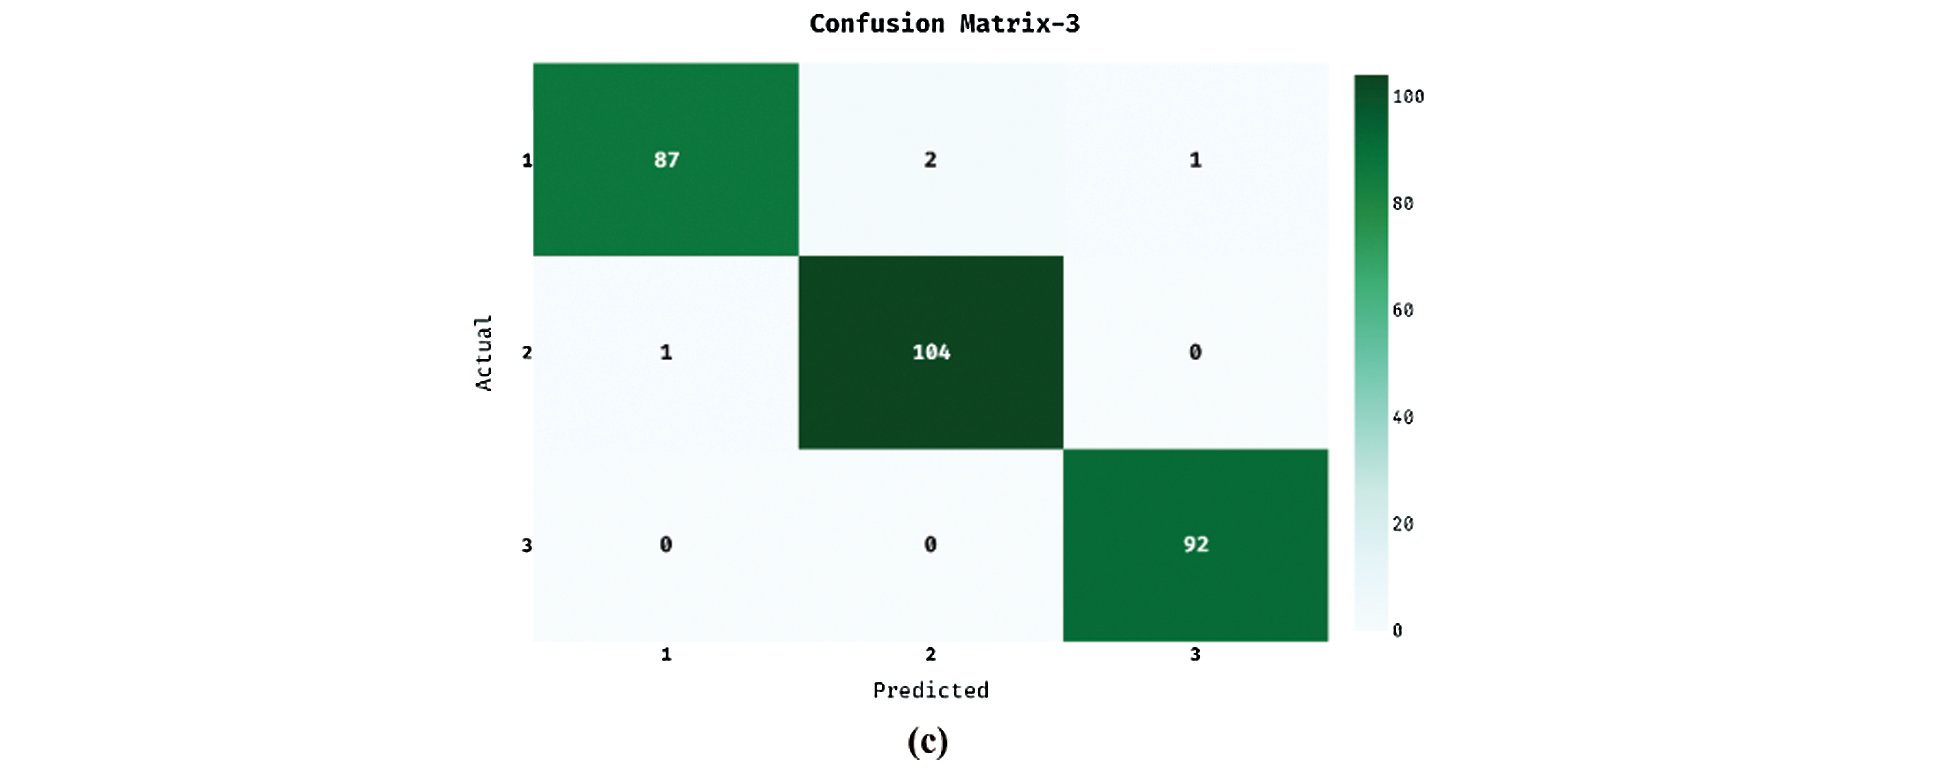
Figure 4: (a) ANN model (b) PCA-ANN model (c) ORB-OANN model
Next, a brief AD classification results analysis of the ORB-OANN technique takes place under distinct classes in Tab. 1. By looking into the table values, it is noticeable that the ORB-OANN technique has showcased improved AD classification outcomes under all the class labels. The ANN model has obtained an average accuracy of 0.9837, sensitivity of 0.9752, specificity of 0.9876, FPR of 0.0124, and FNR of 0.0248. In line with, the PCA-ANN manner has attained an average accuracy of 0.9884, sensitivity of 0.9821, specificity of 0.9911, FPR of 0.0089, and FNR of 0.0179. Concurrently, the ORB-OANN methodology has gained an average accuracy of 0.9907, sensitivity of 0.9857, specificity of 0.99929, FPR of 0.0071, and FNR of 0.0143.
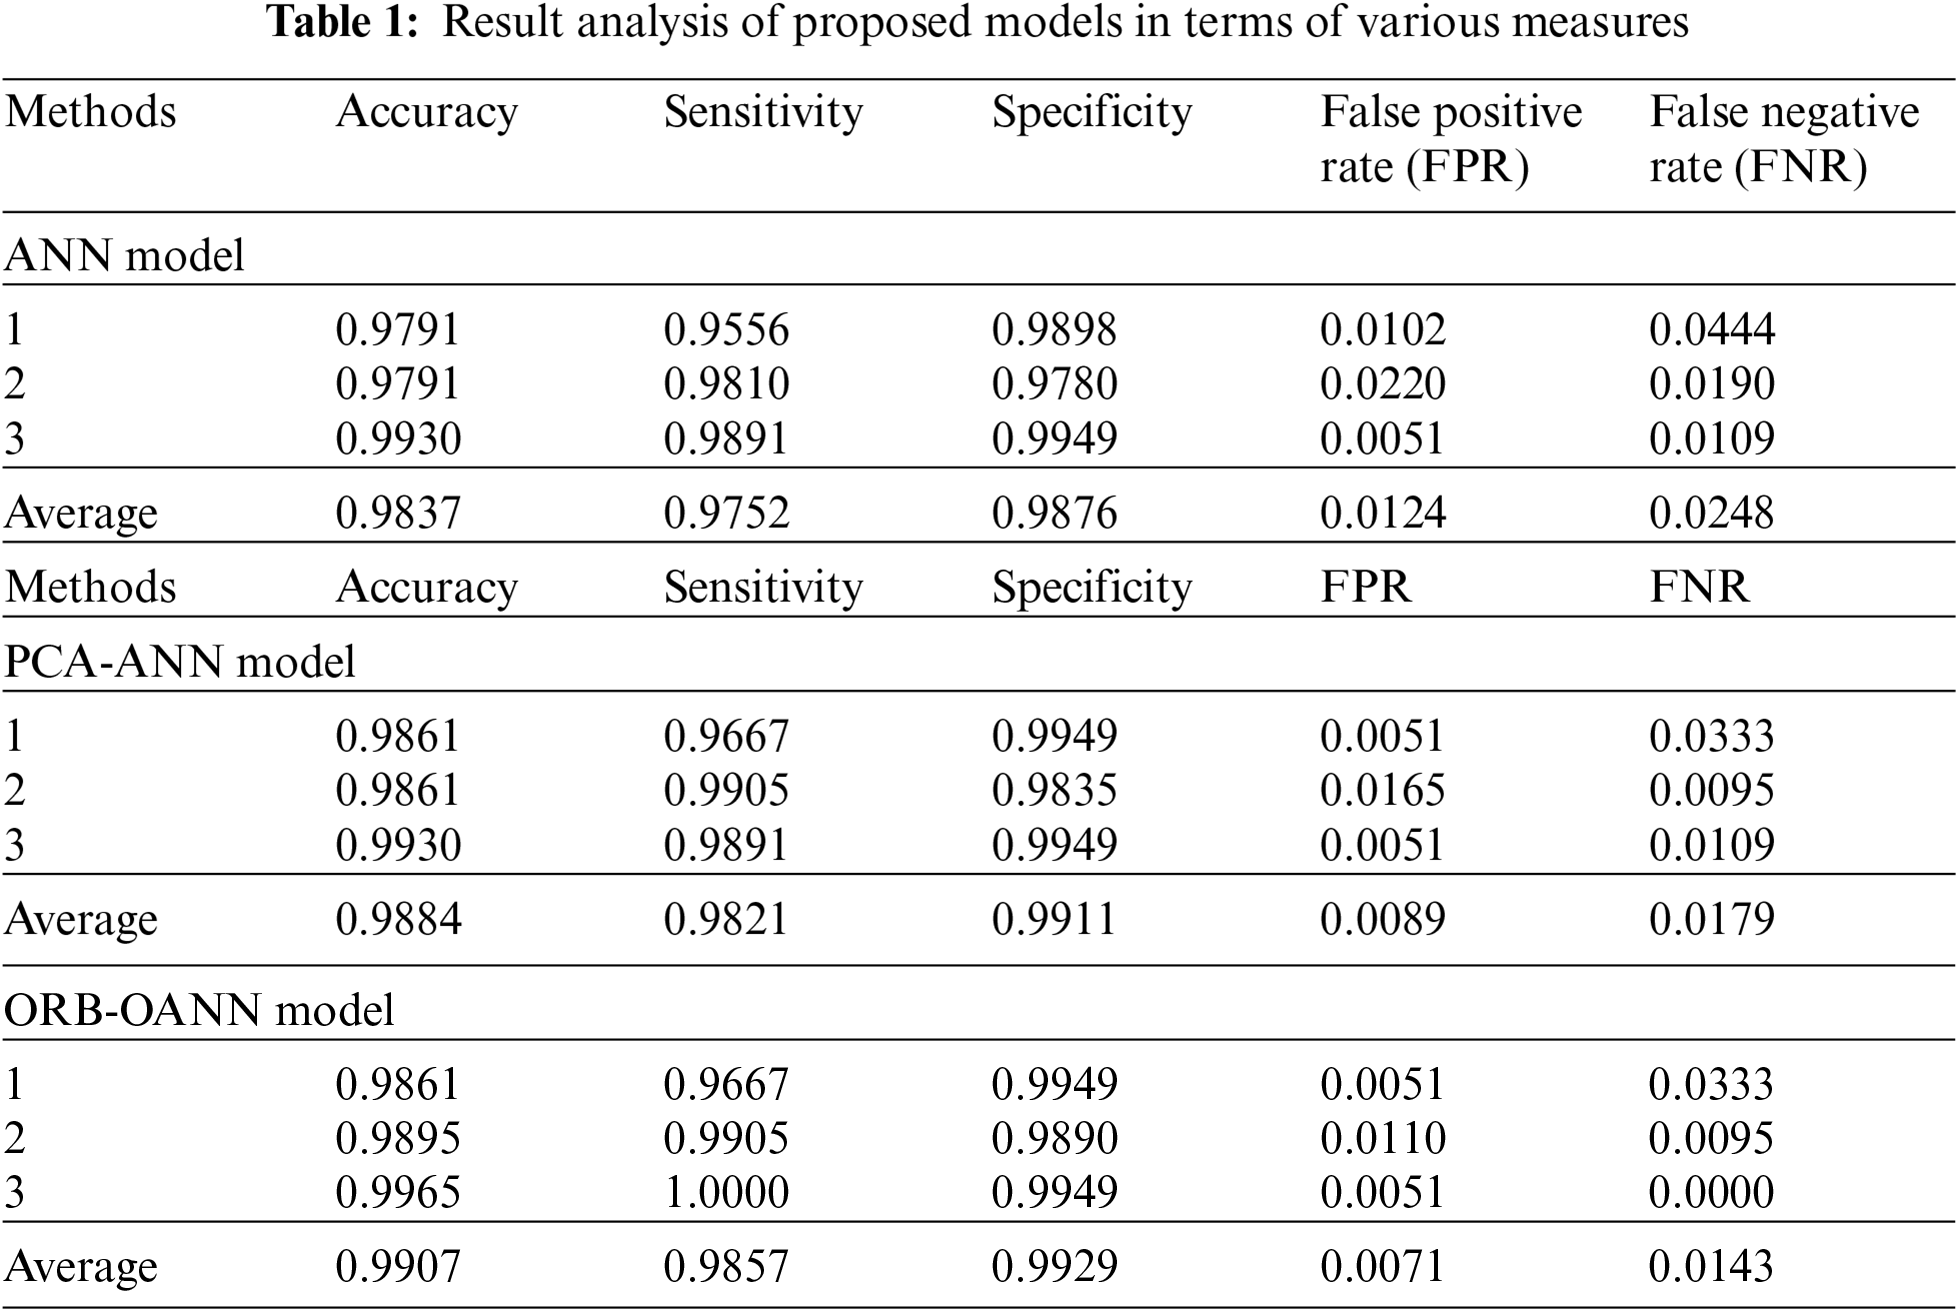
Fig. 5 showcases the ROC analysis of the ORB-OANN approach on the applied dataset. The figure demonstrated that the ORB-OANN technique has achieved a maximum ROC of 99.9526.
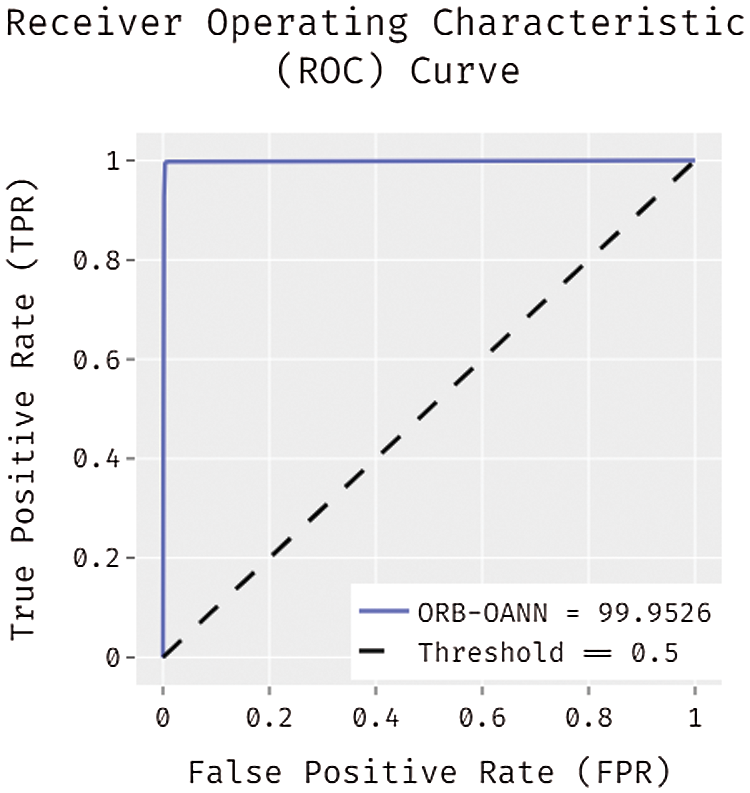
Figure 5: Receiver operating characteristic curve (ROC) of ORB-OANN
A detailed comparative analysis of the AD detection outcome takes place with recent methods such as genetic algorithm with k-nearest neighbors (GA-KNN), grey wolf optimization with KNN (GWO-KNN), GA with convolutional neural networks (GA-CNN), GA with decision tree (GA-DT), GWO with KNN), chaotic GWO-KNN (CGWO-KNN), chaotic GWO-DT (CGWO-DT), chaotic GWO-CNN (CGWO-CNN), ANN, and PCA-ANN. Fig. 6 demonstrates the comparison study of the ORB-OANN technique with existing techniques in terms of accuracy. The results exhibited that the GA-KNN and GWO-KNN techniques have obtained the least accuracy of 0.6622 and 0.6923 respectively. In line with, the GA-CNN, GA-DT, and GWO-DT techniques have offered slightly enhanced accuracy of 0.7022, 0.7222, and 0.7623 respectively. Moreover, the CGWO-KNN, CGWO-DT, and GWO-CNN techniques have offered a moderate accuracy of 0.845, 0.8852, and 0.8923. Furthermore, the CGWO-CNN, ANN, and PCA-ANN techniques have showcased competitive accuracy values of 0.982, 0.9837, and 0.9884 respectively. However, the proposed ORB-OANN technique has resulted to a maximum performance of 0.9907.
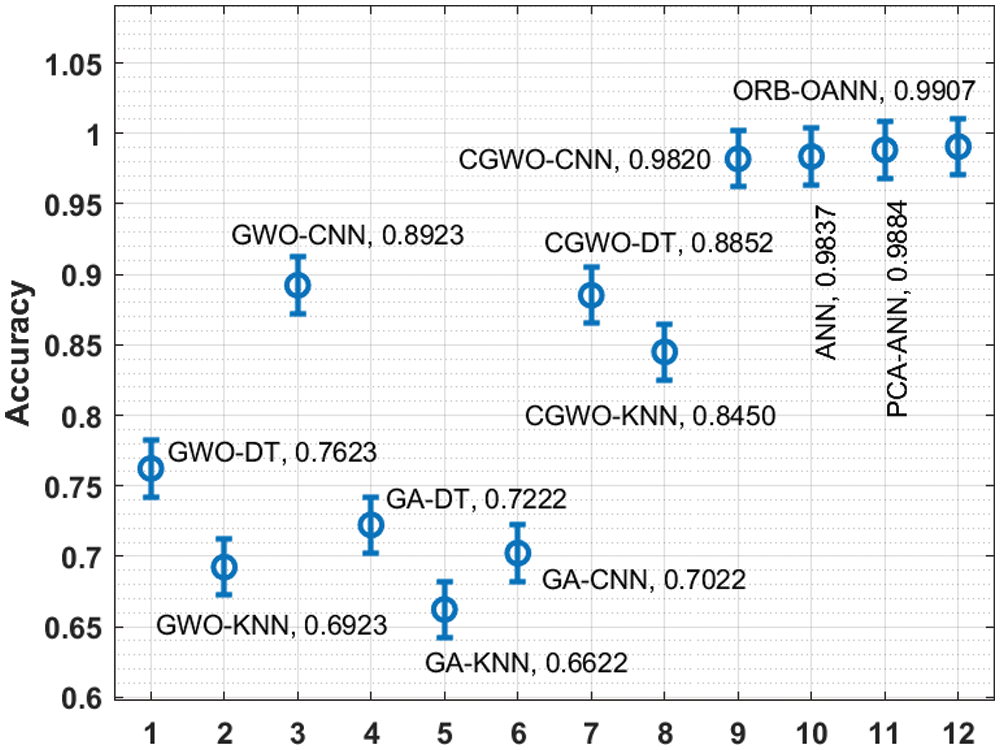
Figure 6: Accuracy analysis of ORB-OANN model with recent approaches
Fig. 7 showcases the comparison analysis of the ORB-OANN method with existing algorithms with respect to sensitivity. The outcomes outperformed that the GA-KNN and GA-CNN techniques have reached a worse sensitivity of 0.6522 and 0.6922 correspondingly. Also, the GWO-KNN, GA-DT, and GWO-CNN approaches have obtainable somewhat higher sensitivity of 0.7718, 0.7858, and 0.8233 correspondingly. Followed by, the CGWO-KNN, GWO-DT, and CGWO-DT methods have accessible a moderate sensitivity of 0.8452, 0.8520, and 0.8623. In addition, the CGWO-CNN, ANN, and PCA-ANN manners have demonstrated competitive sensitivity values of 0.9745, 0.9752, and 0.9821 correspondingly. But, the presented ORB-OANN methodology has resulted in maximal performance of 0.9857.
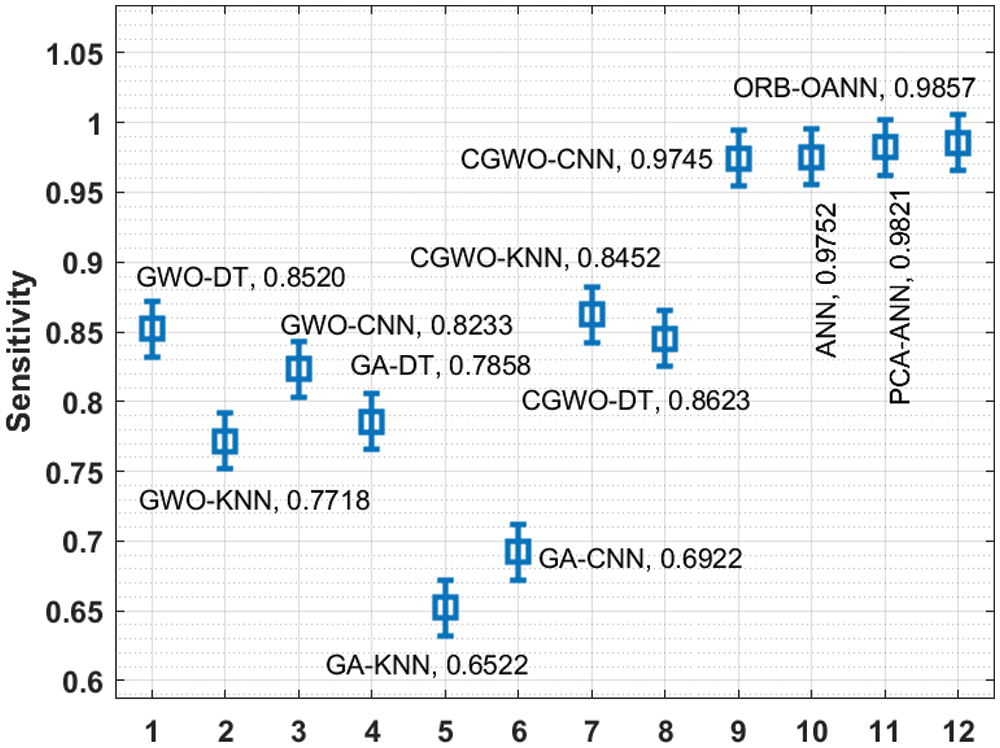
Figure 7: Sensitivity analysis of ORB-OANN model with recent approaches
Fig. 8 rseveals the comparative study of the ORB-OANN manner with recent approaches in terms of specificity. The results portrayed that the GA-DT and GWO-DT methods have gained a minimum specificity of 0.6622 and 0.7822 respectively. Likewise, the GA-KNN, GWO-KNN, and GA-CNN manners have existed slightly improved specificity of 0.7922, 0.8210, and 0.8522 respectively. Besides, the CGWO-KNN, GWO-CNN, and CGWO-DT methods have obtainable a moderate specificity of 0.9015, 0.9222, and 0.9223. At the same time, the CGWO-CNN, ANN, and PCA-ANN methodologies have depicted competitive specificity values of 0.9545, 0.9876, and 0.9911 correspondingly. Eventually, the proposed ORB-OANN algorithm has resulted in a superior performance of 0.9929. From the detailed result analysis, it is ensured that the ORB-OANN technique is found to be a proficient AD diagnosis model in the CIoT enabled healthcare system.
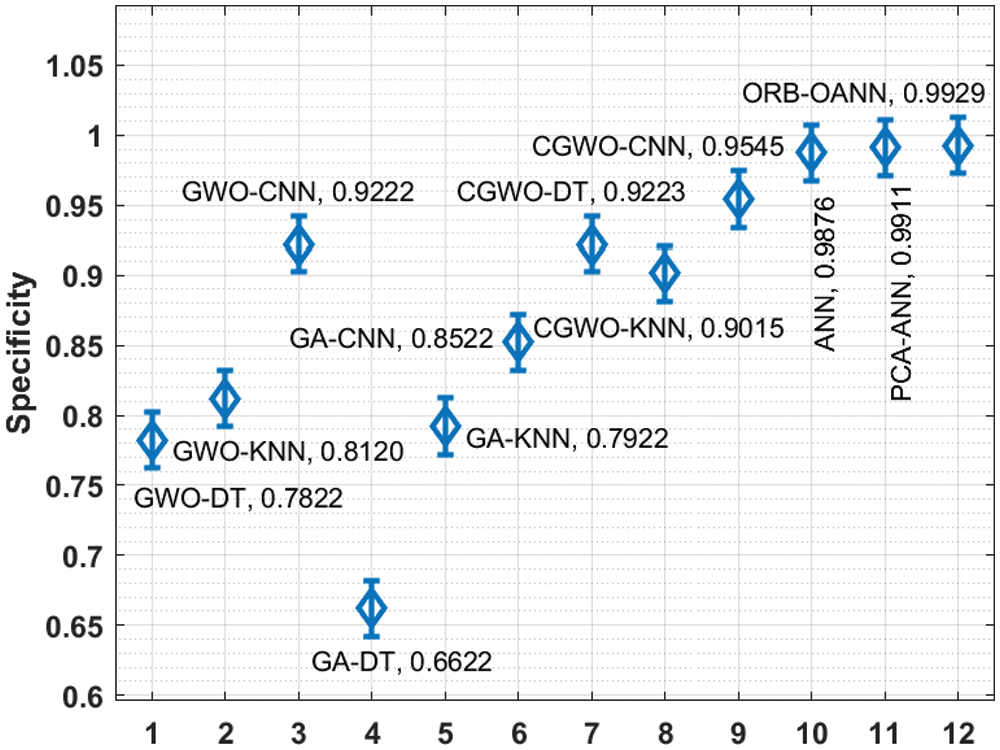
Figure 8: Specificity analysis of ORB-OANN model with recent approaches
In this study, a novel ORB-OANN model is designed to diagnose AD in the CIoT enabled healthcare environment. Initially, the data acquisition process takes place using smart CT scanners. Initially, the data acquisition process takes place using smart CT scanners. They are linked into the network and each scanner acts as an individual node. The node transmits the sensed data to the cloud and then actual processing takes place. Then, the ORB-OANN model involves distinct stages of operations namely BLF based preprocessing, RoI detection, ORB based feature extraction, PCA based FS, ANN based classification, and SSA based parameter tuning. A comprehensive experimental analysis of the ORB-OANN model is carried out on the benchmark dataset and the obtained values pointed out the promising performance of the ORB-OANN technique in terms of different measures. In future, the performance of the AD diagnostic outcomes can be boosted by the design of deep learning models.
Acknowledgement: The authors would like to acknowledge the support of Prince Sultan University, Riyadh, Saudi Arabia for partially supporting this project and for paying the Article Processing Charges (APC) of this publication.
Funding Statement: The authors extend their appreciation to the Deanship of Scientific Research at King Khalid University for funding this work under grant number (RGP 2/23/42), Received by Fahd N. Al-Wesabi. https://www.kku.edu.sa.
Conflicts of Interest: The authors declare that they have no conflicts of interest to report regarding the present study.
1. S. Swayamsiddha and C. Mohanty, “Application of cognitive internet of medical things for COVID-19 pandemic,” Diabetes & Metabolic Syndrome: Clinical Research & Reviews, vol. 14, no. 5, pp. 911–915, 2020. [Google Scholar]
2. R. P. Singh, M. Javaid, A. Haleem and R. Suman, “Internet of things (IoT) applications to fight against COVID-19 pandemic,” Diabetes & Metabolic Syndrome: Clinical Research & Reviews, vol. 14, no. 4, pp. 521–524, 2020. [Google Scholar]
3. W. Ejaz and M. Ibnkahla, “Multiband spectrum sensing and resource allocation for iot in cognitive 5 g networks,” IEEE Internet Things Jouranl, vol. 5, no. 1, pp. 150–163, 2018. [Google Scholar]
4. M. Alhussein, G. Muhammad, M. S. Hossain and S. U. Amin, “Cognitive iot-cloud integration for smart healthcare: Case study for epileptic seizure detection and monitoring,” Mobile Network and Applications, vol. 23, no. 6, pp. 1624–1635, 2018. [Google Scholar]
5. Y. Yin, Y. Zeng, X. Chen and Y. Fan, “The internet of things in healthcare: An overview,” Journal of Industrial Information Integration, vol. 1, pp. 3–13, 2016. [Google Scholar]
6. J. Uthayakumar, N. Metawa, K. Shankar and S. K. Lakshmanaprabu, “Intelligent hybrid model for financial crisis prediction using machine learning techniques,” Information Systems and e-Business Management, vol. 18, no. 4, pp. 617–645, 2020. [Google Scholar]
7. M. Chen, F. Herrera and K. Hwang, “Cognitive computing: Architecture, technologies and intelligent applications,” IEEE Access, vol. 6, pp. 19774–19783, 2018. [Google Scholar]
8. S. Lahmiri and M. Boukadoum, “Alzheimer's disease detection in brain magnetic resonance images using multiscale fractal analysis,” ISRN Radiology, vol. 2013, pp. 1–7, 2013. [Google Scholar]
9. P. Koti, P. Dhavachelvan, T. Kalaipriyan, S. Arjunan, J. Uthayakumar et al., “An efficient healthcare framework for kidney disease using hybrid harmony search algorithm,” Electronic Government, an International Journal, vol. 16, no. 1, pp. 1, 2020. [Google Scholar]
10. J. Ramírez, J. M. Górriz, F. Segovia, R. Chaves, D. S. Gonzalez et al., “Computer aided diagnosis system for the Alzheimer's disease based on partial least squares and random forest SPECT image classification,” Neuroscience Letters, vol. 472, no. 2, pp. 99–103, 2010. [Google Scholar]
11. S. Aruchamy, A. Haridasan, A. Verma, P. Bhattacharjee, S. N. Nandy et al., “Alzheimer's disease detection using machine learning techniques in 3d mr images,” in 2020 National Conf. on Emerging Trends on Sustainable Technology and Engineering Applications (NCETSTEA), Durgapur, India, pp. 1–4, 2020. [Google Scholar]
12. J. Venugopalan, L. Tong, H. R. Hassanzadeh and M. D. Wang, “Multimodal deep learning models for early detection of Alzheimer's disease stage,” Scientific Reports, vol. 11, no. 1, pp. 3254, 2021. [Google Scholar]
13. E. Lella, A. Lombardi, N. Amoroso, D. Diacono, T. Maggipinto et al., “Machine learning and dwi brain communicability networks for Alzheimer's disease detection,” Applied Sciences, vol. 10, no. 3, pp. 934, 2020. [Google Scholar]
14. Y. Asim, B. Raza, A. K. Malik, S. Rathore, L. Hussain et al., “A Multi-modal, multi-atlas-based approach for Alzheimer detection via machine learning,” International Journal of Imaging Systems and Technology, vol. 28, no. 2, pp. 113–123, 2018. [Google Scholar]
15. S. Lahmiri and A. Shmuel, “Performance of machine learning methods applied to structural mri and adas cognitive scores in diagnosing Alzheimer's disease,” Biomedical Signal Processing and Control, vol. 52, pp. 414–419, 2019. [Google Scholar]
16. Y. He, Y. Zheng, Y. Zhao, Y. Ren, J. Lian et al., “Retinal image denoising via bilateral filter with a spatial kernel of optimally oriented line spread function,” Computational and Mathematical Methods in Medicine, vol. 2017, pp. 1–13, 2017. [Google Scholar]
17. A. Vinay, C. A. Kumar, G. R. Shenoy, K. N. B. Murthy and S. Natarajan, “ORB-PCA based feature extraction technique for face recognition,” Procedia Computer Science, vol. 58, pp. 614–621, 2015. [Google Scholar]
18. A. Sukumaran and T. Brindha, “Nature-inspired hybrid deep learning for race detection by face shape features,” International Journal of Innovation, Creativity and Change, vol. 13, no. 3, pp. 365–388, 2020. [Google Scholar]
19. H. Afzaal, A. A. Farooque, F. Abbas, B. Acharya and T. Esau, “Groundwater estimation from major physical hydrology components using artificial neural networks and deep learning,” Water, vol. 12, no. 1, pp. 5, 2019. [Google Scholar]
20. V. Chaudhary, H. M. Dubey, M. Pandit and J. C. Bansal, “Multi-area economic dispatch with stochastic wind power using salp swarm algorithm,” Array, vol. 8, pp. 100044, 2020. [Google Scholar]
 | This work is licensed under a Creative Commons Attribution 4.0 International License, which permits unrestricted use, distribution, and reproduction in any medium, provided the original work is properly cited. |