DOI:10.32604/cmc.2022.022984
| Computers, Materials & Continua DOI:10.32604/cmc.2022.022984 | |
| Article |
Explainable Artificial Intelligence Solution for Online Retail
1Department of Computer Science, University of South Asia, Lahore, 54000, Pakistan
2Department of Mechatronics and Control Engineering, University of Engineering and Technology, Lahore, 54000, Pakistan
3Department of Information Sciences, Division of Science and Technology, University of Education, Lahore, 54000, Pakistan
4Riphah School of Computing and Innovation, Faculty of Computing, Riphah International University, Lahore Campus, Lahore, 54000, Pakistan
5Division of Science and Technology, University of Education, Lahore, 54000, Pakistan
6Pattern Recognition and Machine Learning Lab, Department of Software, Gachon University, Seongnam, 13557, Korea
*Corresponding Author: Muhammad Adnan Khan. Email: adnan@gachon.ac.kr
Received: 24 August 2021; Accepted: 27 September 2021
Abstract: Artificial intelligence (AI) and machine learning (ML) help in making predictions and businesses to make key decisions that are beneficial for them. In the case of the online shopping business, it’s very important to find trends in the data and get knowledge of features that helps drive the success of the business. In this research, a dataset of 12,330 records of customers has been analyzed who visited an online shopping website over a period of one year. The main objective of this research is to find features that are relevant in terms of correctly predicting the purchasing decisions made by visiting customers and build ML models which could make correct predictions on unseen data in the future. The permutation feature importance approach has been used to get the importance of features according to the output variable (Revenue). Five ML models i.e., decision tree (DT), random forest (RF), extra tree (ET) classifier, Neural networks (NN), and Logistic regression (LR) have been used to make predictions on the unseen data in the future. The performance of each model has been discussed in detail using performance measurement techniques such as accuracy score, precision, recall, F1 score, and ROC-AUC curve. RF model is the best model among all five chosen based on accuracy score of 90% and F1 score of 79% followed by extra tree classifier. Hence, our study indicates that RF model can be used by online retailing businesses for predicting consumer buying behaviour. Our research also reveals the importance of page value as a key feature for capturing online purchasing trends. This may give a clue to future businesses who can focus on this specific feature and can find key factors behind page value success which in turn will help the online shopping business.
Keywords: Explainable artificial intelligence; online retail; neural network; random forest regression
Artificial intelligence (AI) and machine learning (ML) are being used by many organizations for several purposes. For instance, making predictions related to the stock market, forecasting about the weather, and for many other applications including web scrapping, making sense out of text data, and images [1]. Making future predictions based on the past is the underlying learning paradigm that sets the overall framework for ML. In the context of product and service development, the main objective of ML and AI is to improve the efficiency of products and services which in turn increases the revenue of a firm. Al and ML help online businesses as well by exploiting the data available on the website. Many small businesses use an option of online shopping and it makes it easy for people to make orders through online shopping especially for working people who cannot visit shops. Online shopping not only saves time but also helps in saving the transportation cost of the customer. Most people prefer online shopping where they can find a variety of products in one place. ML has several applications in the online shopping business where it can be used to get useful information about the visitors and decisions can be made accordingly. This useful information about the visitor can help the business in many ways, for example, if a user does not spend much time researching about the products, then more variety should be added or some discounts should be offered. ML can help in finding trends in the data, finding relationships between different features and it can provide information about the importance of variables which in turn can help the business to make better decisions in the future [2].
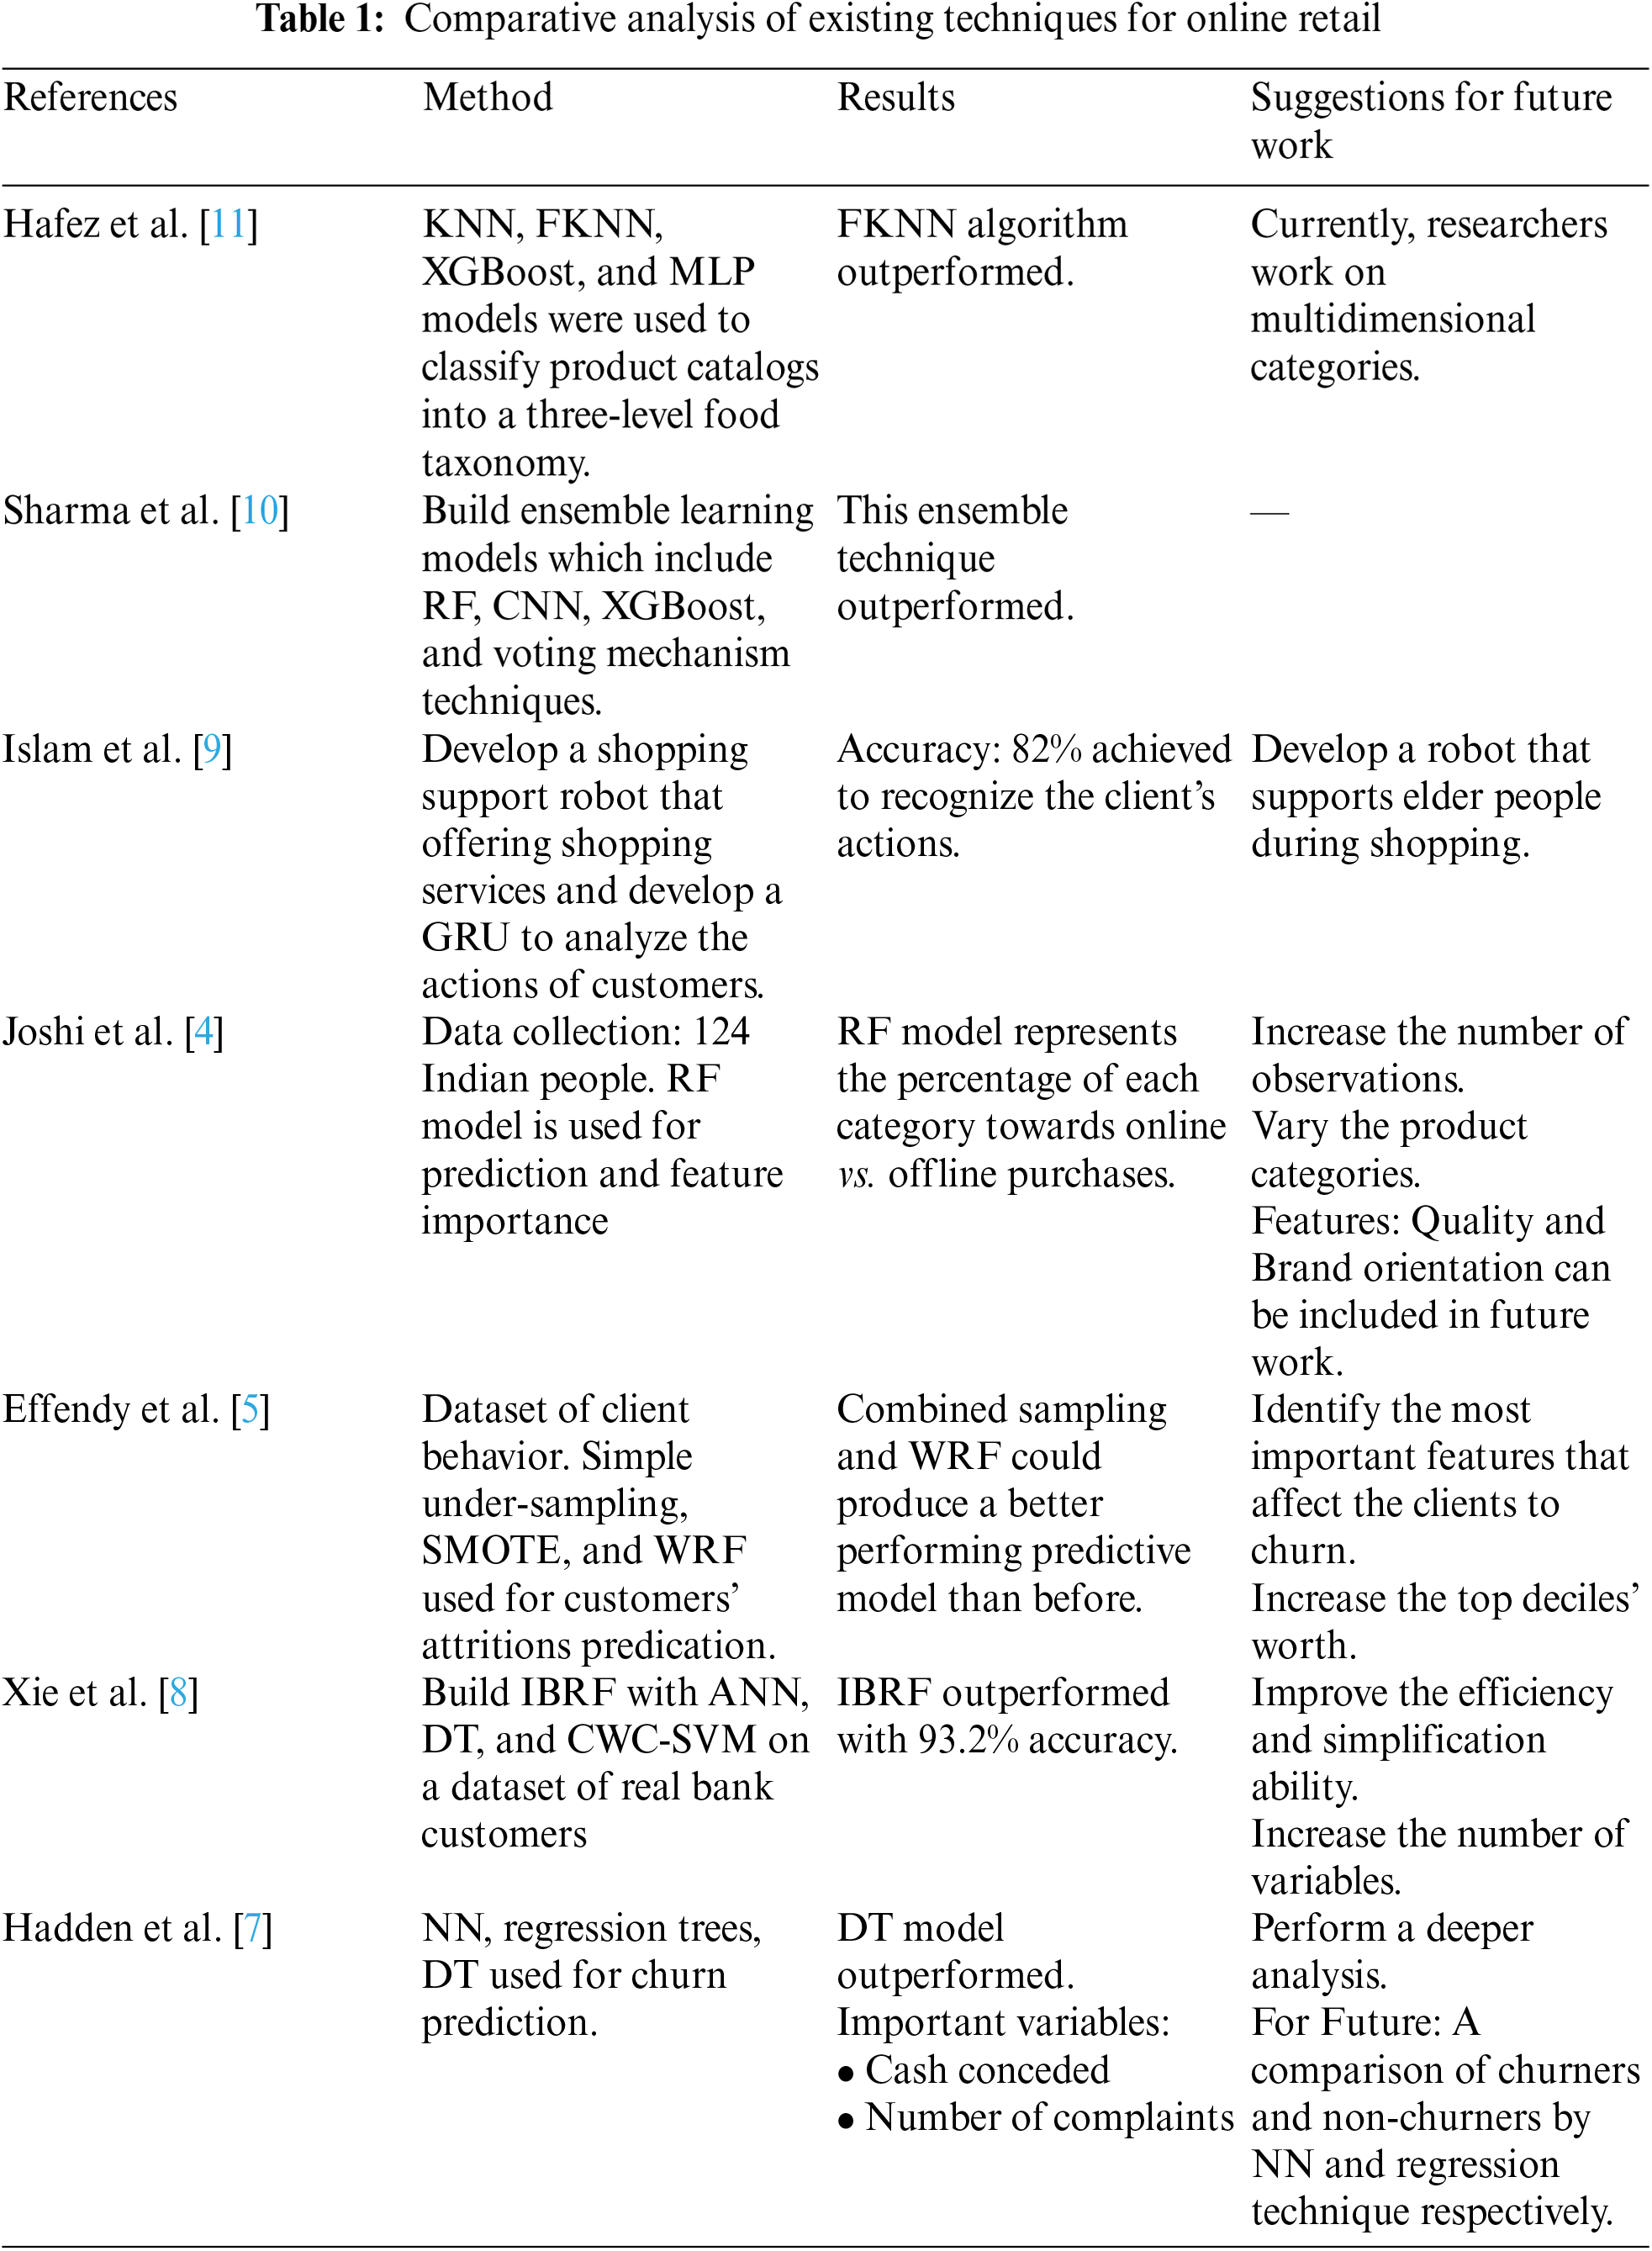
ML has been widely used to predict the future based on the past behavior of data. Recent years have seen tremendous growth in online retailing around the world. While it has a low internet penetration rate of 34.5 percent, India still has fourth-largest number of internet users in the country after China. Given the growing importance of Indias’ online market, its complicated sensitivity collection and area-wise sociopsychological barriers, retail stores need to consider consumer shopping inclinations. In this paper [3], researchers seek to understand critical factors that affect the online shopping behavior of Indian customers across geographical locations in different product categories around the world. For this purpose, the RF model is used to define the causal relationship among the factors influencing the conduct of online transactions. Customer retention is a major concern observed in the telecommunications industry, as it affects the income of the business. This research [4], applied a mixture of simple under-sampling, SMOTE, and weighted random forest (WRF) to improve the customer attrition prediction model on a sample dataset from an Indonesian telecommunications industry. In another study [5], the researchers address the development of behavioral scoring models to predict potential transactions by customers in an online ordering system. Internet retailing removes many obstacles for consumers moving between retailers to repeat purchases; thus, maintaining current customers is a crucial challenge for production models. In this study, [6] researchers introduced a novel model based on three different algorithms: NN, regression trees, and DT techniques. For churn prediction, the proposed technique focused on demographic data and usage. Using repair and complaint data helped clients remain within the company and also extended the model by loyalty in a well-defined way. In [7], authors build improved balanced random forest (IBRF) with ANN, DT, and CWC-SVM on a dataset of real bank customers, which produced superior results than other RF algorithms like BRF and WRF. This unique strategy combines RF, which is cost-sensitive, with WRF, which is a sampling method. A shopping cart is a necessary gadget for shopping in supermarkets or grocery stores. The researchers in this study [8] developed a shopping support robot that can handle a shopping cart while following its owners and offering shopping services by assessing the customer’s head orientation, body orientation, and identifying various shopping behavior’s. The authors used Precision, Support, Recall, and F1 score, to test the efficiency of behavior recognition. To ensure the high availability of retail commodities while limiting the risks of oversupply and overstocking, retailers must plan for stocked and supply chain management. To enable such optimal supply chain management, the ability to reliably and effectively anticipate the purchase probability of retail items is crucial. In this study [9], to predict the probability of retail items, the researchers used the purchased data and built ensemble learning models which include RF, CNN, XGBoost, and voting mechanism techniques. The proposed solution was thoroughly evaluated by looking at accuracy, precision, F1 score, sensitivity, specificity, cost-benefit analysis, and complexity analysis. This study [10] described a method for automatically classifying a continually changing product catalog into a three-level food taxonomy. A score-based ranking system, conventional ML methods, and DNN were investigated in this research study. Researchers concluded that the conventional ML algorithm outperformed the other two techniques. In Tab. 1, a comparative study of existing techniques for the prediction of online retail has been done. In this research work, different ML and deep learning (DL) models are used to make predictions. The main objectives of the study are:
• To find and explain the most important features which will help in making correct predictions, the features which are contributing towards the success of online shopping business.
• To understand customer behavior and financial spending of the customers.
• To build a robust model that could make future predictions on the unseen data.
The dataset is based on an online business and this data has information of 12,330 individual users who visited websites in the past to search for the products and offerings by the business. Five ML models i.e., decision tree (DT), random forest (RF), extra tree (ET), neural networks (NN), and logistic regression (LR) have been used in this research. Data is divided into 80/20 ratio. 80% of the data is used for training while 20% is for testing. All the models is trained on training data and tested on the remaining 20% of test data. One of the most important techniques for feature importance is permutation importance which gives information about the most important features useful for making correct predictions.
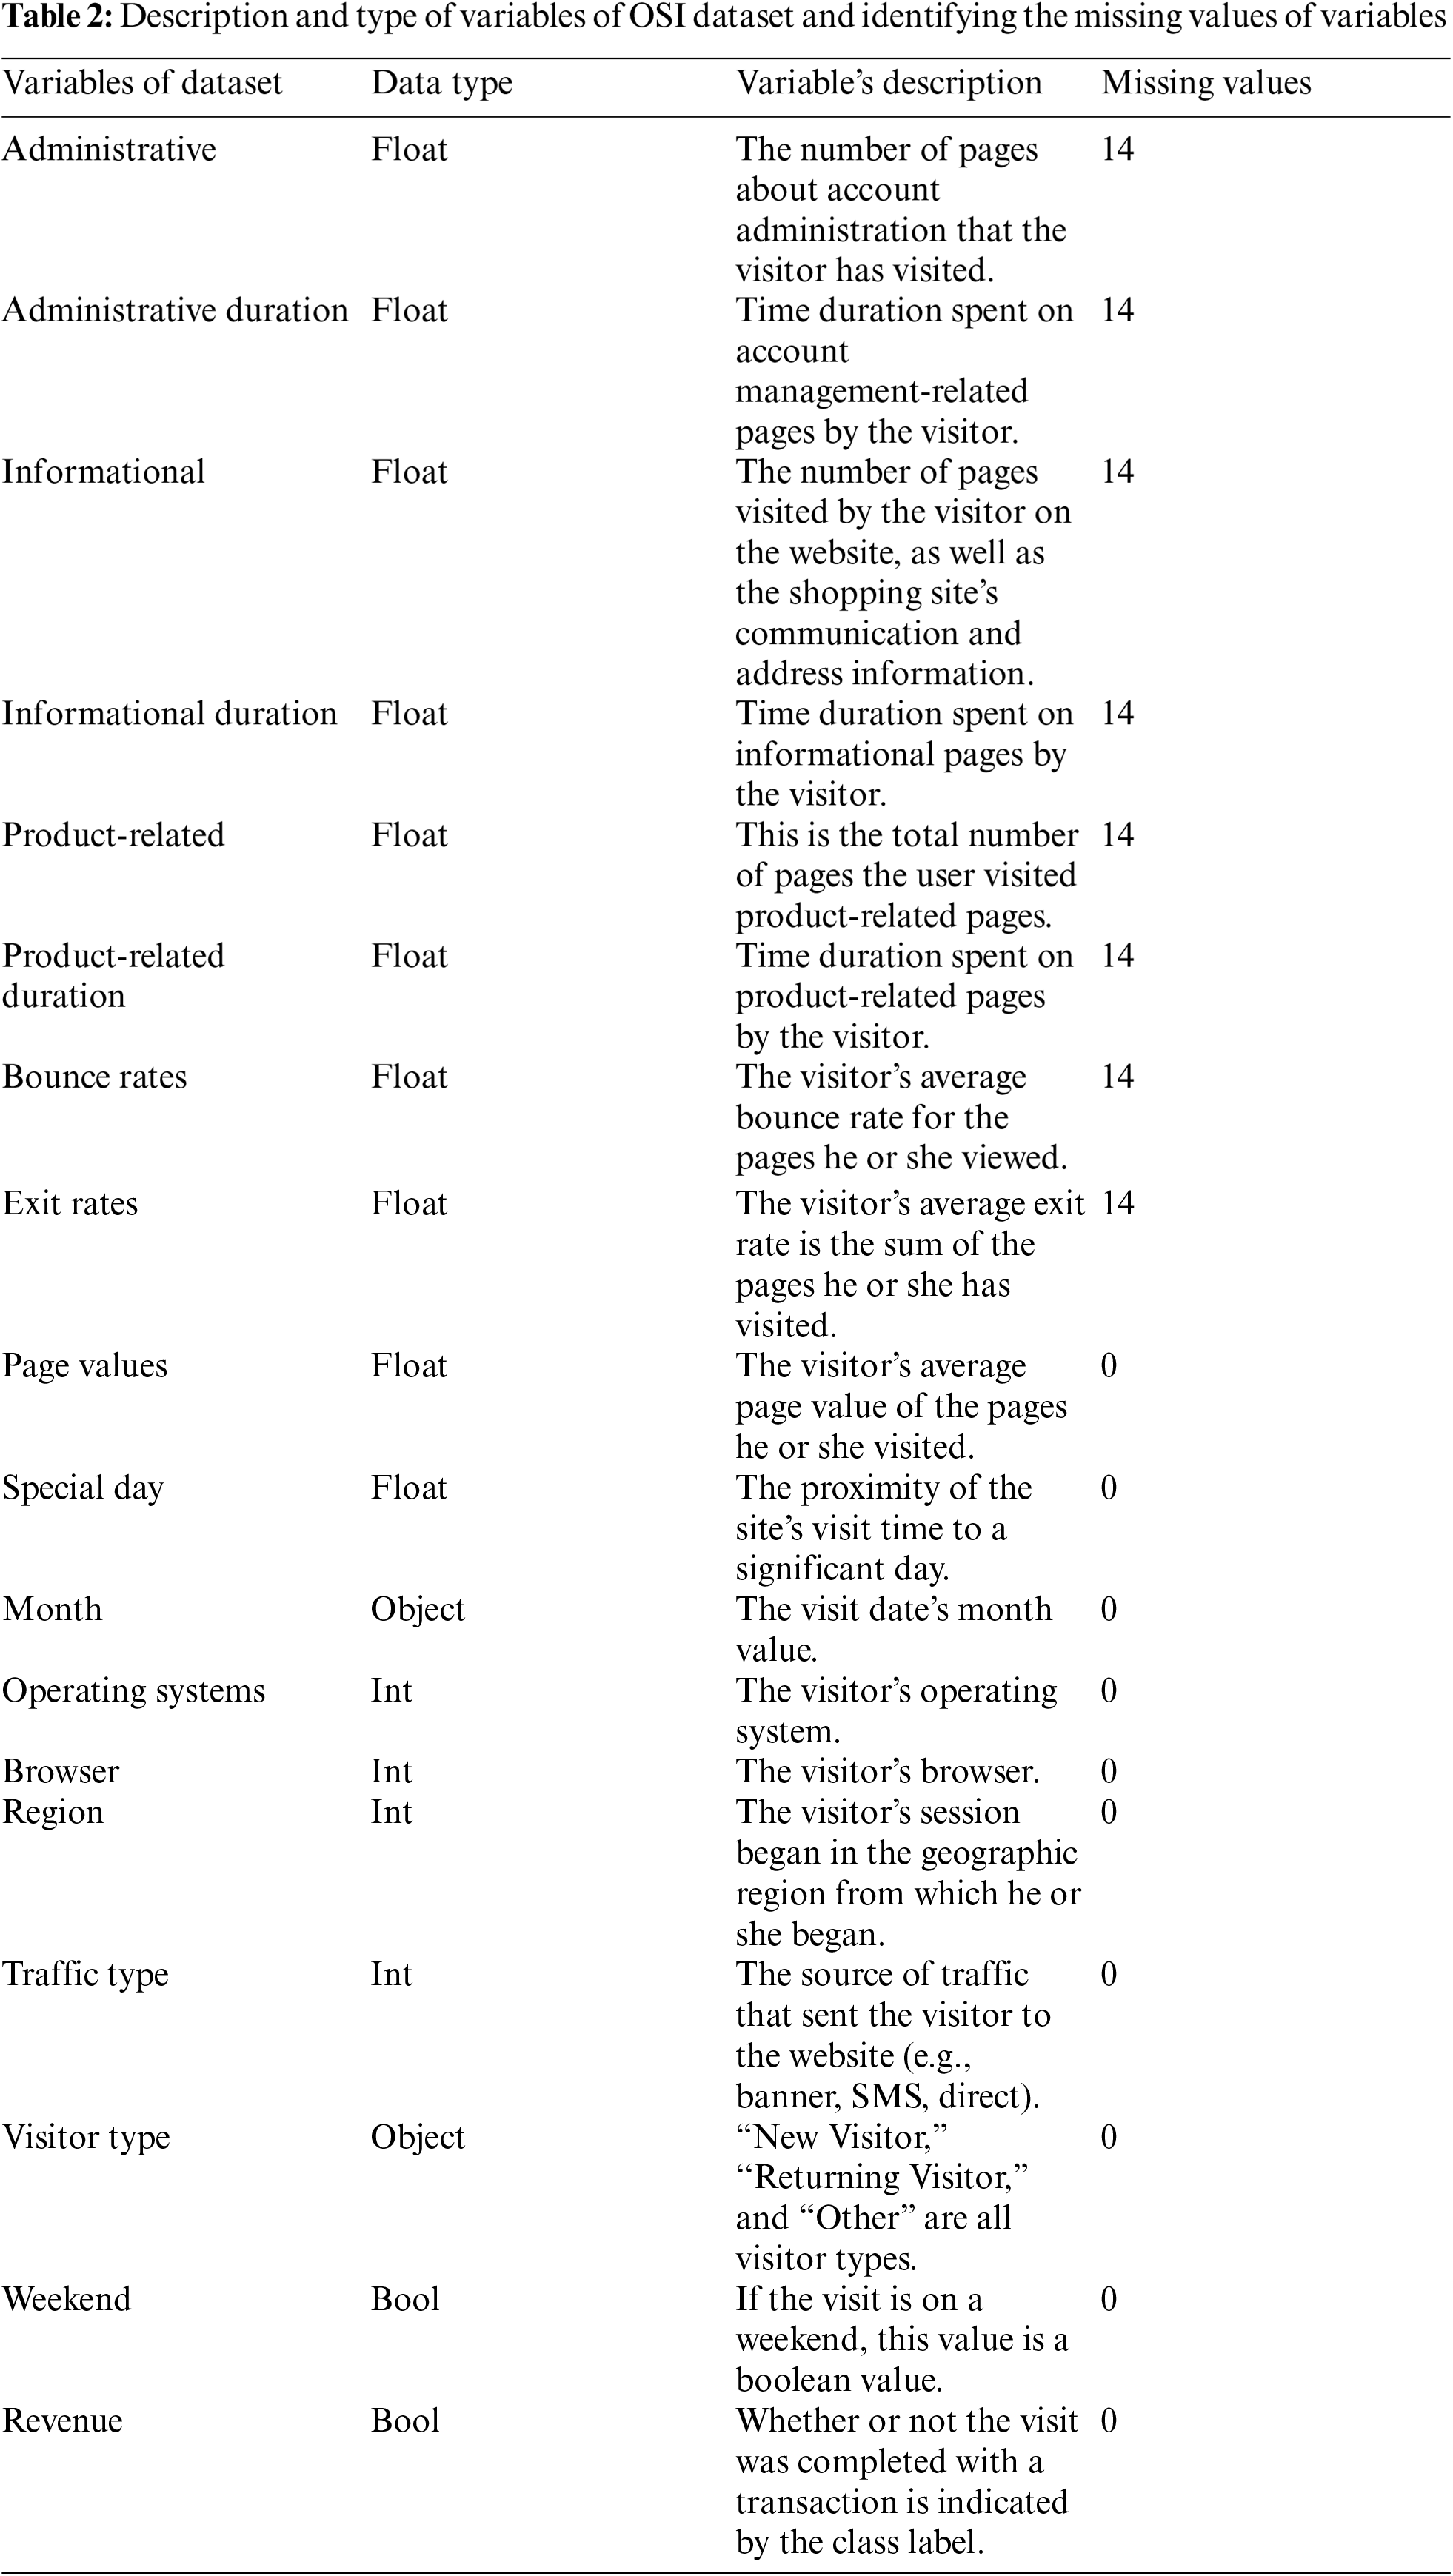
The online shoppers intention (OSI) dataset is collected from Kaggle. This dataset was launched as a Kaggle competition in the year 2019 [12]. The dataset has 12330 observations and eighteen different variables with the target variable as “Revenue” which is either False or True [13,14]. False means the customer has not made a transaction and True means the customer has made the transaction. The description of the variables that are present in the dataset is given below in Tab. 2. As the data is about the online website and its transaction, so, most of the variables are about the web page information and transaction made by the customer.
In the OSI dataset, there are numerical as well as categorical variables. As a pre-processing step, the categorical variables are converted into numerical variables using one-hot encoding and categorical encoding. The detailed information about the missing values and data type of each of the variables are given in Tab. 2. As can be seen in Tab. 2, the data has some missing values in the first eight variables i.e., (Administrative, Administrative Duration, Informational, Informational Duration, Product Related, Product Related Duration, Bonus Rate, and Exit Rate). Each of these variables (variables that contain missing values) contain only fourteen missing values, which are less than one percent of the dataset size. The missing values in numerical variables are replaced by the mean of the corresponding variables, whereas the missing values in categorical variables are replaced by the mode of the corresponding variables.
2.3 Statistical Analysis of Dataset
The analysis of the dataset is carried out in two phases. In the first phase, univariate analysis is carried out on the dataset. The univariate analysis gives the details about each variable individually without considering any relationships among different variabes. Specifically, we compute mean, median, maximum, minimum, standard deviation, and variance of each of the variables present in the dataset. In the OSI dataset, there are numerical as well as categorical variables, In order to analyse numerical variables, descriptive statistical analyses are performed, whereas for categorical variables, we plot the frequency distribution plots. The dataset is highly imbalanced, eighty-five percent of the data samples belong to the 0 category and fifteen percent belong to class 1. Frequency distribution plots give an understanding of the class imbalance that is present in the dataset. In the second phase bivariate analysis is carried out that is used to check the relationship between two variables in the dataset. Statistical relations between the variables are measured by using quantitative metrics such as correlation, regression, and group by categories approach.
The data distribution for the variables i.e., Revenue, Visitor Type, Weekend, and Month are shown in Figs. 1a–1d. In Fig. 1a, the distribution plot of the target variable “Revenue” which is either False or True has been displayed. It can be observed from Fig. 1a that most of the customers made False transactions as compared to True. In Fig. 1b, it can be seen that the majority of the visitors are Returning-Visitors. The returning visitors have a large impact on the sales. Fig. 1c shows that most of the transactions take place on weekdays. Fig. 1d shows the distribution plot of “Months”. In the monthly distribution plot, it can be seen that the majority of the transactions happens in May, Nov, and Dec. whereas very little transactions happen in Feb. and June.
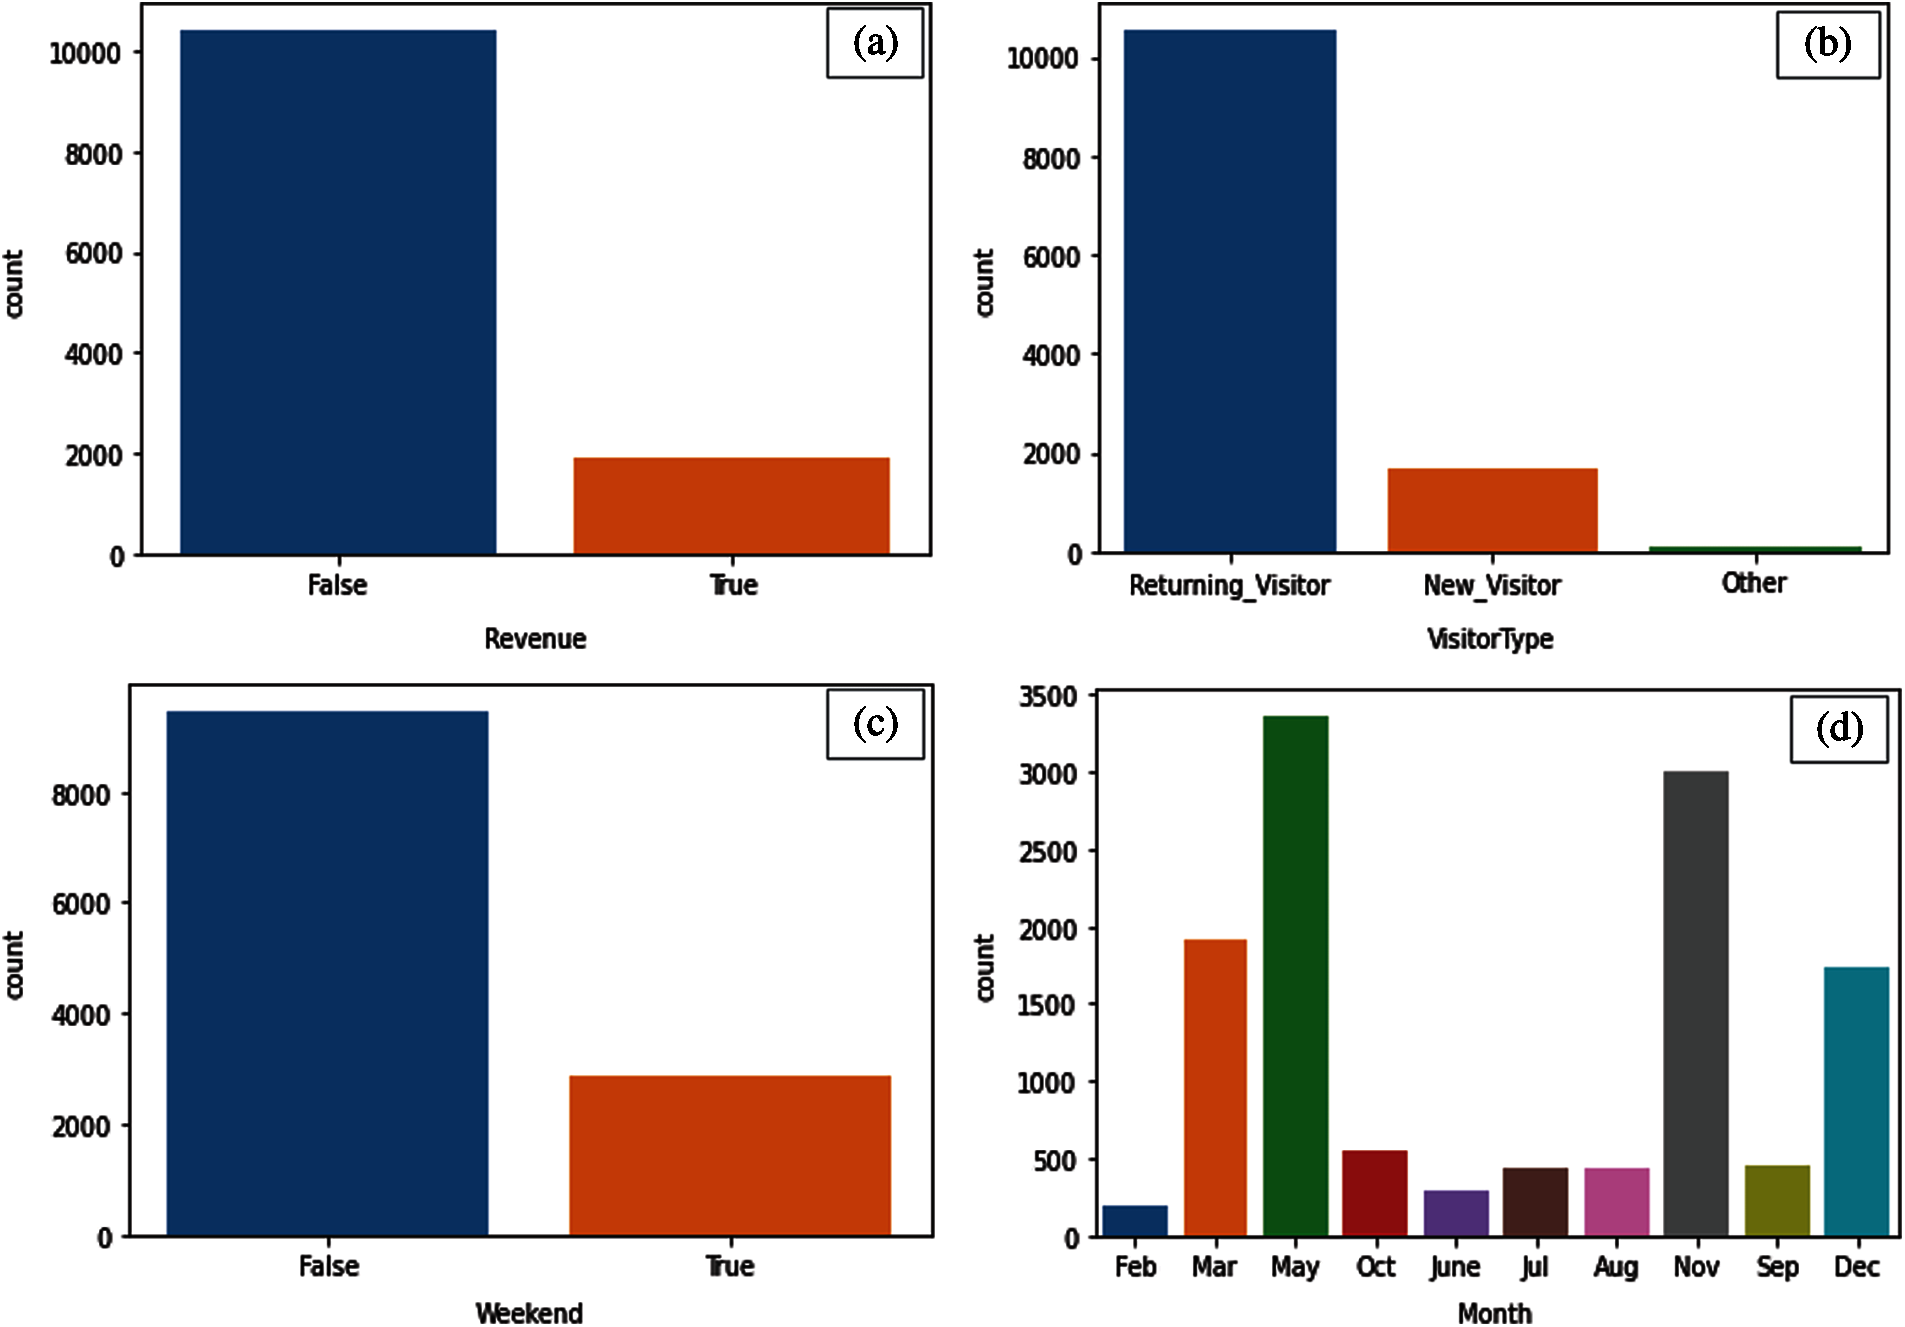
Figure 1: (a) Word embedding representation. (b) Visitor type distribution. (c) Weekend distribution. (d) Distribution plot based on months
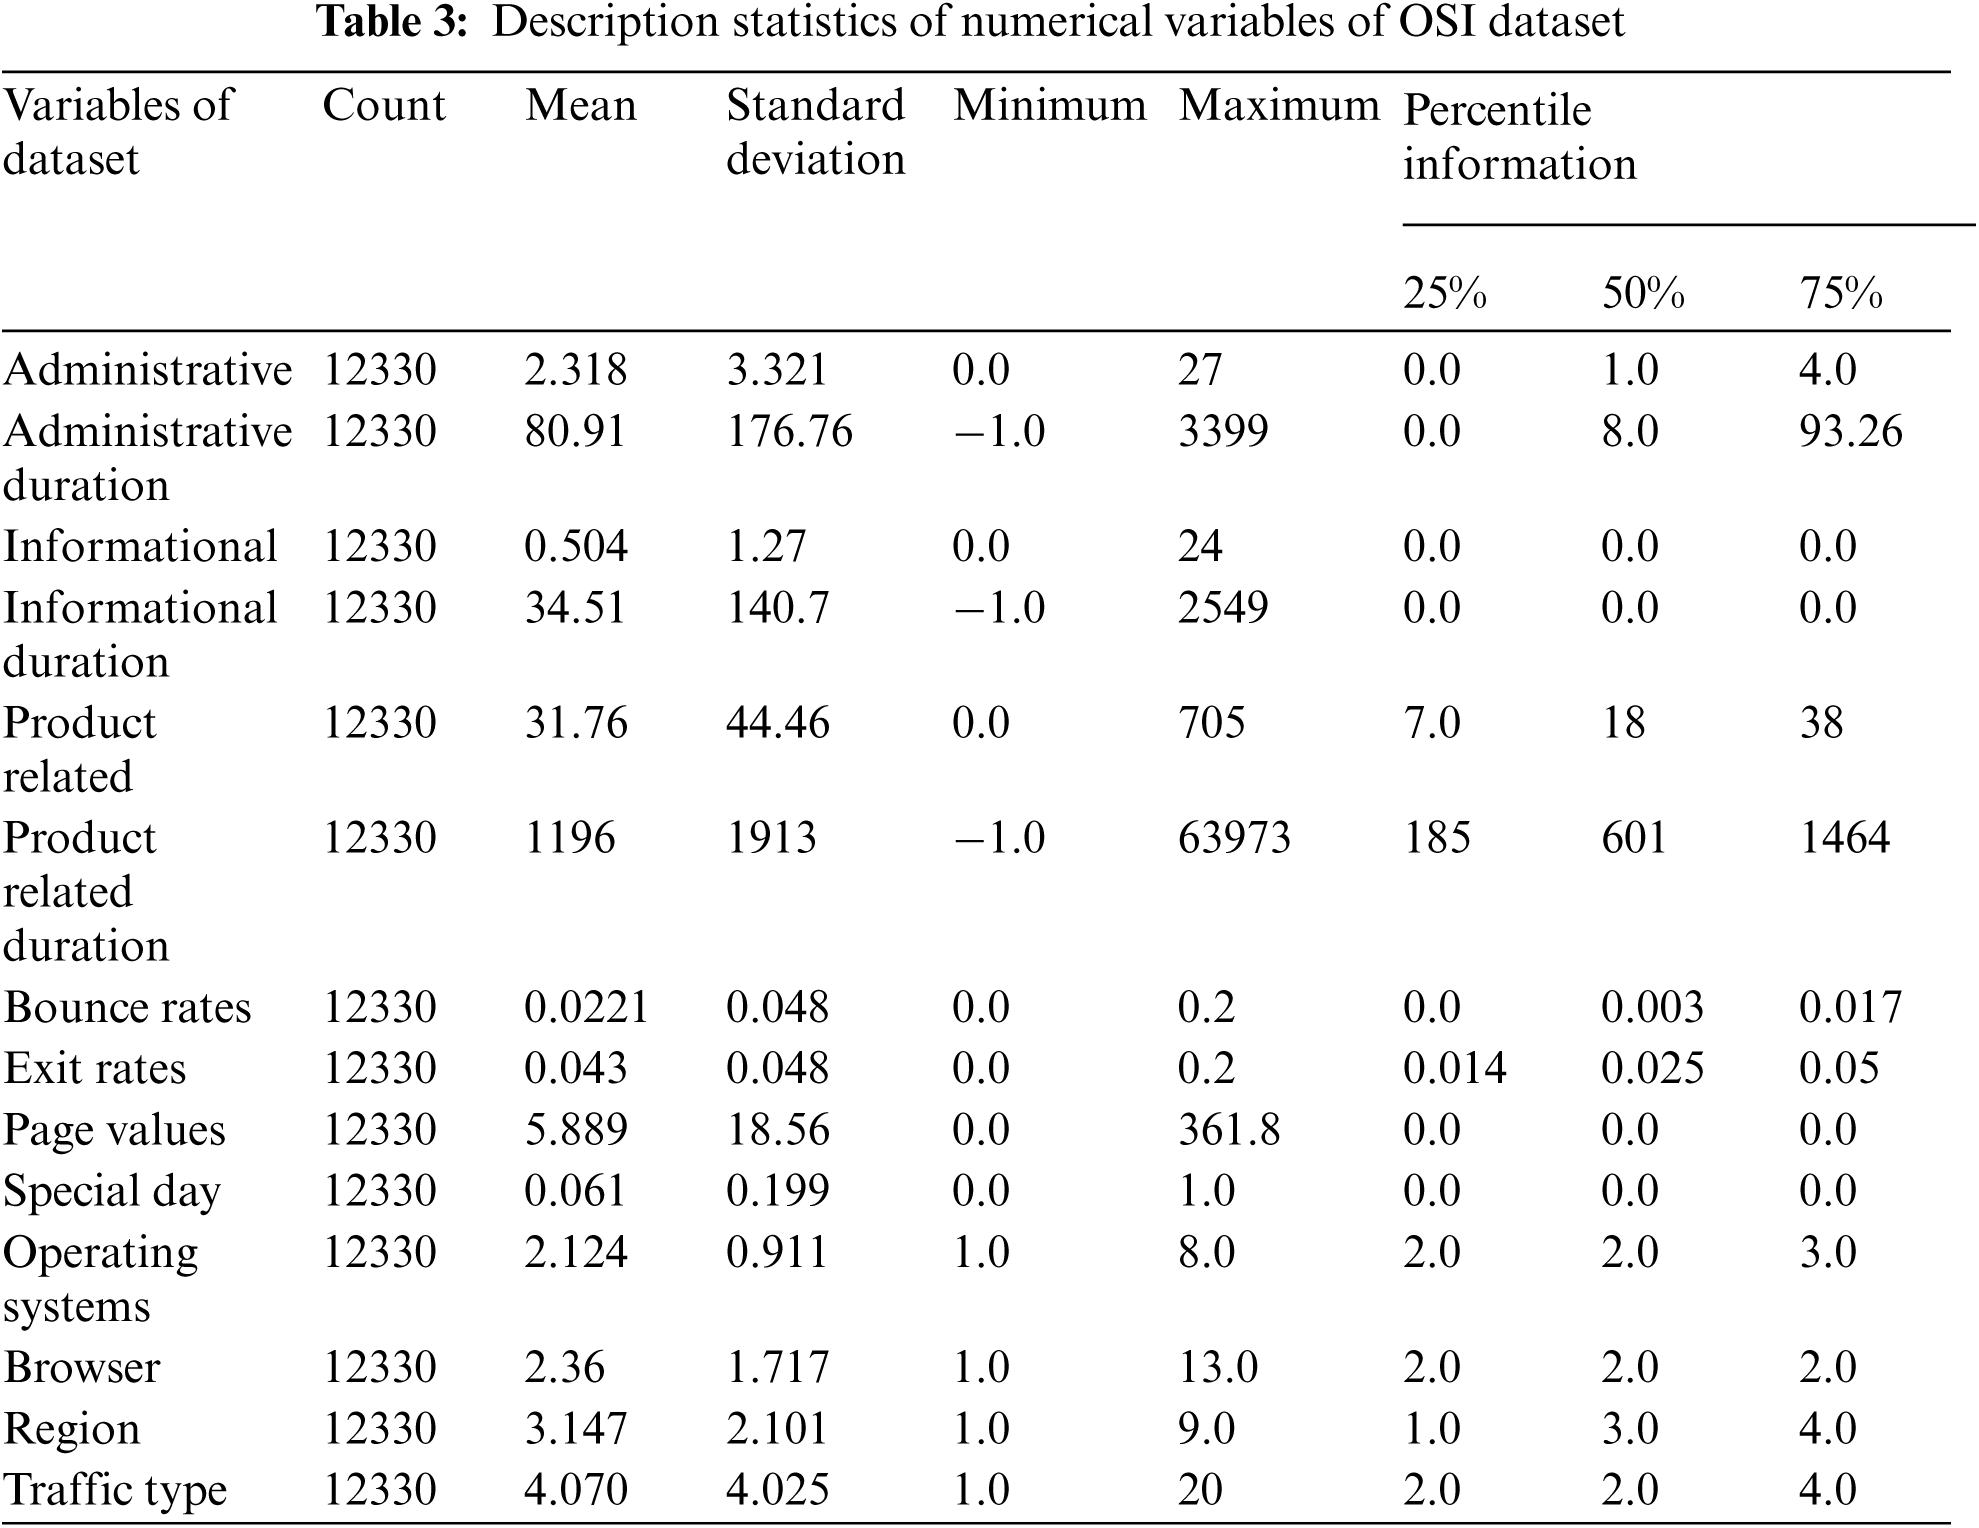
Min, Max, Mean, and Percentiles Information about the numerical variables is given in Tab. 3. As we can see in Tab. 3, the descriptive statistics of the numerical variables indicate the presence of outliers in the dataset. The outliers are identified as those values which are more than three standard deviations away from the mean. The outliers present in the numerical data clipped off to the 98th percentile. Few data points are extreme outliers for the corresponding variables. The outliers present in variables i.e., Administrative Duration, Informational, Informational Duration, Product Related, Product Related Duration, Page Values are treated such that they do not affect the ML modeling.
The correlation among the numerical variables is represented using the correlation plot as shown in Fig. 2. The variables with high correlation are represented with light color whereas the variables with low correlation are represented with dark colors. There exists a high degree of correlation among some of the numerical variables. The positive correlation of 0.91 implies a high degree of correlation between the “Bounce Rates” and “Exit Rates”. This is practically possible as customers who click on ads are navigated to the website but the majority of these customers close the ads abruptly. There exists a correlation of 0.62 and 0.6 between the “Information and Information Duration” and “Administrative and Administrative duration” respectively. This is because these variables are used to describe similar information. The variable of interest is the target label “Revenue”, which has shown a maximum correlation of 0.49 with the variable “Page Values”. The correlation of the target label with all the other variables is not significant. So, the “Page Values” variable could be one of the most significant variables in determining the revenue in the ML modeling stages and could be the most important variable in predicting future outcomes.
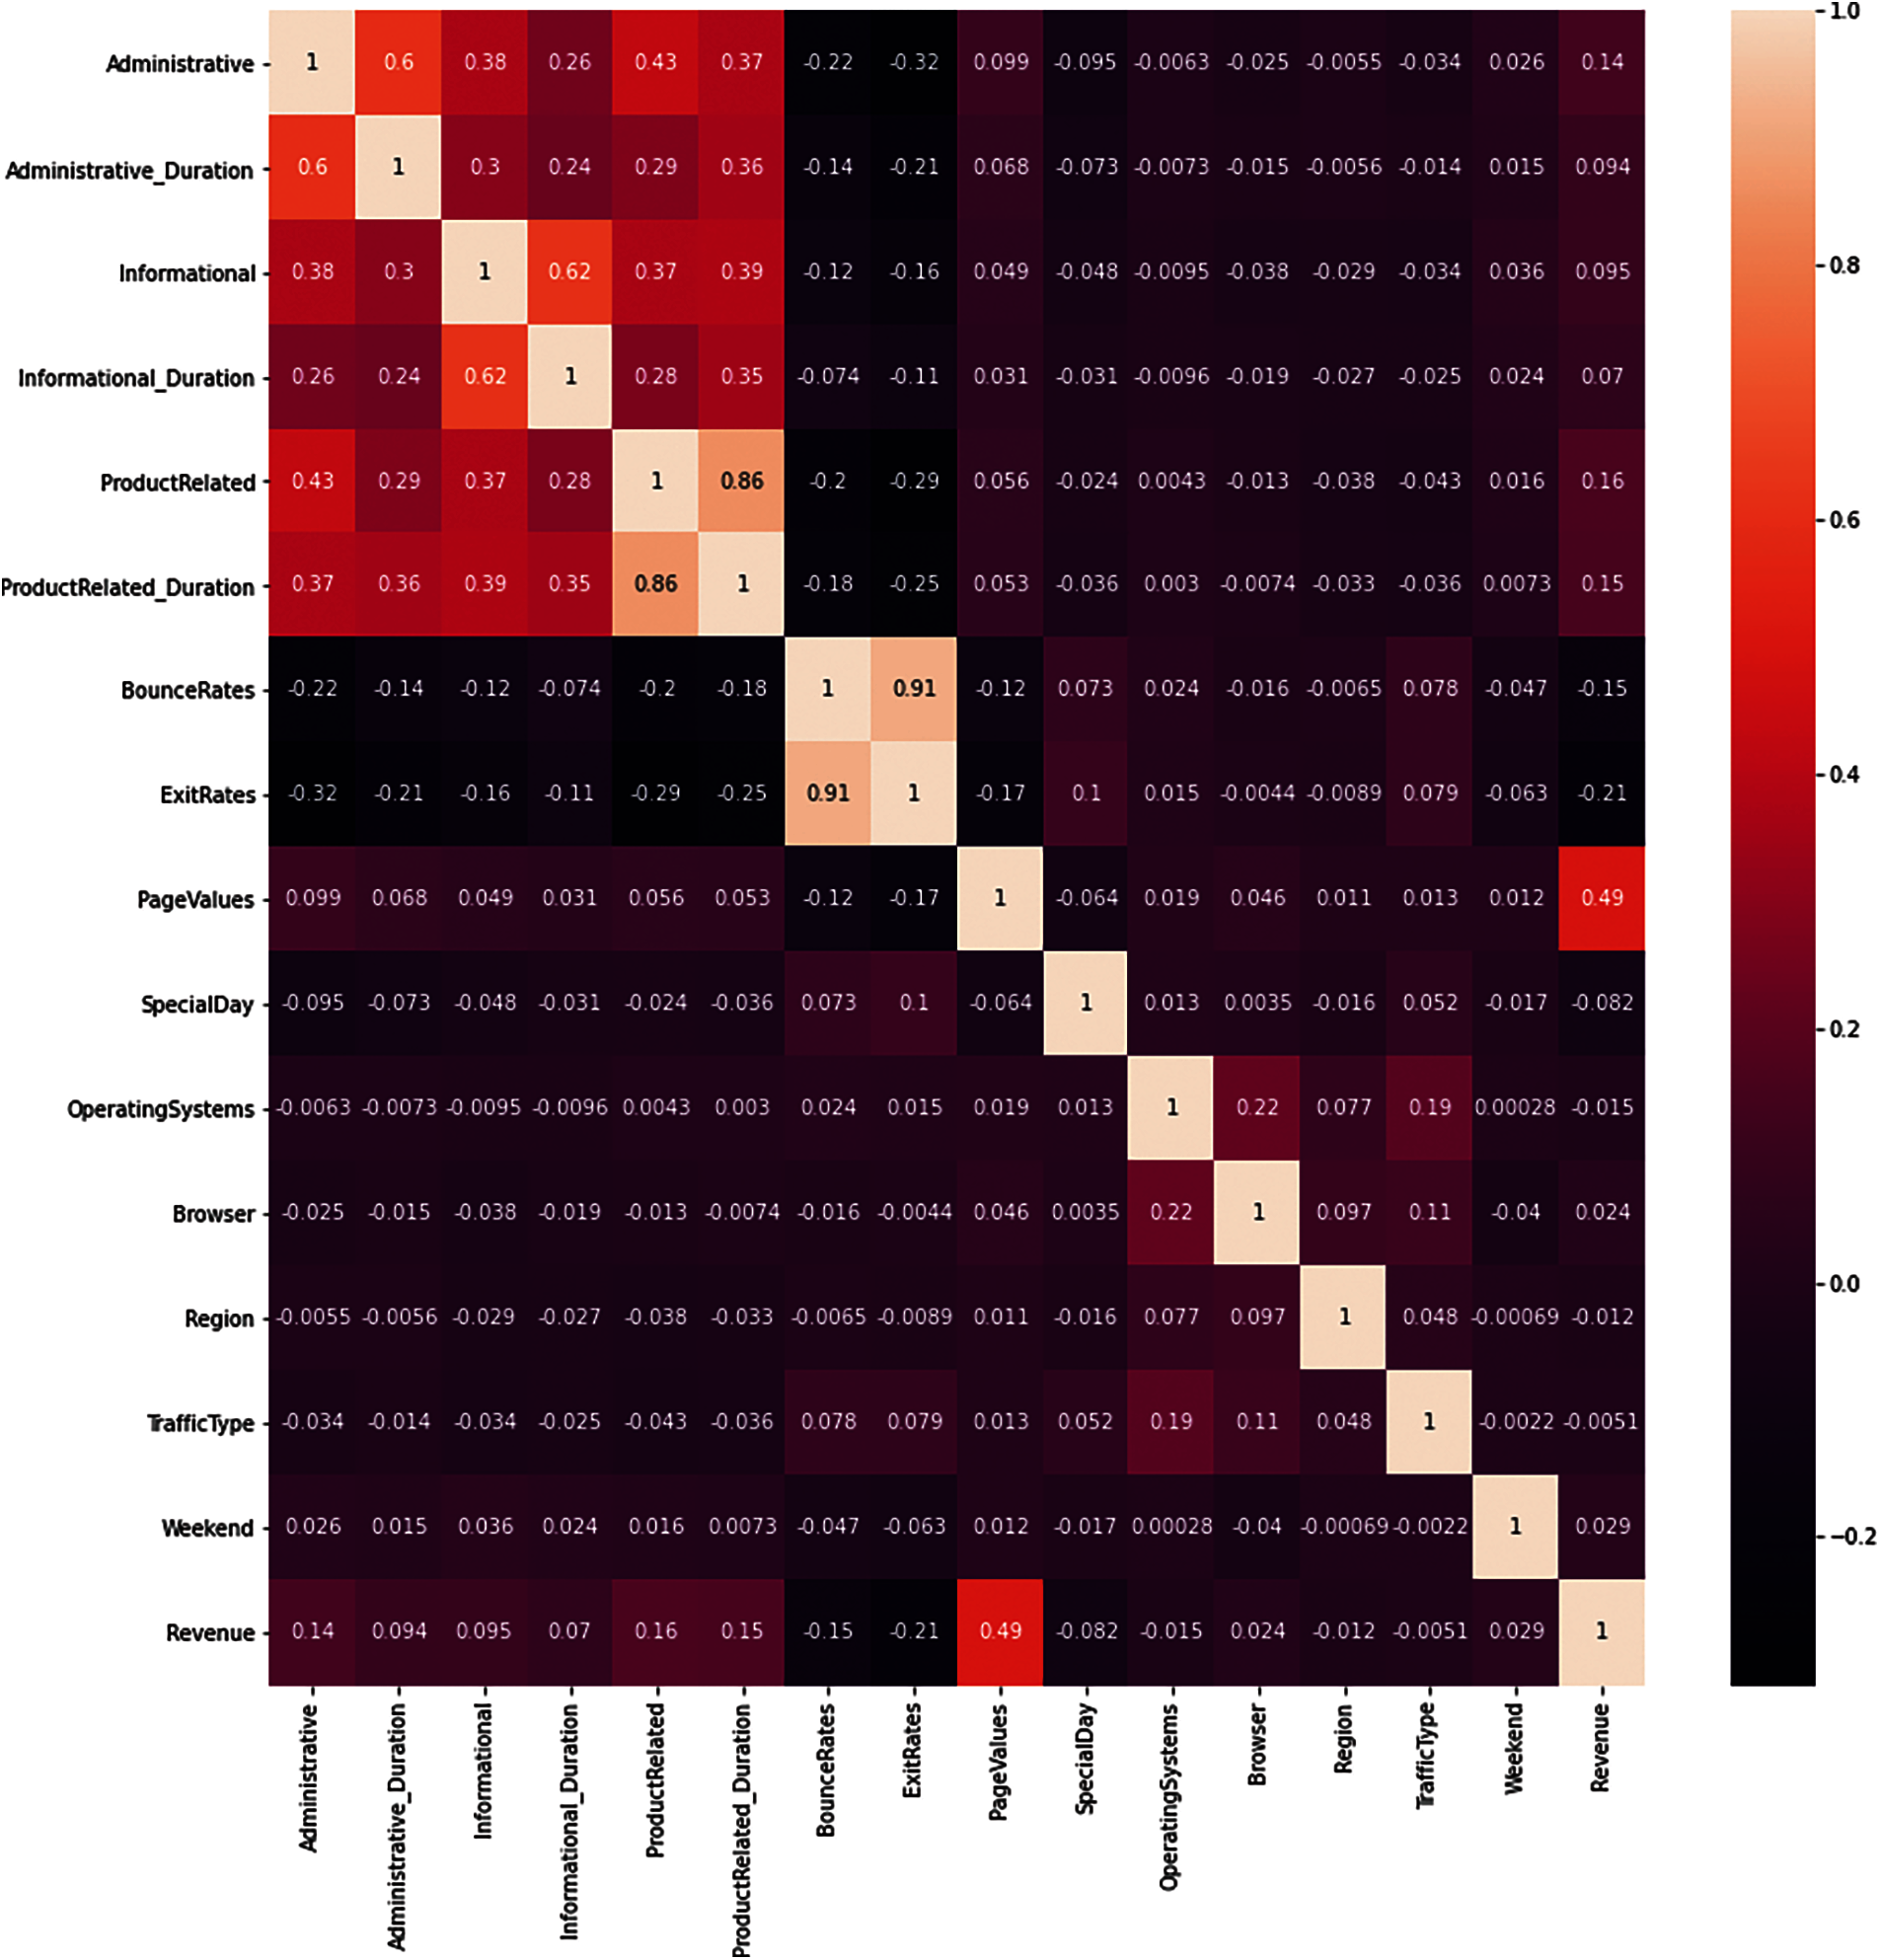
Figure 2: Correlation plot of numerical variables of OSI dataset
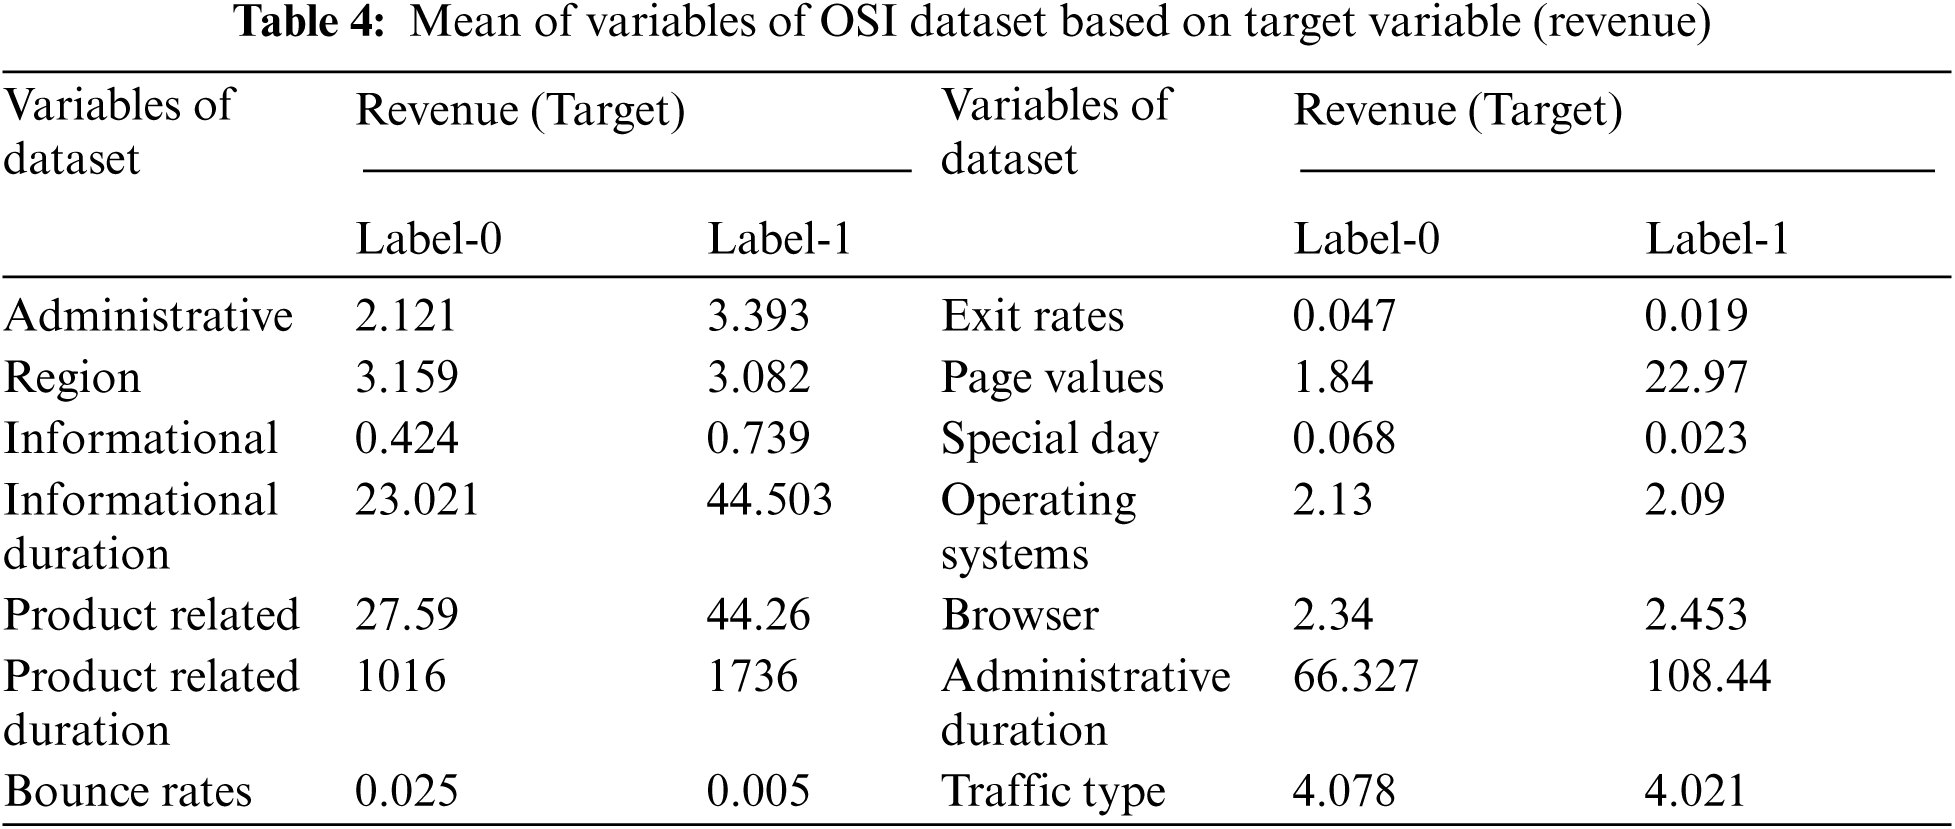
Group-by target label is one of the major analyses techniques in classification tasks. The descriptive statistics of the data are calculated after grouping the data based on the target label. There are two classes in the dataset which are categorized as Label-0 (false) and Label-1 (True). The mean, maximum, minimum, standard deviation, and variance can be found for all the variables in each of the categories. The variation in the values based on the category allows for an understanding of discriminative power of the variables in terms of distinguishing the two classes. Tab. 4 shows the mean of the variables based on the Label-1 and label-0 category of the target variable.
ML and DL techniques [15] are used to perform modeling, explain the importance of variables, and predict the new unseen cases. In this study, ML techniques like LR, RF, DT, ET, and NN as DL techniques are used to train a binary class classifier. The pre-processed data is passed to the ML algorithms. A variation of one-hot encoding and categorical encoded variables are passed as inputs to ML models and output is the target binary label which is either 0 or 1. Below we give a brief description of all the ML techniques used in this research. The purpose of using ML techniques is to identify important variables that are key for predicting the purchasing decisions of customers. Model performances were measured using the validation datasets. The best performing models are used to predict the unseen data as well as identify important variables influencing the purchasing behaviour of customers.
Logistic regression (LR) model is a supervised ML model used for classification problems to find the relationship between target variable Y and independent variables X. LR model predicts the output in the form of probability. This model uses a sigmoid activation function which converts the numeric value into a probability score by taking the sigmoid of that value [16]. The mathematical expression for the LR model is given in Eq. (1).
Decision tree (DT) is an important ML model used in both classification as well as regression problems. DT model uses a tree-shaped structure and explains decisions based on each step. It takes a variable with the highest information gain on the top of the tree and starts making a tree by splitting the variables downward [17].
RF model is an ensemble model of several DT models, where each DT predicts a class and, in the end, based on the majority voting the class is assigned to the test sample point. At each stage of RF voting is used to decide an outcome [18].
Similar to the RF model, there is another important model known as extra tree (ET) classifier. In the ET, more variation into the ensemble is expected so, there is a change in building trees in the ETC. Each decision stump in the ET is build using the criteria discussed as follows: All data available in the training set is used to build each stump, to form root node next step is to determine the best split and it is determined by searching in a subset of randomly selected features. In the case of ET split of each selected feature is selected at random. The maximum depth of a decision stump is 1 [19].
Neural network (NN) is one of the most important models of DL and is mainly used in problems where complexity is high. NN classifier is mainly used in high dimensional data where the algorithm is trained to extract non-linear patterns present in the data. NN uses different hidden layers and activation functions. For a binary classification problem, sigmoid is mostly used [10]. The general structure of NN working is given in Fig. 3. As we can see in Fig. 3, there are 4 inputs, one hidden layer, and one output layer.
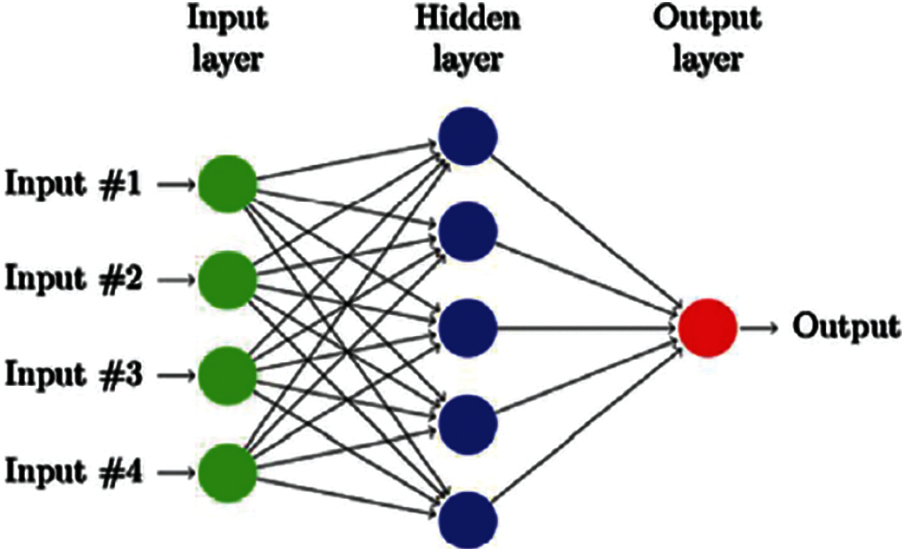
Figure 3: General structure of neural network classifier [20]
2.5 Performance Measure Techniques
In this research AUC-ROC score, precision/recall, F1 score, accuracy, and confusion matrix are used to measure the performance of each model. Precision is the ratio of true positive (TP) values and the sum of TP and false positive (FP).
The recall is the ratio of TP and the sum of TP and FN [8]. The mathematical formula of precision and recall is given in Eqs. (2) and (3) respectively.
There is always a trade-off between recall and precision, sometimes precision is high while recall is low and, in some cases, recall is high while precision is low. The main objective is to have good precision and recall score. F1score is a better measure to use to seek a balance between precision and recall and especially in the case when data is imbalanced. The mathematical formula of the F1 score is given in Eq. (4).
Accuracy is another measure of performance. It is a ratio of correct predictions made by the model out of total. It is a ratio of the sum of TP and true negative (TN) divided by the sum of TN, TP, false negative (FN), and FP [21]. The mathematical expression of accuracy is given in Eq. (5).
Permutation importance (PI) [22] is used to find the feature importance by randomly shuffling the feature values across all samples in the data and checking the performance of the already trained model. If the performance of the fitted model deteriorates significantly, showing less accuracy, precision, and recall for the classification tasks, this indicates a heavy reliance of the trained model on that particular feature for prediction. In case the resulting predictions do not suffer that much, the feature under consideration is not important for prediction. The PI technique works the same for the classification and regression algorithms. In classification techniques, the output label falls into predetermined categories and classification algorithms try to maximize the accuracy by predicting the correct categories for each label. In regression tasks, the output is continuous, and the objective is to reduce the error between the actual and predicted values. In this study, we found the important features by using the following techniques i.e., RF classifier PI, DT classifier PI, LR classifier PI, and ET classifier PI.
The data is a binary classification dataset. The performance metrics such as Accuracy, Precision, Recall, and F1 Score are used as the evaluation metrics to check the performance of the classification models. Moreover, the study focused on the importance of variables in predicting the outcome that is measured by classification algorithms.
Tabs. 5a–5d shows the output results based on the confusion matrix of all chosen ML models i.e., (LR, DT, RF, and ET) respectively. The confusion matrix is used to detect the uncertainty between Label-0 and Label-1 of target variable “Revenue” at predicted and actual values. From Tabs. 5a–5d, we can observe that class Label-0 is the majority class and class Label-1 is the minority class. Fig. 4 shows the loss and accuracy score of the NN model. From Fig. 4, It can be seen that the loss decreases with the increase in epoch count whereas the accuracy increases with the increase in epochs.
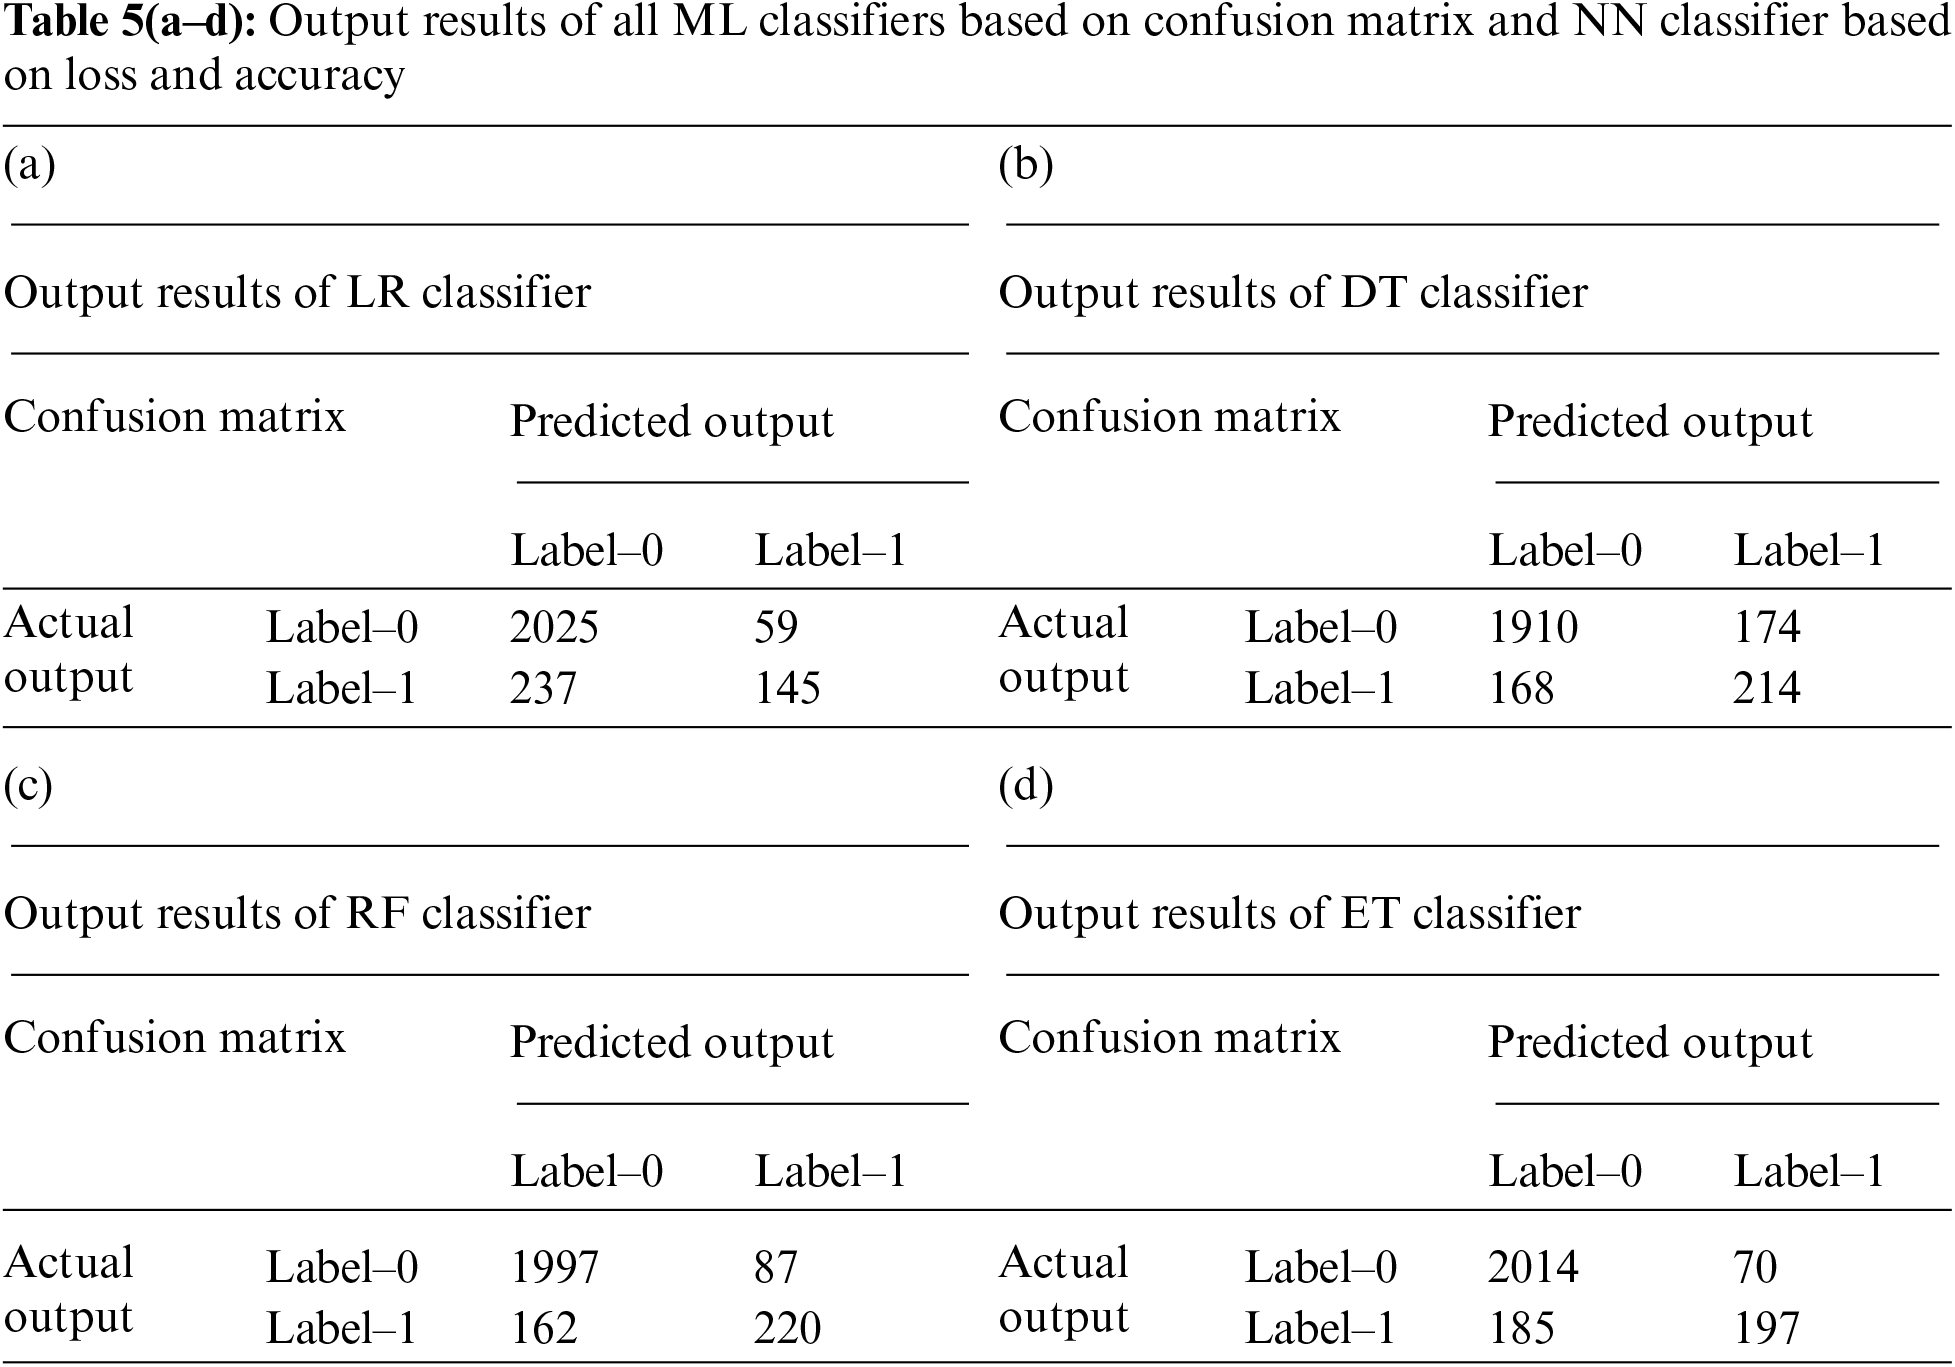
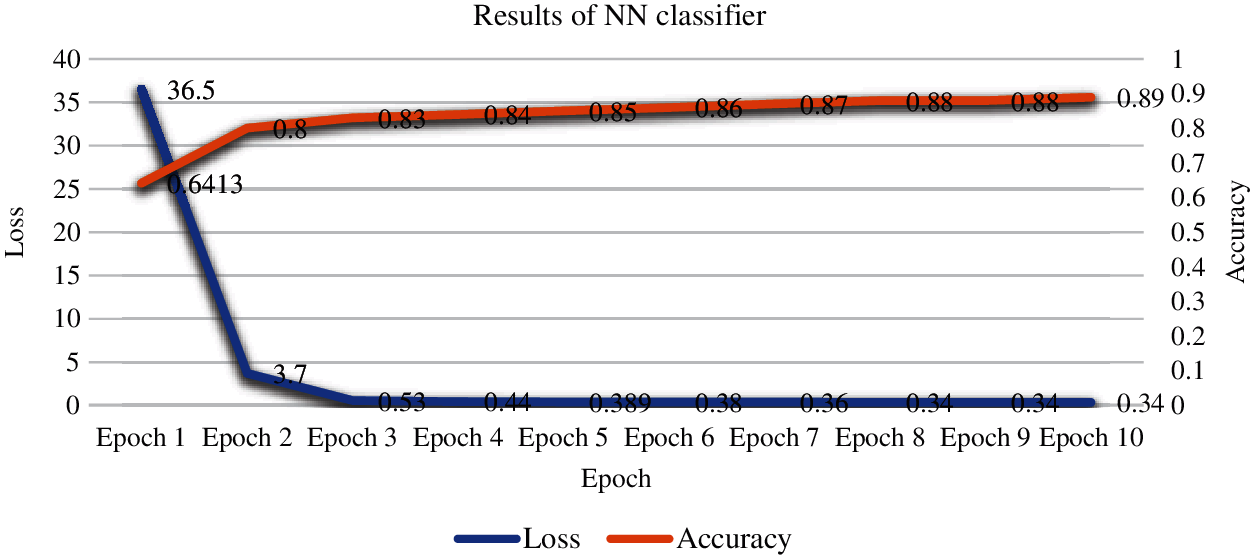
Figure 4: Output results of NN classifier in terms of loss and accuracy
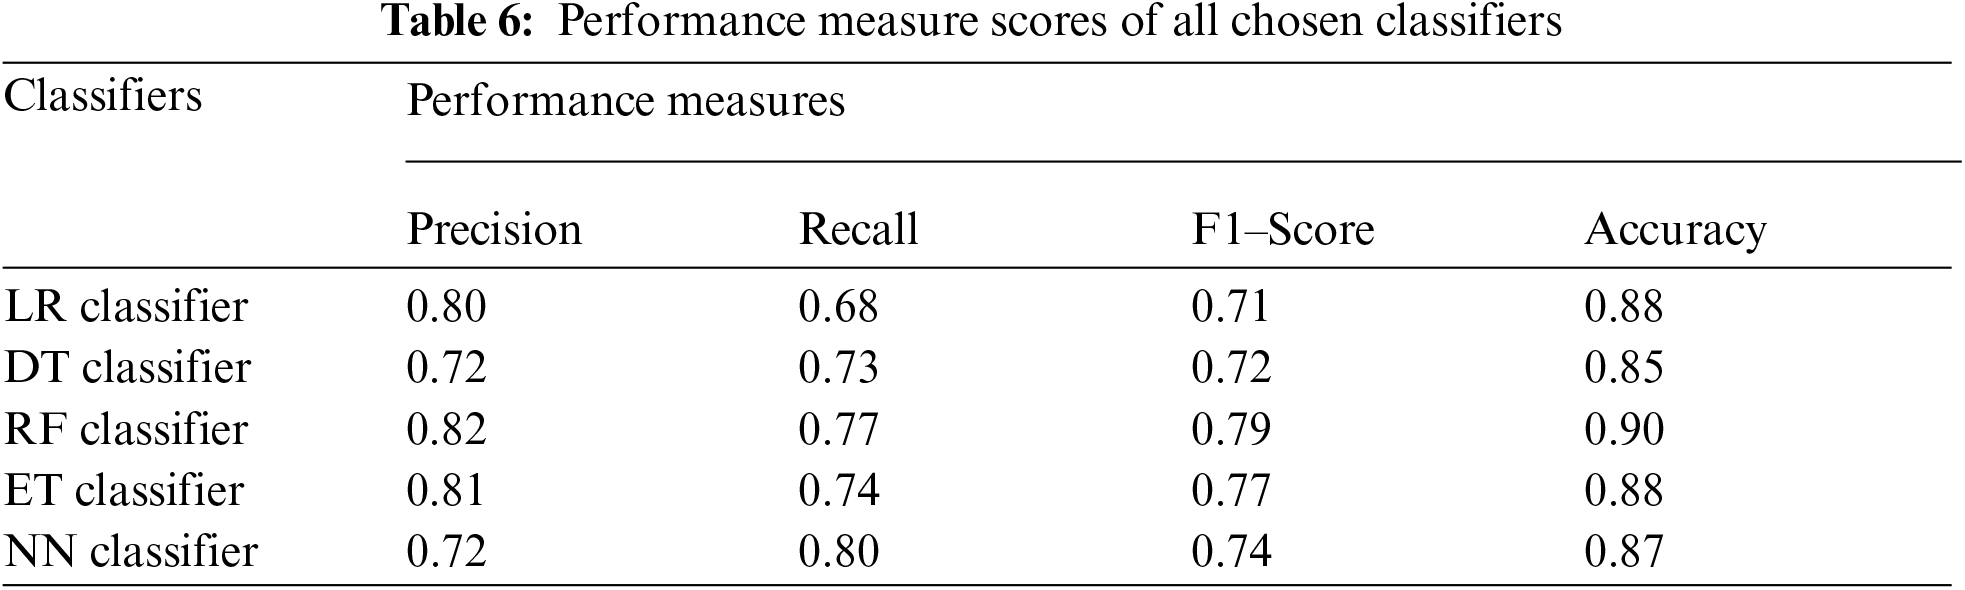
Tab. 6 shows the micro average of precision, recall, F1 score, and accuracy of all the models used in the experiment. Tab. 6 shows the performance measures of all five chosen models. As we can observe, RF is the best model among all chosen models with highest accuracy score and F1 score followed by ET classifier. Other models LR, DT, and NN classifiers also performed well.
Permutation importance (PI) method is used to find the best variables that are contributing towards correct predictions of output variable. Tabs. 7a–7d shows the results that are obtained using the PI approach on ML classifier i.e., LR, DT, RF, and ET classifiers respectively.
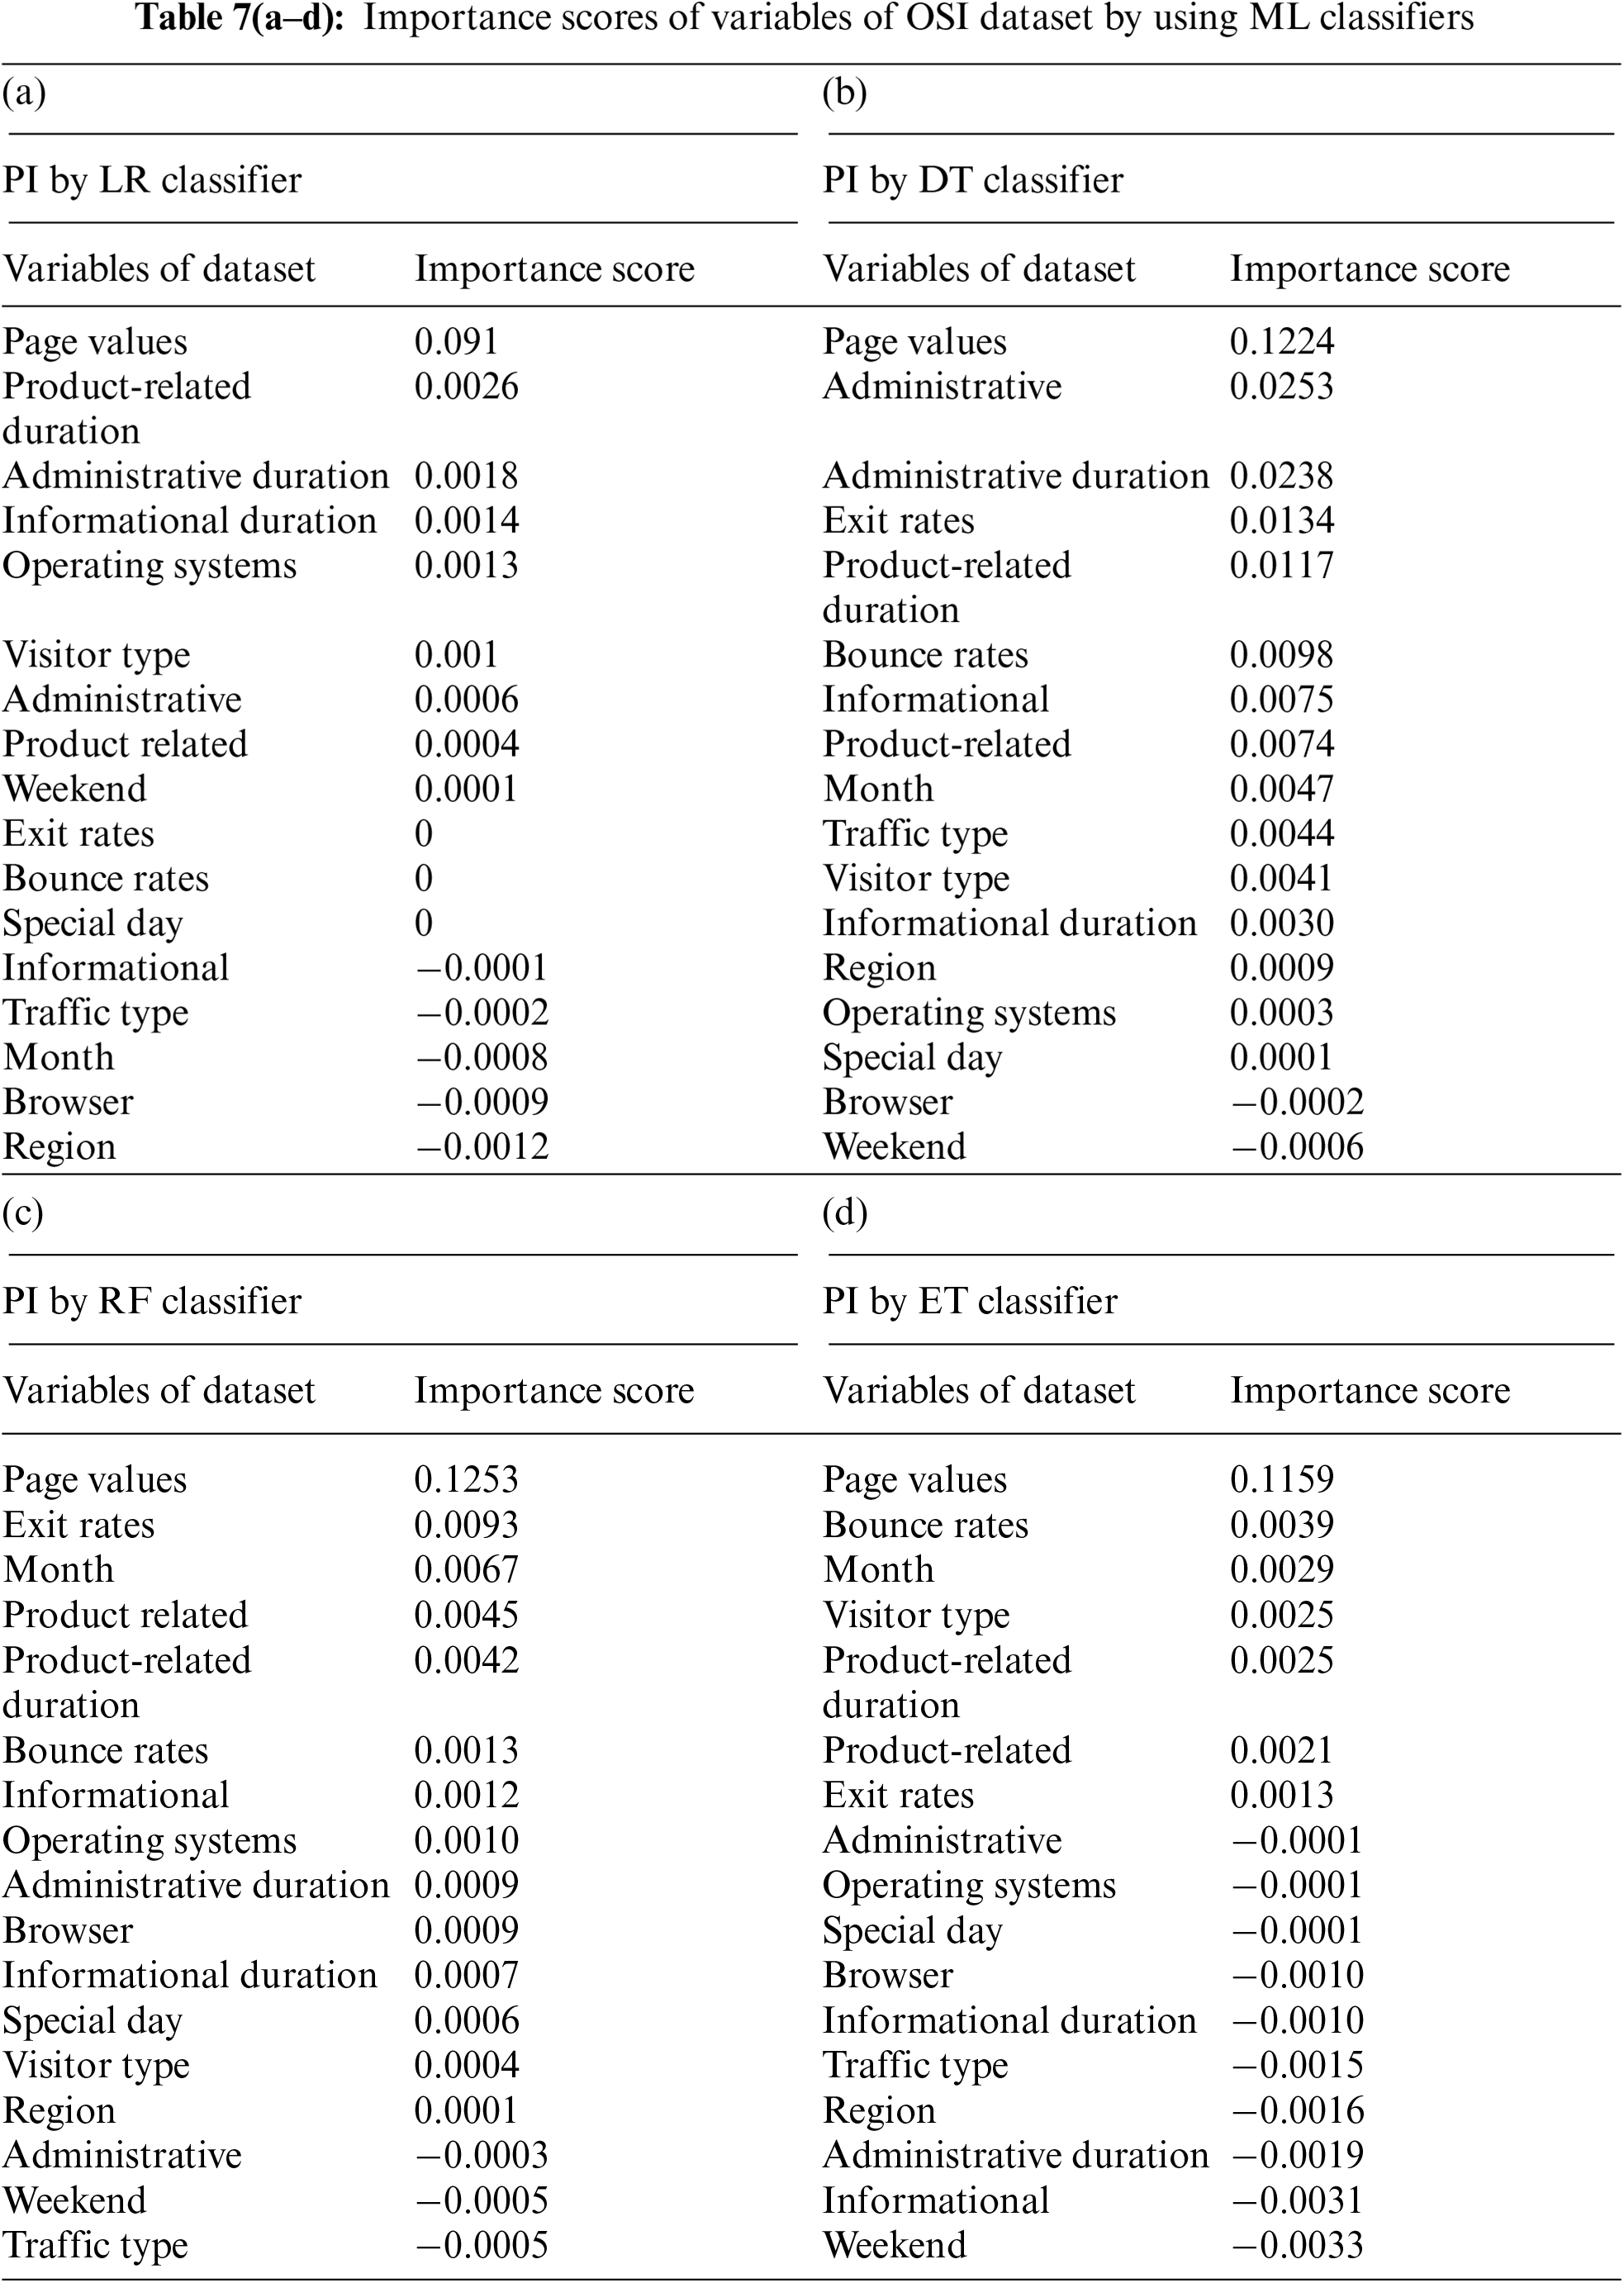
PI is an approach to find the best features for predicting the outcome of a classifier. The importance of the variable is decided by the prediction power that the variable has on the modeling technique. This is determined by random shuffling and removing the variables and determining the performance of the modeling technique without the variable. All the four classifiers which are used to explain the feature importance have shown that the “Page Values” is the most important factor in deciding the output “Revenue”. This means that the prediction gives poor results if the modeling is carried out without the “Page Values” variable. This is advocated by the fact that the Revenue has shown a correlation value of 0.5 with the “page values” which is highest among all the other variables. The variation in the page values has shown a significant effect on the target variable. It is evident that most users spend time on the website before they make a transaction, the importance of the variable Page Value further strengthens the fact that customers’ average time spent on the page has a strong impact on the sales. In day-to-day e-commerce websites like Amazon and eBay, an average user spends time browsing the website and chooses a product. The product which the user likes to buy will have a higher page value to the user. The reason that user takes extra time and care before making a transaction and the increase in page value is because of the extra time spent by the user in reviewing the product before making the purchase. The process of reviewing the product by reading the reviews and seeing product specifications add value to the page. Although the “Page value” turned out to be an important factor, it cannot be considered as the only important factor in deciding the purchase. There could be additional driving factors that make the user visit the page and make the sale. The following most important factor in making the sale is “Product Related Duration”, “Administrative”, “Bounce Rates”, “Exit Rates”. The importance of the Bounce rate can be explained by the fact that customers who immediately fly away from the product site have an impact on the sale. This could be due to the ad links that appear on the websites like Facebook and Instagram. Users tend to click the ads and close the product pages instantly. Product-Related duration is the average time spent by the user across all the related products. Most of the users who do the e-commerce shopping spend time on the product and the related products to compare the price and quality of the product with similar products which makes the product-related duration one of the important variables. For instance, the user who will purchase a mobile from the website compares all the mobiles with a similar price range and specifications.
The primary objective of this research is to provide eXplainable artificial intelligence (XAI) that drives the business not just by predicting the outcomes, but also explaining the importance of each of the variables, and identifying key features for future predictions. The reason behind choosing the approach of variable importance is to further explore the variables that are contributing to the revenue. Although business decisions are based on several other factors when intelligence is combined with statistics and numbers with explanation, businesses are sure about the outcomes rather than depending on just predictions. This study focuses on the usage of traditional approaches for determining the feature importance. Permutation Feature importance is an approach where the importance of variables is determined by randomly shuffling the values of the variable under consideration across all samples and observing the results of the experiments with the shuffled values. This project also explains the use of NN in making future predictions on the unseen data. Although NN has been observed to be good in making predictions, it cannot explain results.
XAI has shown an increasing demand in recent years, The reason behind it is that the majority of the organizations are interested in knowing the reason behind the outcomes rather than the results themselves. If the AI used in the project can explain results, this will help the businesses in making crucial decisions and allow them to focus on areas where attention is necessary. This research shows the impact of page values on the target label “Revenue”. This information could be useful for businesses that can now focus on areas that are contributing to the page value. As there is also a positive correlation between the “page value” and “revenue” the businesses can focus on factors that are helping in the increase in “page values”. This study shows the importance of variables and draws inferences about the reasons behind the importance of those variables and thus, could help businesses grow and get popular in the same e-commerce market.
In the future models can be exported to the cloud making the models to predict in live real-time and also the models can be used beforehand to make XAI solutions, such that businesses can make the right decisions in time on the attributes that are contributing to the profits.
Acknowledgement: Thanks to the supervisor and co-authors for their valuable guidance and support.
Funding Statement: The authors received no specific funding for this study.
Conflicts of Interest: The authors declare that they have no conflicts of interest to report regarding the present study.
1. A. Saxena, U. Rani, I. Agarwal and S. M. Sreedharan, “Introduction to machine learning,” Big Data and Artificial Intelligence for Healthcare Applications, vol. 1, pp. 23–66, 2021. [Google Scholar]
2. R. A. E. D. Ahmeda, M. E. Shehaba, S. Morsya and N. Mekawiea, “Performance study of classification algorithms for consumer online shopping attitudes and behavior using data mining,” in 5th IEEE Int. Conf. Communication Systems and Network Technologies, Gwalior, India, pp. 1344–1349, 2015. [Google Scholar]
3. A. Morton, E. Marzban, G. Giannoulis, A. Patel, R. Aparasu et al., “A comparison of supervised machine learning techniques for predicting short-term in-hospital length of stay among diabetic patients,” in 13th Int. Conf. on Machine Learning and Applications, Detroit, MI, USA, pp. 1–5, 2014. [Google Scholar]
4. R. Joshi, R. Gupte and P. Saravanan, “A random forest approach for predicting online buying behavior of Indian customers,” Theoretical Economics Letters, vol. 8, no. 3, pp. 448–456, 2018. [Google Scholar]
5. V. Effendy and Z. A. Baizal, “Handling imbalanced data in customer churn prediction using combined sampling and weighted random forest,” in 2nd IEEE Int. Conf. on Information and Communication Technology, Bandung, Indonesia, pp. 325–330, 2014. [Google Scholar]
6. K. K. Boyer and G. T. M. Hult, “Customer behavior in an online ordering application: A decision scoring model,” Decision Sciences, vol. 36, no. 4, pp. 569–598, 2005. [Google Scholar]
7. J. Hadden, A. Tiwari, R. Roy and D. Ruta, “Churn prediction: Does technology matter,” International Journal of Intelligent Technology, vol. 1, no. 2, pp. 104–110, 2006. [Google Scholar]
8. Y. Xie, X. Li, E. Ngai and W. Ying, “Customer churn prediction using improved balanced random forests,” Expert Systems with Applications, vol. 36, no. 3, pp. 5445–5449, 2009. [Google Scholar]
9. M. M. Islam, A. Lam, H. Fukuda, Y. Kobayashi and Y. J. R. J. Kuno, “An intelligent shopping support robot: Understanding shopping behavior from 2d skeleton data using gru network,” Robomech Journal, vol. 6, no. 1, pp. 1–10, 2019. [Google Scholar]
10. A. Sharma and M. O. Shafiq, “Predicting purchase probability of retail items using an ensemble learning approach and historical data,” in 19th IEEE Int. Conf. on Machine Learning and Applications, Miami, FL, USA, pp. 723–728, 2020. [Google Scholar]
11. M. M. Hafez, A. F. Vilas, R. P. D. Redondo and H. O. Pazó, “Classification of retail products: From probabilistic ranking to neural networks,” Applied Sciences, vol. 11, no. 9, pp. 4117, 2021. [Google Scholar]
12. S. Roshan, “Online shopper’s intention,” Kaggle, 2019. [Online]. Available: https://www.kaggle.com/roshansharma/online-shoppers-intention. [Google Scholar]
13. O. Sakar, S. O. Polat, M. Katircioglu and Y. Kastro, “Real-time prediction of online shoppers’ purchasing intention using multilayer perceptron and LSTM recurrent neural networks,” Neural Computing Applications, vol. 31, no. 10, pp. 6893–6908, 2019. [Google Scholar]
14. K. Baati and M. Mohsil, “Real-time prediction of online shoppers’ purchasing intention using random forest,” in IFIP Advances in Information and Communication Technology, Switzerland, pp. 43–51, 2020. [Google Scholar]
15. H. Liu and B. Lang, “Machine learning and deep learning methods for intrusion detection systems: A survey,” Applied Sciences, vol. 9, no. 20, pp. 4396–4406, 2019. [Google Scholar]
16. W. Y. K. Chiang, D. Zhang and L. Zhou, “Predicting and explaining patronage behavior toward web and traditional stores using neural networks: A comparative analysis with logistic regression,” Decision Support Systems, vol. 41, no. 2, pp. 514–531, 2006. [Google Scholar]
17. B. Charbuty and A. Abdulazeez, “Classification based on decision tree algorithm for machine learning,” Journal of Applied Science Technology Trends, vol. 2, no. 1, pp. 20–28, 2021. [Google Scholar]
18. A. Liaw and M. Wiener, “Classification and regression by random Forest,” R News, vol. 2, no. 3, pp. 18–22, 2002. [Google Scholar]
19. A. Sharaff and H. Gupta, “Extra-tree classifier with metaheuristics approach for email classification,” in Int. Conf. on Artificial Intelligence, Soft Computing, Singapore, pp. 189–197, 2019. [Google Scholar]
20. H. T. Ziboon and A. A. Thabit, “A new proposed adaptive cognitive radio detection system based on MLP neural network for different modulation schemes,” ARPN Journal of Engineering Applied Sciences, vol. 12, no. 2, pp. 521–527, 2017. [Google Scholar]
21. Y. Jiao and P. Du, “Performance measures in evaluating machine learning based bioinformatics predictors forclassifications,” Quantitative Biology, vol. 4, no. 4, pp. 320–330, 2016. [Google Scholar]
22. L. Toloşi Altmann, O. Sander and T. J. B. Lengauer, “Permutation importance: A corrected feature importance measure,” Bioinformatics, vol. 26, no. 10, pp. 1340–1347, 2010. [Google Scholar]
 | This work is licensed under a Creative Commons Attribution 4.0 International License, which permits unrestricted use, distribution, and reproduction in any medium, provided the original work is properly cited. |