DOI:10.32604/cmc.2022.023848
| Computers, Materials & Continua DOI:10.32604/cmc.2022.023848 | |
| Article |
A Hybrid Meta-Classifier of Fuzzy Clustering and Logistic Regression for Diabetes Prediction
Department of Information Technology, Faculty of Computing and Information Technology in Rabigh, King Abdulaziz University, Jeddah, Saudi Arabia
*Corresponding Author: Altyeb Altaher Taha. Email: aaataha@kau.edu.sa
Received: 23 September 2021; Accepted: 02 November 2021
Abstract: Diabetes is a chronic health condition that impairs the body's ability to convert food to energy, recognized by persistently high levels of blood glucose. Undiagnosed diabetes can cause many complications, including retinopathy, nephropathy, neuropathy, and other vascular disorders. Machine learning methods can be very useful for disease identification, prediction, and treatment. This paper proposes a new ensemble learning approach for type 2 diabetes prediction based on a hybrid meta-classifier of fuzzy clustering and logistic regression. The proposed approach consists of two levels. First, a base-learner comprising six machine learning algorithms is utilized for predicting diabetes. Second, a hybrid meta-learner that combines fuzzy clustering and logistic regression is employed to appropriately integrate predictions from the base-learners and provide an accurate prediction of diabetes. The hybrid meta-learner employs the Fuzzy C-means Clustering (FCM) algorithm to generate highly significant clusters of predictions from base-learners. The predictions of base-learners and their fuzzy clusters are then employed as inputs to the Logistic Regression (LR) algorithm, which generates the final diabetes prediction result. Experiments were conducted using two publicly available datasets, the Pima Indians Diabetes Database (PIDD) and the Schorling Diabetes Dataset (SDD) to demonstrate the efficacy of the proposed method for predicting diabetes. When compared with other models, the proposed approach outperformed them and obtained the highest prediction accuracies of 99.00% and 95.20% using the PIDD and SDD datasets, respectively.
Keywords: Ensemble learning; fuzzy clustering; diabetes prediction; machine learning
Diabetes Mellitus (DM) is a common chronic disease that affects approximately 425 million people worldwide, and this figure is expected to rise to 629 million by 2045 [1]. It is a metabolic condition characterized by elevated blood glucose levels. Diabetes is classified into three types: type 1 diabetes (T1D), (ii) type 2 diabetes (T2D), and (iii) gestational diabetes (GD). T1D is most commonly found in young adults under the age of 30. Polyuria, thirst, constant hunger, weight loss, vision changes, and fatigue are all symptoms of T1D. T2D affects adults over the age of 45 and is frequently associated with obesity, hypertension, dyslipidemia, arteriosclerosis, and other diseases. Gestational diabetes is the third type of diabetes. Actually, gestational diabetes affects pregnant women and its diagnostic criteria vary by country, illustrating the lack of consensus around the most effective way to screen in routine clinical care [2,3]. This research focus on the prediction of Type 2 diabetes, which is distinguished by relative insulin deficiency due to pancreatic-cell dysfunction and insulin resistance in target organs. The consequences include a variety of health-related issues, such as early death, blindness, cardiac disease, and kidney problems. The seriousness of this disorder can be compounded by the fact that it can be ppdiagnosis of diabetes will help decrease the occurrence of the disease and related complications.
Over the last few years, there has been increasing interest in the use of machine learning techniques for the early diagnosis of diabetes to improve classification accuracy. Many classification methods based on machine learning, including Naive Bayes (NB), Neural Networks (NN), Support Vector Machines (SVM), Fuzzy Decision Trees (FDT), K-Nearest Neighbor (K-NN) and Decision Trees (DT), have been used for the diagnosis of diabetes [4,5]. However, several researchers in this field have concluded that there is no single classifier that can significantly boost the prediction accuracy. Because of this challenge, there has been much focus on ensemble-based learners to improve prediction efficiency. This type of learner assumes that various base classifiers create different classification mistakes and that classification accuracy can be greatly enhanced by the integration of these particular classifiers. It is also widely acknowledged that an ensemble learner outperforms an individual learner in terms of robustness and precision, as shown by the results in a variety of research domains [6]. Ensembles of different individual classifiers benefit from the various biases and variances of each classification algorithm. Stacking is an example of an ensemble learning strategy that uses a two-stage classification system: the base-learner stage and the meta-learner stage. Identifying the appropriate configuration of the base-learner and meta-learner models is a challenging but critical process because the efficiency of the classification scheme is heavily dependent on the accurate determination of both models [7,8]. Ensemble strategies train multiple learners and then combine them to achieve a better predictive performance. In this research, we compared the proposed approach with the soft voting and hard voting methods. Each individual classifier in soft voting offers a probability value that a certain data point belongs to a specified target class. The predictions are weighted by the significance of the classifier and summed. The target label with the highest sum of weighted probability then wins the vote. In a hard voting ensemble, the votes for crisp class labels from different models are added together and the class with the most votes is predicted.
Although machine learning approaches for diabetes prediction have been developed recently, existing models rely heavily on a single classifier trained on a single dataset, which is incapable of accurately predicting diabetes. Therefore, this research proposes an ensemble approach based on the principles of the stack method, which combines multiple base models for sample prediction and one meta-model for achieving the ultimate predictions by combining the base-level classifiers. The main goal of this study is to explore whether integrating fuzzy clustering and logistic regression at the meta-learner level improves ensemble stacking efficiency. The proposed ensemble approach utilizes a combination of fuzzy clustering and logistic regression to create a highly accurate diabetes model. The hybrid meta-learner employs the Fuzzy C-means clustering (FCM) algorithm to generate highly significant clusters of predictions from base-learners. The predictions of the base-learners and their fuzzy clusters are then employed as inputs to a logistic regression (LR) algorithm, which generates the final diabetes prediction result. The base-learner model includes six different machine learning algorithms: KNN, radial SVM, NB, linear SVM, NN, and light gradient boosting machine (LightGBM). The proposed approach can be leveraged on health care systems to enhance the accuracy of disease prediction.
Diabetes prediction experiments were used to assess the proposed ensemble method based on five performance measures: accuracy, precision, recall, f1-score, and area under the receiver operating characteristic curve (AUC). The main contributions of this study and its significance for improving type 2 diabetes prediction can be summarized as follows:
- Based on the excellent performance of ensemble learning, a hybrid ensemble approach for diabetes prediction is suggested, which can integrate the base learners to create a more efficient learner.
- The proposed approach employs a hybrid meta-learner that combines fuzzy clustering and logistic regression to integrate base-learner results appropriately and provide an accurate diabetes prediction.
- In order to improve the accuracy of diabetes prediction, the suggested approach uses the fuzzy clustering method to explore the hidden information in base-learner predictions.
- The proposed approach outperformed the individual classifiers, soft and hard voting ensemble approaches, and achieved the highest diabetes predictive accuracy of 99% and 95% using two publicly available datasets.
- When compared to experimental results from other researchers utilizing the same datasets, the proposed approach achieved superior results.
The remainder of this paper is organized as follows. Section 2 introduces studies related to ensemble learning approaches for diabetes prediction. Section 3 describes the proposed ensemble learning approach for diabetes prediction, which is based on the hybrid meta-classifier of fuzzy clustering and logistic regression. Experimental results and discussion are provided in Section 4. Finally, conclusions and future work are presented in Section 5.
Several ensemble learning techniques for predicting diabetes have recently been formulated. These techniques have received significant attention because they are more efficient than individual learners in achieving high classification accuracy and generalization capacity. Ensemble learning constructs a model from multiple classifiers, which are combined to create a stronger model with better prediction efficiency [9].
Zolfaghari [10] proposed a stack of an SVM and artificial neural network for diabetes diagnosis based on the Pima Indians Diabetes Database (PIDD) dataset; the proposed approach achieved an accuracy of 88.04% and outperformed the single classifiers. Saleh et al. [11] introduced an ensemble classifier for diabetic detection based on a dominance-based rough set and fuzzy random forests, and the ensemble classifier achieved an accuracy of 77%. Ali et al. [12] applied an ensemble classifier on a dataset from a local medical center for diabetes diagnosis and achieved an accuracy of 81%. Bashir et al. [13] suggested a three-layer ensemble classifier based on a majority voting method. The proposed classifier achieved accuracies of 93% and 77.08% on the PIDD and the Biostat Diabetes Dataset, respectively. El-Baz et al. [14] introduced two neural network ensemble classifiers based on the cascade-forward back-propagation network (CFBN) and multilayer perceptron. Majority voting was used to integrate the ultimate prediction class of each classifier. The classifier based on the CFBN achieved an accuracy of 96.88%, while the other classifier achieved an accuracy of 95.31% with the PIDD dataset. Alehegn et al. [15] proposed an ensemble classifier for diabetes prediction using the SVM, NB, and DT algorithms. The results based on the PIDD dataset showed that the proposed ensemble achieved an accuracy of 90.36%.
In Singh et al. [16], introduced a stacking-based evolutionary ensemble learning scheme for diabetes prediction using the PIDD dataset. A multi-objective optimization procedure was used for base-learner selection, while KNN was utilized as a meta-classifier that ensembled the predictions of the base-learners. Their comparison findings show that the proposed approach outperformed several single machine learning approaches and achieved the accuracy of 83.8%. Using machine learning techniques, Nilashi et al. [17] created a hybrid smart decision support framework for diabetes prediction. The experimental results on the PIDD dataset demonstrated that the proposed approach outperformed previously developed approaches in terms of prediction accuracy. Onan [18] presented a hybrid intelligent classification model for breast cancer diagnosis. The model consists of three phases: instance selection, feature selection and classification. The fuzzy-rough instance selection method based on weak gamma evaluator is utilized for instance selection. In feature selection, the consistency-based feature selection method is used in conjunction with a re-ranking algorithm. In the classification phase of the model, the fuzzy-rough nearest neighbor algorithm is utilized. The accuracy of the proposed approach is 99.7151%. Onan [19] presented a comprehensive analysis of Turkish sentiment analysis using nine supervised and unsupervised term weighting schemes. The predictive efficiency of term weighting schemes is explored using four supervised learning algorithms and three ensemble learning methods (AdaBoost, Bagging, and Random Subspace). Onan [20] presented an ensemble scheme based on hybrid supervised clustering for text classification. In the presented scheme, supervised hybrid clustering is utilized to partition the data samples of each class into clusters so that training subsets with higher diversities can be provided. Each classifier is trained on the diversified training subsets and the predictions of individual classifiers are combined by the majority voting rule. The authors in [21] proposed an approach for improving the diagnostic accuracy and reducing diagnostic misclassification based on the extracted significant diabetes features. The proposed approach is an integration between the SVM technique and K-means clustering algorithms to diagnose diabetes disease. The authors in [22] suggested a model for the diagnosis of breast cancer based on integrating RBF neural network with ensemble features using the boosting method. The highest diagnosis accuracy achieved by the proposed model is 98.4%.
Most existing stacking-based research has a significant issue with the improper integration of the base- and meta-learners. To address this limitation, we proposed a hybrid level-1 meta-learner that integrates fuzzy clustering and logistic regression to classify the predictions from level-0 base-learners. As a result, this research presents a stacking-based ensemble learning approach for diabetes prediction, in which the hybrid meta-learner was used for model combination.
3 Ensemble Learning for Diabetes Prediction Based on Hybrid Meta-Classifier of Fuzzy Clustering and Logistic Regression
The ensemble learning model is a well-known approach for improving performance by combining a group of classifiers [23,24]. This section explains the proposed approach for diabetes prediction, which consists of two levels. First, a base-learner comprising six machine learning algorithms is utilized for predicting diabetes. Second, a hybrid meta-learner that combines fuzzy clustering and logistic regression is employed to appropriately integrate predictions from the base-learners and to provide the final prediction of diabetes. The hybrid meta-learner generates highly significant clusters of predictions from the base-learners using the FCM algorithm, and then outputs the final diabetes prediction result by employing the predictions of the base-learners and their clusters resulting from FCM as inputs to the LR algorithm. Fig. 1 shows the proposed approach for the prediction of diabetes.
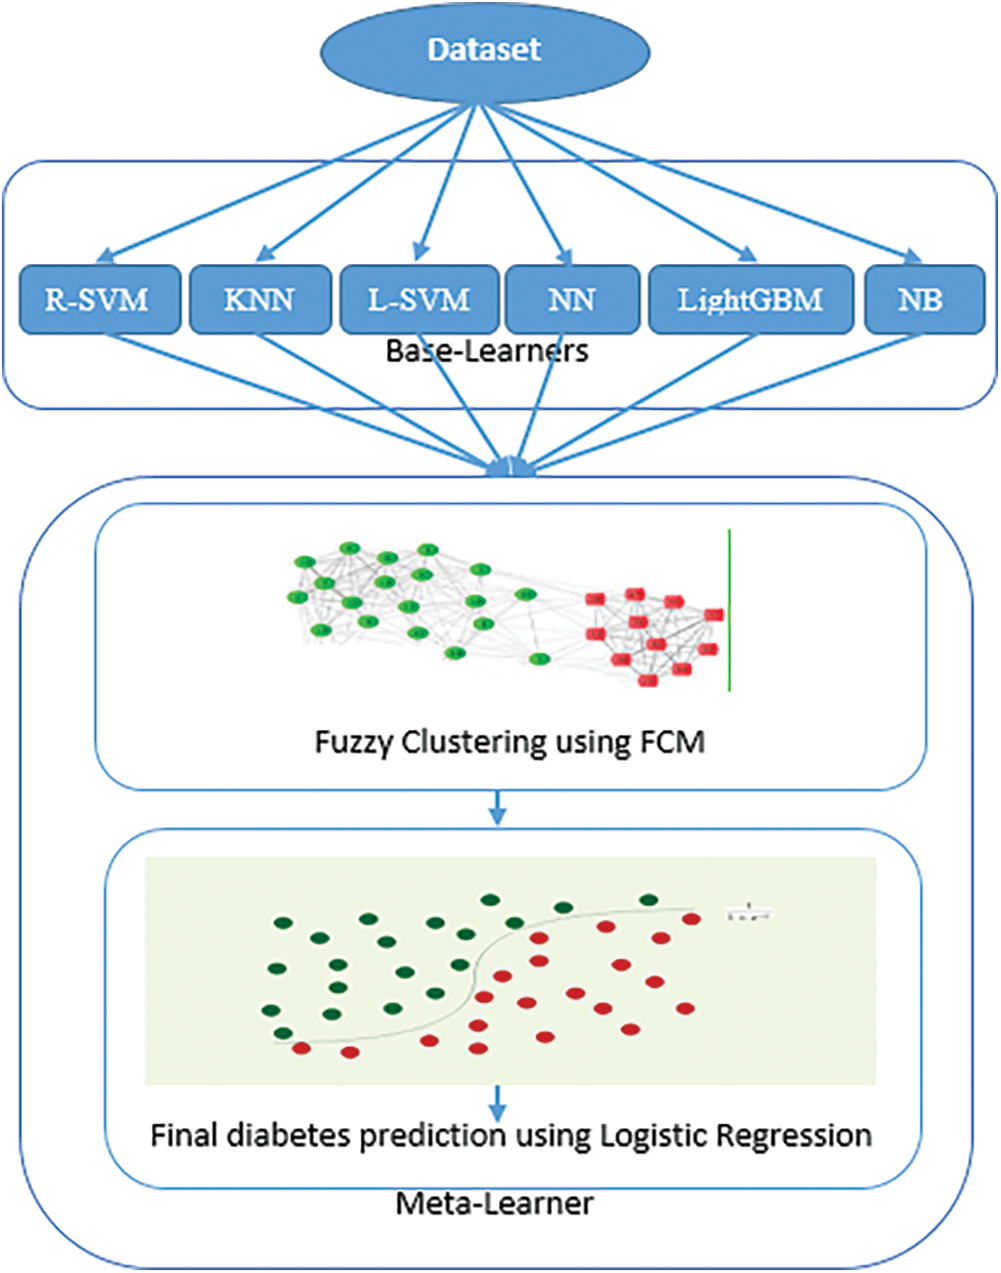
Figure 1: The proposed approach for diabetes prediction
The overall process flow of the proposed approach is shown in Fig. 1 and summarized in the following steps:
Step 1: The dataset is preprocessed by removing the lost and incorrect values due to errors or deregulation, and then it is then divided into training and testing sets using the 5-fold cross-validation technique.
Step 2: The base learners (KNN, radial SVM, NB, linear SVM, NN and LightGBM) are trained and tested using the training and testing sets.
Step 3: FCM algorithm is utilized to cluster the prediction probabilities generated by the base learners.
Step 4: The Logistic Regression algorithm takes the prediction probabilities generated by the base learners and their clusters produced by the FCM as inputs, and provides the final diabetes prediction result.
3.1 Datasets and Data Preprocessing
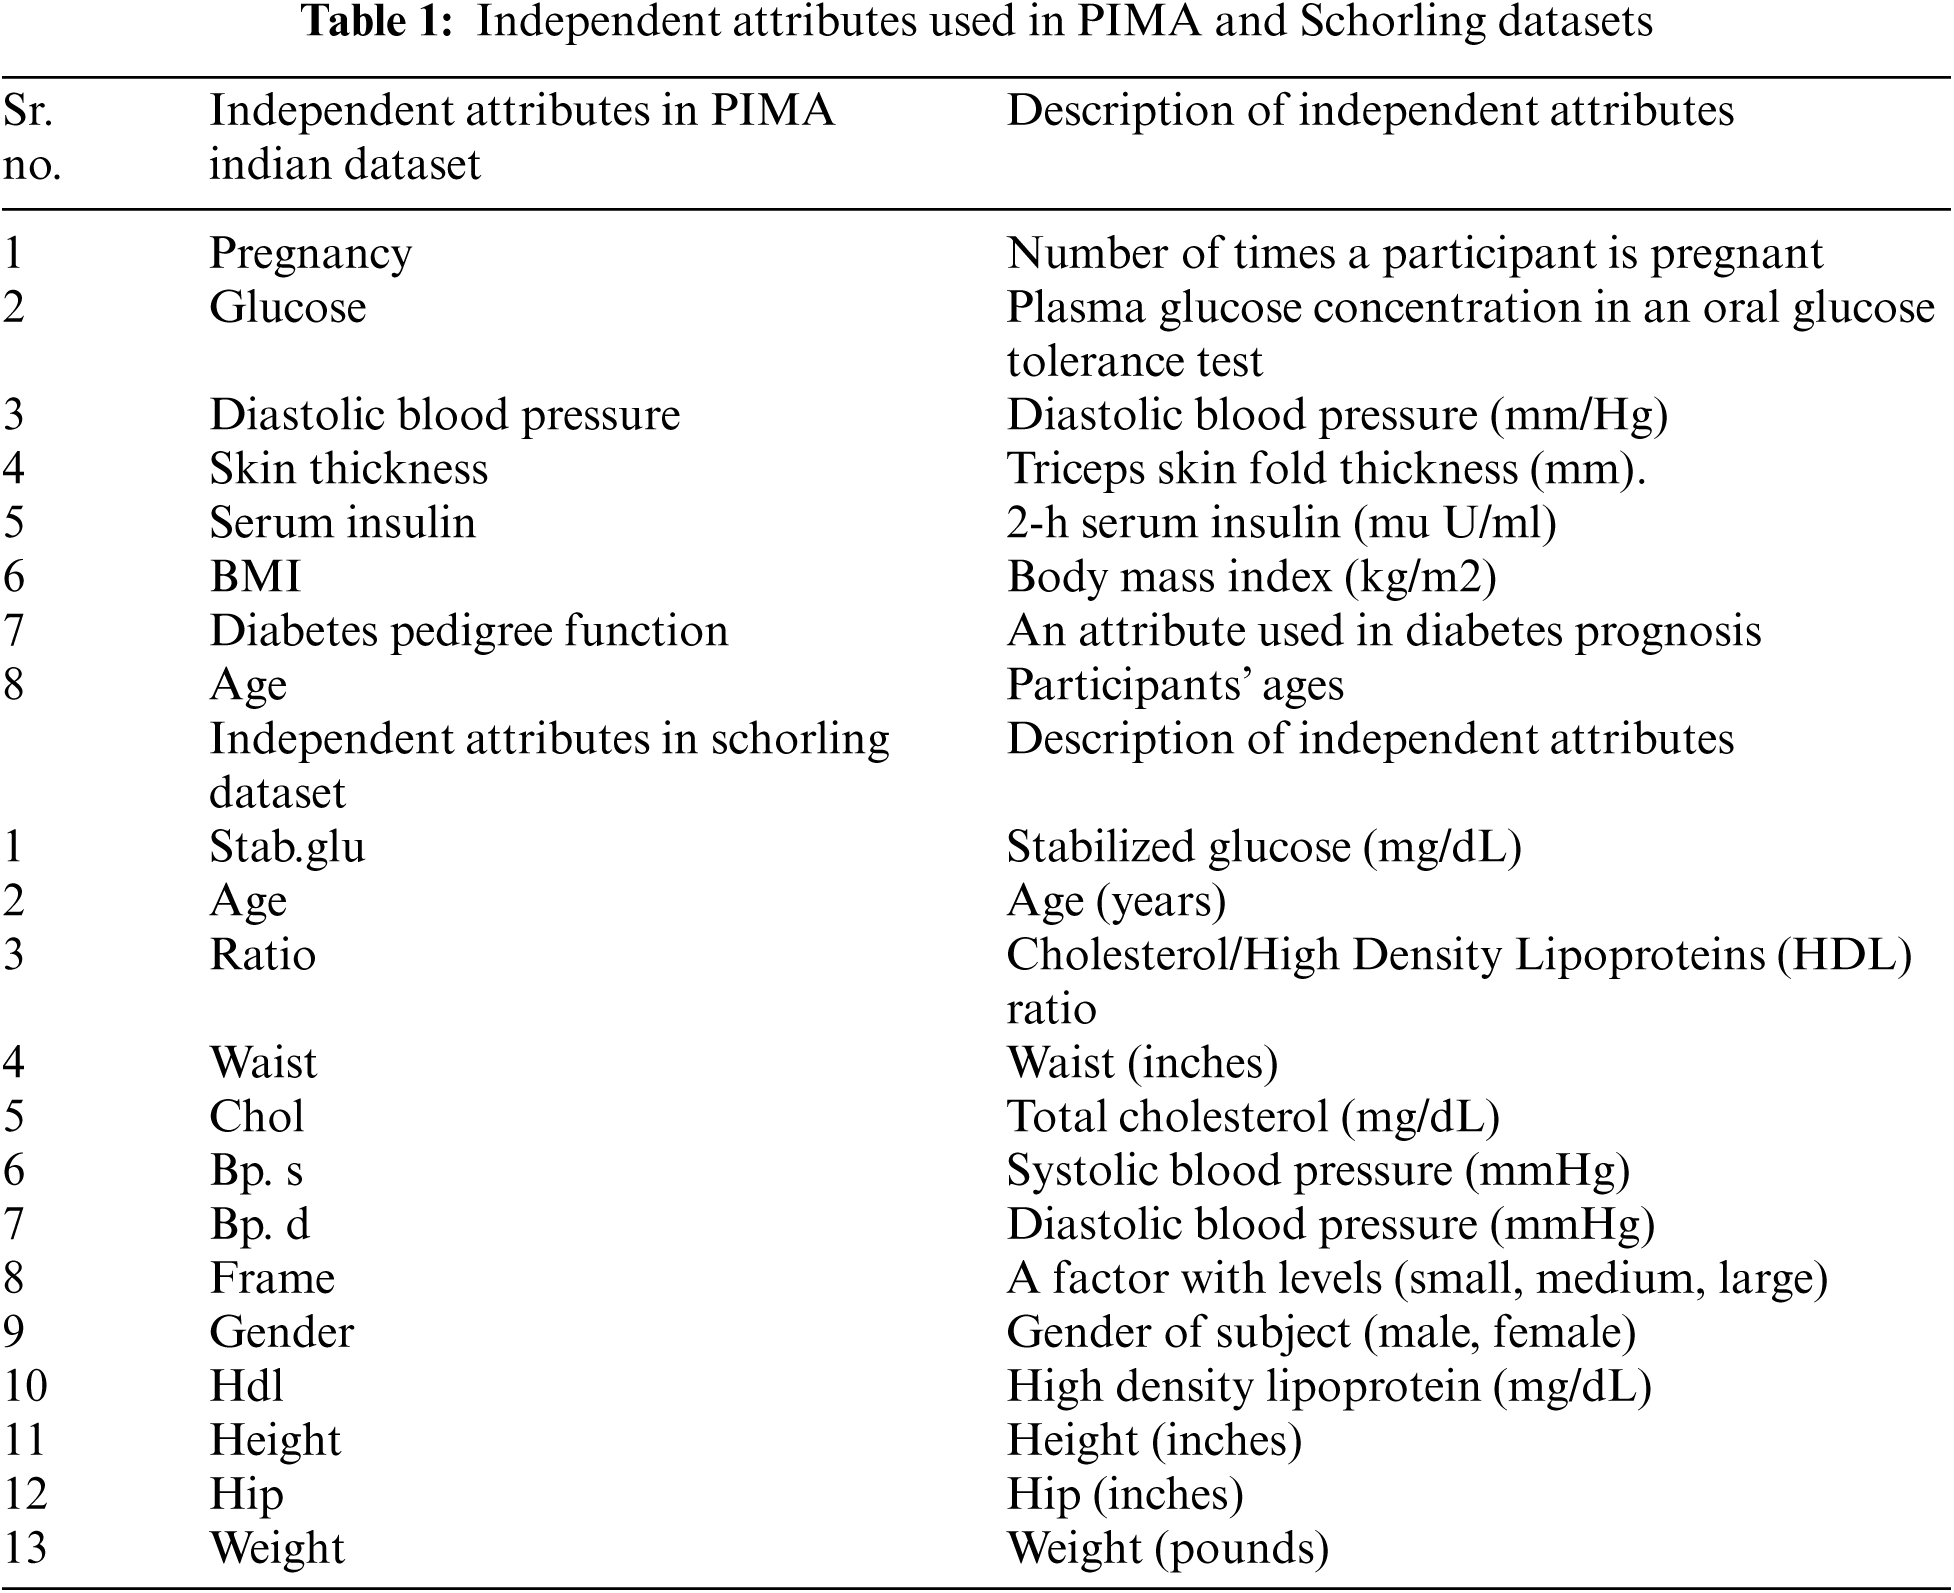
The proposed approach was implemented using the PIDD with type 2 diabetes from the University of California Irvine repository. Each dataset instance consists of class and eight features; the class indicates whether the patient has diabetes or not: the value of class “1” characterizes diabetic cases, and “0” characterizes nondiabetic cases. The features used in the dataset are the number pregnancies, plasma glucose concentration, diabetes pedigree function, triceps skin fold thickness, diastolic blood pressure, 2-h serum insulin, body max index, and age [25]. The accuracy of the data significantly affects the performance efficiency. This indicates that data preprocessing is critical to the success of the model [26]. The dataset was preprocessed by removing the lost and incorrect values due to errors or deregulation. The dataset contains 768 instances, 376 instances were deleted from the 768 in the PIDD dataset because they had one or more attributes with missing values. As a result of the data preparation, the PIDD dataset has a total of 392 instances. Among the 392 instances, 255 are non-diabetic, and the remaining 137 are diabetic cases. To ensure that the classification model was not simply fitted to the PIDD, the proposed hybrid ensemble approach was used to analyze Schorling Diabetes Dataset (SDD), a public diabetes dataset type 2 diabetes, donated by the Virginia School of Medicine [27]. The dataset includes data on 403 subjects who were interviewed as part of a study to determine the rate of diabetes, obesity, and other cardiovascular risk factors in central Virginia. Among the 403 instances, 330 are non-diabetic, and the remaining 73 are diabetic cases. In this study all the attributes from PIDD and SDD were used. Tab. 1 shows the independent attributes in the used datasets.
The K-fold cross-validation strategy is among the most widely used techniques for model selection and classifier error estimation [28]. The 5-fold cross-validation procedure was utilized in this research to split the dataset into training and testing sets. The 5-fold cross-validation is used in this research due to that 5-fold cross-validation generally performs quite well for middle size datasets [29]. In addition, Ayon et al. [30] applied both the five-fold and ten-fold cross-validation procedure on the same dataset and found that the model performed better using the five-fold procedure.
The dataset was split into five mutually exclusive subsamples of equal size. The proposed approach was trained five times. Each time, we used four folds for the training and left one fold for testing. This approach has the advantage of reducing the bias associated with random sampling [31].
Several studies have shown that the accuracy and variety of the base-learners influence the effectiveness of any ensemble of classifiers [32]. Thus, an ensemble of classifiers might enhance the accuracy of any of its base-learners if their errors are not coincident (are diverse) and they have a low error rate (are accurate).
To obtain the diversity, the proposed approach used heterogeneous base-learner model consists of six different machine learning algorithms. These algorithms were selected because they represent a wide variety of fields: neural networks, probabilistic models, statistical models, decision trees and ensemble learning. Moreover, the prediction models generated with these algorithms presented a good performance in several previous works.
The 5-fold cross-validation procedure was utilized to divide the dataset into five training and testing subsets, which increases the diversity of the input samples of the base learner. Then base learners, i.e., KNN, radial SVM, NB, linear SVM, NN and LightGBM take the five training and testing subsets as inputs and output the initial predictions of diabetes. The predictions of base-learners and their fuzzy clusters are then employed as inputs to the Logistic Regression (LR) algorithm, to achieve more generalized performance and reliability. LR algorithm generates the final diabetes prediction result.
Neural Networks:
The Artificial Neural Networks (ANN) technique is a well-known machine learning approach for dealing with complicated pattern-oriented problems in both categorization and time-series data types. An ANN algorithm has three major levels: the input layer, the hidden layer(s), and the output layer. By recognizing the intrinsic connections between different features, ANNs attempt to prepare a mapping between the input layer and the output layer. The hidden layer(s) analyses the information obtained from the input layer and then sends it to the output layer [33].
k-nearest neighbors
k-nearest neighbors (KNN) is a technique that uses a similarity measure such as distance functions to assign a new feature vector to a class in all possible cases. After determining the distance between the feature vector and all training samples, the new case is allocated to the class with the greatest probability.
Naive Bayes (NB)
NB is a classifier that is based on the Bayes theorem. It employs the concept of probability and implies that features are independent of each other [34]. Assume C is a class variable with n features. Then, according to Bayes’ theorem, the probability of an instance belonging to class C is given by Eq. (1).
where the value of instances for feature i is represented by ki. Each feature is presumed to be independent of the others.
The highest posterior of the classification variable is chosen using Eq. (2).
Support vector machine (SVM)
Decision hyperplanes are employed in SVM classification. In input space or high-dimensional space, these hyperplanes define the decision boundaries. SVM creates linear functions (hyperplanes) using labeled training samples in order to divide data into two groups (positive or negative). The samples closest to the hyperplanes are known as support vectors. The margin of the SVM is defined as the distance between the support vectors and hyperplanes. SVM aims to increase this margin as much as possible [35].
Light Gradient Boosting Machine (LightGBM)
LightGBM is a boosting approach for improving a model's performance by merging a group of weak classifiers into a strong classifier. The concept entails selecting weak classifiers in such a way that their performance is considerably enhanced when combined. Gradient boosting is what LightGBM is all about. It starts with decision trees as a weak learner and then uses gradient boosting to iteratively fit a sequence of trees. LightGBM is a decision tree-based model that is built leaf-by-leaf instead of depth-by-depth (as in other decision tree-based methods). As a result of this leaf-by-leaf generation, more complex trees are produced with greater accuracy [36]. LightGBM is a strong machine-learning approach that produces cutting-edge results in a wide range of practical problems. It is utilized in this research because it has the ability to strategically evaluate the previously constructed decision trees and construct new decision trees to enhance results. Therefore, it has the advantage of potentially improving the prediction accuracy.
3.3 Hybrid Meta-Classifier of Fuzzy Clustering and Logistic Regression
3.3.1 Fuzzy C-Means Clustering Algorithm
Clustering is an unsupervised machine learning approach for identifying natural groupings or patterns in a dataset. The clustering methods ensure that all of the allocated observations in a group or cluster are related. Clustering methods can also aid in the discovery of hidden information in the data [37]. As a result, combining base-learner predictions with their clusters can improve the hybrid meta-classification learner's performance and offer a more accurate diabetes prediction. Clustering methods divide the samples into distinct clusters so that samples inside a single cluster are more closely linked to one another than those allocated to dissimilar clusters [38]. The FCM algorithm is among the most widely used clustering algorithms, and it is a clustering method that allows a single piece of data to be assigned to two or more clusters. Dunn [39] introduced this method, which was later enhanced by Bezdek [40]. It is commonly employed for pattern recognition. In the FCM approach, each provided data item does not belong exclusively to a well-defined cluster, but it can be located in a middle way. Probability coefficients reflect this characteristic of belonging to more than one cluster.
The FCM is based on the objective function minimization described below:
where uij denotes the probability that person xi is part of the jth cluster, xi denotes the ith person, Cj denotes the coordinates of the cluster's jth center, || || denotes the Euclidean norm, N denotes the number of persons in the database, m presents the index of fuzziness (m = 2) and C denotes the total number of considered clusters. Fuzzy partitioning is accomplished by iterative optimization of the objective function, with membership uij and cluster centers Cj updated by
The probability coefficients reflect that a data item can belong to several clusters. Thus, person xi has a probability of uij being a member of cluster j considering that
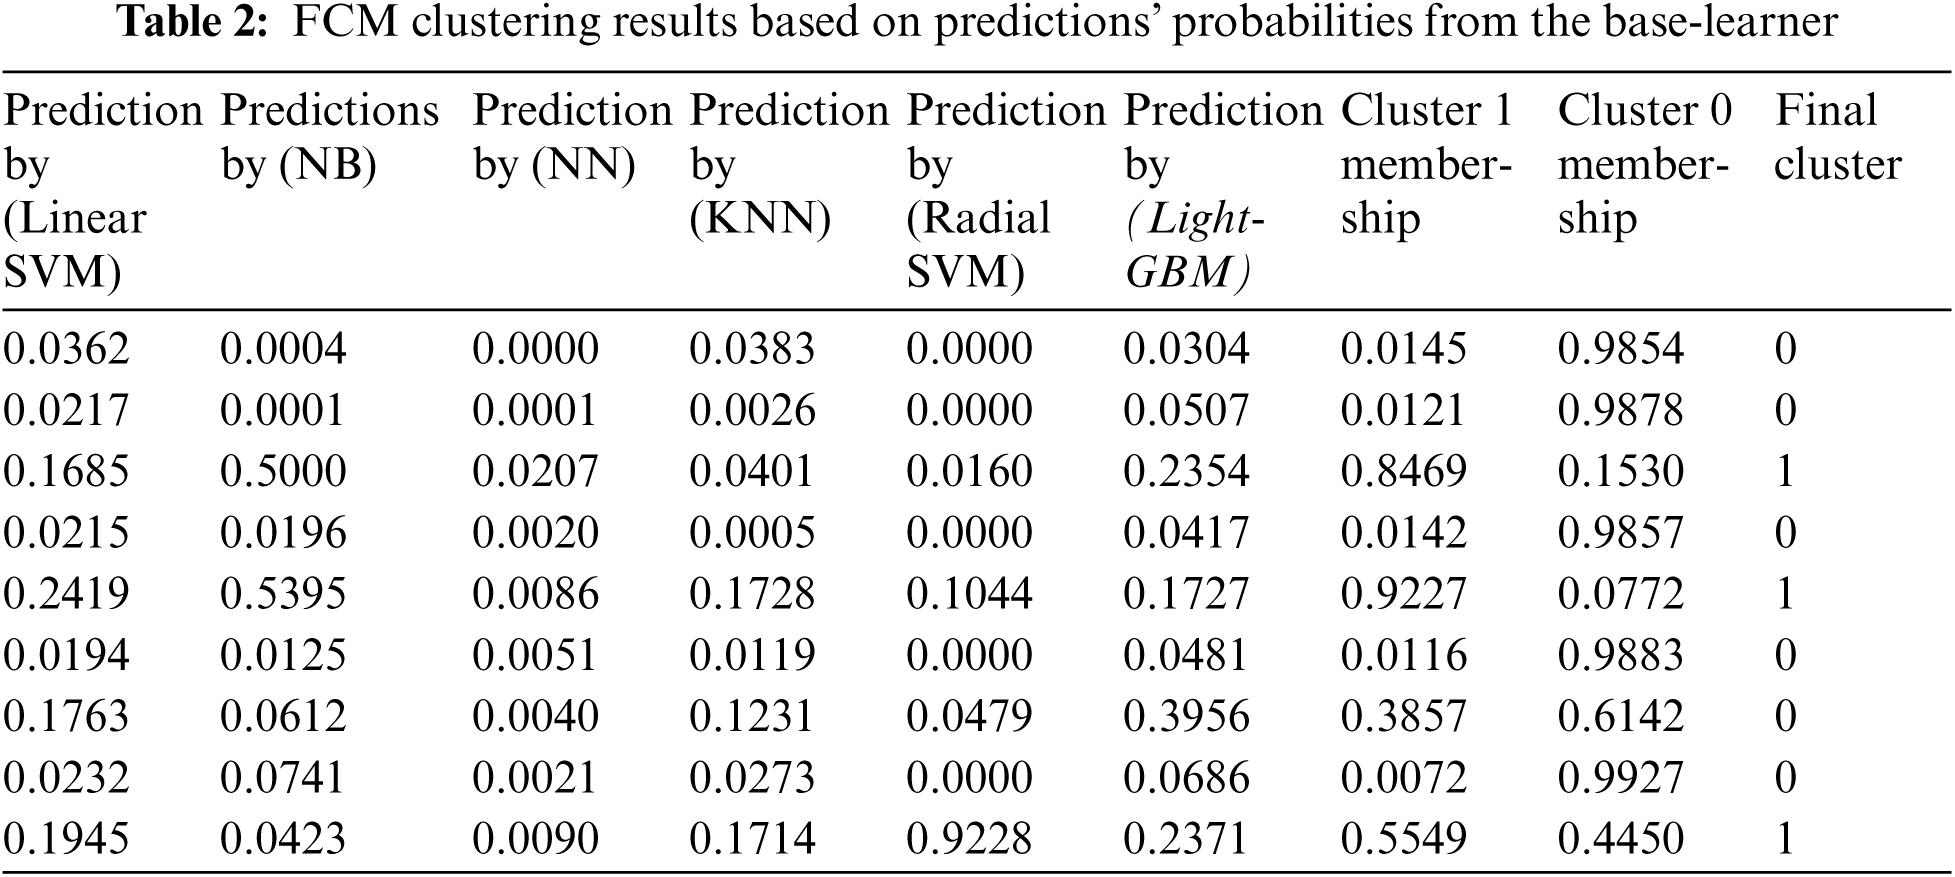
The FCM algorithm assists in the detection of hidden data. Therefore, integrating base-learner predictions with their clusters can increase the performance of the hybrid meta-classification learner and provide a more accurate diabetes prediction. FCM employed to obtain the membership values of the base-learner predictions’ probabilities to which of the two clusters (diabetic and non-diabetic) they belong. The prediction probability shares a similarity with each class or cluster is represented using membership functions whose value ranges between 0 and 1. In this paper, the membership function's value of the prediction probability for a class is computed using Eq. (4), based on an iterative measure of the distance between the prediction probability and the class center using Eq. (5). Membership function value close to zero indicates a low degree of similarity between the prediction probability and the class. While if the membership function value is unity, it implies a high degree of similarity between the prediction probability and the class. Tab. 2 shows examples for the FCM clusters’ results and prediction probabilities from the base-learners. These membership values are then used with the predictions’ probabilities from the base-learner in the second stage of the proposed approach, as additional informative features to improve the classification process completed by LR classifier. which utilized as the input data to the logistics regression (LR) classifier.
The classification method aims to create a model capable of assigning data elements to a specific class based on the current data. It was used to derive important elements from the model or forecast the data trend. Usually, the dependent variable of the logistic regression algorithm is binary classification. In other words, the logistic regression method is often employed to solve two-category problems. The primary objective of our experiment is to predict whether an individual has diabetes, and this is a classic binary classification issue.
We selected logistic regression for our research from several supervised machine learning techniques. Logistic regression is a well-established technique that produces simple-to-understand models that have been demonstrated to be successful in a variety of situations and cases [41]. Additionally, logarithmic regression returns the probability of an instance being belongs to class rather than a label, which provides additional insight into the prediction.
The logistic regression method is built on a linear regression model, which is explained in Eq. (7)
The classification issue is similar to the linear regression issue. Only continuous values can be predicted using a linear regression. As the predictive value of the classification problem can only be 0 or 1, we can establish a critical point. If the value exceeds the threshold, 1 is returned; otherwise, 0 is returned. Logistic regression is a type of regression model in which the prediction scope is reduced, and the prediction score is limited to [0, 1]. Based on linear regression, logistic regression incorporates a sigmoid function level (non-linearity). Initially, the attributes are linearly added together before being predicted using the sigmoid function. The key formulas of the logistic regression algorithm are shown in Eqs. (8)–(10).
There are two classes in this research: diabetic and nondiabetic. The letter Y denotes that the person has diabetes. The features in the datasets are represented by X independent variables. Each dependent variable X is associated with the coefficient value
In this research, the prediction probabilities from the base learners (KNN, radial SVM, NB, linear SVM, NN and LightGBM) and their clusters generated by the Fuzzy C-means algorithm, were utilized as input to the Logistic regression algorithm, to get the final diabetes prediction result.
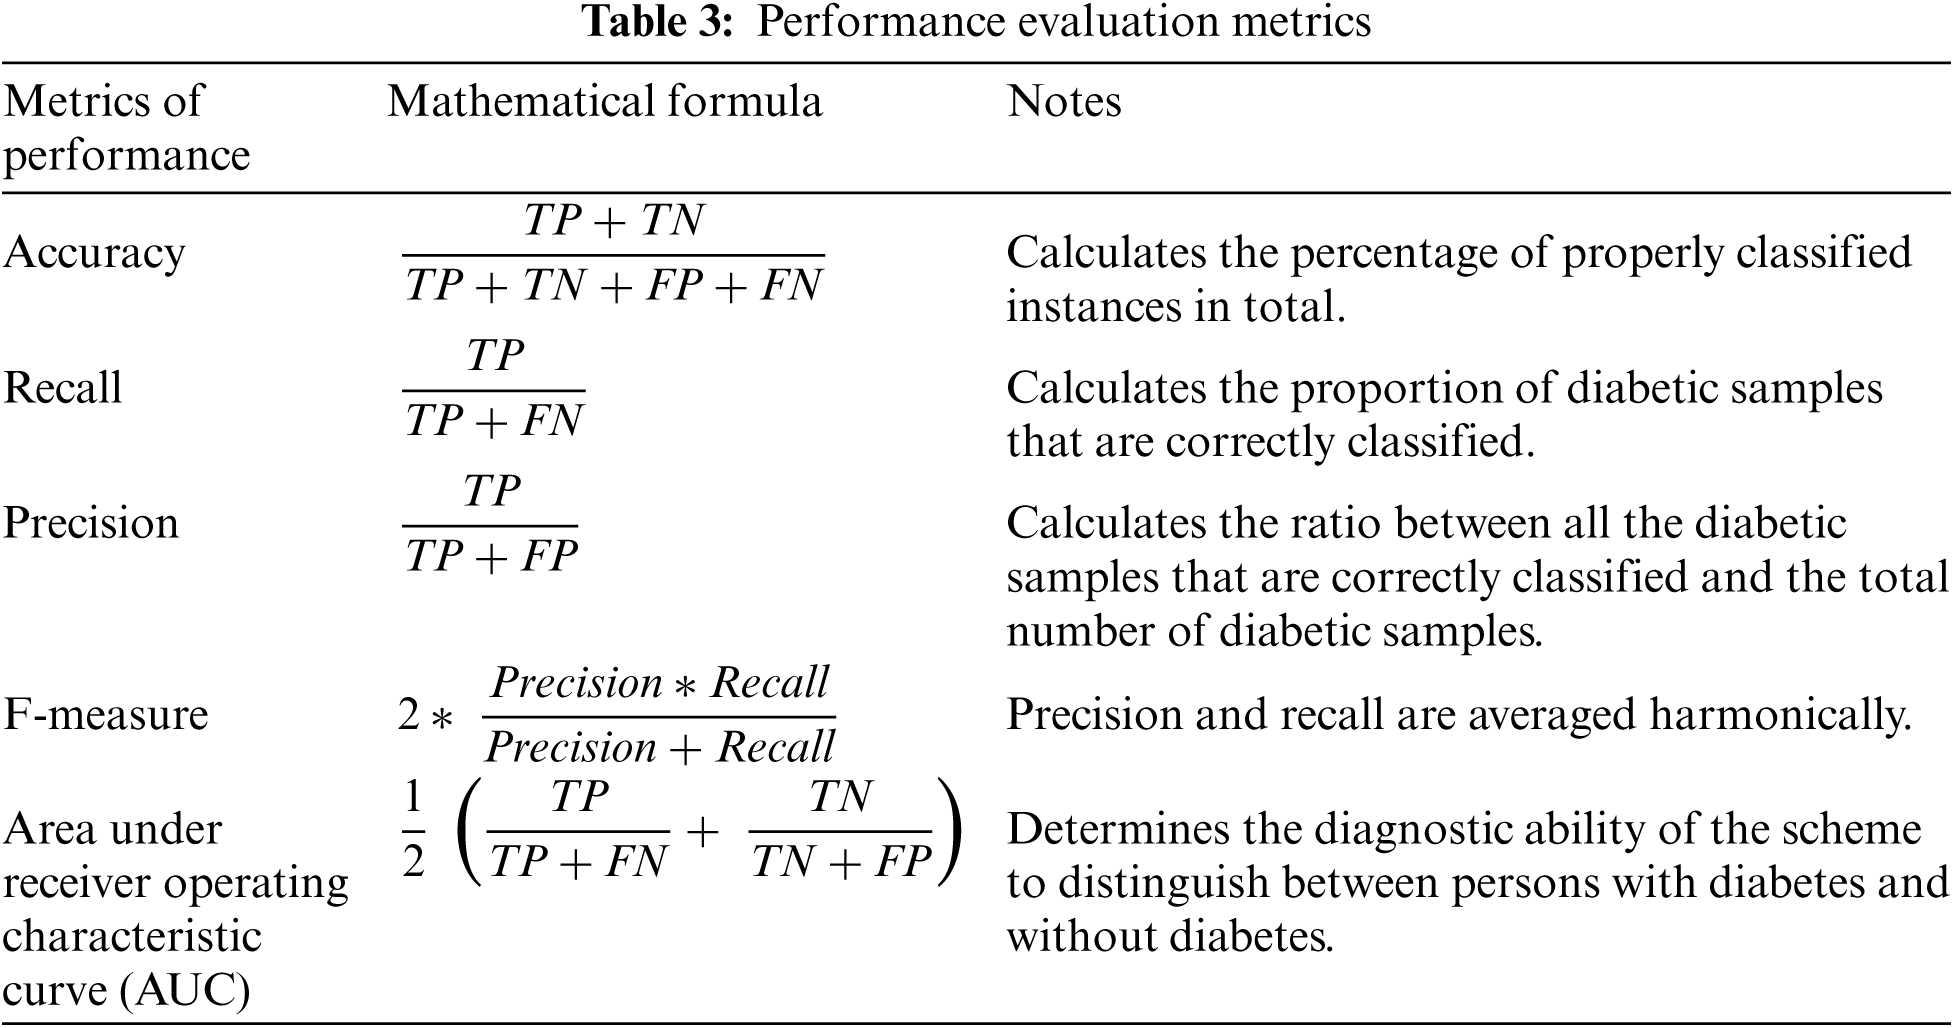
In our experiments, we evaluated the classification efficiency of the proposed hybrid ensemble scheme and comparison models using five performance assessment measures: accuracy, recall, precision, f1-measure, and AUC. These measures were determined as shown in Tab. 3.
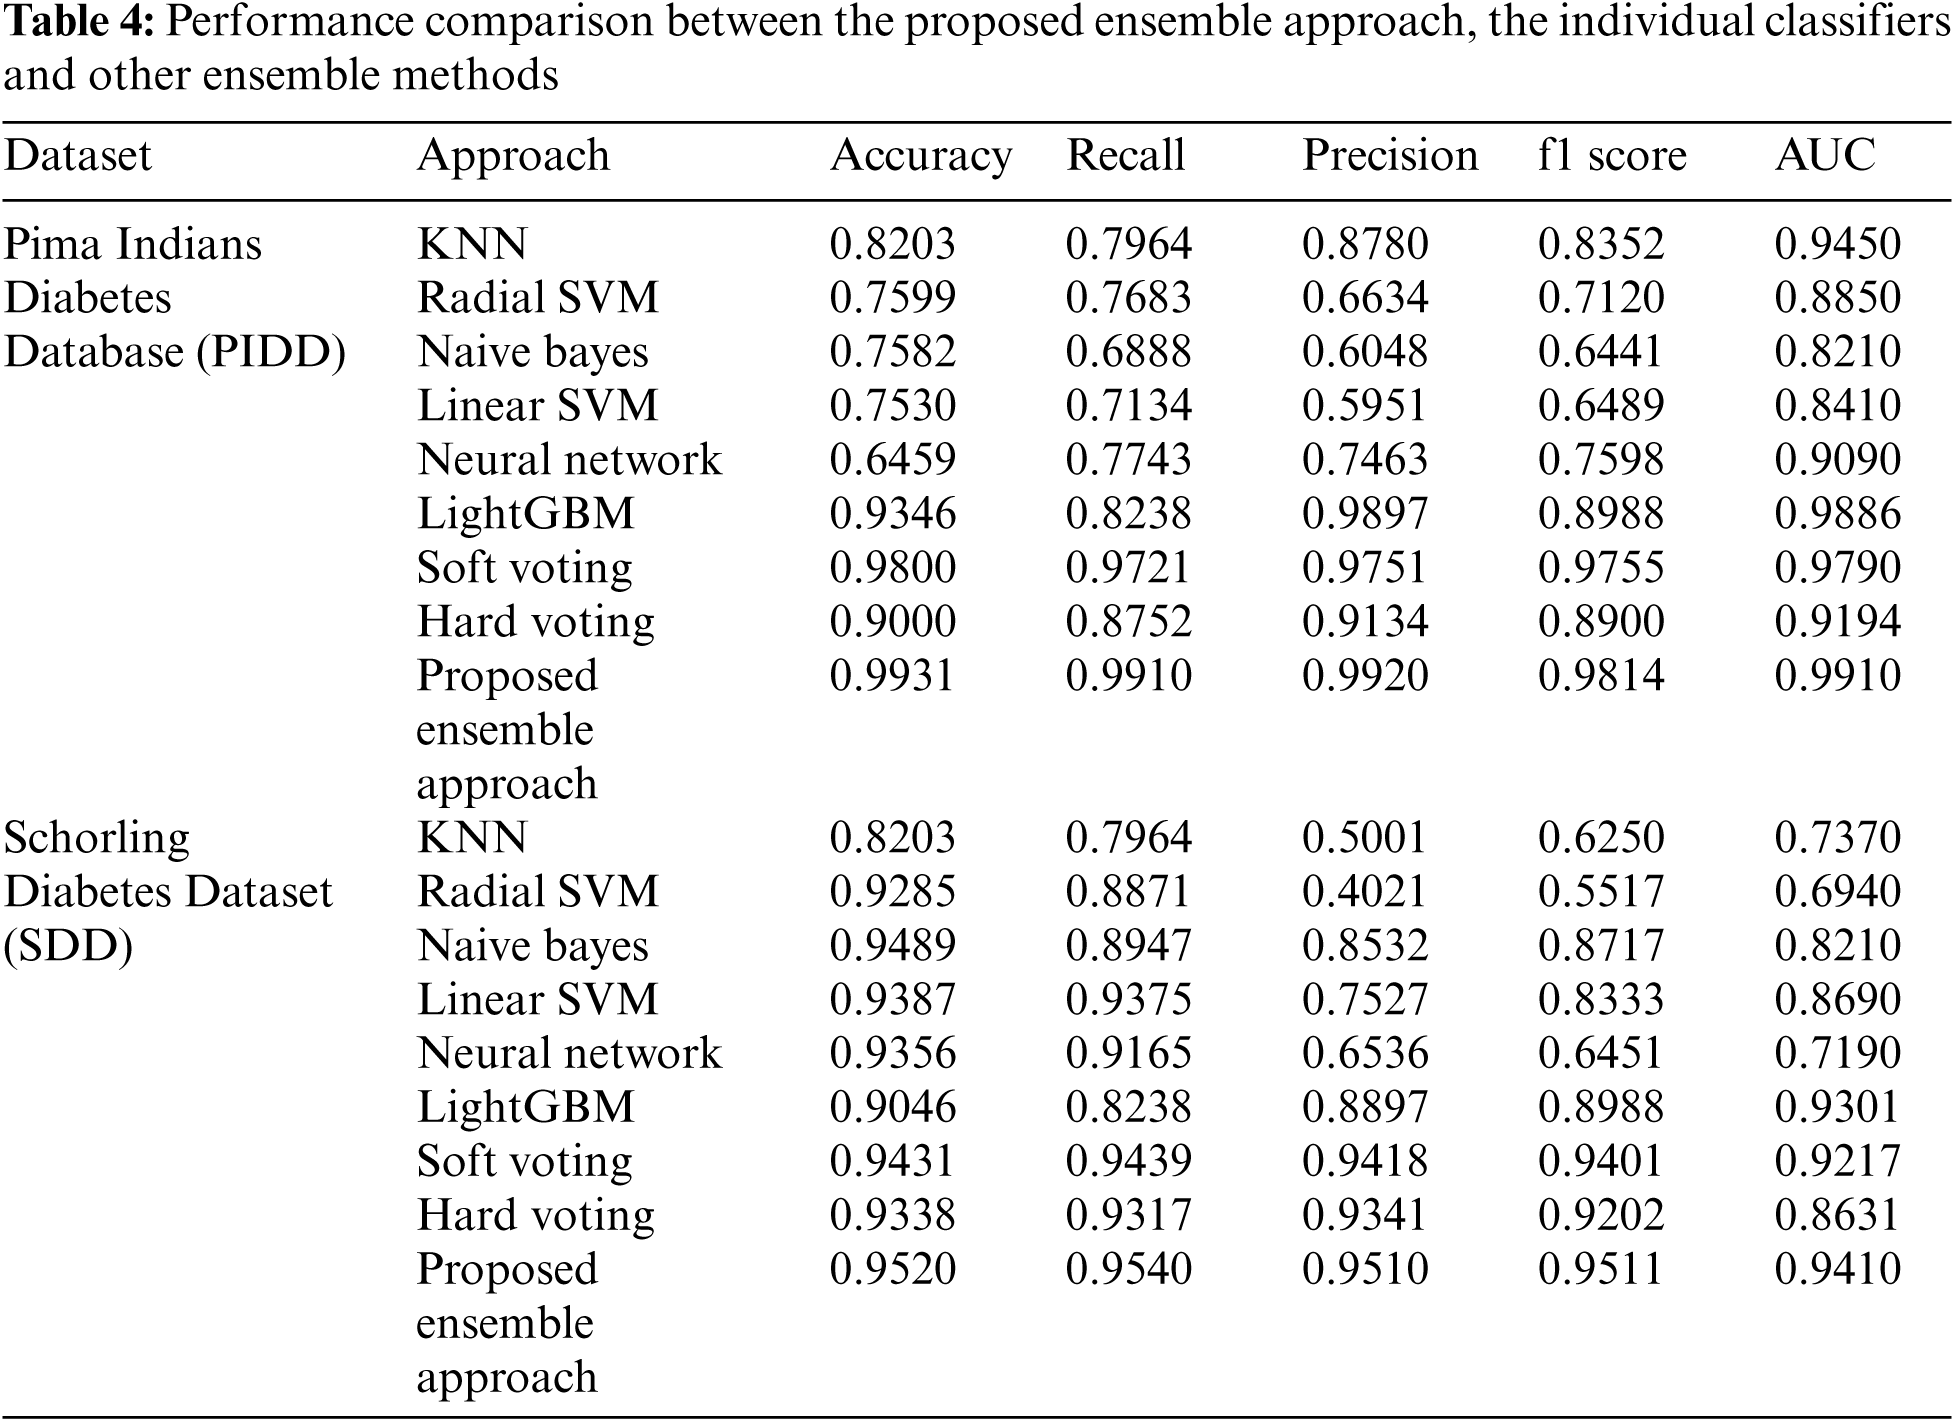
Our proposed ensemble approach outperformed all the base-learner algorithms with the PIDD dataset, and achieved the highest accuracy value of 99%, followed by the soft voting ensemble method (98%), LightGBM classifier (93.46%), and hard voting ensemble method (90%). The worst accuracies were shown by NN (64.59%) and linear SVM (75.30%). In recall terms, the proposed approach achieved the highest value of 99%, followed by the soft voting ensemble method (97.21%) and LightGBM (82.38%). In precision terms, the suggested approach attained the highest value of 99%, followed by LightGBM (98.97%) and soft voting ensemble (97.51%). The proposed approach also achieved an average f-measure of 98%, outperforming the soft voting ensemble (97.55%) and the LightGBM classifier (89.88%).
Using the SDD, the proposed approach also outperformed all the base-learner algorithms and other ensemble methods. The proposed approach achieved the highest accuracy value of 95.20%, followed by the NB classifier (94.89%), the soft voting ensemble method (94.31%), and the hard voting ensemble method (93.38%). In recall terms, the proposed approach achieved the highest value of 95.40%, followed by the soft voting ensemble method (94.39), and the linear SVM classifier (93.75%). In precision terms, the suggested approach attained the highest value of 95.10%, followed by the soft voting ensemble (94.18%) and hard voting ensemble (93.41%). The proposed approach also achieved an average f-measure of 95.11%, outperforming the soft voting ensemble (94.01%) and hard voting ensemble (92.02%).
The promising and competitive performance results of the proposed approach demonstrate its superiority over traditional ensemble methods. The capability of the proposed approach to combine fuzzy clustering and logistic regression enables it to appropriately integrate the predictions from base-learners and provide a more accurate prediction of diabetes. As a result, the proposed hybrid approach outperforms the six individual classifiers and two ensemble approaches in terms of classification efficiency, as shown in Tab. 4.
The AUC was generated for both the individual and ensemble classifiers to demonstrate the separation and discrimination capabilities of the models and to compute their specificity and sensitivity at various class prediction score thresholds. In general, an AUC curve that is increasingly closer to the top-left corner demonstrates an improved classification efficiency. Fig. 2 shows that the proposed hybrid ensemble approach performs better than the six-base-learners and the other two ensemble methods.
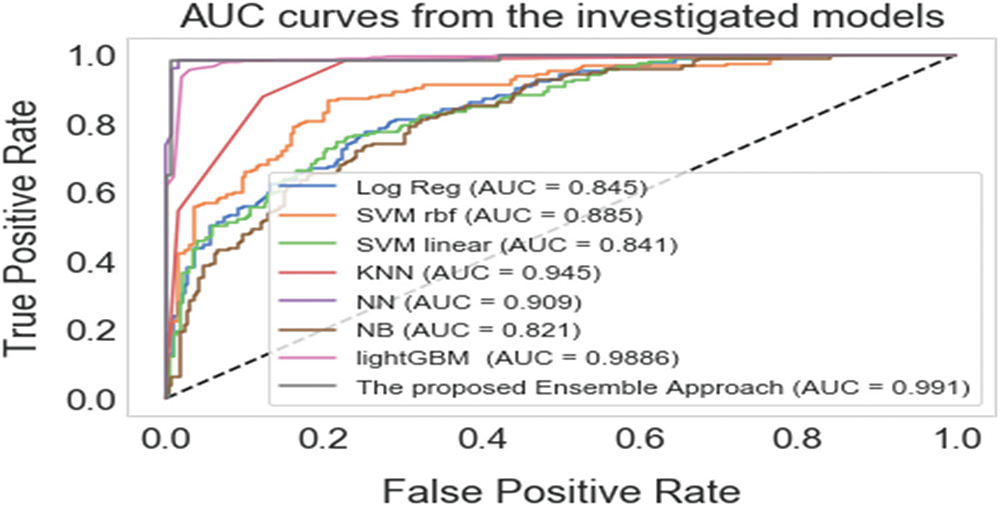
Figure 2: The areas under the receiver operating curves (AUCs) of the proposed ensemble approach and the individual classifiers
When combined, precision and recall are valuable metrics to use for unbalanced data; precision denotes the appropriateness of the result scale and its closeness to the anticipated solution, while recall denotes the number of related results. A high recall score indicates a low rate of false negatives, while a high precision score indicates a low rate of false positives. High precision and recall scores suggest that the classifier returns results accurately and retrieves the majority of positive results [42]. As a result, the precision-recall curve provides a comprehensive picture of the classifier's accuracy and is efficient even when the dataset is unbalanced [43]. Fig. 3 depicts the precision-recall curves for the proposed scheme and the other machine learning algorithms. The precision-recall curve of the proposed approach is positioned closest to the top-right corner of the graph, indicating that the proposed ensemble hybrid approach for diabetes prediction performed better than the rest of the approaches.
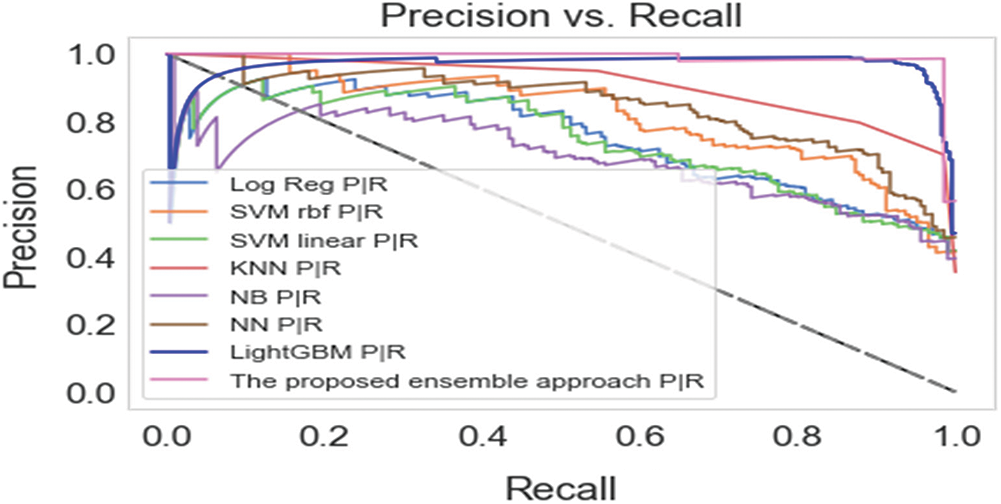
Figure 3: Precision-recall curves of the proposed approach and the base-learners
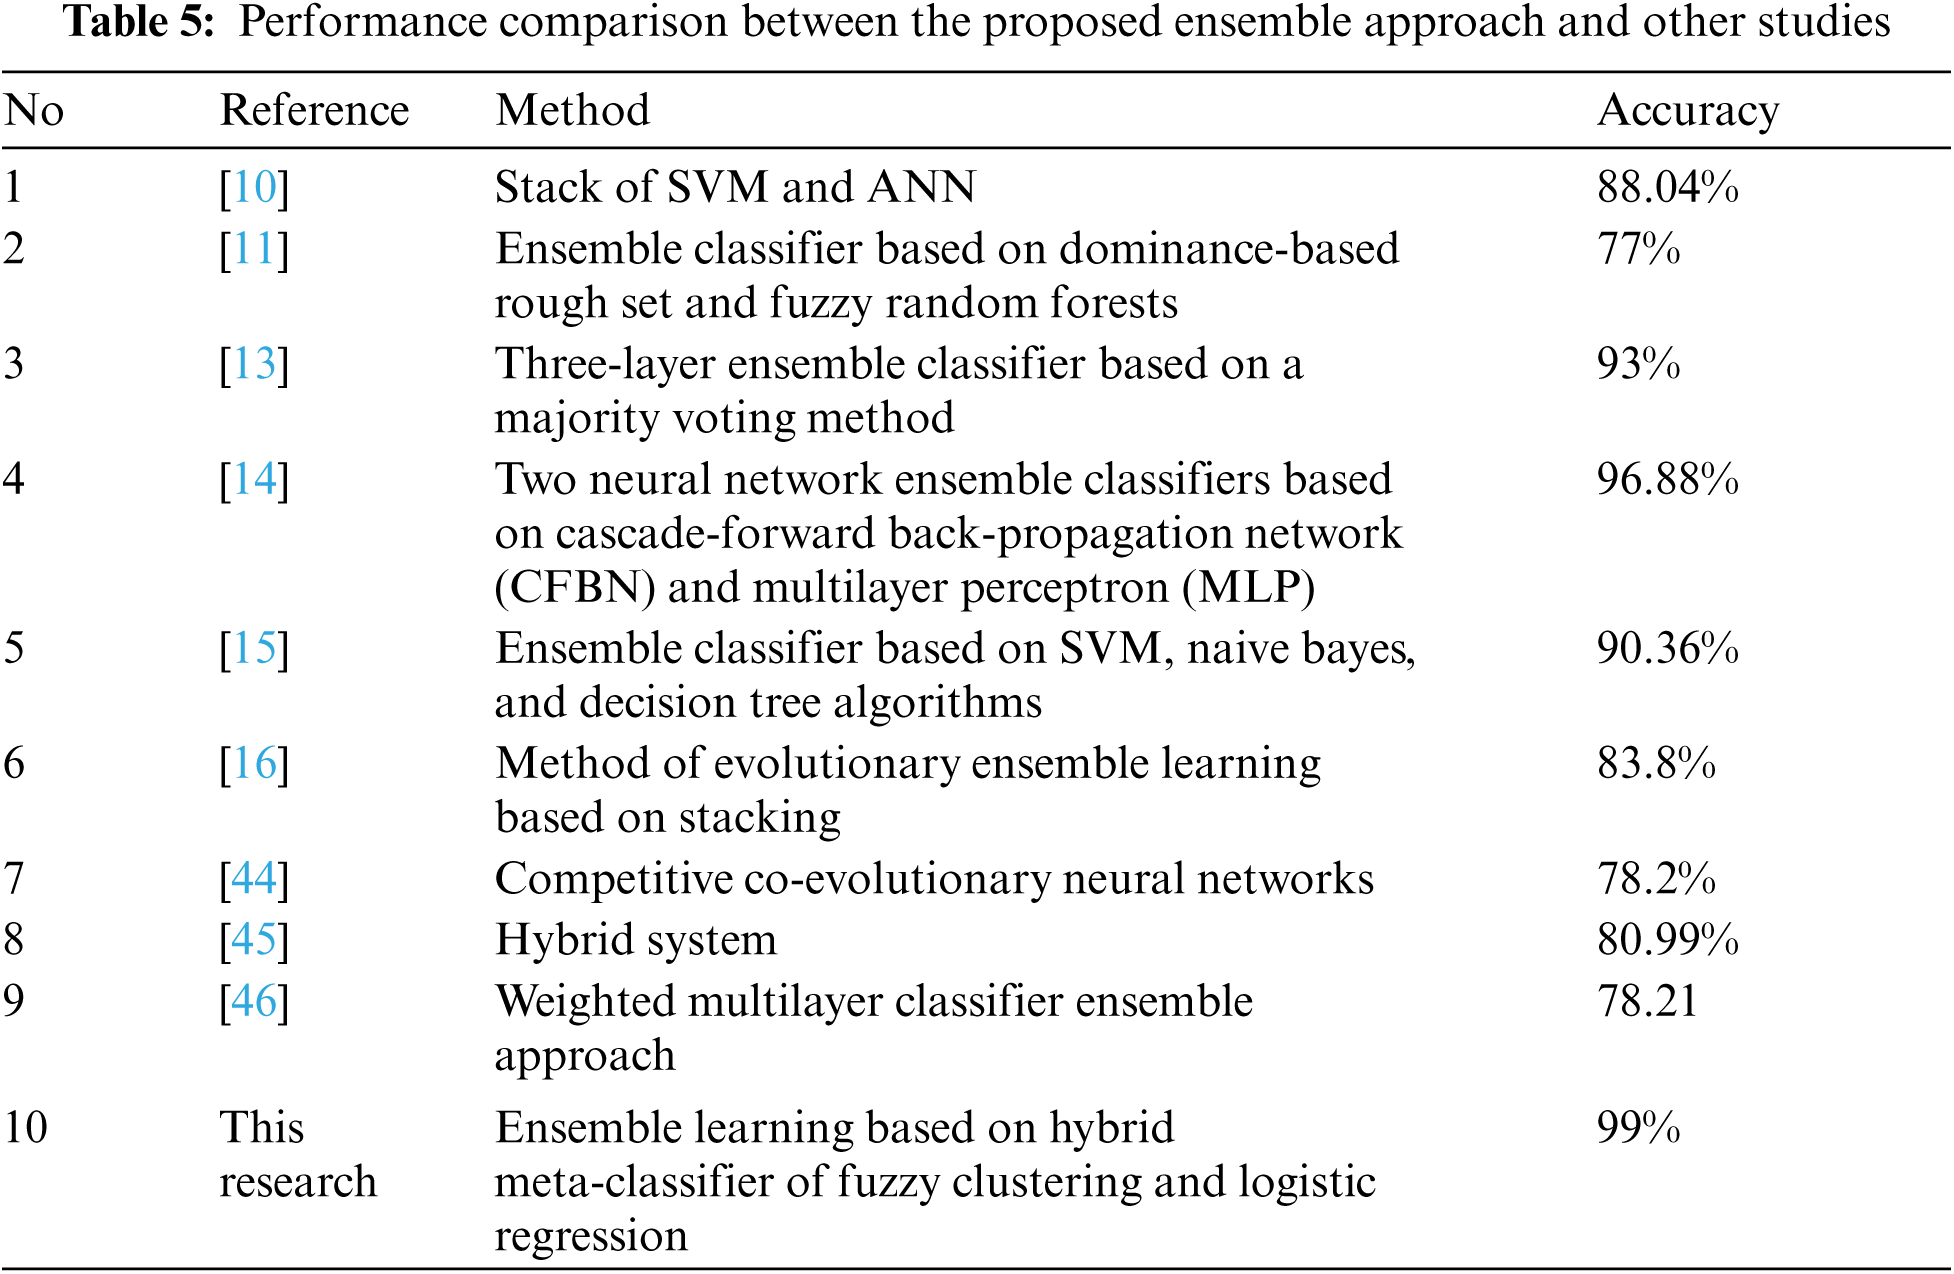
Moreover, we compared the performance of our proposed approach with experiments of other researchers using the same dataset PIDD to show that our proposed approach achieved a certain level of improvement. The proposed ensemble approach achieved an accuracy of 99%. The results of the other studies are listed in Tab. 5.
5 Conclusions and Recommendations
Diabetes mellitus refers to a group of metabolic disorders that are defined by persistently high blood glucose levels. Diabetes that remains undiagnosed may result in a variety of complications, including retinopathy, nephropathy, neuropathy, and other vascular disorders. This paper proposes a novel ensemble learning method for diabetes prediction that is based on a hybrid meta-classifier composed of fuzzy clustering and logistic regression. The proposed method is divided into two stages. The first stage is a base-learner, which consists of six machine learning algorithms for predicting diabetes. Second, a hybrid meta-learner is used to incorporate predictions from base-learners to provide the final prediction of diabetes. The hybrid meta-learner employs the FCM algorithm to generate highly significant clusters of predictions from base-learners. The predictions of the base-learner and their fuzzy clusters are then employed as inputs to the LR algorithm, which generates the final diabetes prediction result. Experiments were performed using two publicly available diabetes datasets to demonstrate the effectiveness of the proposed method for predicting diabetes. Comparing the proposed approach to other approaches revealed that the proposed approach outperformed the others and achieved the highest prediction accuracies of 99% and 95.20% using the PIDD and SDD datasets, respectively. Future research will focus on effective approaches for weighting base classifiers according to cluster attributes. The limitation of this study is considering only one dataset, it is recommended to consider various category diabetes datasets that have different sizes, and include all the factors that may contribute to the development of diabetes mellitus.
Acknowledgement: The authors extend their appreciation to the Deputyship for Research & Innovation, Ministry of Education in Saudi Arabia “for funding this research work through the project number IFPHI-193-830-2020” and King Abdulaziz University, DSR, Jeddah, Saudi Arabia.
Funding Statement: The authors extend their appreciation to the Deputyship for Research & Innovation, Ministry of Education in Saudi Arabia “for funding this research work through the project number IFPHI-193-830-2020” and King Abdulaziz University, DSR, Jeddah, Saudi Arabia.
Conflicts of Interest: The authors declare that they have no conflicts of interest to report regarding the present study.
1. N. H. Cho, J. E. Shaw, S. Karuranga, Y. D. Huang, J. D. da Rocha Fernandes et al., “IDF diabetes atlas: Global estimates of diabetes prevalence for 2017 and projections for 2045,” Diabetes Research and Clinical Practice, vol. 138, no. 1, pp. 271–281, 2018. [Google Scholar]
2. M. Maniruzzaman, M. J. Rahman, B. Ahammed and M. M. Abedin, “Classification and prediction of diabetes disease using machine learning paradigm,” Health Information Science and Systems, vol. 8, no. 1, pp. 1–14, 2020. [Google Scholar]
3. B. A. Mateen, A. L. David and S. Denaxas, “Electronic health records to predict gestational diabetes risk,” Trends in Pharmacological Sciences, vol. 41, no. 5, pp. 301–304, 2020. [Google Scholar]
4. I. Kavakiotis, T. Olga, A. Salifoglou, N. Maglaveras, I. Vlahavas et al., “Machine learning and data mining methods in diabetes research,” Computational and Structural Biotechnology Journal, vol. 15, pp. 104–116, 2017. [Google Scholar]
5. A. Alharbi and M. Alghahtani, “Using genetic algorithm and ELM neural networks for feature extraction and classification of type 2-diabetes mellitus,” Applied Artificial Intelligence, vol. 33, no. 4, pp. 311–328, 2019. [Google Scholar]
6. L. I. Kuncheva, J. C. Bezdek and R. P. Duin, “Decision templates for multiple classifier fusion: An experimental comparison,” Pattern Recognition, vol. 34, no. 2, pp. 299–314, 2001. [Google Scholar]
7. P. Shunmugapriya and S. Kanmani, “Optimization of stacking ensemble configurations through artificial bee colony algorithm,” Swarm and Evolutionary Computation, vol. 12, no. 1, pp. 24–32, 2013. [Google Scholar]
8. Y. Chen, M. L. Wong and H. Li, “Applying ant colony optimization to configuring stacking ensembles for data mining, “ Expert Systems with Applications, vol. 41, no. 6, pp. 2688–2702, 2014. [Google Scholar]
9. D. S. Nascimento, A. L. Coelho and A. M. Canuto, “Integrating complementary techniques for promoting diversity in classifier ensembles: A systematic study,” Neurocomputing, vol. 138, no. 1, pp. 347–357, 2014. [Google Scholar]
10. R. Zolfaghari, “Diagnosis of diabetes in female population of pima Indian heritage with ensemble of bp neural network and svm,” International Journal of Computational Engineering & Management, vol. 15, no. 4, pp. 2230–7893, 2012. [Google Scholar]
11. E. Saleh, J. Błaszczyński, A. Moreno, A. Valls, P. Romero-Aroca et al., “Learning ensemble classifiers for diabetic retinopathy assessment,” Artificial Intelligence in Medicine, vol. 85, no. 3, pp. 50–63, 2018. [Google Scholar]
12. R. Ali, M. H. Siddiqi, M. Idris, B. H. Kang and S. Lee, “Prediction of diabetes mellitus based on boosting ensemble modeling,” in Proc. of Int. Conf. on Ubiquitous Computing and Ambient Intelligence, Belfast, UK, pp. 25–28, 2014. [Google Scholar]
13. S. Bashir, U. Qamar, F. H. Khan and L. Naseem, “HMV: A medical decision support framework using multi-layer classifiers for disease prediction,” Journal of Computational Science, vol. 13, no. 1, pp. 10–25, 2016. [Google Scholar]
14. A. H. El-Baz, A. E. Hassanien and G. Schaefer, “Identification of diabetes disease using committees of neural network-based classifiers,” in Proc. Machine Intelligence and Big Data in Industry, Cham, Switzerland, pp. 65–74, 2016. [Google Scholar]
15. M. Alehegn, R. Joshi and P. Mulay, “Analysis and prediction of diabetes mellitus using machine learning algorithm,” International Journal of Pure and Applied Mathematics, vol. 118, no. 9, pp. 871–878, 2018. [Google Scholar]
16. N. Singh and P. Singh, “Stacking-based multi-objective evolutionary ensemble framework for prediction of diabetes mellitus,” Biocybernetics and Biomedical Engineering, vol. 40, no. 1, pp. 1–22, 2020. [Google Scholar]
17. M. Nilashi, O. Ibrahim, M. Dalvi, H. Ahmadi and L. Shahmoradi, “Accuracy improvement for diabetes disease classification: A case on a public medical dataset,” Fuzzy Information and Engineering, vol. 9, no. 9, pp. 345–357, 2017. [Google Scholar]
18. A. Onan, “Fuzzy-rough nearest neighbor classifier combined with consistency-based subset evaluation and instance selection for automated diagnosis of breast cancer,” Expert Systems with Applications, vol. 4, no. 20, pp. 6844–6852, 2015. [Google Scholar]
19. A. Onan, “Ensemble of classifiers and term weighting schemes for sentiment analysis in turkish,” Scientific Research Communications, vol. 1, no. 1, pp. 1–12, 2021. [Google Scholar]
20. A. Onan, “Hybrid supervised clustering based ensemble scheme for text classification,” Kybernetes, vol. 1, no. 1, pp. 330–348, 2017. [Google Scholar]
21. A. H. Osman and H. M. Aljahdali, “Diabetes disease diagnosis method based on feature extraction using K-sVM,” International Journal of Advanced Computer Science and Applications, vol. 8, no. 1, pp. 236–244, 2017. [Google Scholar]
22. A. H. Osman and H. M. Aljahdali, “An effective of ensemble boosting learning method for breast cancer virtual screening using neural network model,” IEEE Access, vol. 8, pp. 39165–39174, 2020. [Google Scholar]
23. B. Harangi, “Skin lesion classification with ensembles of deep convolutional neural networks,” Journal of Biomedical Informatics, vol. 86, no. 1, pp. 25–32, 2018. [Google Scholar]
24. S. L. Hsieh, S. H. Hsieh, P. H. Cheng, C. H. Chen, K. P. Hsu et al., “Design ensemble machine learning model for breast cancer diagnosis,” Journal of Medical Systems, vol. 36, no. 5, pp. 2841–2847, 2012. [Google Scholar]
25. C. Blake, “UCI repository of machine learning databases,” 1998. [Online]. Available: http://archive.ics.uci.edu/ml/index.php. [Google Scholar]
26. K. M. Orabi, Y. M. Kamal and T. M. Rabah, “Early predictive system for diabetes mellitus disease,” in Proc. Industrial Conf. on Data Mining, Cham, Switzerland, pp. 420–427, 2016. [Google Scholar]
27. J. P. Willems, J. T. Saunders, D. E. Hunt and J. B. Schorling, “Prevalence of coronary heart disease risk factors among rural blacks: A community-based study,” Southern Medical Journal, vol. 90, no. 8, pp. 814–820, 1997. [Google Scholar]
28. S. Arlot and A. Celisse, “A survey of cross-validation procedures for model selection,” Statistics Surveys, vol. 4, no. 1, pp. 40–79, 2010. [Google Scholar]
29. C. Y. Ma, S. Y. Yang, H. Zhang, M. L. Xiang, Q. Huang et al., “Prediction models of human plasma protein binding rate and oral bioavailability derived by using GA–CG–SVM method,” Journal of Pharmaceutical and Biomedical Analysis, vol. 47, no. 4–5, pp. 677–682, 2008. [Google Scholar]
30. S. I. Ayon and M. Islam, “Diabetes prediction: A deep learning approach, “International Journal of Information Engineering & Electronic Business, vol. 11, pp. 21–7, 2019. [Google Scholar]
31. T. G. Dietterich, “An experimental comparison of three methods for constructing ensembles of decision trees: Bagging, boosting, and randomization,” Machine Learning, vol. 40, no. 2, pp. 139–157, 2000. [Google Scholar]
32. H. Wu, S. Yang, Z. Huang, J. He and X. Wang, “Type 2 diabetes mellitus prediction model based on data mining,” Informatics in Medicine Unlocked, vol. 10, no. 1, pp. 100–107, 2018. [Google Scholar]
33. G. S. Fesghandis, A. Pooya, M. Kazemi and Z. N. Azimi, “Comparison of multilayer perceptron and radial basis function neural networks in predicting the success of new product development,” Engineering, Technology & Applied Science Research, vol. 7, no. 1, pp. 1425–1428, 2017. [Google Scholar]
34. Z. Zhang, Q. Zhu and Y. Xie, “A novel image matting approach based on naive Bayes classifier,” in Proc. Int. Conf. on Intelligent Computing, Springer, Berlin, Heidelberg, pp. 433–441, 2012. [Google Scholar]
35. F. F. Chamasemani and Y. P. Singh, “Multi-class support vector machine (SVM) classifiers--an application in hypothyroid detection and classification,” in Proc. 2011 Sixth Int. Conf. on Bio-Inspired Computing: Theories and Applications, Penang, Malaysia, IEEE, pp. 351–356, 2011. [Google Scholar]
36. G. Ke, Q. Meng, T. Finley, T. Wang, W. Chen et al., “LightGBM: A highly efficient gradient boosting decision tree, “ in Proc. 31st Annual Conference on Neural Information Processing Systems, California, USA, pp. 3146–3154, 2017. [Google Scholar]
37. F. Franceschi, M. Cobo and M. Figueredo, “Discovering relationships and forecasting PM10 and PM2. 5 concentrations in bogotá, Colombia, using artificial neural networks, principal component analysis, and k-means clustering,” Atmospheric Pollution Research, vol. 9, no. 5, pp. 912–922, 2018. [Google Scholar]
38. G. Gan, C. Ma and J. Wu, “Fuzzy clustering algorithms,” in Data Clustering: Theory, Algorithms, and Applications, 2nd ed., vol. 1. Philadelphia, USA: Society for Industrial and Applied Mathematics, pp. 152–159, 2020. [Google Scholar]
39. J. C. Dunn, “A fuzzy relative of the ISODATA process and its use in detecting compact well-separated clusters,” Journal of Cybernetics, vol. 3, pp. 32–57, 1973. [Google Scholar]
40. J. C. Bezdek, “Pattern recognition with fuzzy objective function algorithms,” Springer Science & Business Media, 2013. [Google Scholar]
41. M. Zhu and M. Gribskov, “Mipepid: MicroPeptide identification tool using machine learning,” BMC Bioinformatics, vol. 20, no. 1, pp. 1–11, 2019. [Google Scholar]
42. M. A. Al-Shabi, “Credit card fraud detection using autoencoder model in unbalanced datasets,” Journal of Advances in Mathematics and Computer Science, vol. 33, no. 5, pp. 1–16, 2019. [Google Scholar]
43. J. Davis and M. Goadrich, “The relationship between precision-recall and ROC curves,” in Proc. The 23rd Int. Conf. on Machine Learning, Pennsylvania, USA, pp. 233–240, 2006. [Google Scholar]
44. B. Y. Hiew, S. C. Tan and W. S. Lim, “A double-elimination-tournament-based competitive co-evolutionary artificial neural network classifier,” Neurocomputing, vol. 249, no. 2, pp. 345–356, 2017. [Google Scholar]
45. M. R. Nalluri and D. S. Roy, “Hybrid disease diagnosis using multiobjective optimization with evolutionary parameter optimization,” Journal of Healthcare Engineering, vol. 1, pp. 1–27, 2017. [Google Scholar]
46. S. Bashir, U. Qamar and F. H. Khan, “Intellihealth: A medical decision support application using a novel weighted multi-layer classifier ensemble framework,” Journal of Biomedical Informatics, vol. 59, no. 2, pp. 185–200, 2016. [Google Scholar]
 | This work is licensed under a Creative Commons Attribution 4.0 International License, which permits unrestricted use, distribution, and reproduction in any medium, provided the original work is properly cited. |