DOI:10.32604/cmc.2022.024145
| Computers, Materials & Continua DOI:10.32604/cmc.2022.024145 | |
| Article |
Coronavirus Detection Using Two Step-AS Clustering and Ensemble Neural Network Model
Department of Information System, Faculty of Computing and Information Technology King Abdulaziz University Rabigh, Saudi Arabia
*Corresponding Author: Ahmed Hamza Osman. Email: ahoahmad@kau.edu.sa
Received: 06 October 2021; Accepted: 15 December 2021
Abstract: This study presents a model of computer-aided intelligence capable of automatically detecting positive COVID-19 instances for use in regular medical applications. The proposed model is based on an Ensemble boosting Neural Network architecture and can automatically detect discriminatory features on chest X-ray images through Two Step-As clustering algorithm with rich filter families, abstraction and weight-sharing properties. In contrast to the generally used transformational learning approach, the proposed model was trained before and after clustering. The compilation procedure divides the datasets samples and categories into numerous sub-samples and subcategories and then assigns new group labels to each new group, with each subject group displayed as a distinct category. The retrieved characteristics discriminant cases were used to feed the Multiple Neural Network method, which was then utilised to classify the instances. The Two Step-AS clustering method has been modified by pre-aggregating the dataset before applying Multiple Neural Network algorithm to detect COVID-19 cases from chest X-ray findings. Models for Multiple Neural Network and Two Step-As clustering algorithms were optimised by utilising Ensemble Bootstrap Aggregating algorithm to reduce the number of hyper parameters they include. The tests were carried out using the COVID-19 public radiology database, and a cross-validation method ensured accuracy. The proposed classifier with an accuracy of 98.02% percent was found to provide the most efficient outcomes possible. The result is a low-cost, quick and reliable intelligence tool for detecting COVID-19 infection.
Keywords: Two step-AS clustering; ensemble learning; bootstrap aggregating; multiple neural network; covid-19; X-ray images
Coronavirus is a wide family of viruses that may infect people and cause serious illness [1]. While certain coronaviruses are familiar to humans, the present epidemic is the consequence of a novel animal illness [2]. The term new here refers to the fact that humans have not yet been exposed to this virus, while anthropogenic refers to the virus spreading from animals to people [3]. Due to the virus’ novelty, people seem to lack an inherent degree of protection, which serves to limit the spread and impact of other viruses. Viruses, particularly those newly discovered, have the potential to develop into either local or broad epidemics [4]. In this article, a pandemic is defined as an outbreak of any infectious illness that substantially increases mortality and morbidity over a larger geographic region, while a pandemic is defined as a disease that spreads over a short period of time. Recently, the Severe Acute Respiratory Syndrome (SARS) virus affected 8,096 individuals and killed over 770, while the smallpox epidemic infected millions Region [4]. In 2002, the SARS-CoV virus started to spread; this virus was identified in Guangdong, China. In 2012, another coronavirus epidemic Middle East respiratory syndrome coronavirus (MERS-CoV) started in the Middle East, resulting in an acute respiratory illness dubbed Middle East Respiratory Syndrome [5]. This virus claimed the lives of 858 individuals and infected 2494 others. The globe is now battling another coronavirus, which seems to have begun spreading in December 2019, but this is still being debated. COVID-19 is an infectious illness that is transmitted mostly via direct or indirect contact with an infected person, respiratory droplets generated when a human source is provided or when infection has already occurred, or droplets (airborne transmission) [6]. Early signs include a dry cough, a high temperature and difficulty breathing, which may progress to multiple organ failure or severe respiratory distress; in extreme instances, death may ensue as well [7,8]. Due to the ease with which this virus spreads, and the rate at which it develops substantially and sustainably among people, our capacity to fight it is restricted. To put it another way, there are only a limited number of physicians, health care professionals, and when the epidemic reaches its height of infection, there may not be enough capacity to handle the pandemic completely. As a result, there is an obvious demand for tools that may assist these experts in doing their jobs more effectively. This may involve the development of contact tracking apps, dashboards, statistical visualisations, machine learning models and other artificial intelligence-based tools.
The motivation of this study is to offer a technique for accurately classifying X-ray images for COVID-19 by combining the strength of two technologies. To begin, define new images in terms of frames. Second, extract the features from the dataset of images using textural and statistical characteristics. By using chest X-ray images, this research presents an integrated Two Step-AS clustering method with Ensample Multiple Neural Network algorithm (MNN) for predicting pneumonia in COVID-19 patients. Pneumonia is a viral infection that often results in mortality. COVID-19 individuals who get pneumonia also suffer a slew of health problems. This study aids in the detection of pneumonia in COVID-19 patients, allowing them to be isolated from less severe patients for life-saving therapy. The description and prediction of this intelligent model is used to classify chest X-ray images of COVID-19 and pneumonia patients, as well as to diagnose positive COVID-19 cases with pneumonia. The primary contributions of this research are the following:
1. When combined with certain supervised and unsupervised machine learning technologies, the proposed COVID-19 prediction approach may enhance diagnostic accuracy and decrease misdiagnosis error.
2. The Two Step-AS clustering method has been modified by pre-aggregating the dataset before applying MNN algorithm to detect COVID-19 cases from chest X-ray findings.
3. We use the Two Step-AS aggregation technique on pre-learned models with multi-and single-class datasets. The compilation procedure divides the datasets samples and categories into numerous sub-samples and subcategories and then assigns new group labels to each new group, with each subject group displayed as a distinct category.
4. When building a MNN diagnostic model, the similarity and diversity of these groups are emphasised in dataset instances, assisting in identifying distinctions between dataset members and aiding the classification and learning processes.
5. This Ensemble Boosting learning algorithm and MNN model was used with the Two Step-AS clustering method in order to group all of the comparable samples into various groups, once the feature extraction procedure from the COVID-19 X-ray images was completed.
6. The Ensemble Boosting learning algorithm technique is used to improve the accuracy of chest X-rays in a variety of situations, including Normal, positive COVID-19 and pneumonia cases.
Nevertheless, the suggested approach has a limitation as it is restricted to the chest X-ray dataset, while other medical datasets may be utilised to identify COVID-19.
The remainder of this work is divided into sections. The second part discusses relevant studies on this topic. The third part describes the planned proposed system. The fourth part considers the strategy and technique. The fifth part examines the experimental findings and the dataset. Part six contains a summary of the findings, discussion and analysis, while part seven summarises the research and outlines future work.
Machine learning has shown superior performance in a wide variety of image fusion processing applications, including image segmentation [9], image analysis [10,11] and image classification [12]. The classification of images is accomplished by extracting important characteristics from images using descriptors and image moment [13] and SIFT [14], then using the extracted features in prediction tasks with classification devices such as SVM [15]. In contrast, the drawbacks of the image fusion techniques is that it reduces the quality of the images and the amount of noise in the final fused output image. Additionally, not suitable for real time applications when the images will be blurred. Furthermore, color distortion and spectrum deterioration were observed in the color images. In comparison to handcrafted features, the approaches system based on deep neural networks [16] performs very well at categorising images based on the extracted characteristics. According to ML Characteristics, many attempts have been made to categorise chest X-ray pictures in the COVID-19 patient group or the normal case category using machine learning techniques. These attempts included methods based on deep learning. For instance, the authors developed a Convolutional Neural Network (CNN) model for diagnosing COVID-19 spontaneously from chest X-ray images [17]. Classification accuracy is claimed to be 96.78 percent when utilising the MobileNet architecture [17]. Simi Larley's study [18] used a transfer learning strategy. The stated accuracy rates for InceptionV3 and Inception-ResNetV2 are 97 percent and 87 percent, respectively. Orthogonal moments and their variations have recently become very effective tools in a variety of pattern recognition applications and image processing. The exploiting of features from images using image moments has been shown to be effective in a variety of applications in [19,20]. For example, integrating orthogonal quaternion harmonic transformation moments with image demonstration and feature selection optimisation methods is effective in categorising images of colour galaxies [21]. The study conducted in [22] aimed to build and construct an artificial intelligence-based programmable tomography analysis tool. The researchers included various datasets and performed tests to determine the development of the COVID-19 illness in each patient over time. This was accomplished via the use of 3D volume assessment, resulting in the generation of a score dubbed the “Corona Score.” A total of 157 individuals with universal Computed Tomography (CTs) were included in the research as the test indicated. The suggested A subsystem analyses nodules or segments of focal opacities and case volumes in three dimensions using pre-existing methods. Subsystem B is a newly developed two-dimensional assay of each slice that allows for the separation and confinement of ground glass infiltration as well as greater diffuse opacities. Additionally, a remedy on a case-by-case basis has been suggested to treat the supplementary opacity produced by illnesses.
A survey study by Rasheed et al. [23] examined medical and technological aspects in the battle against the COVID-19 pandemic, which will be of assistance to virologists, infectious disease researchers and policymakers. Additionally, the study addressed the use of different technological tools within the context of COVID-19, and examined a range of artificial intelligence methods that have been suggested to assist in the COVID-19 pandemic, ranging from early diagnosis via picture diagnostics to models that may explain the spread of the disease and predict new possible outbreak locations. Predictive diagnostic machine learning techniques have lately piqued the interest of the medical sector as a valuable resource for doctors such as deep learning, a prevalent area of artificial intelligence (AI), which enables end-to-end models to be built in order to generate anticipated outcomes utilising input data without the need to extract features manually. Sethy et al. [24] used X-ray images to identify the features derived from different CNN models, and then a support vector machine to identify the features (SVM). According on their findings, the ResNet50 classifier combined with the SVM model yielded the best results. To conclude, several recent COVID-19 studies included a range of CT image deep learning models [25] in their analysis.
The research studies by [11,24,26–30] are used to develop these state-of-the-art techniques, which are based on deep learning approaches and utilising chest X-ray images. Machine learning approaches rely heavily on knowledge in the selection and extraction of applicable information and have limited performance when compared to deep learning approaches. Consequently, machine learning techniques have become increasingly popular in recent years, owing to significant advantages such as (i) the ability to make maximum use of formless data, (ii) the exclusion of the requirement for engineering feature, (iii) the aptitude to provide superior performance, (iv) the eradication of unnecessarily high costs, (v) the exclusion of the requirement for data labelling. Machine learning methods are widely used these days to extract important characteristics from an item of interest automatically in order to categorise it appropriately. With the VGG19 architecture, Apostolopoulos and Bessiana were able to obtain 97.8 percent accuracy in the categorisation of COVID-19 [26]. Ozturk et al. [11] demonstrated that the categorisation of coronavirus, pneumonia no-findings, and finding had an accuracy of 87 percent [15]. Sethy et al. [24] worked on a classification system for positive coronavirus and negative coronavirus patients. However, although the relevant studies identified hitherto are not intended to distinguish coronavirus caused pneumonia patients from other viral induced pneumonia cases, this kind of identification is necessary to prevent misdiagnosis of coronavirus infection as a common viral illness, since coronavirus disease requires a different line of therapy from a typical viral infection. Abhiyev et al. [31] and colleagues, Tariq et al. [32] and colleagues, Bharati et al. [32] and Apostolopoulos et al. [26] suggested pulmonic chest infection categorisation by using deep learning methods. The identification of COVID-19 patients with a range of other pulmonary illnesses, such as edema, fibrosis and effusion, is the focus of current research.
In this section, the materials and methods that have been used to build the proposed solution is described sufficient details. The whole system for identifying COVID-19 from chest X-ray images consists of a few critical steps: dataset collection, data pre-processing, data set classification, model training, model assessment and analysis and model validation and improvement. Fig. 3 depicts the entire system architecture for COVID-19 detection using Two Step-AS Ensemble Boosting Neural Network (TSEBNN), as well as the components of the system. Initially, the dataset required for training and model validation is gathered and organised in preparation for use. For the purpose of maintaining consistency, the gathered data is then changed, scaled and normalised. Following this phase, all data is categorised in accordance with the model's categorisation scheme. After that, all models are trained and verified using the same dataset and in the same context as the previous models. Finally, the trained models are evaluated using accuracy measures, and the receiver operating characteristic curve for training and testing process. Fig. 1 shows the framework of the TSEBNN System.
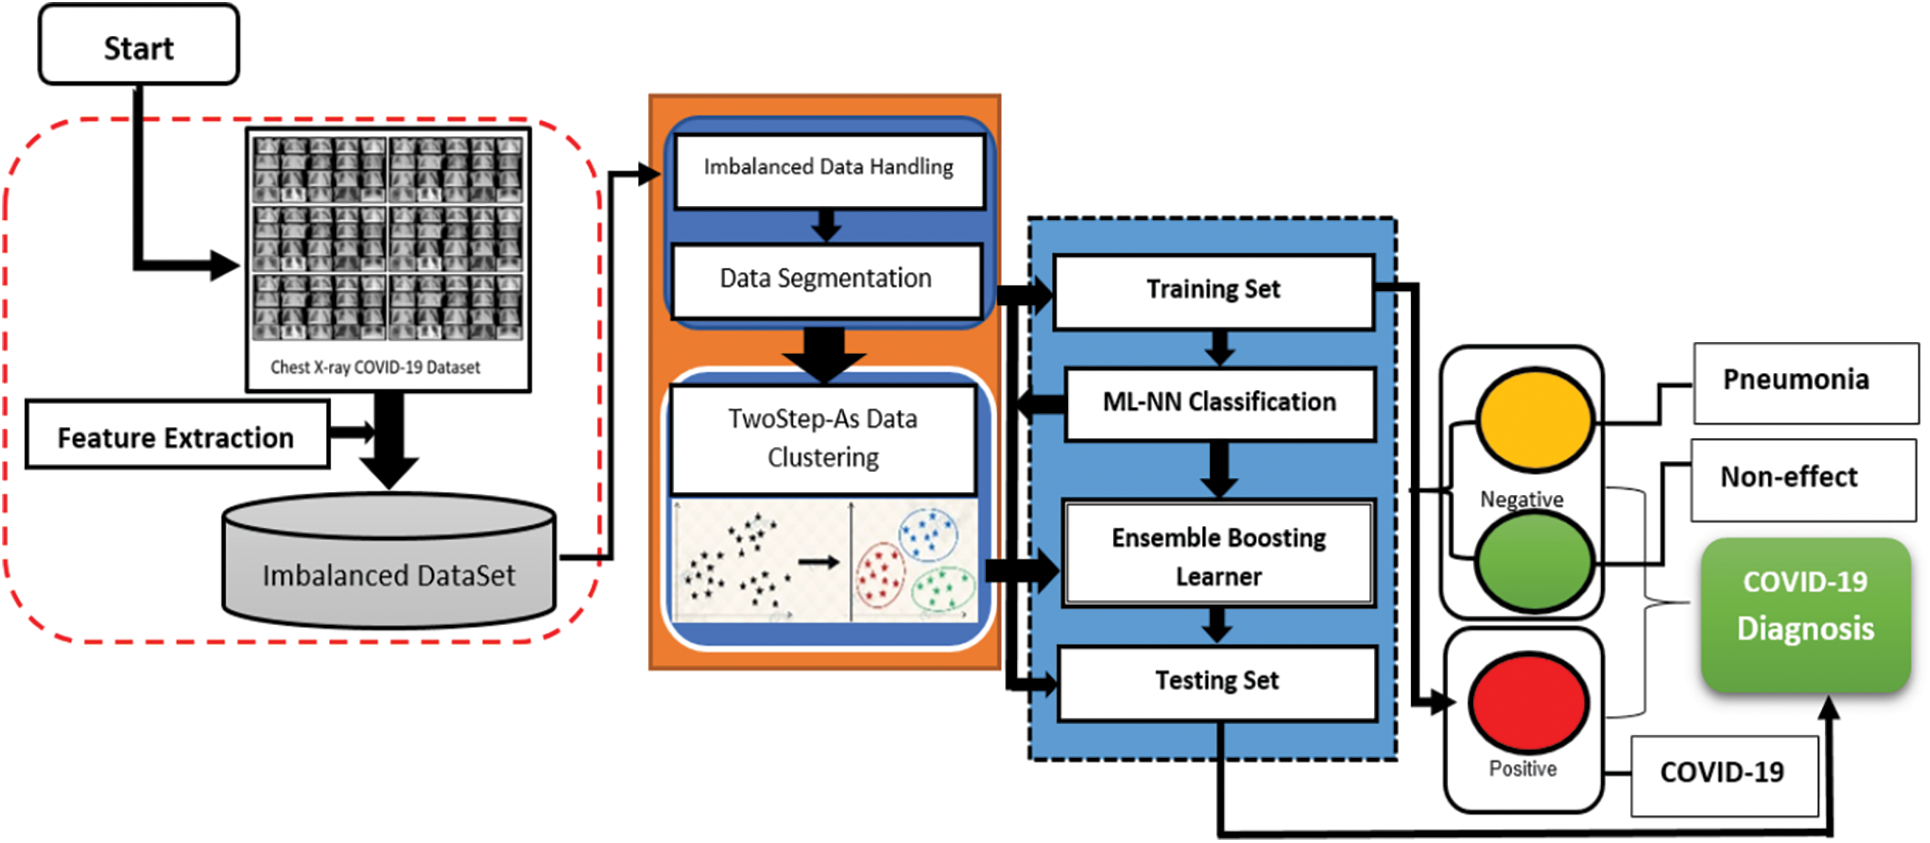
Figure 1: TSEBNN diagnosis system
Fig. 1 illustrates the basic framework of the TSEBNN Diagnosis System. The proposed approach is divided into three stages: imbalance of the raw dataset and extraction of the feature, instances data clustering using their closeness to the cases’ characteristics by a Two Step-AS algorithm and diagnosis using a MNN classifier throughout the learning and testing phases. The proposed approach classifies X-ray images as Pneumonia, COVID-19, or Non-COVID-19. The dataset modelling as well as the suggested TSEBNN modelling are discussed in detail below.
This study makes use of open-source picture databases [33], in order to carry out its research. Fig. 1 shows a few representative chest X-ray pictures of all three cases examined: normal, pneumonia and COVID-19. The chest X-ray images of patients infected with COVID-19 were taken and annotated by Dr. Joseph Cohen, who has a GitHub repository containing annotated chest X-ray and CT scan images of COVID-19, Acute Respiratory Distress Syndrome (ARDS), SARS and MERS. This collection includes 250 chest X-ray pictures of COVID-19 viral infection, which has been verified. The chest radiographs of healthy individuals, as well as patients suffering from bacterial and other viral pneumonia, were taken from the Kaggle repository.
The COVID-19 testing is successful in both asymptomatic and symptomatic patients using artificial intelligence-based X-ray screening. Because COVID-19 can be differentiated from other lower respiratory illnesses, which may seem identical in X-ray imaging, this presents a distinct challenge for algorithm developers. In the form of JPG X-ray pictures, the data is provided by Dr Cohen of John Hopkins Hospital, who created a collection making use of the two datasets from the Kaggle Chest X-rays. These datasets were utilised for comparisons between healthy patients, patients who had bacterial pneumonia and patients who had pneumonia caused by COVID-19 viral infection. The collection comprises chest pictures taken from hospitalised pneumonia patients. Cohen et al. [33] created a COVID-19 X-ray image library based on pictures obtained from a variety of publicly available sources. This collection is constantly updated with pictures from different locations that scientists have shared. Currently, there are 127 COVID-19 diagnostic X-ray pictures in the database.
Another COVID-19 courps is called National Institutes of Health Chest X-Ray Dataset (NIH). The dataset contains 112, 120 X-ray images with illness classifications from 30,805 different individuals. For the purpose of creating these labels, the authors employed Natural Language Processing to text-mine illness categories from the radiological reports that were connected with them. Approximately 90 percent of the labels are projected to be correct, making them appropriate for use in unsupervised learning situations.
3.2 Feature Extraction Process
• Statistical Feature
Upon closer inspection of the X-ray images, we can observe that the excellent texture and statistical combinations are most likely the most prominent visual element inside. Numerous academics have started to employ textural and statistical characteristics to model classification issues in recent years, and this trend is expected to continue. The popularity of such employment is down to its simplicity, as opposed to software engineering labour, which is often a time-consuming process that requires extensive understanding of issue classes as well as methods that enable hand design descriptors. This function is not required. However, although unmanufactured descriptors offer certain benefits, it is important to note that handcrafted descriptors have particular characteristics that may be very helpful for a wide range of classification tasks. For instance, in this case, the advantages of using handmade features outweigh the disadvantages since these methods are more powerful because they typically operate in a more deterministic manner to capture patterns linked to an issue. A more precise explanation of the patterns created by the handmade characteristics of the pictures is more possible when handcrafted features are used, rather than those unpolished. Although efforts have shifted to the usage of these two groups in feature extraction, this was not the case in the past. As a result, we may test the two independently and then combine the results of many experimental groups to obtain a final result. In this way, we may utilise the complementarity among the methods of the descriptors, which has been shown in [34,35] to prevent them from making the same mistakes, while executing a certain classification job. The adjectives used to describe the work are briefly mentioned in this section. Specific texture descriptors were chosen in order to obtain excellent performance in general applications or, more particularly, in medical image analysis applications.
When it came to the Texture features group, the Gray-Level Co-Occurrence Matrix (GLCM) technique was used. Sebastian et al. [36] proposed the concept of GLCM, which is a link between pixels in a matrix widely employed in the study of textures. When two pixels are next to one another, the relationship is measured in terms of the distance between two pixels and the angle between their respective axes. Because of this, the GLCM parameters are the size and angles of the space. The GLCM functions quantify an image's texture by determining the frequency with which a pair of pixels with differing values and in a certain spatial relationship occur in the picture. The GLCM generates a matrix of paired pixels with different values and in a given spatial relationship, and then extracts statistical measures from this matrix. The statistical measurements of texture filter functions, as well as the spatial connections of pixels in the picture, were found to be insufficient for providing information about shape in texture features, as previously stated. The GLCM feature set is constructed based on statistics of the second order. To calculate the reflection, the overall average of degrees of resemblance between pixel pairs in various ways (homogeneity, uniformity, etc.) may be utilised. The pixel separation is one of the most important variables affecting the discriminating capabilities of the GLCM. When distance 1 is taken into consideration, the connection between pixel values (i.e., short-term neighbourhood connectedness) is represented. Instead, the change in the value of the distance reflects the change in the number of corresponding pixels.
• GLCM Features
As outlined in statistical and structural texture methods [36], GLCM produces functions that accurately represent the adjacency relationship among pixels in the texture picture. Some formulae for extracting characteristics from co-occurrence matrices are dependent on the features to be observed. Based on the properties of the X-ray imaging collection, such as correlation, homogeneity, energy and contrast, we chose the four most important Haralick texture elements for further study. The formulas for computing the statistical and GLCM features are discussed and presented by Osman et al. [37].
A. Imbalance Data Management
The imbalance data was handled in the first step as proposed by Osman et al. [37] by using the raw input characteristics of X-ray pictures owing to their uneven sample distributions. To address this issue, the whole dataset is divided into equal portions for each class. For example, the number of confirmed cases for those with COVID-19 is 125, whereas the number of confirmed cases for those who do not have COVID-19 is 500, and those with pneumonia is also 500. The non-infected cases and pneumonia patients were split into four equal-sized groups, each with 125 samples, and the samples from each of these four groups were equivalent to the samples from the group of individuals with COVID-19. We performed the COVID-19 sample joining procedure for each group individually and utilised them as crossover with other produced non-infected and pneumonia groups. Each produced group includes 375 cases, with 125 infected with COVID-19 and labelled as class 1, 125 non-infected with COVID19 and 125 pneumonia cases labeled as class 2 and class 3.
B. Two Step-AS Cluster Algorithm
Many researchers, including [38–40], have adopted the Two Step Clustering algorithm in various fields. Using data from the Smyth research [39], Najjar et al. [38] presented an exploratory analytics approach for evaluating healthcare data based on the findings of the study. To handle categorical and numerical inputs, the suggested approach used a Two Step Clustering methodology for heterogeneous finite mixture models: first, a joint mix of multinomial distribution and Gaussian and, second, a joint mix of multinomial distribution and Gaussian. Then, to handle orders of categorical input, a hidden Markov model was used in conjunction with a mix of other models. The technique was tested on a real-world system, and the findings show its effectiveness in locating health services for people with large families. A technique for identifying outliers and determining the impact factor in diabetes patients was suggested by Deneshkumar et al. [40], who used a Two Step Clustering algorithm as well as other data mining approaches. For the purpose of gaining new therapeutic information, the researchers attempted to identify patterns and connections among vast amounts of medical data. Associated with the Two Step-AS clustering algorithm is a new technique to reveal natural clusters (or groupings) inside a knowledge collection, which may be apparent [41]. This exploratory technique, known as Two Step-AS Cluster, is intended to uncover natural groups (or clusters) inside a data collection that might otherwise go undetected. Such a method makes use of an algorithm that has many beneficial characteristics, which distinguish it from conventional clustering procedures.
1. Dealing with variables that are either categorised or continuous. A joint multinomial-normal distribution may be used for categorical and continuous data if the variables are assumed to be independent of one another.
2. The number of clusters is automatically selected. It is possible to find automatically the optimum number of clusters using an optimisation method, which compares values of a model-choice criteria across various clustering solutions.
3. Scalability. In order to examine huge data files, the Two Step-AS method constructs a Cluster Feature (CF) tree that summarises the entries in each cluster.
For example, retail and consumer goods businesses often use clustering methods to analyse data on their consumers’ purchasing patterns, gender, age, income level and other characteristics. The marketing and product development strategies of these businesses are tailored to each specific consumer segment in order to boost sales and create brand loyalty among customers. Pre-clustering is performed by scanning each data record, and determining whether the current record can be assigned to one of the preconceived clusters or whether it needs to be added to a new cluster based on the distance criterion. Clustering is performed after the pre-clustering step. In this research, we utilised the Two Step-AS method log-likelihood distance in conjunction with the log-likelihood distance. The pre-clustering process is carried out by constructing a data structure known as the CF (cluster feature) tree, which includes the cluster centres and other relevant information. Nodes are arranged in levels, with each level containing a number of participants for each node. A leaf entry is the last sub-cluster of a cluster. Each record is searched for by recursively descending the CF tree, beginning with the root node and progressing down to the closest child node. When the algorithm reaches a leaf node, it searches for the leaf entry that is closest to the leaf node. A record is added to the closest leaf entry if it is within a certain distance of the leaf entry. The CF tree is updated if the record is within that distance. If this is not the case, it generates a new value for the root node. If there is enough space in the leaf node to accommodate another value that leaf is split into two values, with each being distributed to one of the two leaves. The farthest pair serve as seeds and the remaining values are distributed based on the closeness criterion, as shown in the following diagram.
With the sub-clusters obtained from the pre-cluster phase as input (along with the noises, if the alternative step was utilised), the clustering stage may arrange the sub-clusters into the appropriate number of clusters. The use of traditional clustering techniques may be effective in this situation since the set of sub is much less than the set of original data. It employs an agglomerative hierarchical approach that automatically calculates the number of clusters to be used in a given situation. The log-likelihood distance determines the distance between two clusters of interest. For both continuous and categorical data, the log-likelihood distance may be used to determine a relationship. As two clusters are grouped into one, the distance between them is linked to the reduction in the natural logarithm of probability function, which indicates that they are closer together. The likelihood measure assigns the variables a probability distribution based on their values. Categorical variables are considered multinomial in distribution, while continuous variables are regularly distributed. It is assumed that all variables are independent of one another. The clusters distance between I and j is described as [42]:
where
These formulations have the following parameters:
The coldness between clusters i and j would be accurately equal to reduce in log likelihood once the two clusters are joint, if
The Two Step Clustering differs from the traditional clustering techniques in terms of certain features with several advantages. First, the variables used for clustering can be discrete or continuous variables, which allows for a broader range of applications. Second, the Two Step Clustering method requires less memory resources and calculates faster. Third, statistics are used as a distance index for clustering, and, at the same time, the data can be “automatically” reorganised with the best number of clusters. For this reason, the Two Step Clustering technique is nominated and examined to integrate with the MNN and Ensemble Bootstrap aggregating learning algorithm.
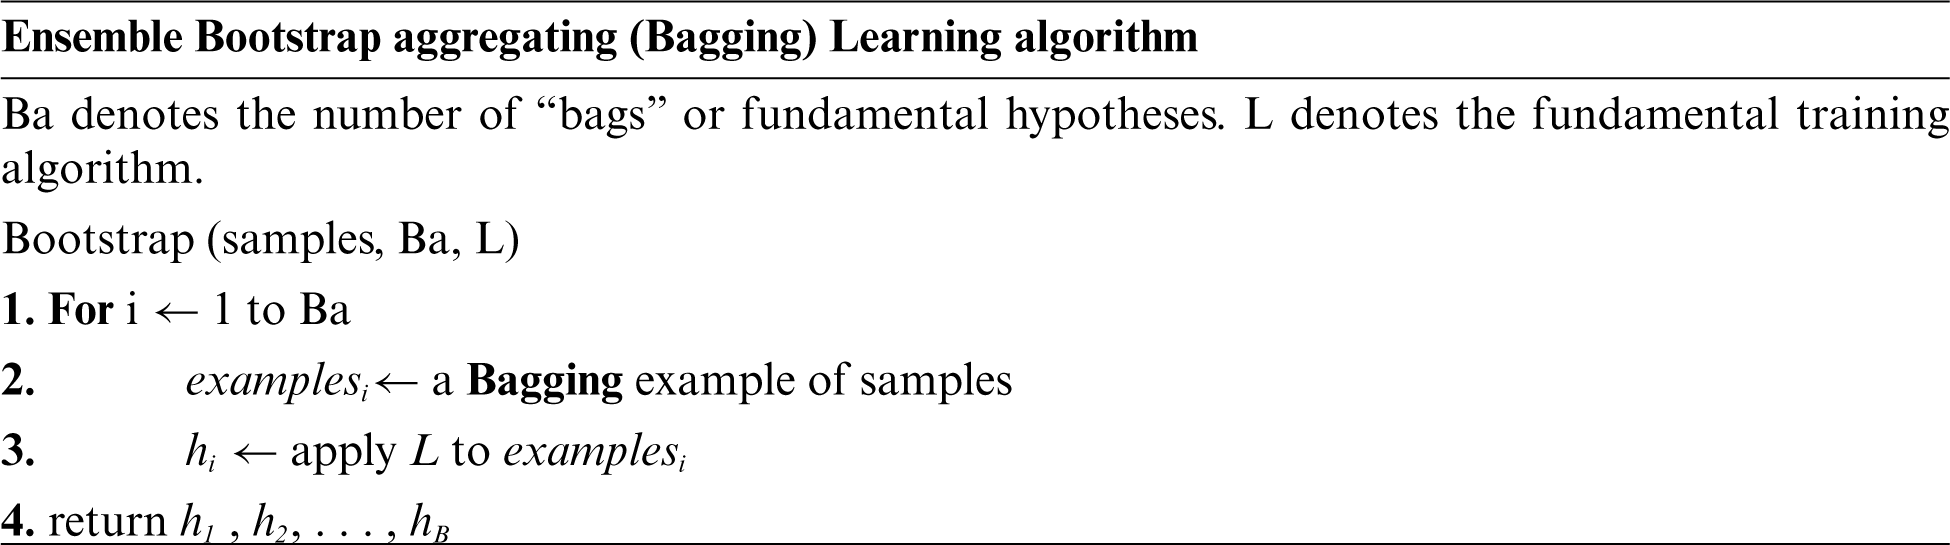
C. Ensemble Bootstrap Aggregating Learning Algorithm
Boosting refers to a group of procedures that have the ability to turn poor learners into strong learners. Models that are just slightly better than random predicting, such as tiny decision trees, are the foundation for improvements. The alteration of a collection of soft trainers to weighted data forms serves as the central concept of improvement. More weight is given to cases incorrectly categorised as “error” by previous rounds of review [43]. The classifiers are then merged to produce the final prediction, which is determined by either weighted common prediction or a weighted total voting (classification) (regression). The most significant variance between the techniques of bagging and boosting, for instance, is that the basic learners are sequenced using weighted data [44], which has a fault ratio lower than that of random selection [45]. AdaBoost is the first to create the soft C1(x), a decision stump in most instances. When the weight of an observation is raised–or when at least one of the classification techniques makes a mistake–the second classifier is rebuilt using the new weight of the observation. All classification systems’ predictions are merged using weighted majority voting methods, resulting in a final forecast that may be computed as follows:
where a1, a2,…, and am denote numbers produced by the boosting method to enhance the sequence [46].
The most often used approaches for ensemble learning are bagging and boosting, both of which are concerned with increasing diversity by changing the training set in such a way that the learning algorithm is performed repeatedly across a range of training conditions. Each boosting step increases the amount of weight that is assigned to each of the training data points. By using substitution, bagging creates a random sample of the data for basic apprenticeship learning, bootstrap sampling creates subsets of the data for basic apprenticeship learning, voting and averaging are used to combine the performance of basic apprentices and voting and average regression are used to measure the results of specific students. When boosting, the weights of these weights are altered randomly and substituted for the weighted data in order to increase the significance of previously unclassified samples, which are subsequently categorised. An ensemble classification system is a generic name for a system that combines multiple classification algorithms in order to enhance the prediction effectiveness of the system [47]. Several researchers have previously utilised classification ensembles and disputed their superiority to individual categorization [48–53]. The following diagram depicts the Ensemble Bootstrap aggregating learning algorithm.
D. Multiple Neural Network Approach Based Ensemble Bootstrap Aggregating Classifier
The proposed method for Covid-19 diagnosis integrated a MNN method with an Ensemble Bootstrap aggregating (Bagging) Learning algorithm. It was discovered that the ensemble approach imitates human reasoning, namely, multiple perspectives are considered before making a final decision. This was decided by a unanimous vote since the real-world implementation of this research requires a high level of confidence, given the separation of patients with Covid-19 into bio-classes, and the employment of a range of decision-making fusion techniques, all of which are discussed in the paper. The primary goal is to enhance the learning level by gathering Covid-19 samples with similar patterns together. By doing so, the complexity is decreased, and the accuracy of the diagnostic interpretation, as well as the diagnosis, increased. Fig. 2 depicts the integration structure of the ensemble Bagging Learning technique and the MNN.
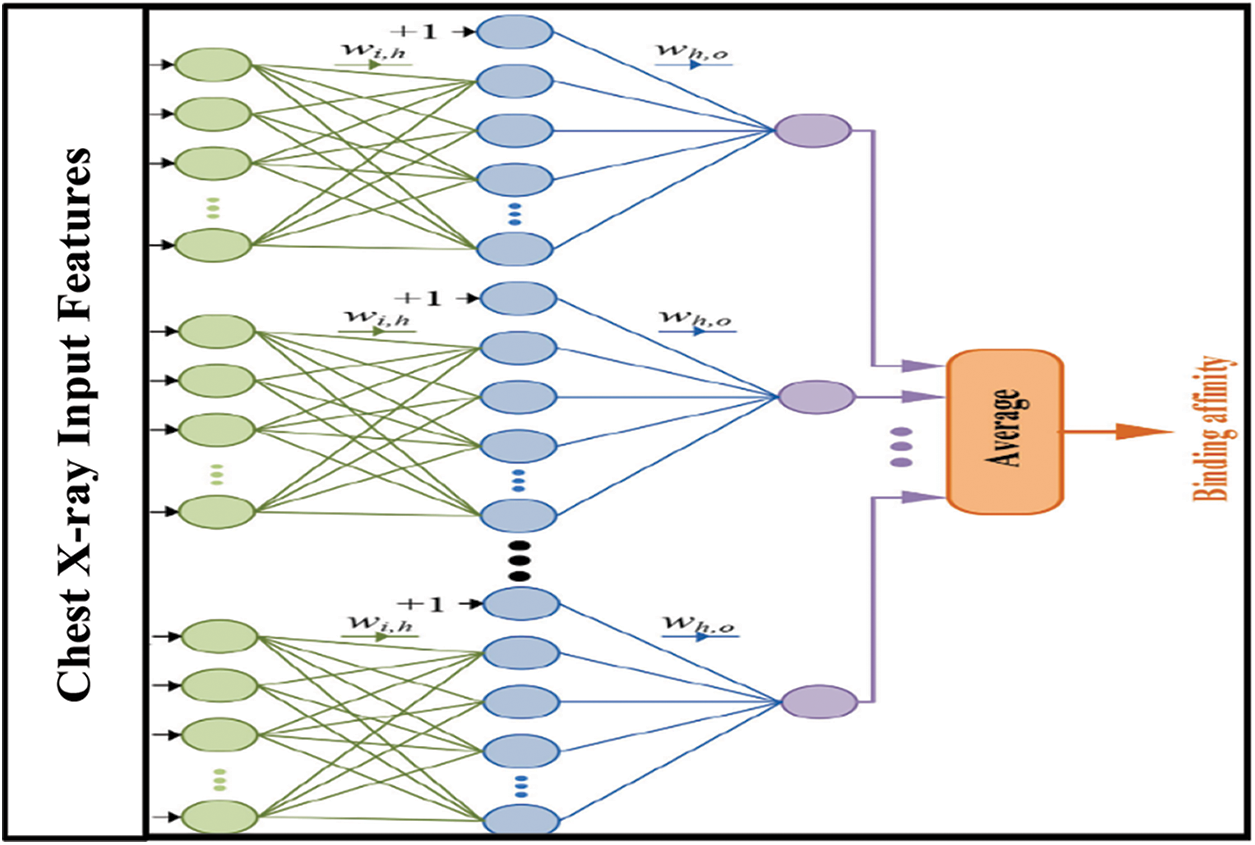
Figure 2: Organisation of MNN-ensemble bagging learning method
The hybrid module combines the Ensemble Bootstrap aggregating classifier with the MNN to provide a more accurate classification. When classifying different kinds of X-ray Covid-19 datasets, this module adopts a hybrid combination technique to combine predictions from separate classifiers based on their relevance, in order to improve classification accuracy. The hybrid method makes use of tenfold cross-validation to divide datasets for learning and testing samples into two groups, one of which includes Ensemble Bootstrap aggregating learning and the other, which does not. The MNN classifier in conjunction with the output of the Ensemble Bootstrap aggregating learning algorithm achieves the highest feasible accuracy. X-ray Covid-19 dataset characteristics are used as input variables in each of the training and testing experiments, which are then fed into the MNN. Then, the target field is a characteristic of a certain class (Non-COVID, COVID-19, or Pneumonia). When the MNN method categorises the dataset with Ensemble Bootstrap aggregating learning output, the findings of the MNN classifier with Ensemble Bootstrap aggregating learning demonstrates an increase in performance over the previous MNN technique.
A combination of winner-takes-all and weighted-most-majority methods, on the other hand, refers to the combination of the Ensemble Bootstrap aggregating learning algorithm and other techniques. The goal of this combined technique is to decrease the number of misdiagnoses that have occurred as well as to improve the accuracy of healthy COVID-19 diagnosis. In the weighted majority rule, the majority model with modest value forecasts would gain from the minority model with considerably higher value predictions, as opposed to the minority model with tiny value projections. The prediction coefficients of most models with suitably big values are lost in the winning process, as opposed to the prediction coefficients of the single model with the highest value. It is at the learning step of the Ensemble Bootstrap aggregating process that the integrated module is constructed. For each cross-validation fold in the dataset, each MNN retrieves a prediction result from the dataset. This prediction must then be incorporated into the overall prediction model to complete the final classification scheme.
Bootstrap aggregation (bagging) generates duplicates of the learning data by sampling with replacement from the original data and then aggregating those replicates together. Beneficially, this generates bootstrap samples that are the same size as the original dataset. In order to produce occurrence weights, the method is run repeatedly over k = 1,…, K and m = 1,…, M iterations based on Eq. (8):
where:
Then, for each duplicate, a model is constructed. The combination of these models is referred to as an ensemble model. The ensemble model generates new records by using one of the techniques listed below; the options available depend on the measure level of the target being scored. Accuracy is calculated for the ensemble model related to each ensemble technique and base models using Eq. (9):
where:
yk is the target rate for the kth record,
4 Experimental Design and Dataset
This section describes how the suggested MNN was evaluated and the experimental setting was accomplished using the Ensemble Bootstrap aggregating classifier with the MNN technique. The effect of the proposed method on its accuracy and calculation stages is addressed in the computation performance section. All the tests were carried out in the MATLAB environment, using the SPSS IBM modular tools, and the results are reported.
According to our proposed approach, the current X-ray dataset is improved by adding crossover balanced Covid-19 class pictures as supplement. The purpose of this experiment is to show the detrimental effect of imbalance distributions on the performance of the raw dataset. It is important to note that the Two Step-AS-AS-MNN is modified to conduct a regular training procedure using the best model parameters available. In this study, we provide a prediction technique for Covid-19 diagnoses that uses a hybrid Two Step-AS clustering algorithm with Ensemble Bootstrap aggregating learning and MNN method, to improve the diagnostic precision of the classification and reduce the misdiagnosis error, while also increasing the accuracy of classification. This leads to the development of a novel strategy that combines unsupervised and supervised techniques of learning to create a hybrid model of instruction. A qualified research was carried out on the Ensemble Bootstrap aggregating learning and Two Step-AS clustering data structure on the X-ray chest imaging features extraction using the MNN classification structure. When the results of the clusters were utilised as inputs to the classification model, they were predicted using MNN classifier as predictions for positive instances of Covid-19, pneumonia and Covid-19 cases that were not found. The procedure was followed. The TSEBANN model is used to investigate the impacts of the qualifying process. The X-ray chest data has been linked to many instances due to the large number of cases. The datasets were split into 10 parts for training and testing the TSEBANN technique, which was done via a process known as tenfold cross validation.
For the detection and categorisation of COVID-19 in X-ray pictures, two distinct scenarios were utilised in conjunction. First, the TSEBANN method was trained to categorise the X-ray images: COVID-19, No-Finding and Pneumonia. Furthermore, two classes were trained in the TSEBANN model: the COVID-19 classes and the groups of No-Findings. The COVID-19 classes were trained in the TSEBANN model. The output of the proposed model is tested with a tenfold cross-validation method for issues involving triple and binary classification. It is used in the training records; 90 percent of the X-ray pictures are used as testing stage four times, depending on the balance of the dataset, which is part of the pre-processing phase. It is found that 43 women and 82 men are positive in the study's population of participants. In this dataset, not all patients have full medical history. The average age of the 26 successful COVID-19 individuals is approximately 55 years, according to the data provided. Wang et al. [54] supplied a library of chest X-ray 8 images, which may be used for both normal and pneumonia images. The random pictures from this batch of 500 no-founds and 500 pneumonia frontal chest X-rays were utilised as a control to ensure that the findings were balanced. The classes of groups created were similar in that each group consisted of 375 cases, with 125 COVID19 cases labelled as class 1, 125 non-COVID19 infected patients labelled as class 2 and 125 pneumonia cases labelled as class 3. After the data was balanced, this technique identified the produced groups, which were then used to identify each group separately via diagnostic cluster studies. Experiments were carried out using the TSEBANN learning classifier by tenfold cross validation in order to compare the correlation factor of the X-ray diagnostic classification classifier. The new balanced datasets were split into a total of 10 components. Each component accounted for 10% of the original dataset, allowing each dataset set to be converted into test data. During each round, a total of nine sets of experiments were utilised for training and one set of experiments used for testing. Using the Two Step-AS method, the Chest X-ray dataset was clustered based on non-COVID-19 variables such as pneumonia and COVID19 features of the same kind.
5 Results Discussion and Analysis
With the use of Two Step-AS Cluster, the performance of the NN classification algorithm may be enhanced. This is because continuous features tend to perform better when discretized [55]. Machine learning method by Yang et al. [56] employs the technique of discretisation to deal with continuous features; discretisation of continuous features may make data more compact and efficient inductive learning methods, while also simplifying and improving the efficiency of the algorithms. Two Step-AS is a clustering method originally created by Chiu et al. [57], and is intended to handle extremely big datasets. It is included in the statistical program SPSS and is a kind of clustering algorithm. It is possible to handle both continuous and categorical data using the Two Step-AS cluster [58,59]. Tab. 1 shows the Two Step-AS model specifications.
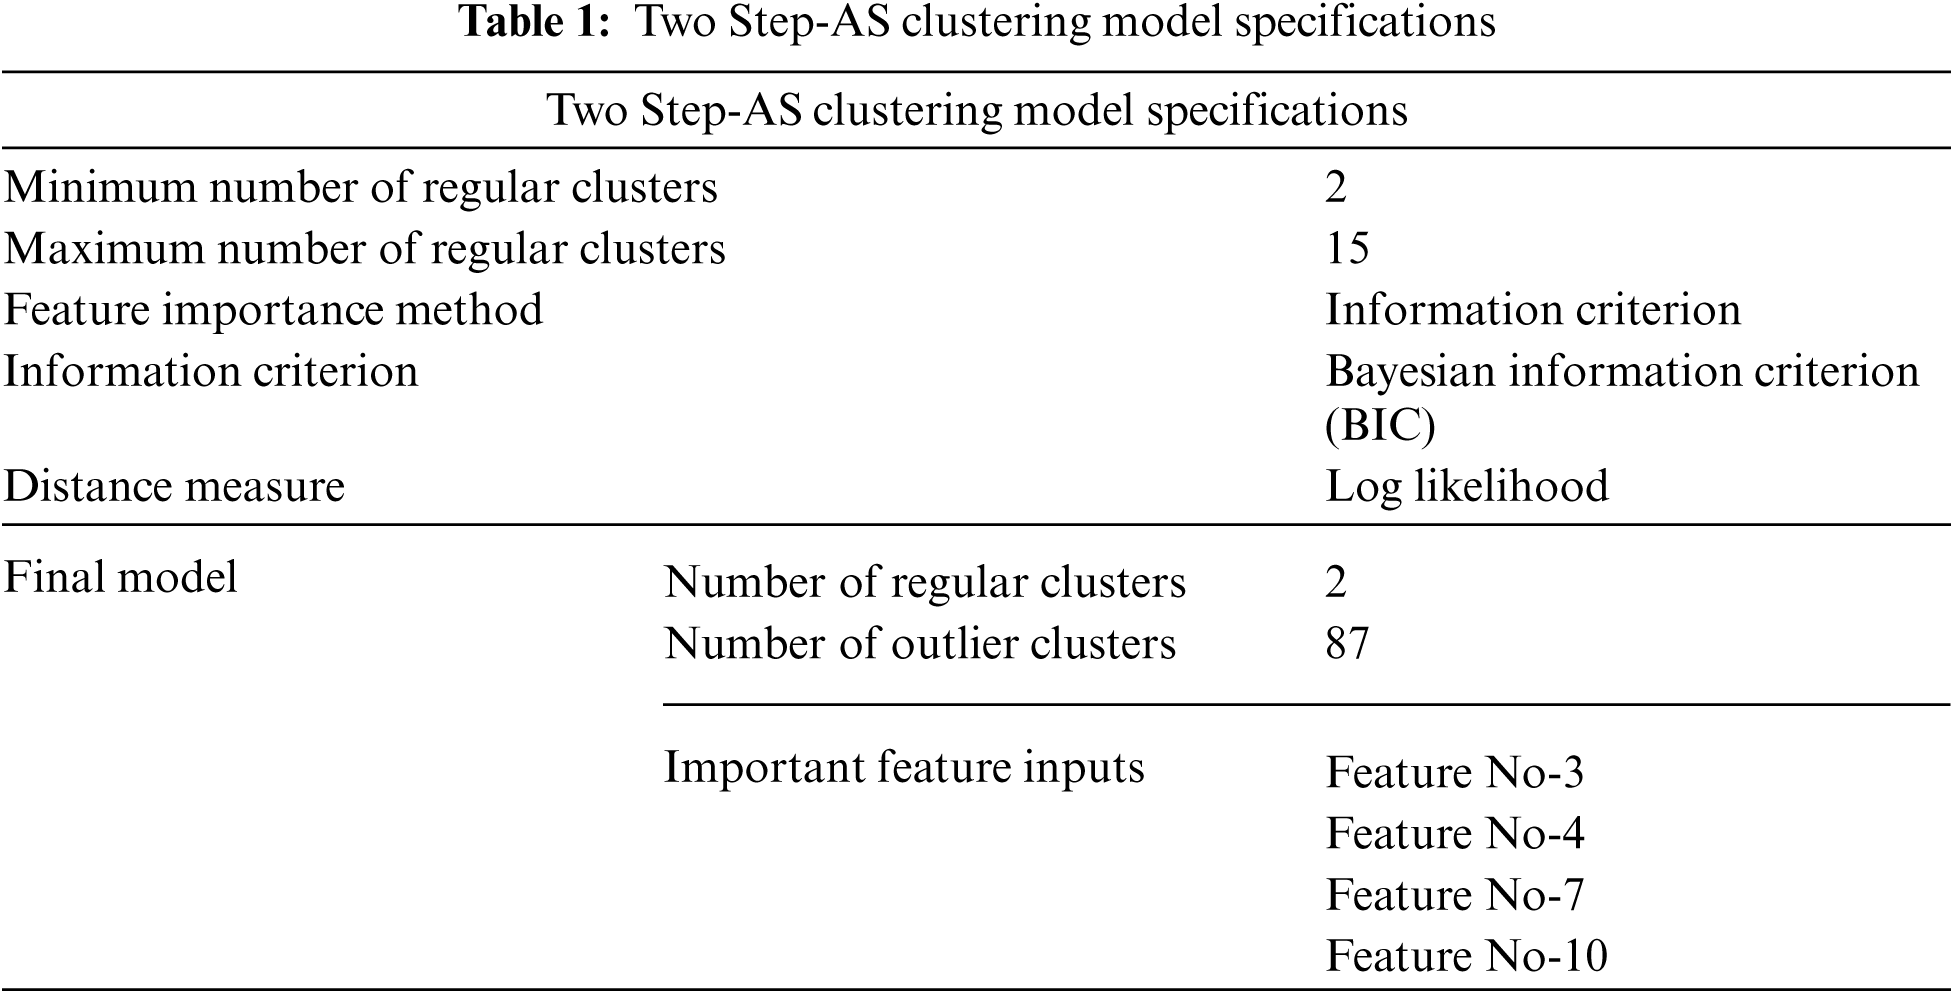
As demonstrated in Tab. 1, when a processed dataset, which is a dataset that has been quantified, is fed into the system, Two Step-AS is used to generate a class label from the processed data. This class label is made up of two labels, cluster-1 and cluster-2, which are grouped together. Following the definition of each class label, the prior probability of each class label for NN calculation is carried out, which is required in the NN calculation. Tab. 1 shows that the minimum and maximum numbers of regular clusters generated by the Two Step-AS algorithm is 2 and 15, respectively. The Two Step-AS algorithms employ the BIC Method as Feature Importance nomination, and Log Likelihood measure as Distance Measure. The Two Step-AS model quality Clustering Evaluation is presented in Tab. 2.
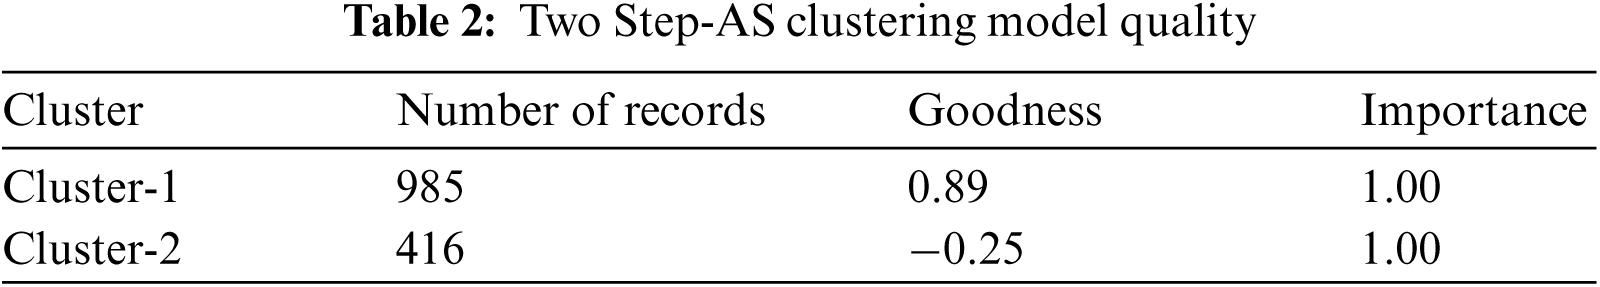
Tab. 2 demonstrates the quality of the Two Step-AS model based on the number of records, goodness and record importance. The goodness is a measure of cluster cohesion and separation. The number of records in cluster-1 is 985 with 0.89 goodness and 1.00 score of record importance, while the number of records in cluster-2 is 416 with −0.25 goodness and 1.00 score of record importance. The overall model goodness is (Average Silhouette Coefficient) = 0.76. Where (−1 to 0.2 Poor | 0.2 to 0.5 Fair | 0.5 to 1 Good). In contrast, the importance is a measure of cluster cohesion achieved as 0 to 0.2 Poor | 0.2 to 0.6 Fair | 0.6 to 1 Good. The outlier strength is a measure of how different an outlier cluster is from the regular clusters. The outlier interpretation is based on higher and less similarities between the records.
In constructing the Cluster Feature (CF) tree, the method includes an alternative step that enables the solution of unusual values to be used (outliers). Outliers are records that do not fit well into any of the clusters in which they are found. In SPSS, entries in a leaf are deemed outliers if the total number of records in the leaf is less than a specified proportion (by default, this proportion is 25 percent) of the total number of records in the biggest leaf entry in the clustered CF tree. Prior to constructing the CF tree, the method looks for and removes any potentially unusual values from consideration. Following the reconstruction of the CF tree, the process determines whether these values can be accommodated inside the tree without raising the tree's size. Finally, numbers that do not fit into any of the other categories are referred to as outliers. If the CF tree becomes larger than the permitted maximum size, it is rebuilt using the current CF tree and the threshold distance is increased to accommodate the larger tree. The updated CF tree is smaller and enables the addition of input records. Tab. 3 demonstrates the importance of an input to a particular cluster with centres modes for feature inputs. The importance of an input to a particular cluster with centres modes for feature inputs is shown in Fig. 3.
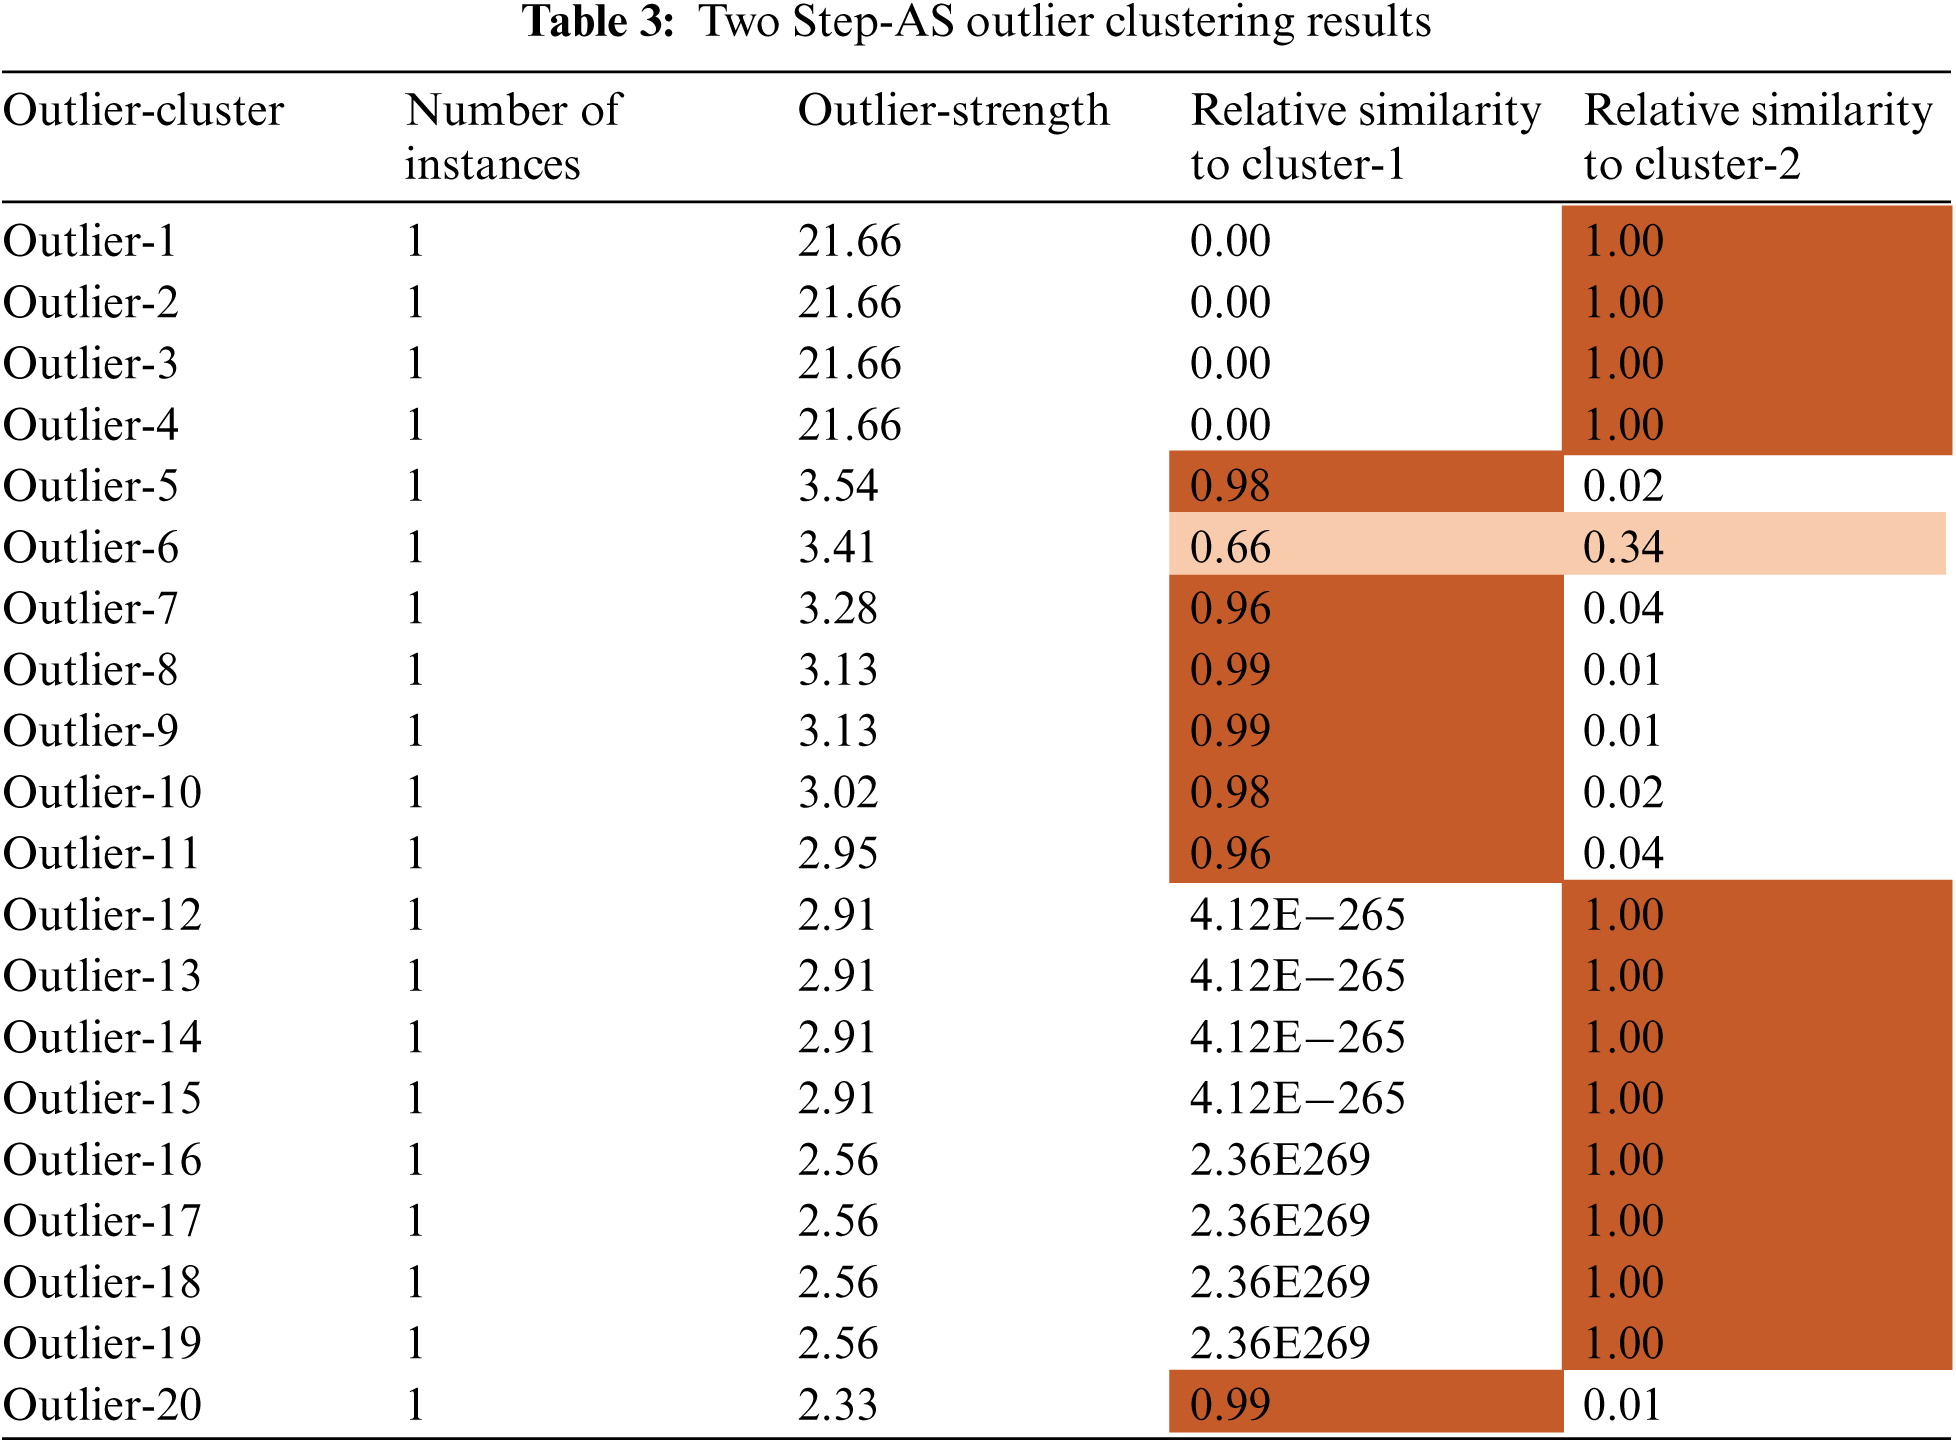
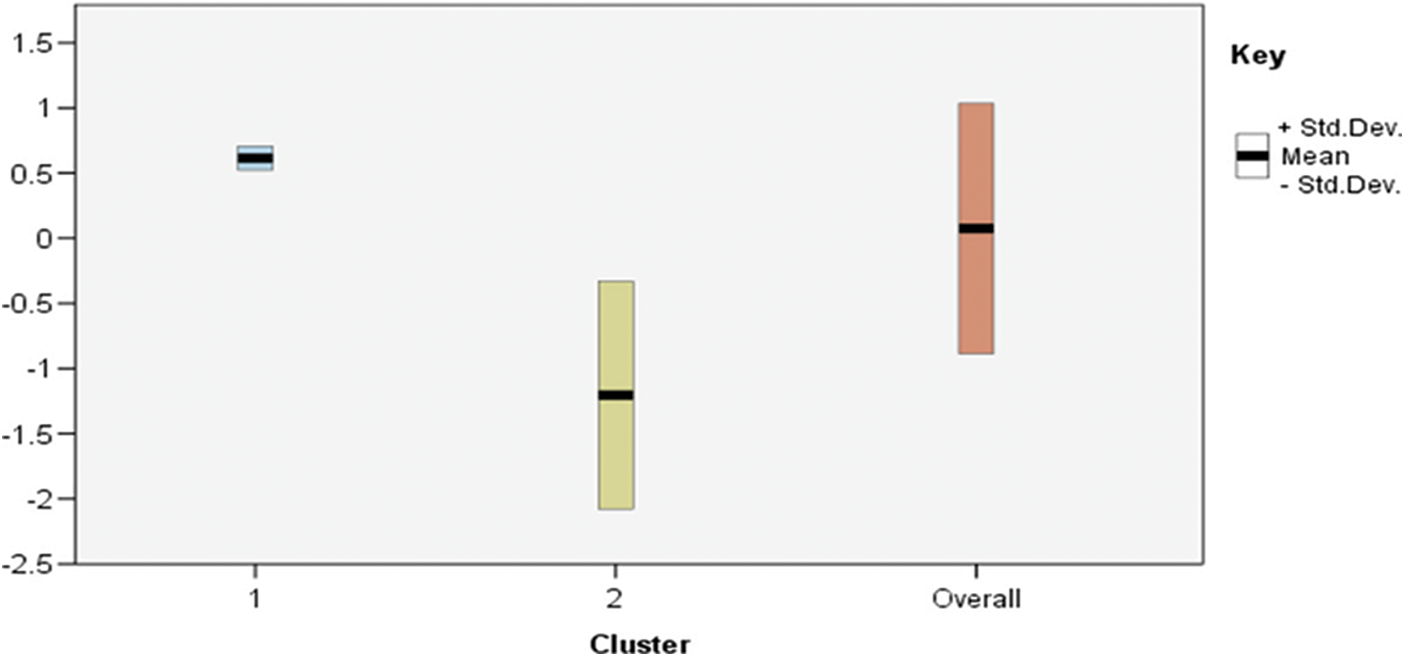
Figure 3: Two Step-AS-AS clusters profile using across important feature
Fig. 3 demonstrates the importance of an input to a particular cluster with centres modes for feature inputs. The scores of standard deviation cluster centre achieved by the important features inputs (feature7, feature4, feature3 and feature1), as shown in Tab. 4, are (0.61, 0.41, 0.32 and −0.16) for the upper cases, and the lower cases scores are achieved with (−0.120, −0.89, −0.75, and −0.23).
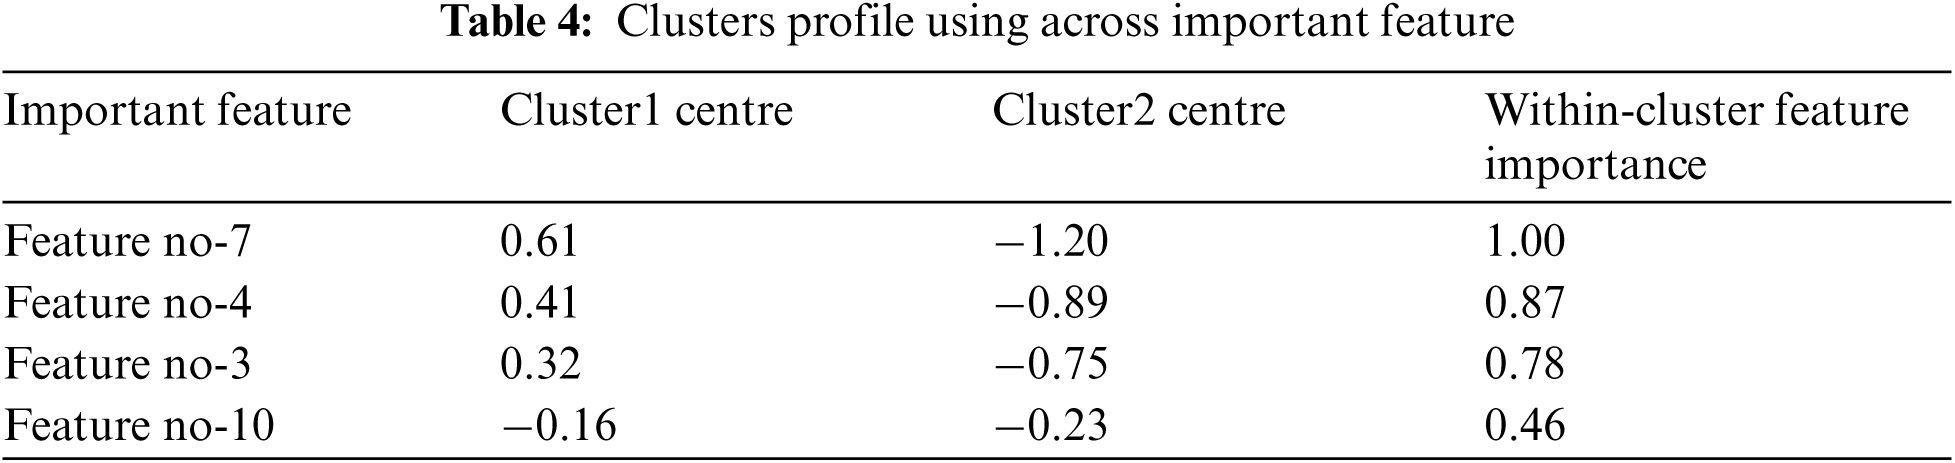
In addition, the important features achieved 1.0, 0.87, 0.78 and 0.46 standard deviation within cluster1 and cluster2.
To carry out an experimental research, a COVID-19 dataset was acquired with the goal of learning the data. As previously mentioned, the researchers employed a tenfold cross-validation method for both training and testing the dataset in their investigation. A cross-dataset experiment was carried out, in which the MNN and MBANN classifiers were used both without and with Two Step-AS clustering findings to evaluate the improved outcomes of the hybrid method. The results of the cross-validation procedure were calculated based on Eq. (10) to provide the following diagnostic:
True Positive (TP) denotes the number of COVID-19 executable correctly classified. False Positive (FP) denotes the number of COVID-19 executable incorrectly classified. True Negative (TN) denotes the number of non-COVID-19 and pneumonia executable incorrectly classified. False Negative (FN) denotes the number of non-COVID-19 and pneumonia executable incorrectly classified.
A chest X-rays dataset was analysed in order to identify the occurrence cases as either non-COVID-19, pneumonia, or COVID19 patients. The hybrid approach was used to train and evaluate the dataset by combining the Two Step-AS and Multipe Neural Network methods (MNN) in a hybrid fashion. In addition, the classification accuracy of the hybrid technique was improved using Ensemble Bootstrap aggregating. The dataset was then split into two clusters automatically, with each cluster containing a varied number of occurrences, using the Two Step-AS clustering algorithm. The primary goal of clustering in this research is to extract patterns and structures from chest X-rays data by grouping samples with similar patterns. As a result, the complexity of the study is decreased, and the accuracy of the diagnostic interpretation is improved. Findings from the training and testing processes on the dataset are presented in Tab. 5, which shows a set of results produced by the Ensemble MNN classifier method without clustering and with clustering using the Two Step-AS algorithm in the absence of clustering. As stated in Section 7, the output of the TwoSetp-AS is added as a new feature to the dataset during the combination process, allowing each instance in the dataset to be labelled with a cluster name. By categorising the data into comparable clusters, this feature has the potential to improve the diagnosis accuracy between the instances. The MNN classifier was used once more with the output of the Two Step-AS and Ensemble Bootstrap aggregating techniques to increase the possibility of achieving high accuracy. In order to evaluate the combined characteristics of the dataset, a tenfold cross-validation procedure was employed throughout the training and testing phase, both with and without clustering. Each training and testing experiment used a different characteristic from the chest X-rays dataset as an input variable to the TSEBANN model. The target field was a characteristic of a certain class (non-COVID-19, pneumonia, or COVID19 patients). The Ensemble MNN classifier's performance improved when it was combined with clustering, as evident from the results obtained when the MNN method categorised the dataset with Two Step-AS cluster output. As shown in Tab. 5, the Two Step-AS clustering method improves the accuracy of diagnosis by a factor of 99.055 percent, which is remarkable.
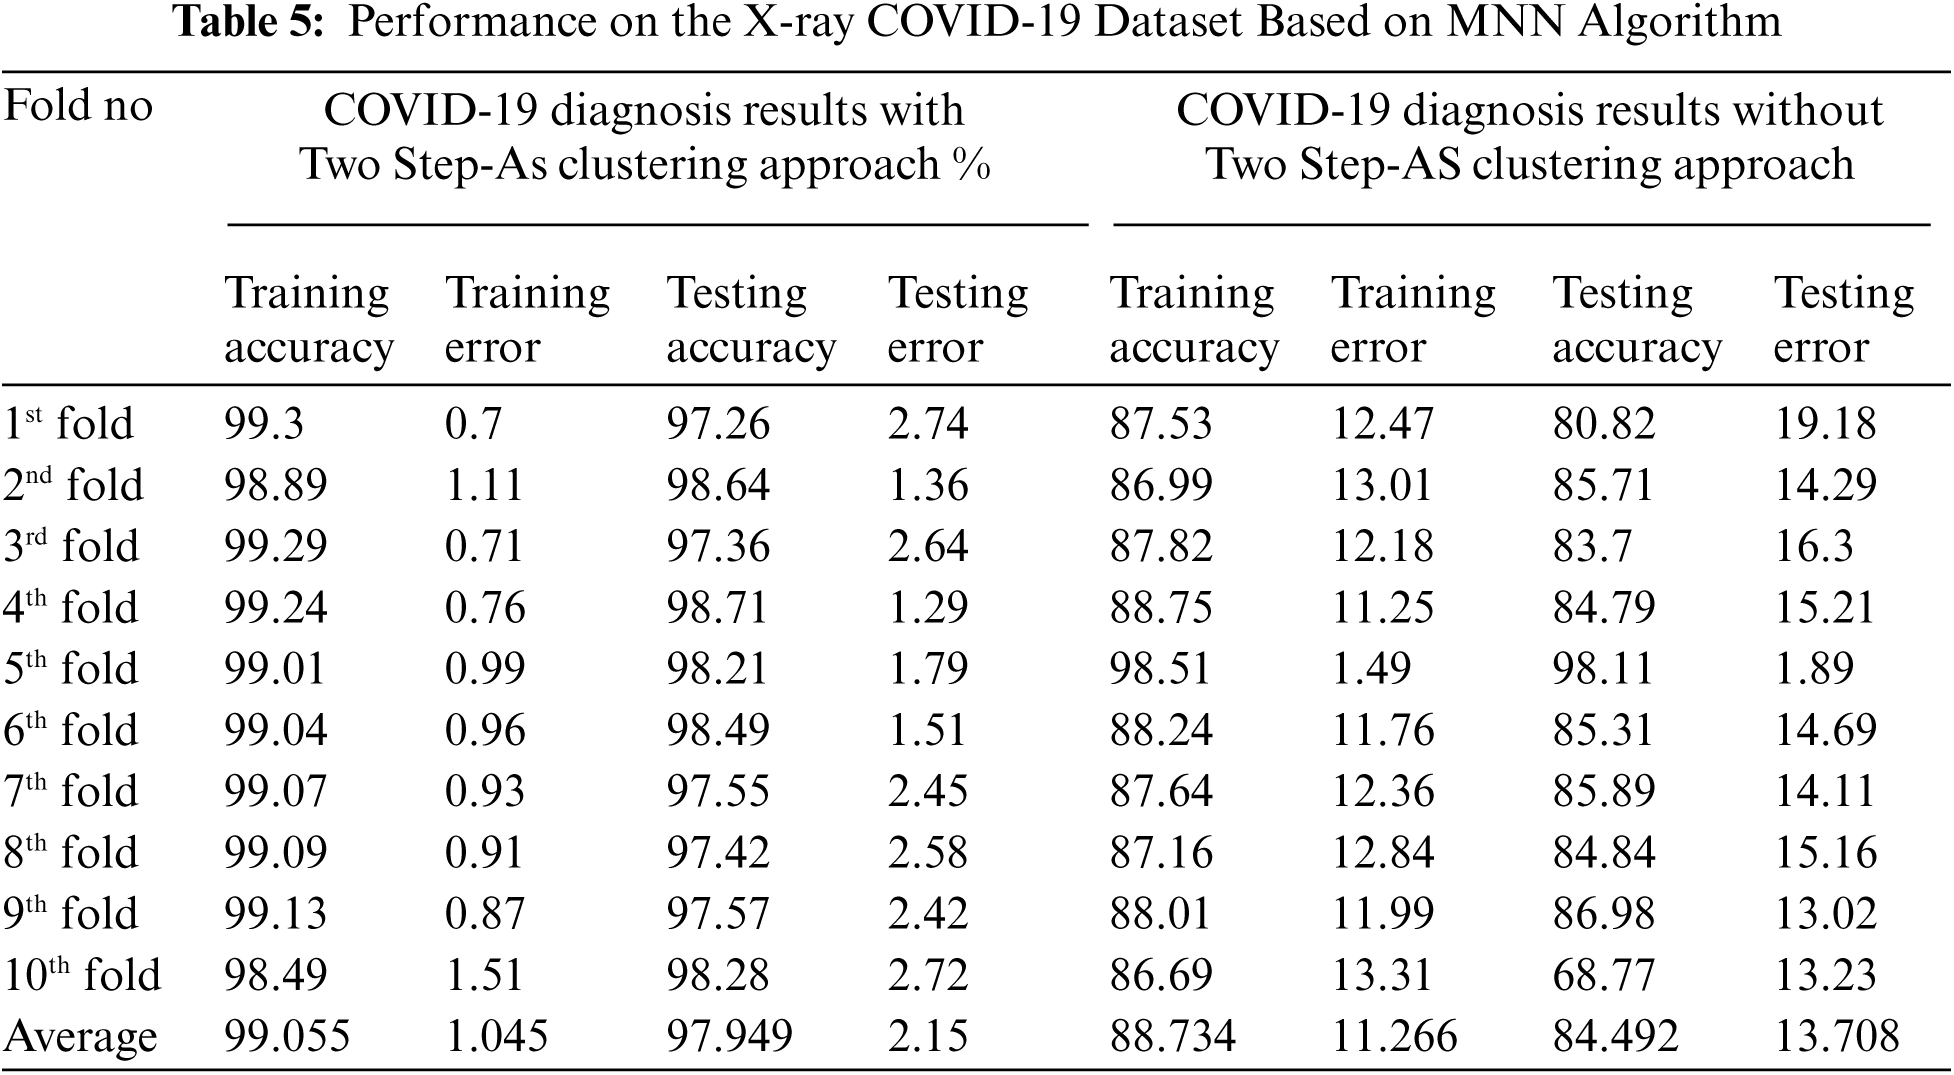
Figs. 4 and 5 and Tab. 5 show the output of the MNN throughout both the training and testing phases, both without and with clustering using Two-Step-AS Clustering. Cross-validation was performed 10 times, and the average classification results achieved by applying MNN without clustering are 88.73 percent for the training experiments and 84.492 percent for the testing experiments, according to the findings. The results of the MNN classifier with clustering using a Two Step-AS method are likewise shown in Tab. 6 and Fig. 5, with 99.055 percent accuracy in the training and 97.949 percent accuracy in the testing tests. The training and testing high-performance outcomes obtained in fold number 5 were accomplished without the use of clustering and had an accuracy ratio of 98.51 and 98.11 percent, respectively. In contrast, the low training and testing scores prediction results using clustering were obtained in folds number 10 and 1 with 86.69 and 80.82 percent, respectively.
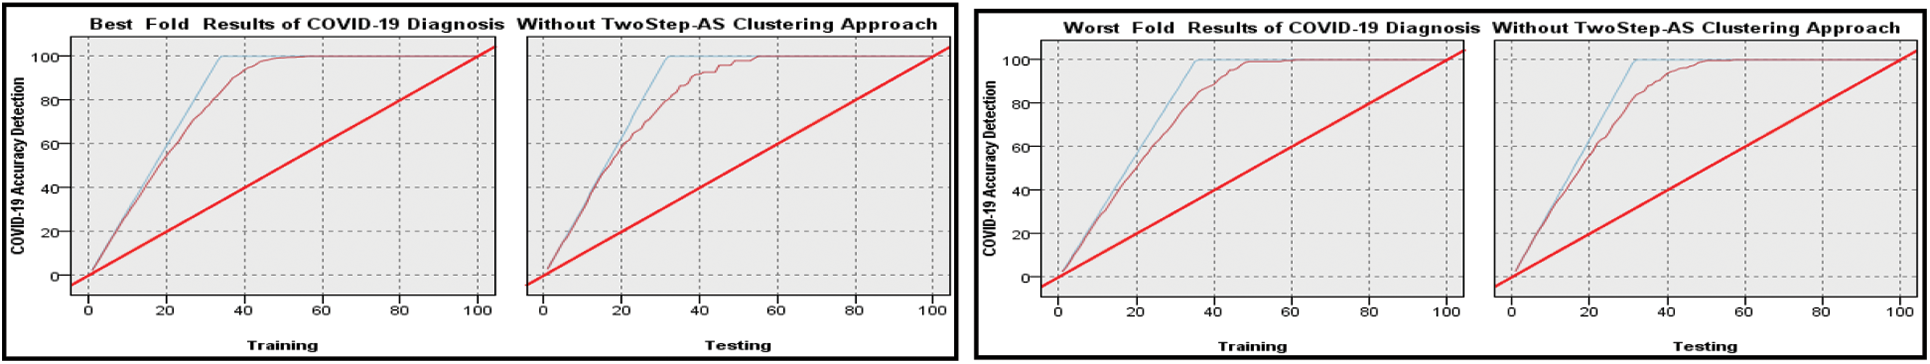
Figure 4: Best and Worst Performance COVID-19 accuracy diagnosis based on MNN algorithm without Two Step clustering approach
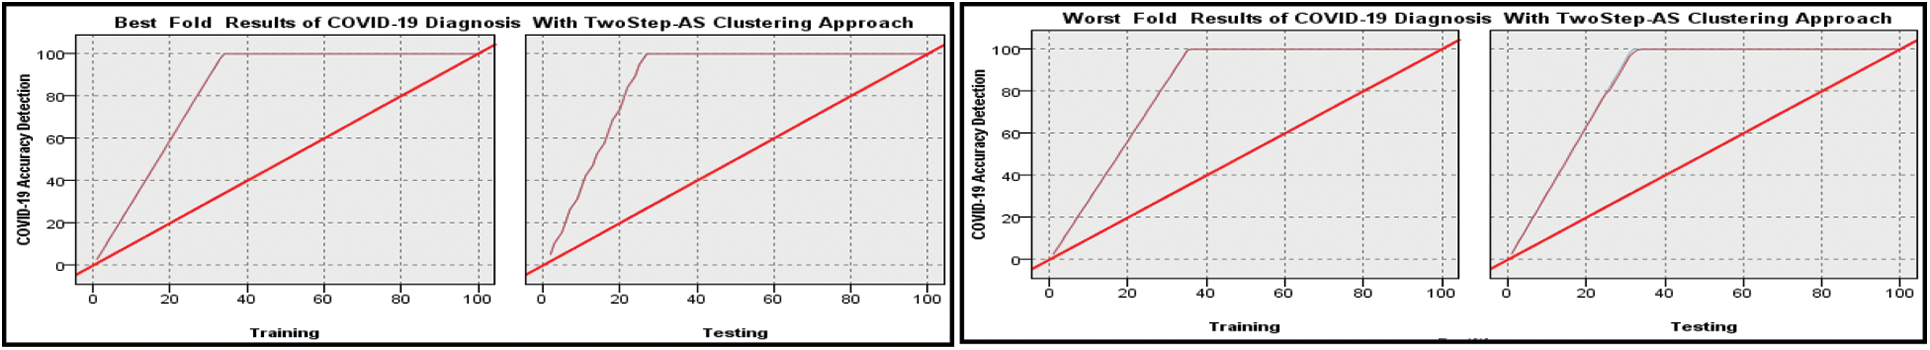
Figure 5: Best and worst performance COVID-19 accuracy detection based on MNN algorithm with Two Step clustering approach
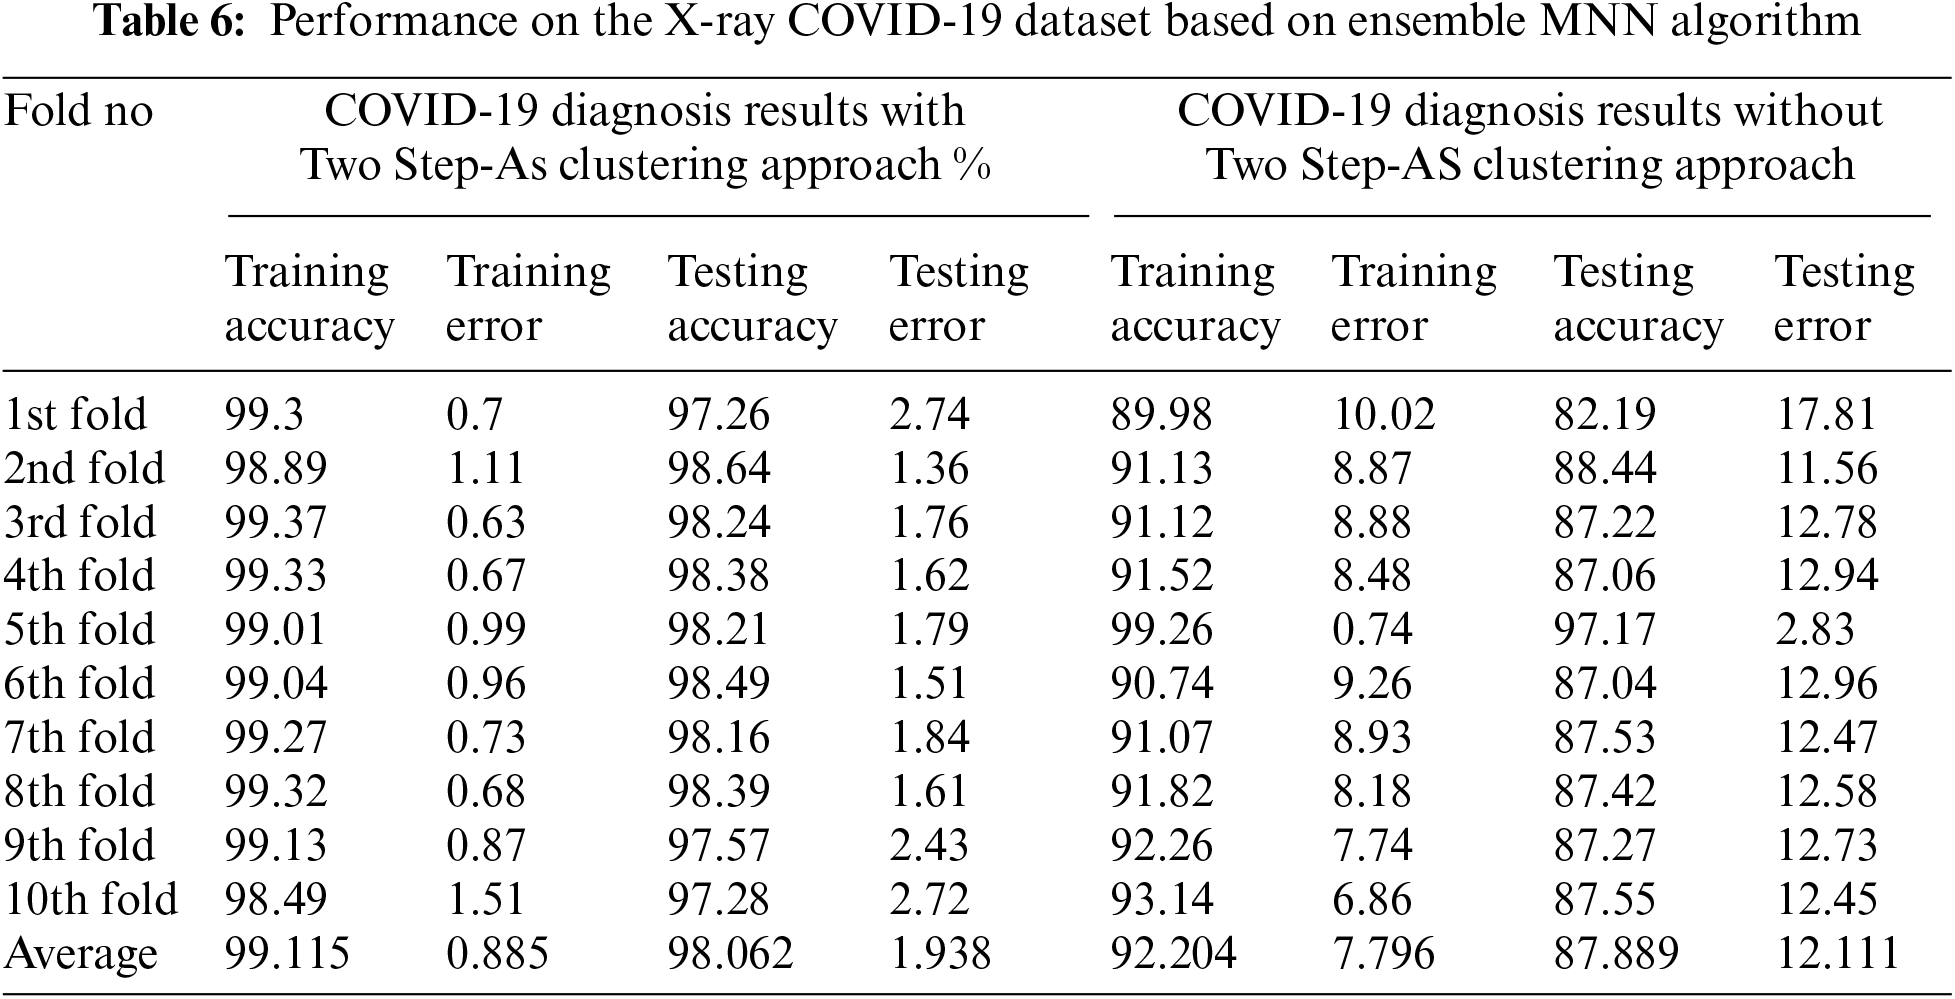
The high training and testing scores prediction results using clustering are obtained in folds number 1 and 4 with 99.3 and 98.71 percent, respectively. Where the low training and testing scores prediction results using clustering are obtained in fold number 10 with 98.49 and 98.28 percent, respectively. The conclusion is that when the Two Step-AS clustering method is used, there is an improvement in performance. When the MNN output is combined with the Two-Step-AS Clustering method, the results of the MNN with clustering are improved, and the accuracy of the breast cancer detection is increased. In addition, the performance on the X-ray COVID-19 dataset based on Ensemble MNN algorithm is demonstrated in Tab. 6 and Figs. 6 and 7.
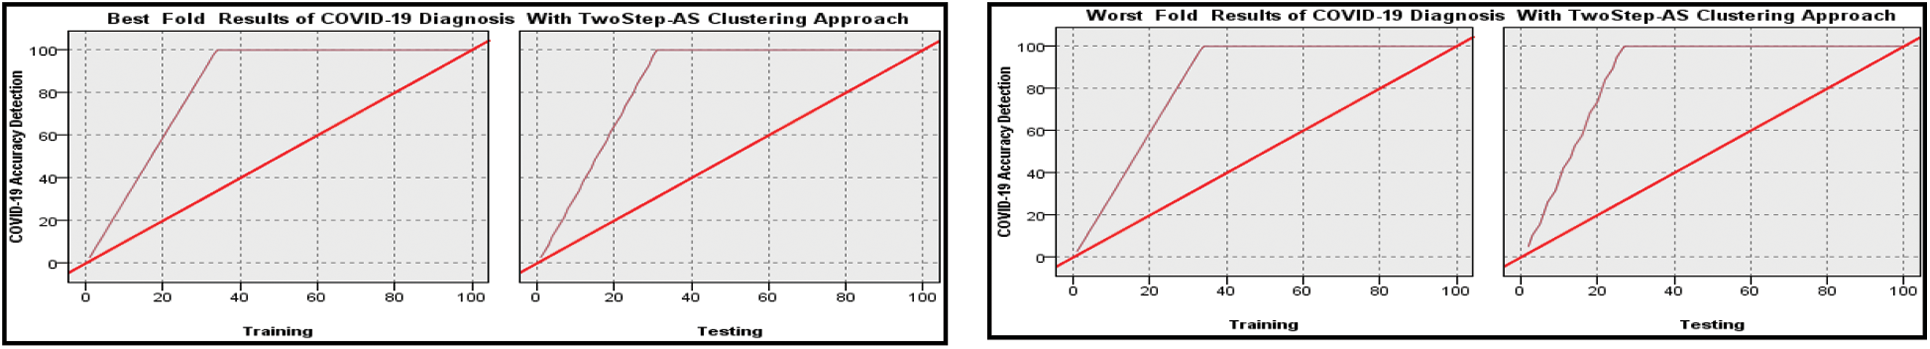
Figure 6: Best and worst performance COVID-19 accuracy detection based on ensemble MNN algorithm with Two Step clustering approach
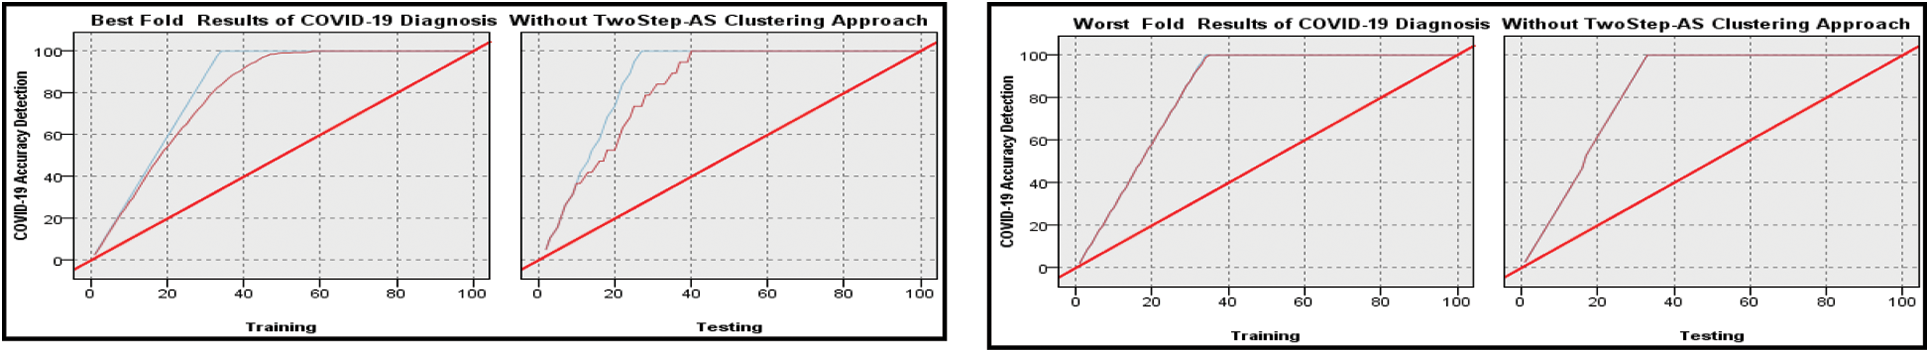
Figure 7: Best and worst performance COVID-19 accuracy detection based on ensemble MNN algorithm without Two Step clustering approach
The same scenario applied with MNN only was repeated with MNN with Ensemble Bootstrap aggregating classifier. The results are reported in Figs. 6 and 7, and it is shown the output performance in both training and testing phases with and without Two Step-AS clustering.
Cross-validation was performed 10 times, and the average classification results achieved by applying Ensemble MNN without clustering were 92.204 percent for the training experiments, and 87.889 percent for the testing experiments, according to the findings. The results of the Ensemble MNN classifier with clustering using Two Step-AS method are likewise shown in Tab. 7 and Fig. 6, with 99.115 percent accuracy in the training, and 98.062 percent accuracy in the testing tests. The training and testing high-performance outcomes obtained in fold number 5 were accomplished without the use of clustering and had an accuracy ratio of 99.26 and 97.17 percent, respectively. In contrast, the low training and testing scores prediction results using clustering were obtained in fold number 1 with 89.98 and 82.19 percent, respectively.
The high training and testing scores prediction results using clustering were obtained in folds number 3 and 2 with 99.37 and 98.64 percent, respectively. Where the low training and testing scores prediction results using clustering were obtained in folds number 10 and 1 with 98.49 and 97.26 percent, respectively. The conclusion is that when the Two Step-AS clustering method is used, there is an improvement in performance. When the MNN output is combined with the Two Step-AS clustering method, the results of the MNN with clustering are improved, and the accuracy of the breast cancer detection is increased.
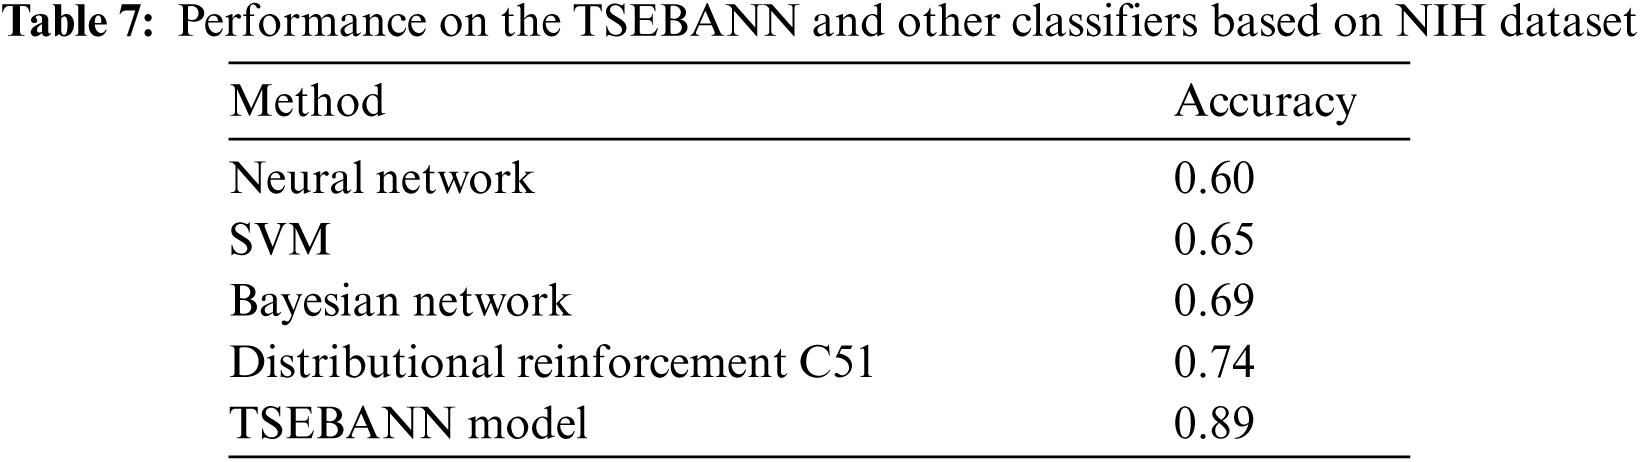
Another experiments based on the NIH dataset was inspected in order to examined the occurrence cases as either COVID-19, or not. The hybrid approach was used to train and evaluate the TSEBANN model and some of the classifiers methods to prove the strength of the proposed model. In addition, the classification accuracy of the hybrid technique was reported in Tab. 7.
In this study, the T-test algorithm determined statistical significance between the results obtained from the first experiment using MNN, and the results obtained from the second experiment using the Ensemble MNN method, and presented the enhancements obtained by employing the Two Step-AS technique. The T-test yielded a modest significance value (usually less than 0.05), indicating that there is a statistically significant difference between the two variables. Based on the acquired findings in Tabs. 8 and 9, which show that the significant values (0.000211 and 0.000008) is high, this requirement is highlighted in the evaluation measures developed. Therefore, the TSEBANN obtains statistically significant values when combined with Two Step-AS clustering algorithm.
Fig. 8 depicts a comparison between the TSEBANN method and existing techniques in use. The suggested TSEBANN achieved a high accuracy rating of 0.98 with its implementation.
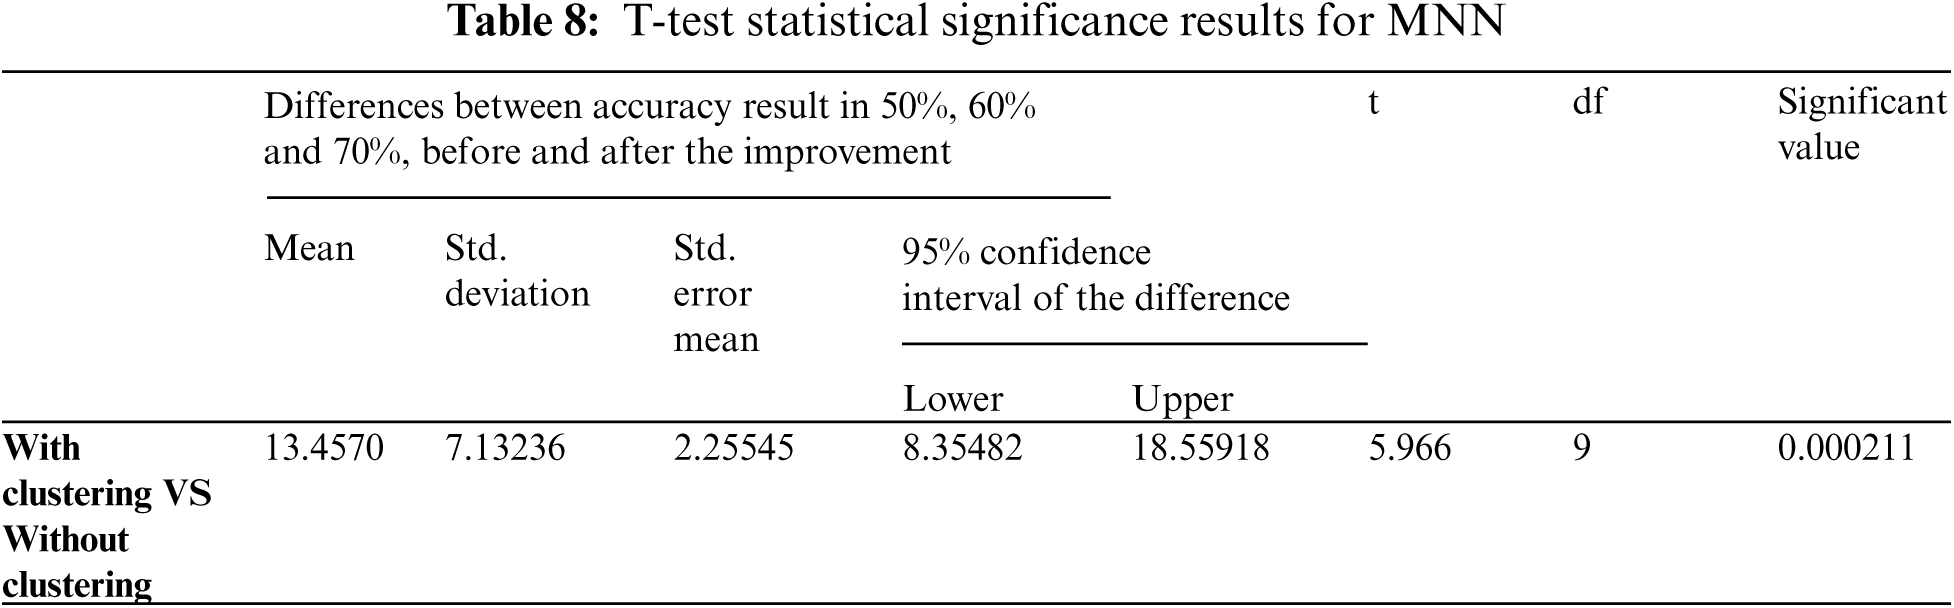
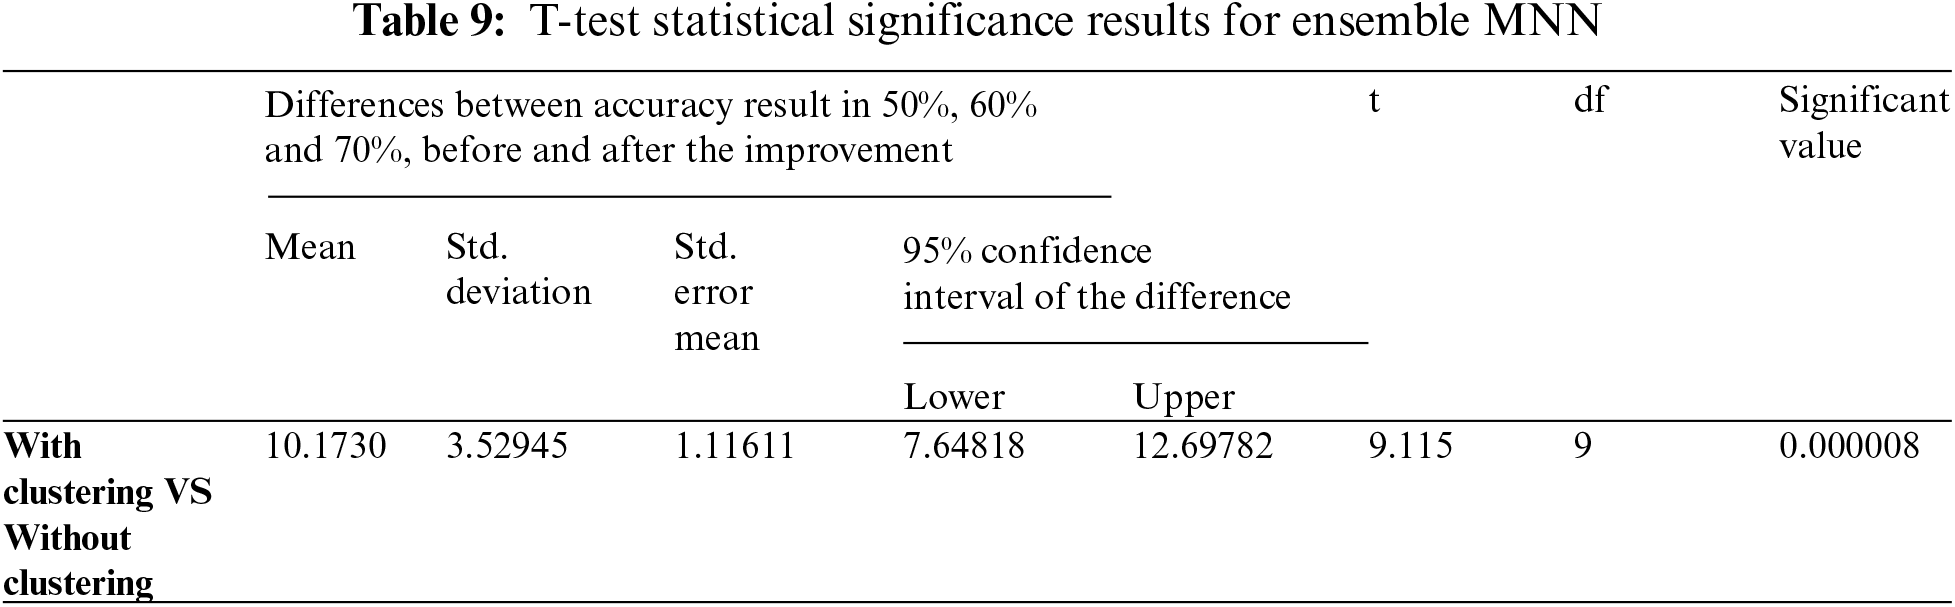
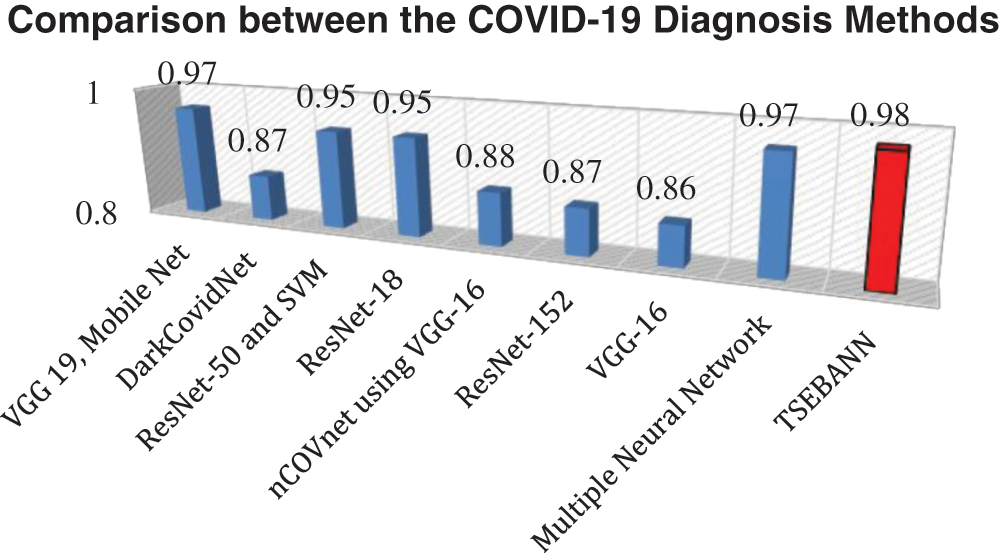
Figure 8: Comparison between the TSEBANN and current COVID-19 classifier
6 Conclusion and Future Directions
The present study is concerned with the development of a new Ensemble MNN-based Two Step-AS clustering method (TSEBNN) for the detection of Covid-19 and pneumonia patients. Clustering techniques are evident in a variety of areas that make use of big datasets in order to uncover hidden patterns in the data. However, because most data collected from the actual world includes both numerical and categorical characteristics, traditional clustering algorithms are unable to perform effectively on such datasets. We demonstrated that the Two Step-AS technique, which is simple to use and calculates the optimum number of clusters automatically, may be utilised to address this issue. With the TSEBNN, clinical cases are categorised into pneumonia, COVID-19 and normal cases, in the first stage. Furthermore, since Covid-19 is caused by a virus, all of the instances tested are divided into three groups–positive COVID-19, pneumonia and negative COVID-19 (normal)–using TSEBNN during the second stage of diagnosis. It is the goal of the TSEBNN method to offer a quick, systematic and reliable computer-aided solution for the description of Covid-19 cases to patients who are admitted to hospitals and undergo initial screening with an X-ray scan of their chest. Inclusive assessments have been carried out to show the efficacy of the suggested approach, using both learning and testing process and tenfold cross validation approach to illustrate the effectiveness of the TSEBNN method. Additionally, a number of tests have been carried out to show the superiority of the TSEBNN in identifying Covid-19 instances when compared to the other Covid-19 methods discussed in state-of-the-art research. Several initiatives might be undertaken in the future to improve on the current performance. A higher-level CNN techniques and different data mining models might be used to more precisely increase the detection of the positive covid-19 from the chest x-ray and CT-scan images. We have the option of rearranging the size of the supplied images. In order to increase the performance even more, machine learning-based image segmentation should be considered. However, to enhance the superiority of the prediction approach in COVID-19 illness, optimising methods based on regression and classification algorithms will be used in conjunction.
Funding Statement: This work was funded by the Deanship of Scientific Research (DSR) at King Abdulaziz University, Jeddah, Saudi Arabia, under Grant No. (DF-770830-1441). The author, therefore, gratefully acknowledge the technical and financial support from the DSR.
Conflicts of Interest: The author declare that they have no conflicts of interest to report regarding the present study.
1. J. Cui, F. Li and Z. -L. Shi, “Origin and evolution of pathogenic coronaviruses,” Nature Reviews Microbiology, vol. 17, pp. 181–192, 2019. [Google Scholar]
2. R. Tiwari, K. Dhama, K. Sharun, M. Iqbal Yatoo, Y. S. Malik et al., “COVID-19: Animals, veterinary and zoonotic links,” Veterinary Quarterly, vol. 40, pp. 169–182, 2020. [Google Scholar]
3. B. Caballero, P. Finglas and F. Toldrá, in Encyclopedia of Food and Health, Kidlington, Oxford, Waltham, MA: Academic Press, 2015. [Google Scholar]
4. C. Orbann, L. Sattenspiel, E. Miller and J. Dimka, “Defining epidemics in computer simulation models: How do definitions influence conclusions?” Epidemics, vol. 19, pp. 24–32, 2017. [Google Scholar]
5. A. M. Zaki, S. Van Boheemen, T. M. Bestebroer, A. D. Osterhaus and R. A. Fouchier, “Isolation of a novel coronavirus from a man with pneumonia in Saudi Arabia,” New England Journal of Medicine, vol. 367, pp. 1814–1820, 2012. [Google Scholar]
6. M. Moriyama, W. J. Hugentobler and A. Iwasaki, “Seasonality of respiratory viral infections,” Annual Review of Virology, vol. 7, pp. 83–101, 2020. [Google Scholar]
7. H. A. Rothan and S. N. Byrareddy, “The epidemiology and pathogenesis of coronavirus disease (COVID-19) outbreak,” Journal of Autoimmunity, vol. 109, pp. 102433, 2020. [Google Scholar]
8. F. Zhou, T. Yu, R. Du, G. Fan, Y. Liu et al., “Clinical course and risk factors for mortality of adult inpatients with COVID-19 in Wuhan, China: A retrospective cohort study,” The Lancet, vol. 395, pp. 1054–1062, 2020. [Google Scholar]
9. I. Guyon and A. Elisseeff, “An introduction to variable and feature selection,” Journal of Machine Learning Research, vol. 3, pp. 1157–1182, 2003. [Google Scholar]
10. P. Groves, B. Kayyali, D. Knott and S. V. Kuiken, “The ‘big data’ revolution in healthcare: Accelerating value and innovation,” 2016. [Online]. Available:https://www.mckinsey.com/insights/health_systems/~/media/7764A72F70184C8EA88D805092D72D58.ashx. Accessed November 22 2021. [Google Scholar]
11. T. Ozturk, M. Talo, E. A. Yildirim, U. B. Baloglu, O. Yildirim et al., “Automated detection of COVID-19 cases using deep neural networks with X-ray images,” Computers in Biology and Medicine, vol. 121, pp. 103792, 2020. [Google Scholar]
12. H. Shi, X. Han, N. Jiang, Y. Cao, O. Alwalid et al., “Radiological findings from 81 patients with COVID-19 pneumonia in Wuhan, China: A descriptive study,” The Lancet Infectious Diseases, vol. 20, pp. 425–434, 2020. [Google Scholar]
13. Z. Y. Zu, M. D. Jiang, P. P. Xu, W. Chen, Q. Q. Ni et al., “Coronavirus disease 2019 (COVID-19A perspective from China,” Radiology, vol. 296, pp. E15–E25, 2020. [Google Scholar]
14. A. Janosi, W. Steinbrunn, M. Pfisterer and R. Detrano, “UCI machine learning repository-heart disease data set,” in School Information Computer Science, University California, Irvine, CA, USA: University California, 1988. [Google Scholar]
15. J. P. Kanne, B. P. Little, J. H. Chung, B. M. Elicker and L. H. Ketai, “Essentials for radiologists on COVID-19: An update radiology scientific expert panel,” ed: Radiological Society of North America, 2020. [Google Scholar]
16. X. Xie, Z. Zhong, W. Zhao, C. Zheng, F. Wang et al., “Chest CT for typical coronavirus disease 2019 (COVID-19) pneumonia: Relationship to negative RT-PCR testing,” Radiology, vol. 296, pp. E41–E45, 2020. [Google Scholar]
17. E. Y. Lee, M. -Y. Ng and P. -L. Khong, “COVID-19 pneumonia: What has CT taught us?” The Lancet Infectious Diseases, vol. 20, pp. 384–385, 2020. [Google Scholar]
18. F. Pan, T. Ye, P. Sun, S. Gui, B. Liang et al., “Time course of lung changes on chest CT during recovery from 2019 novel coronavirus (COVID-19) pneumonia,” Radiology, vol. 295, no. 3, pp. 715–721, 2020. [Google Scholar]
19. C. Long, H. Xu, Q. Shen, X. Zhang, B. Fan et al., “Diagnosis of the coronavirus disease (COVID-19rRT-PCR or CT?” European Journal of Radiology, vol. 126, pp. 108961, 2020. [Google Scholar]
20. A. Bernheim, X. Mei, M. Huang, Y. Yang, Z. A. Fayad et al., “Chest CT findings in coronavirus disease-19 (COVID-19Relationship to duration of infection,” Radiology, vol. 119, no. 5, pp. 200463, 2020. [Google Scholar]
21. W. Kong and P. P. Agarwal, “Chest imaging appearance of COVID-19 infection,” Radiology: Cardiothoracic Imaging, vol. 2, pp. e200028, 2020. [Google Scholar]
22. K. McIntosh, M. S. Hirsch and A. Bloom, “Coronavirus disease 2019 (COVID-19),” UpToDate Hirsch MS Bloom, vol. 5, 2020. https://www.uptodate.com/contents/coronaviruses. [Google Scholar]
23. J. Rasheed, A. Jamil, A. A. Hameed, U. Aftab, J. Aftab et al., “A survey on artificial intelligence approaches in supporting frontline workers and decision makers for COVID-19 pandemic,” Chaos, Solitons & Fractals, pp. 110337, 2020. [Google Scholar]
24. P. K. Sethy, S. K. Behera, P. K. Ratha and P. Biswas, “Detection of coronavirus disease (covid-19) based on deep features and support vector machine,” International Journal of Mathematical Engineering and Management Sciences, vol. 5, pp. 643–651, 2020. [Google Scholar]
25. Y. Song, S. Zheng, L. Li, X. Zhang, X. Zhang et al., “Deep learning enables accurate diagnosis of novel coronavirus (COVID-19) with CT images,” IEEE/ACM Transactions on Computational Biology and Bioinformatics, vol. 18 no. 6, pp. 2775–2780, 2021. [Google Scholar]
26. I. D. Apostolopoulos and T. A. Mpesiana, “Covid-19: Automatic detection from x-ray images utilizing transfer learning with convolutional neural networks,” Physical and Engineering Sciences in Medicine, vol. 43, pp. 635–640, 2020. [Google Scholar]
27. S. H. Yoo, H. Geng, T. L. Chiu, S. K. Yu, D. C. Cho et al., “Deep learning-based decision-tree classifier for COVID-19 diagnosis from chest X-ray imaging,” Frontiers in Medicine, vol. 7, pp. 427, 2020. [Google Scholar]
28. H. Panwar, P. Gupta, M. K. Siddiqui, R. Morales-Menendez and V. Singh, “Application of deep learning for fast detection of COVID-19 in X-rays using nCOVnet,” Chaos, Solitons & Fractals, vol. 138, pp. 109944, 2020. [Google Scholar]
29. S. Albahli, “A deep neural network to distinguish covid-19 from other chest diseases using x-ray images,” Current Medical Imaging, vol. 17, pp. 109–119, 2021. [Google Scholar]
30. J. Civit-Masot, F. Luna-Perejón, M. Domínguez Morales and A. Civit, “Deep learning system for COVID-19 diagnosis aid using X-ray pulmonary images,” Applied Sciences, vol. 10, pp. 4640, 2020. [Google Scholar]
31. R. H. Abiyev and M. K. S. Ma'aitah, “Deep convolutional neural networks for chest diseases detection,” Journal of Healthcare Engineering, pp. 1–11, 2018. https://doi.org/10.1155/2018/4168538. [Google Scholar]
32. Z. Tariq, S. K. Shah and Y. Lee, “Lung disease classification using deep convolutional neural network,” in 2019 IEEE Int. Conf. on Bioinformatics and Biomedicine (BIBM), San Diego, CA, USA, 2019, pp. 732–735. [Google Scholar]
33. J. P. Cohen, P. Morrison, L. Dao, K. Roth, T. Q. Duong et al., “Covid-19 image data collection: Prospective predictions are the future,” arXiv preprint arXiv:2006.11988, 2020. [Google Scholar]
34. L. Nanni, S. Ghidoni and S. Brahnam, “Handcrafted vs. non-handcrafted features for computer vision classification,” Pattern Recognition, vol. 71, pp. 158–172, 2017. [Google Scholar]
35. Y. M. Costa, L. S. Oliveira and C. N. Silla Jr, “An evaluation of convolutional neural networks for music classification using spectrograms,” Applied Soft Computing, vol. 52, pp. 28–38, 2017. [Google Scholar]
36. B. Sebastian V, A. Unnikrishnan and K. Balakrishnan, “Gray level co-occurrence matrices: Generalisation and some new features,” arXiv preprint arXiv:1205.4831, 2012. [Google Scholar]
37. A. H. Osman, H. M. Aljahdali, S. M. Altarrazi and A. Ahmed, “SOM-LWL method for identification of COVID-19 on chest X-rays,” PLoS One, vol. 16, pp. e0247176, 2021. [Google Scholar]
38. A. Najjar, C. Gagné and D. Reinharz, “Two-step heterogeneous finite mixture model clustering for mining healthcare databases,” in 2015 IEEE Int. Conf. on Data Mining, Atlantic City, NJ, USA, 2015, pp. 931–936. [Google Scholar]
39. P. Smyth, “Probabilistic model-based clustering of multivariate and sequential data,” in Proc. of the Seventh Int. Workshop on AI and Statistics, Fort Lauderdale, FL, USA, 1999, pp. 299–304. [Google Scholar]
40. V. Deneshkumar, K. Senthamaraikannan and M. Manikandan, “Identification of outliers in medical diagnostic system using data mining techniques,” International Journal of Statistics and Applications, vol. 4, pp. 241–248, 2014. [Google Scholar]
41. L. Kaufman and P. J. Rousseeuw, Finding Groups in Data: An Introduction to Cluster Analysis, vol. 344, John Wiley & Sons, Hoboken, New Jerse, 2009. [Google Scholar]
42. J. Bacher, W. Knut and M. Vogler, “SPSS Two Step Cluster-a first evaluation,” no. 23, 2004. https://www.ssoar.info/ssoar/handle/document/32715. [Google Scholar]
43. K. Potdar and R. Kinnerkar, “A comparative study of machine learning algorithms applied to predictive breast cancer data,” International Journal of Science and Research, vol. 5, pp. 1550–1553, 2016. [Google Scholar]
44. Y. Yang and J. O. Pedersen, “A comparative study on feature selection in text categorization,” in The Fourteenth International Conference on Machine Learning (ICML 1997), Nashville, Tennessee, USA, 1997, p. 35. [Google Scholar]
45. R. Agrawal and R. Srikant, “Fast algorithms for mining association rules,” in Proc. 20th Int. Conf. of Very Large Data Dases, VLDB, San Francisco, CA, United States, 1994, pp. 487–499. [Google Scholar]
46. A. Cruz-Roa, H. Gilmore, A. Basavanhally, M. Feldman, S. Ganesan et al., “Accurate and reproducible invasive breast cancer detection in whole-slide images: A deep learning approach for quantifying tumor extent,” Scientific Reports, vol. 7, pp. 1–14, 2017. [Google Scholar]
47. A. H. Osman and H. M. A. Aljahdali, “An effective of ensemble boosting learning method for breast cancer virtual screening using neural network model,” IEEE Access, vol. 8, pp. 39165–39174, 2020. [Google Scholar]
48. W. H. Beluch, T. Genewein, A. Nürnberger and J. M. Köhler, “The power of ensembles for active learning in image classification,” in Proc. of the IEEE Conf. on Computer Vision and Pattern Recognition, Salt Lake City, UT, USA, 2018, pp. 9368–9377. [Google Scholar]
49. A. Ortiz, J. Munilla, J. M. Gorriz and J. Ramirez, “Ensembles of deep learning architectures for the early diagnosis of the Alzheimer's disease,” International Journal of Neural Systems, vol. 26, pp. 1650025, 2016. [Google Scholar]
50. J. F. Diez-Pastor, A. G. Del Val, F. Veiga and A. Bustillo, “High-accuracy classification of thread quality in tapping processes with ensembles of classifiers for imbalanced learning,” Measurement, vol. 168, pp. 108328, 2021. [Google Scholar]
51. K. El Asnaoui, “Design ensemble deep learning model for pneumonia disease classification,” International Journal of Multimedia Information Retrieval, vol. 10, pp. 55–68, 2021. [Google Scholar]
52. F. Ahmad, A. Farooq and M. U. Ghani, “Deep ensemble model for classification of novel coronavirus in chest X-ray images,” Computational Intelligence and Neuroscience, vol. 2021, pp. 1–17, 2021. [Google Scholar]
53. A. K. Das, S. Ghosh, S. Thunder, R. Dutta, S. Agarwal et al., “Automatic COVID-19 detection from X-ray images using ensemble learning with convolutional neural network,” Pattern Analysis and Applications, vol. 24, pp. 1–24, 2021. [Google Scholar]
54. X. Wang, Y. Peng, L. Lu, Z. Lu, M. Bagheri et al., “Chestx-ray8: Hospital-scale chest x-ray database and benchmarks on weakly-supervised classification and localization of common thorax diseases,” in Proc. of the IEEE Conf. on Computer Vision and Pattern Recognition, Honolulu, HI, USA, 2017, pp. 2097–2106. [Google Scholar]
55. J. Dougherty, R. Kohavi and M. Sahami, “Supervised and unsupervised discretization of continuous features,” in Machine Learning Proceedings 1995, ed: Elsevier, 1995, pp. 194–202. [Google Scholar]
56. Y. Yang and G. I. Webb, “A comparative study of discretization methods for naive-Bayes classifiers,” in Proc. of Principle and Practice of Data and Knowledge Acquisition Workshop (PKAW), Tokyo, Japan, pp. 159–173, 2002. [Google Scholar]
57. T. Chiu, D. Fang, J. Chen, Y. Wang and C. Jeris, “A robust and scalable clustering algorithm for mixed type attributes in large database environment,” in Proc. of the Seventh ACM SIGKDD Int. Conf. on Knowledge Discovery and Data Mining, San Francisco, Ca, USA, 2001, pp. 263–268. [Google Scholar]
58. C. Michailidou, P. Maheras, A. Arseni-Papadimititriou, F. Kolyva-Machera and C. Anagnostopoulou, “A study of weather types at Athens and Thessaloniki and their relationship to circulation types for the cold-wet period, part I: Two-step cluster analysis,” Theoretical and Applied Climatology, vol. 97, pp. 163–177, 2009. [Google Scholar]
59. S. Satish and S. Bharadhwaj, “Information search behaviour among new car buyers: A two-step cluster analysis,” Indian Institute of Management Bangalore IIMB Management Review, vol. 22, pp. 5–15, 2010. [Google Scholar]
 | This work is licensed under a Creative Commons Attribution 4.0 International License, which permits unrestricted use, distribution, and reproduction in any medium, provided the original work is properly cited. |