DOI:10.32604/cmc.2022.024212
| Computers, Materials & Continua DOI:10.32604/cmc.2022.024212 | |
| Article |
A New Handover Management Model for Two-Tier 5G Mobile Networks
1Department of Computer Science and Engineering, Bangladesh University, Dhaka, 1207, Bangladesh
2Discipline of IT, Media and Communications, Murdoch University, Perth, WA, 6150, Australia
3Department of Computer Science, College of Computers and Information Technology, Taif University, Taif, 21944, Saudi Arabia
4Faculty of Informatics, AUE-FON University, Skopje, Republic of North Macedonia
*Corresponding Author: Mohammad Arifin Rahman Khan. Email: arifin.khan@bu.edu.bd
Received: 09 October 2021; Accepted: 29 November 2021
Abstract: There has been an exponential rise in mobile data traffic in recent times due to the increasing popularity of portable devices like tablets, smartphones, and laptops. The rapid rise in the use of these portable devices has put extreme stress on the network service providers while forcing telecommunication engineers to look for innovative solutions to meet the increased demand. One solution to the problem is the emergence of fifth-generation (5G) wireless communication, which can address the challenges by offering very broad wireless area capacity and potential cut-power consumption. The application of small cells is the fundamental mechanism for the 5G technology. The use of small cells can enhance the facility for higher capacity and reuse. However, it must be noted that small cells deployment will lead to frequent handovers of mobile nodes. Considering the importance of small cells in 5G, this paper aims to examine a new resource management scheme that can work to minimize the rate of handovers for mobile phones through careful resources allocation in a two-tier network. Therefore, the resource management problem has been formulated as an optimization issue that we aim to overcome through an optimal solution. To find a solution to the existing problem of frequent handovers, a heuristic approach has been used. This solution is then evaluated and validated through simulation and testing, during which the performance was noted to improve by 12% in the context of handover costs. Therefore, this model has been observed to be more efficient as compared to the existing model.
Keywords: Two-tier mobile networks; small cell densification; management of mobility; handover cost; average throughput; power consumption
Information and Communication Technology (ICT) make significant use of wireless technologies for communication. In this area, the penetration rate of wireless communication over 88% has been observed [1]. As per the Cisco Traffic Visual Networking Index-2017 [2], it is anticipated that the amount of mobile data usage will increase in the coming years. Also, it is likely that the most popular application, which includes social media applications, video applications, and information applications, will need increased data and reduced latency to run effectively [3]. For network service providers, this surge in demand is a huge concern. Telecommunication engineers are actively looking for novel ways to meet the significant challenge of resource scarcity in this respect. As a result, specialists working on the creation of an improved wireless standard, commonly referred to as the fifth-generation (5G) wireless standard, are focusing on energy-efficient and spectrum-efficient technologies [4].
4G has been a successful wireless standard as it has a penetration rate that reaches over 85% in developed areas of the world [5]. However, it is vital to remember that 4G is a wireless broadband technology that not only relies on voice or data communication [6,7]. The technical versions of 4G and 5G are distinct as the leading cause of 5G is based on the exponential rise in mobiles and other portable devices with an increasing demand for new applications for high bandwidth [3–8]. Therefore, 5G mobile network provides not only a higher data speed but also higher capacity, lower latency, and dense deployment of wireless hosts, as compared to previous mobile technologies. In addition to this, 5G can facilitate eight trillion mobile connection and wireless devices, which are used by over eight billion population. Moreover, the use of the Internet of Things (IoT) and the Internet of Everything technologies will be enhanced through the application of a 5G mobile network. However, mobility management will prove to be a huge technical issue due to the dense deployment of tiny cells and the popularity of vehicle applications.
5G PPP (5G infrastructure public-private partnership) has developed key values that include different types of services and upgraded wireless zone capacity. Also, another important benefit of 5G technology is that it has improved energy efficiency. The concept of 5G technology is different from previous communication technologies, which worked on macro cells, while 5G aims for the deployment of smaller cells with smaller coverage areas [9]. On the contrary, the concept of wired optical links has been designed for backhauling the local data to enhance the capacity. Through this practice, a high-frequency reuse per unit area has been enabled [10,11]. The studies [12,13] have presented that in response to temporal variation of loads, careful allocation of resources helps save a considerable amount of energy in dense two-tier networks.
The concept of small cells also poses a challenge for 5G networks as they offer a small area of coverage that has more frequent handovers. This challenge requires effective cell management; otherwise, improperly configured connection drop-outs along with an increased number of handovers can cause problems in the provision of solid Quality of Service (QoS). The emergence of advanced technologies like smart cities and smart vehicles are other challenges for 5G networks that increase the chance of frequent handovers and connection drop-outs. Besides, safety is an important aspect of this type of technology so that secured 5G services are provided to mobile users [14–16]. Therefore, in this study, this challenge has been addressed through a proposed resource management scheme that has the potential to reduce the handover rates in a two-tier network. The solution presented in this research is based on the hypothesis that larger cells should support the high mobility mobile nodes in order to minimize the handover rate. This hypothesis has been made with the condition that enough available resources can be provided to all mobile nodes (mobile and fixed) to satisfy their needs of Quality of Service (QoS) in the communication network. In this paper, the problem has been formulated as a multi-objective optimization challenge that aims to minimize the number of handovers and power consumption. In summary, we have made the following contribution in our paper: 1) We propose a new handover management model through careful resource allocation for a two-tier 5G communication network. 2) The resource management challenge is developed by a problem of multi-objective optimization where the main aim is to reduce the number of handovers and power consumption and increase average throughput. 3) The performance results of our proposed optimization model are provided in comparison with a heuristic algorithm.
This paper has been structured into different sections, where Section 2 conducts a review of literature relevant to this area of study. 5G's two-tier network model has been explained in Section 3, along with the formulation of the problem and proposition of the resource management method. Further, Section 4 also includes a description of the suggested optimization model for 5G (Fifth Generation) two-tier networks. Section 5 presents the calculation model for calculating the cost of handover and the average throughput, whereas Section 6 validates the suggested model. Finally, Sections 6.1 and 6.2 have discussed the numerical results, and the conclusion of the research has been made in Section 7.
Two-tier networks, having the combination of macro and small cells, could be used for increasing the data speed at hotspots. Such type of combination results in a negative effect that is usually in the form of an increased number of handovers. This is mainly due to the smaller coverage of the small cells [17]. Due to this problem, a number of studies have been carried out for minimizing handovers. In particular, in Zhang et al. [18], have studied the procedure of decreasing handovers in macro-femto cells. Likewise, in [19], researchers studied the procedure of minimizing vertical handovers and the overall packet delay in mobile downlink communication's two-tier architecture. Authors in [20] proposed a new prediction scheme dependent on scanning all signal quality between the mobile user and all neighbouring stations in the surrounding areas. This scheme minimizes the redundant handover numbers. In [21], the authors presented the relationship between the load of SDN (Software-Defined Networking) controller and handover delay. They showed that handover delay is prolonged during an over-loading state and suggested applying a load balancing mechanism as a countermeasure. However, in [22] researchers suggested certain algorithms for reducing the unnecessary number of vertical handovers and optimizing the load of the given heterogeneous networks. In this account, the analysis of the handovers to WLAN from UMTS and vice versa were conducted by using the Mamdani fuzzy logic method, which was carried out by the researchers in [23,24]. On the other hand, in [25], the researchers conducted a study to improve the triggering time and handover margin, and for this purpose, a self-optimizing algorithm was used. In [26], the researchers optimized the soft-metric mechanism and handover by considering different user speeds. It was found that the handover rates and mobility depend on the user speed. Besides, [27–29] also found high-speed users in railways and vehicles as an interesting area of research. However, in [30,31] authors paid attention to the management of user's mobility management, with limited paths. It is important to note that the studies, having frequent high-speed user's handovers, are found to be one of the challenging research areas that need special attention.
The analysis of the previous literature has revealed that for small and macro cells, BS density is the most significant variable—particularly for measuring the capacity of the 5G communication network. It is majorly due to the swift increase in the number of user equipment (UE). More specifically, some studies carried out their investigation and simulations of the low-density cells (2 MBS/km2) [27]. In contrast, [32] utilized moderate cell density (30–100 BS/km2). On the other hand, [33] considered high density for a small cell around 400 BS/km2. However, other researchers, i.e., [32] and [34–36], also considered the density of user equipment for analyzing the impact on the probability of coverage and the average throughput that is also influenced by UE's velocity as well as its moving trajectory.
It was suggested by [32] to avoid frequent handover for high-speed mobile nodes, particularly by ensuring their controlling through MBS besides the existence of such smaller cells that have higher/improved SINR. However, in [32], the researcher considered that mobile nodes hold enough resources. It is essential to observe that power's consideration in two-tier networks requires a minimum number of active small cells. Based on these findings, it can be articulated that high efficiency of power can only be achieved in a situation when the users are not served by the small cells but by MBS [12,13]. As a result, an energy-efficiency network first tries to use the MBS spectrum, thereby avoiding leaving enough resources for the nodes of mobile until the deployment of other mechanisms. The present study aims to propose a mechanism that could assist in minimizing both the handover and the consumption of power.
5G mobile network with a 2-tier architecture is researched in this paper as it is presented in Fig. 1. The deployed scenario has two tiers: A macro cell tier and a microcell tier. One macro cell is included in the macro cell tier, and a set of micro cells,
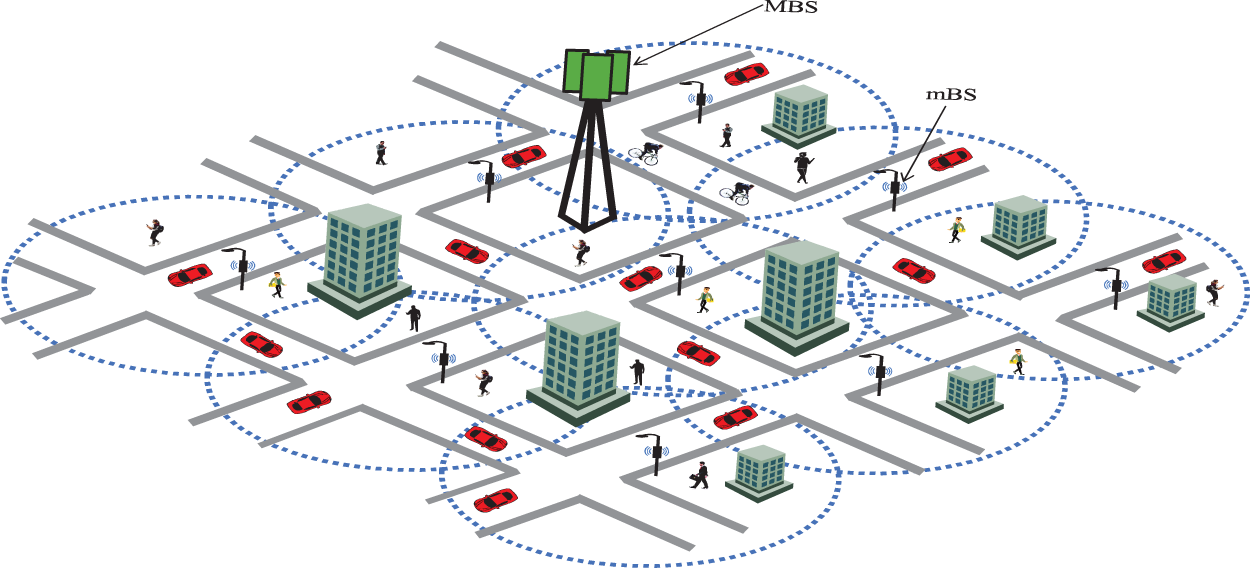
Figure 1: Model of two-tier communication networks for the generation of 5G
Regarding the simulated traffic in the simulated scenario, three types of traffic are used, CBR (constant bit rate), VBR (variable bit rate), and BE (best effort). Total network traffic demand denoted by D is presented in the Eq. (1), where D is the demand for the total network, and
Spectral efficiency should be determined for obtaining the bandwidth, which is the parameter needed to assess the demand (D). CCDF (complementary cumulative distribution function) is the factor that specifies the SINR (Signal to Noise Ratio) coverage probability
If the exponents of uniform path loss
Furthermore, Eq. (3) gives the microcell users coverage [27]:
In the Eqs. (2) and (3)
Spectral efficiency denoted by SE could be determined by the coverage probability as it is presented in Eq. (4) [27]:
The Eq. (5) represents microcell users’ spectral efficiency [27]:
The equation in (6) gives microcell users spectral efficiency [27]:
In order to satisfy the user demands, the two-tier network should fulfill this condition which has explained by the equation of (7):
The two-tier mobile networks that tend to satisfy the green communication condition connect all types of users to the macro base station if the macro base station capacity (
Hence, the challenge for research is to distribute the resources in the macro and micro cells in a way that vehicular users will experience minimum handovers while keeping at the same time the QoS of all users on a high level. In this research paper, the focus is to solve this challenge using the optimization methodology.
“Association Preference Factor” is a novel factor in this research paper introduced to reduce the vehicular users’ handover rates. This factor indicates the UE preference related to a particular tier. In a scenario of a two-tier mobile network with high-speed vehicular node, the preference factor is
As the ultimate goal of the optimization model is to discover a green communication approach for minimizing the handover number, the equation for the total power consumption of a single macro cell has been devised, which is as follows:
By the above Eq. (8), the total consumption of power for a macro cell is denoted by
The total power consumption of the micro cell base station (
According to the equation of (9), the total number of active microcells, the fixed consumption of power for a single microcell, and the load of traffic for micro cell base station are presented by
As discussed previously, to reduce the number of handovers, the association preference factor is considered. The inclusion of the association preference factor in the objective function of the model prioritizes user's association with larger cells on the basis of their speeds. The average association preference figure on the basis of resource allocation is represented below:
where
Similarly, the overall number of pedestrian users is mentioned by
Likewise, the whole number of fixed users is indicated by
The initial step is to analyze the numeric figure associated with the preference factor and power consumption; once the figure is quantified, the only remaining challenge is to formulate a green communication strategy to reduce handover rates by optimizing the problem to maximize the objective function which is as follows:
Subject to:
The relative weights for consuming power and handovers within the objective function have been defined as parameter a and parameter b, respectively. As shown in ((Eq. (15)), the first constraint ensures adequate capacity, which is made available within the two-tier mobile networks to meet the average demand, whereas constraint (16) ensures that the mobile users receive a threshold value of at least SINR for communication purposes via accessing the base station. Furthermore, Eq. (17) has been generated to make sure that the demand of the user is either less or equal to the capacity of the microcell. Additionally, constraints (18)–(20) are made to guarantee that the overall number of the two-tier mobile network's vehicle, fixed users, and pedestrian are satisfied by the separate number of the same along with fixed macro-and microcell users.
The issue of optimization was solved using the MATLAB toolbox. The results of optimization are framed in Section 6. Although finding an optimized solution for a large user set is possible, the time complexity of these solutions proved to be a major limiting factor. In this regard, this paper has also presented a heuristic solution that is presented in Fig. 2. The input is received from the value of
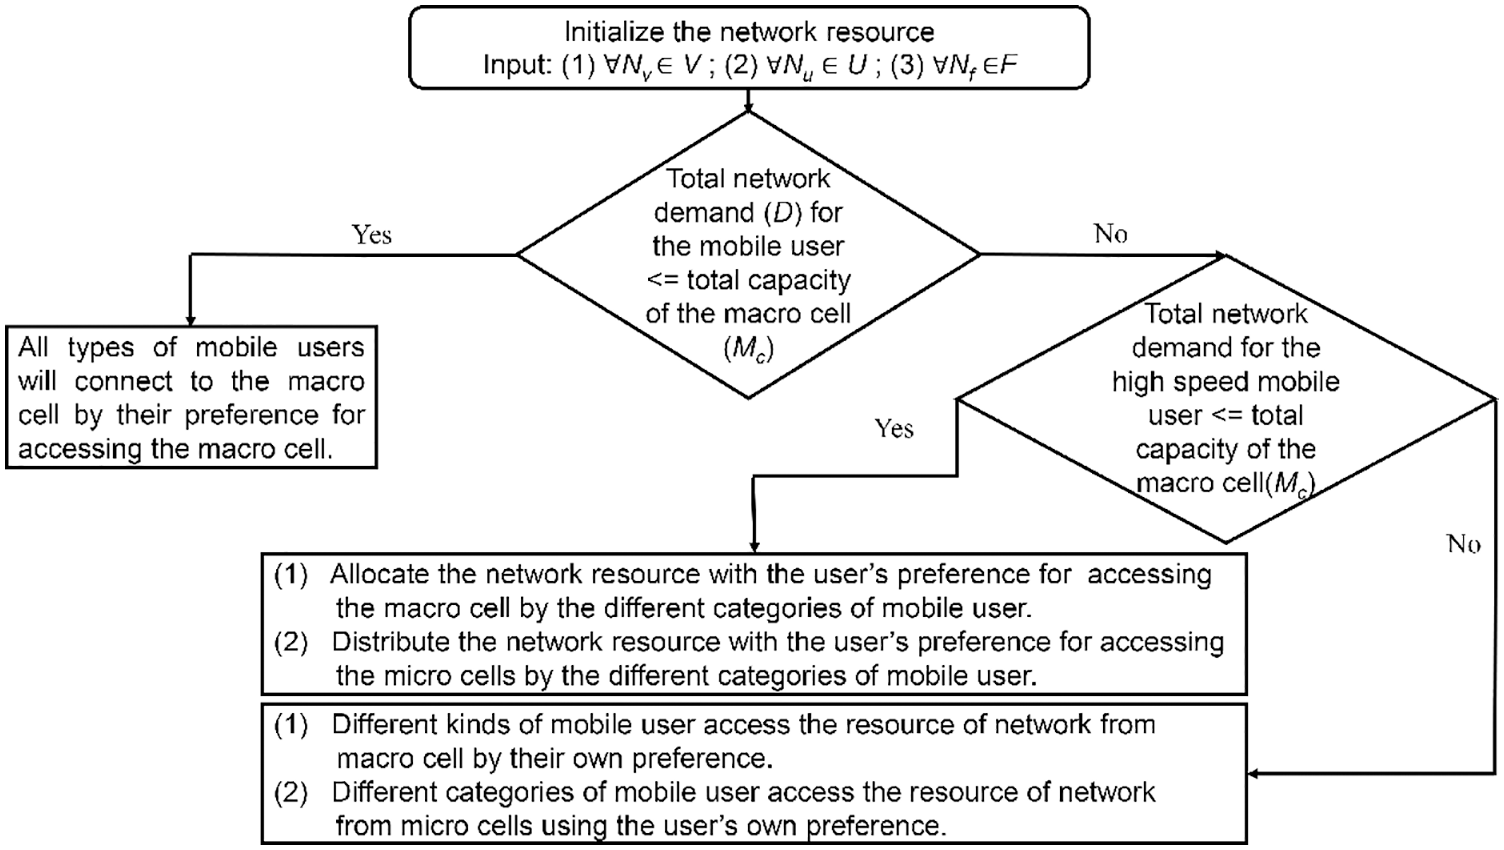
Figure 2: Flowchart of the heuristic solution
When there is no available capacity for the total demand of vehicle users, the macro cell base station resource is assigned to the user's preference for accessing the macro cell resource. For example, the vehicle UE (i.e., high-speed mobile user) has the primary priority, the low-speed mobile user (i.e., pedestrian user) has the second primary priority, and the no-speed user (i.e., fixed user) has no such priority for accessing the resource of macro cell base station (MBS).
For benchmarking of the mentioned solution, average throughput and handover cost have been analyzed, which are calculated as follows:
The handover cost calculation can be seen in [37]:
The handover on the basis of unit length is expressed in [37]:
where,
5.2 Calculation Technique for the Average Throughput
The mean value of throughput for MBS and mBS users by the base station of macro cell and microcell can be expressed as in [37]
where
The power ratios can be expressed as follows,
The average per-user throughput can be calculated from Eqs. (21) and (23)–(26):
6 Simulation Setup and Discussion of Results
A simulation scenario has been implemented to quantify the benchmark of the proposed solution (Fig. 3). To implement a two-tier simulation environment, the Vienna LTE-A simulator has been used. Tab. 2 shows the simulation parameters, and the area of simulation is set by the value of
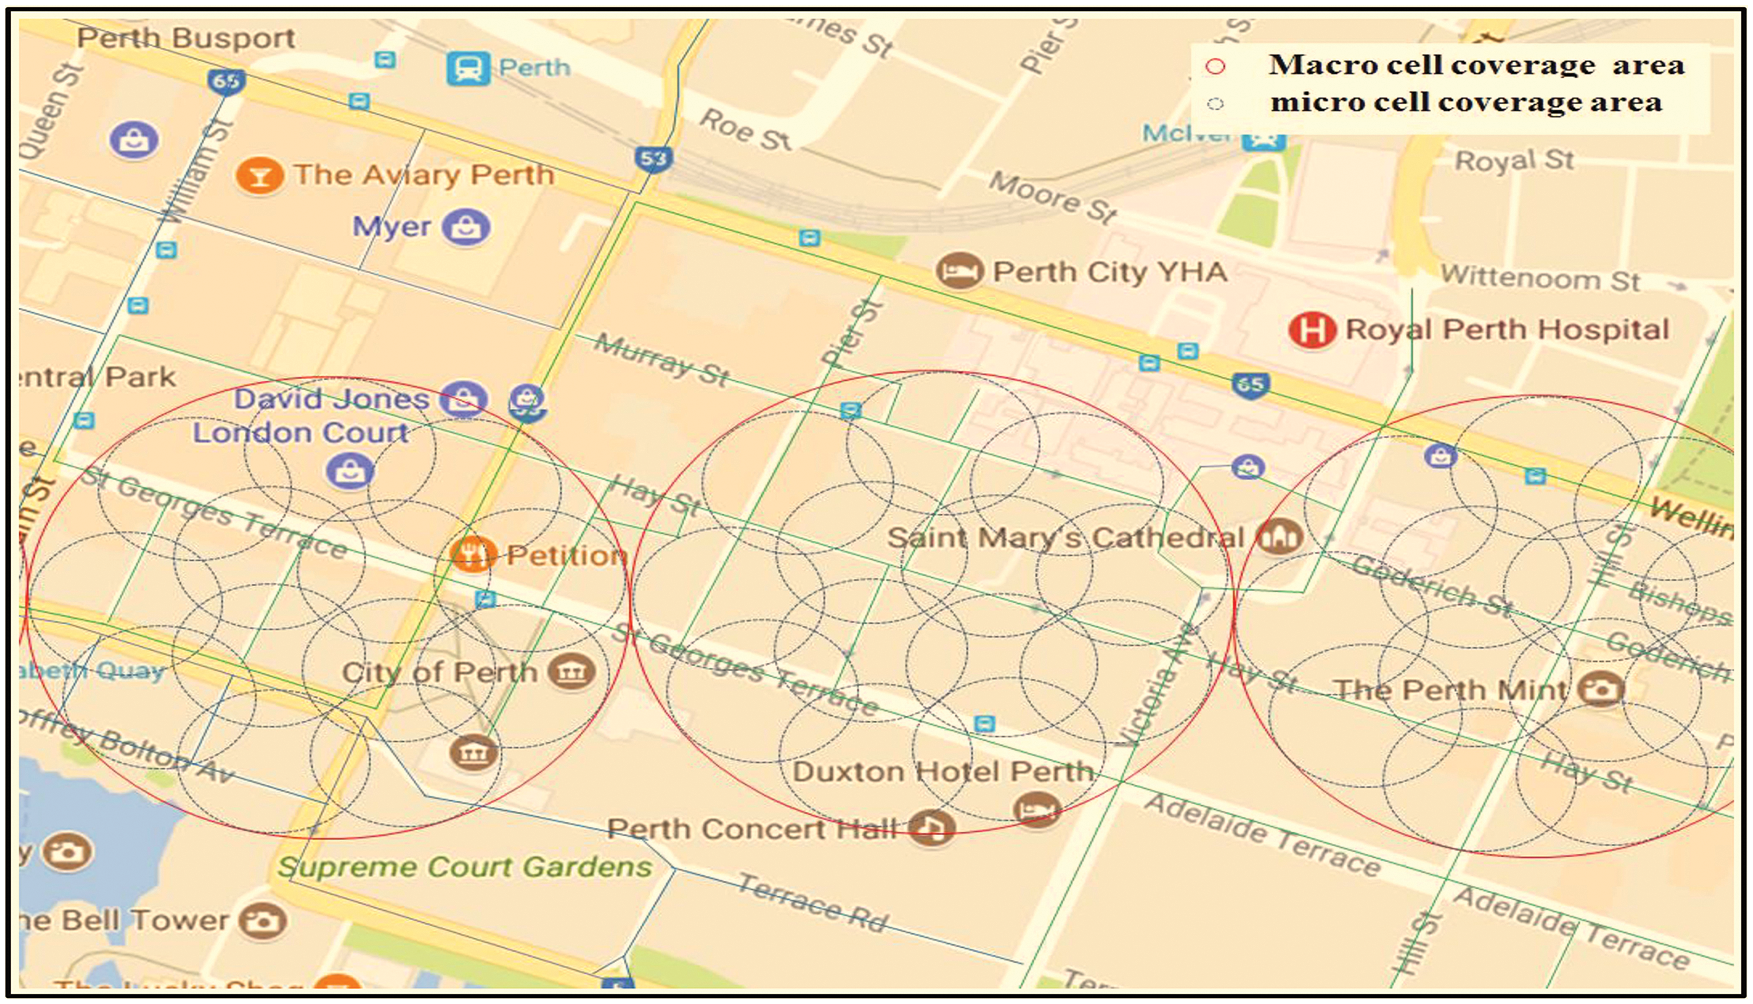
Figure 3: Simulation scenario: City of Perth
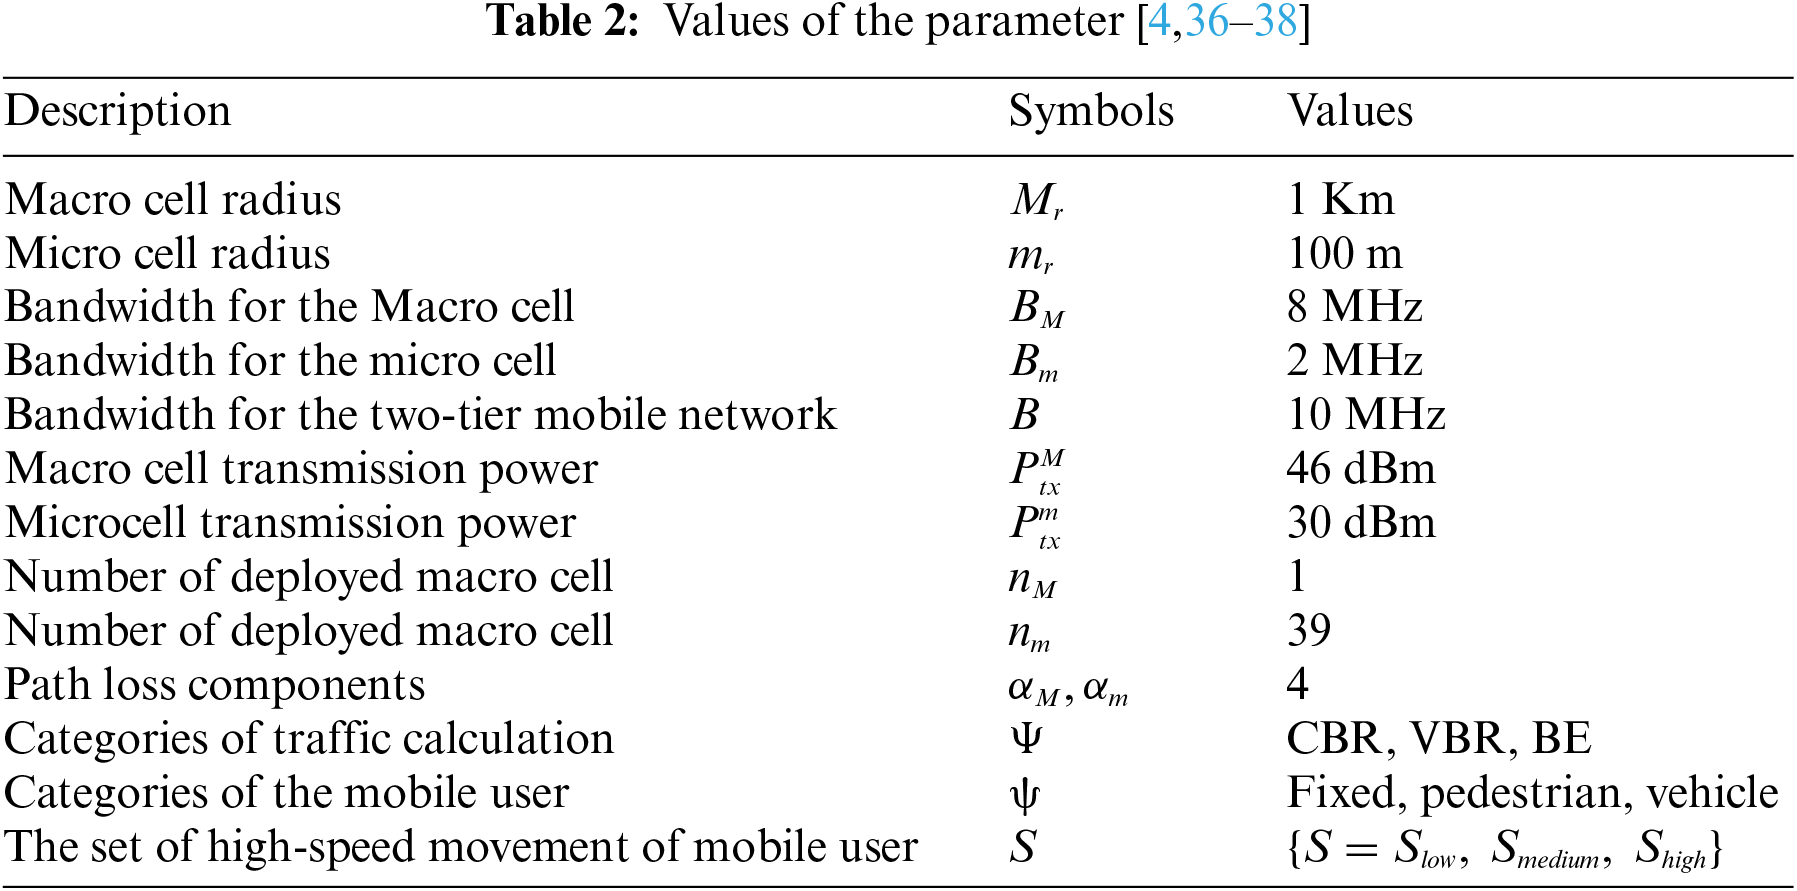

Figure 4: The network's traffic load was normalized for each hour of the day
For the study, a recently published handover scheme has been implemented for comparison [37], which is termed the traditional handover scheme. Only vehicular users have been considered in the traditional scheme [37], while the problem of frequent handover was addressed through the assignment of high-speed mobile nodes to the macro base stations. An assumption was made that enough resources would always be available in macro cells for mobile nodes. Additionally, the traditional approach also disregards the aspect of power consumption in two-tier networks. Whereas, in practical conditions, the green communication approach supports the MBS capacity to be first consumed by mobile, nomadic, and fixed users before small cells are utilized [12]. Considering this idea, the assumption about the availability of enough resources in the macro cell does not hold valid in the case of the green approach. Hence, in this study, it has been presented that resource management can be performed to reduce handover and power consumption in mobile networks.
6.1 The Cost of Handover, Average Throughput, and the Consumption of Power
Fig. 5 reflects upon the handover cost of the conventional and the proposed model exhibiting the operational efficiency of the mobile user's speed. It is evident through the analysis that the cost of both models increases with the increase in speed. However, the proposed model exhibits low handover cost due to its association with the preference factor in the resource allocation scheme. This is done by assigning slow-speed mobile users and fixed uses to smaller cells which results in the release of enough macro cell resources to be used by high-speed users.

Figure 5: The comparison results for the cost of handover between the values of the proposed optimization model and the traditional model
Fig. 6 showcases that the power consumption is reduced in the proposed model as opposed to the traditional model. This is due to the reason that the power consumption problem within a two-tier network is not considered within the traditional model. Thus, it significantly keeps the higher number of small cells functional. Nevertheless, due to the inability of the traditional model to consider the association of preference factors in the resource allocation process, fixed users and nomadic also get access to microcell resources resulting in vehicular users connecting to smaller cells due to the unavailability of macrocells. In comparison, the optimum number of microcells selected by the proposed model in accordance with the aggregate demand makes the model more viable during different hours of the day.

Figure 6: The comparison results for power consumption between the values of optimization model and the traditional model
Figs. 7 to 9 reveal the results of another set of simulations which are derived from different mobile profiles showcasing the effects of speed for the user equipment's (UE's) on the mean value of user throughput. The mobility profiles in the figures included (a) the speed of low whose value is S = 50 km/h, (b) moderate speed whose value is providing by S = 100 km/h, and (c) the speed of high whose value is showing by S, = 150 km/h. It can be concluded from Figs. 8 to 10 that the average throughput provided by the proposed model is higher in comparison with the traditional model. This is due to the fact that the proposed model has a less overhead cost and better than average throughput. In the vehicular communications context, higher average throughput is a prominent achievement.

Figure 7: Comparing the average throughput across the suggested model with the traditional approach (UE's speed is set low, S = 50 km/h)

Figure 8: Comparing the average throughput across the suggested model with the traditional approach (UE's speed is set to moderate, S = 100 km/h)

Figure 9: Comparing the average throughput across the suggested model with the traditional approach (UE's speed is set high speed, S = 150 km/h)
6.2 Handover Cost, Average Throughput, and the Consumption of Power
A comparison has been presented in Fig. 10 between the handover costs of the proposed optimization model against the heuristic algorithm as the operational efficiency of the mobile users’ speed. The findings depicted in the figure recommend that the performance of the heuristic algorithm is compared against the optimization model on the basis of the handover cost.
While comparing the throughput achieved in the heuristic solution and optimization model, it has been found that there is a slightly higher consumption of the power by the heuristic model as opposed to the optimum solution (Fig. 11).

Figure 10: Comparison of handover expenses in heuristic and optimum solution

Figure 11: Comparison of power consumption results in heuristic and optimum solution
When the speed of users rises, the average throughput decreases in both the optimum and heuristic solutions, as seen in Fig. 12. The heuristic solution, on the other hand, delivers a robust solution at the expense of a poor average throughput.
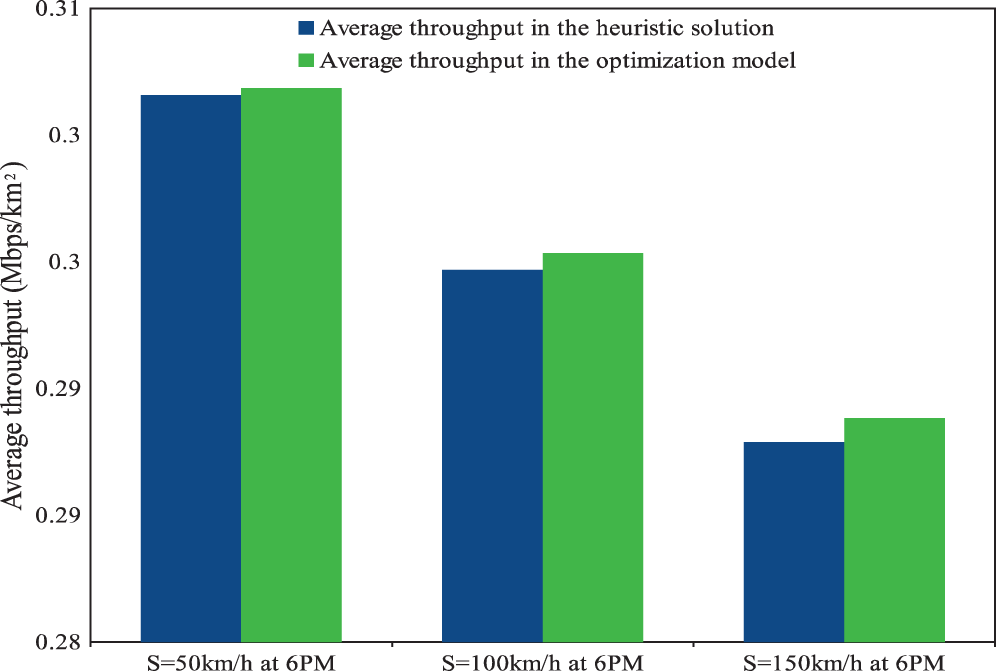
Figure 12: Comparison of average throughput in optimum and heuristic solution
The key strategy for increasing the capacity of the 5G network is known as small cell densification. However, the drawback of the strategy is that it leads to frequent handovers for the mobile nodes as a result of limited small cell coverage areas. Since high handover cost is associated with higher overhead and lower average throughput, frequent handover is found to have a detrimental impact on the mobile nodes moving at high speeds. The paper presents a mechanism to minimize the power consumption and handover cost through the allocation of resources among the nomadic, fixed, and vehicular mobile users in two-tier networks. An introduction of a new term, “association preference factor,” was made, which is deemed as one of the two goals in the optimization model. Consumption of power has been kept low by the other objective of the solution, which means fewer carbon footprints and minimized energy costs for the network provider. This solution was implemented in a simulation scenario during the study, and the results noted a better output in handover costs, throughput, and power consumption. Based on the results, it can be stated that the proposed solution has the potential to outperform the existing solutions. The proposal of the heuristic solution is more efficient as compared to other optimum solutions. As an immediate future work, we plan to devise yet another novel way to enhance latency performance.
Funding Statement: This work was supported by the Taif University Researchers Supporting Project number (TURSP-2020/79), Taif University, Taif, Saudi Arabia.
Conflicts of Interest: The authors declare that they have no conflicts of interest to report regarding the present study.
1. Global ICT Regulatory Outlook 2020, International Telecommunication Union (ITUPlace des Nations, CH-1211 Geneva, Switzerland. (2020). [Online]. Available: https://www.itu.int/dms_pub/itu-d/opb/pref/D-PREF-BB.REG_OUT01-2020-PDF-E.pdf. [Google Scholar]
2. Cisco Visual Networking Index: Global Mobile Data Traffic Forecast Update (2017–2022Cisco. (2019). [Online]. Available: https://davidellis.ca/wp-content/uploads/2019/12/cisco-vni-mobile-data-traffic-feb-2019.pdf. [Google Scholar]
3. M. A. R. Khan, “Mobility management in 5G heterogeneous networks,” M.S. thesis, Edith Cowan University, Australia, 2019. [Google Scholar]
4. S. Cai, Y. Che, L. Duan, J. Wang, S. Zhou et al., “Green 5G heterogeneous networks through dynamic small-cell operation,” IEEE Journal on Selected Areas in Communications, vol. 34, no. 5, pp. 1103–1115, 2016. [Google Scholar]
5. Measuring Digital Development Facts and Figures 2020, International Telecommunication Union (ITUGeneva, Switzerland. (2020). [Online]. Available: https://www.itu.int/en/ITU-D/Statistics/Documents/facts/FactsFigures2020.pdf. [Google Scholar]
6. J. Navarro-Ortiz, P. Romero-Diaz, S. Sendra, P. Ameigeiras, J. J. Ramos-Munoz et al., “A survey on 5G usage scenarios and traffic models,” IEEE Communications Surveys & Tutorials, vol. 22, no. 2, pp. 905–929, 2020. [Google Scholar]
7. J. F. Monserret, G. Mange, V. Braun, H. Tullberg, G. Zimmerman et al., “METIS research advances towards the 5G mobile and wireless system definition,” EURASIP Journal on Wireless Communications and Networking, vol. 2015, no. 53, pp. 1–16, 2015. [Google Scholar]
8. G. Akhil and S. B. Ishfaq, “A survey on energy efficient 5G green network with a planned multi-tier architecture,” Journal of Network and Computer Applications, vol. 118, pp. 1–28, 2018. [Google Scholar]
9. W. H. Bailey, B. R. T. Cotts and P. J. Dopart, “Wireless 5G radiofrequency technology—an overview of small cell exposures, standards and science,” IEEE Access, vol. 8, pp. 140792–140797, 2020. [Google Scholar]
10. H. Elsawy, E. Hossain and D. I. Kim, “HetNets with cognitive small cells: User offloading and distributed channel access techniques,” IEEE Communications Magazine, vol. 51, no. 6, pp. 28–36, 2013. [Google Scholar]
11. N. Al-Falahy and O. Y. Alani, “Technologies for 5G networks: Challenges and opportunities,” IEEE IT Professional, vol. 19, no. 1, pp. 12–20, 2017. [Google Scholar]
12. M. K. Alias, M. Y. Mardeni and R. R. Yusuf, “Towards green communication in 5G systems: Survey on beamforming concept,” IET Communications, vol. 15, pp. 142–154, 2020. [Google Scholar]
13. X. Ge, J. Yang, H. Gharavi and Y. Sun, “Energy efficiency challenges of 5G small cell networks,” IEEE Communications Magazine, vol. 55, no. 5, pp. 184–191, 2017. [Google Scholar]
14. C. Bila, F. Sivrikaya, M. A. Khan and S. Albayrak, “Vehicles of the future: A survey of research on safety issues,” IEEE Transactions on Intelligent Transportation Systems, vol. 18, no. 5, pp. 1046–1065, 2017. [Google Scholar]
15. H. He, H. Shan, A. Huang and L. Sun, “Resource allocation for video streaming in heterogeneous cognitive vehicular networks,” IEEE Transactions on Vehicular Technology, vol. 65, no. 10, pp. 7917–7930, 2016. [Google Scholar]
16. S. Temel, M. C. Vuran, M. M. R. Lunar, Z. Zhao, A. Salam et al., “vehicle-to-barrier communication during real-world vehicle crash tests,” Computer Communications, vol. 127, pp. 172–186, 2018. [Google Scholar]
17. K. Yagyu, T. Nakamori, H. Ishii, M. Iwamura, N. Miki et al., “Investigation on mobility management for carrier aggregation in LTE-advanced,” in Proc. of the 74th IEEE Vehicular Technology Conf. (VTC Fall), San Francisco, CA, USA, pp. 1–5, 2011. [Google Scholar]
18. H. Zhang, W. Ma, W. Li, W. Zheng, X. Wen et al., “Signaling cost evaluation of handover management schemes in LTE advanced femtocell,” in Proc. of the 73rdIEEE Vehicular Technology Conf. (VTC Spring), Budapest, Hungary, pp. 1–5, 2011. [Google Scholar]
19. P. Y. Kong and A. Sluzek, “Average packet delay analysis for a mobile user in a two-tier heterogeneous cellular network,” IEEE Systems Journal, vol. 11, no. 4, pp. 2726–2736, 2017. [Google Scholar]
20. K. M. Hosny, M. M. Khashaba, W. I. Khedr, F. A. Amer, “An efficient neural network-based prediction scheme for heterogeneous networks,” International Journal of Sociotechnology and Knowledge Development (IJSKD), vol. 12, pp. 63–76, 2020. [Google Scholar]
21. M. Alotaibi, A. Nayak, “Linking handover delay to load balancing in SDN-based heterogeneous networks,” Computer Communications, vol. 173, pp. 170–182, 2021. [Google Scholar]
22. K. Jakimoski and T. Janevski, “Radio access technology selection and vertical handover decision algorithms for heterogeneous mobile and wireless networks,” Ad Hoc Sensor Wireless Networks, vol. 27, no. 1–2, pp. 95–109, 2015. [Google Scholar]
23. Y. N. Gyekye and J. I. Agbinya, “Vertical handoff decision algorithm for UMTS-WLAN,” in Proc. of 2nd Int. Conf. on Wireless Broadband and Ultra-Wideband Communications, Sydney, Australia, pp. 37–42, 2007. [Google Scholar]
24. X. Haibo, T. Hui and Z. Ping, “A novel terminal controlled handoff scheme in heterogeneous wireless networks,” Computers and Electrical Engineering, vol. 36, no. 2, pp. 269–279, 2010. [Google Scholar]
25. V. Buenestado, J. Ruiz-Aviles, M. Toril and S. Luna-Ramirez, “Mobility robustness optimization in enterprise LTE femtocells,” in Proc. of the 77th IEEE Vehicular Technology Conf. (VTC Spring), Dresden, Germany, pp. 1–5, 2013. [Google Scholar]
26. G. Zhou and P. Legg, “An evolved mobility robustness optimization algorithm for LTE heterogeneous networks,” in Proc. of the 77th IEEE Vehicular Technology Conf. (VTC Spring), Dresden, Germany, pp. 1–5, 2013. [Google Scholar]
27. H. Ibrahim, H. ElSawy, U. T. Nguyen and M. S. Alouini, “Mobility aware modeling and analysis of dense cellular networks with 10 C-plane/U-plane split architecture,” IEEE Transactions on Communications, vol. 64, no. 11, pp. 4879–4894, 2016. [Google Scholar]
28. A. Mohamed, O. Onireti, M. Ali Imran, A. Imran and R. Tafazolli, “Predictive and core-network efficient RRC signaling for active state handover in RANs with control/data separation,” IEEE Transactions on Wireless Communications, vol. 16, no. 3, pp. 1423–1436, 2017. [Google Scholar]
29. T. Bilen, B. Canberk and K. R. Chowdhury, “Handover management in software-defined ultra-dense 5G networks,” IEEE Network, vol. 31, no. 4, pp. 49–55, 2017. [Google Scholar]
30. M. Polese, M. Giordani, M. Mezzavilla, S. Rangan and M. Zorzi, “Improved handover through dual connectivity in 5G mm wave mobile networks,” IEEE Journal on Selected Areas in Communications, vol. 35, no. 9, pp. 2069–2084, 2017. [Google Scholar]
31. J. Zhang, J. Feng, C. Liu, X. Hong, X. Zhang et al., “Mobility enhancement and performance evaluation for 5G ultra-dense networks,” in Proc. of IEEE Wireless Communications and Networking Conf. (WCNC 2015), New Orleans, LA, USA, pp. 1793–1798, 2015. [Google Scholar]
32. R. Arshad, H. ElSawy, S. Sorour, T. Y. Al-Naffouri and M. S. Alouini, “Velocity-aware handover management in two-tier cellular networks,” IEEE Trans. on Wireless Communication, vol. 16, no. 3, pp. 1851–1867, 2017. [Google Scholar]
33. X. Ge, S. Tu, G. Mao, C. -X. Wang and T. Han, “5G Ultra-dense cellular networks,” IEEE Wireless Communications, vol. 23, no. 1, pp. 72–79, 2016. [Google Scholar]
34. S. Sadr and R. S. Adve, “Handoff rate and coverage analysis in multi-tier heterogeneous networks,” IEEE Trans. on Wireless Communication, vol. 14, no. 5, pp. 2626–2638, 2015. [Google Scholar]
35. D. López-Pérez, M. Ding, H. Claussen and A. H. Jafari, “Towards 1 gbps/UE in cellular systems: Understanding ultra-dense small cell deployments,” IEEE Communications Surveys & Tutorials, vol. 17, no. 4, pp. 2078–2101, fourth quarter 2015. [Google Scholar]
36. G. Zhang, T. Q. S. Quek, A. Huang and H. Shan, “Delay and reliability tradeoffs in heterogeneous cellular networks,” IEEE Transactions on Wireless Communications, vol. 15, no. 2, pp. 1101–1113, 2016. [Google Scholar]
37. W. Bao and B. Liang, “Stochastic geometric analysis of user mobility in heterogeneous wireless networks,” IEEE Journal on Selected Areas in Communications, vol. 33, no. 10, pp. 2212–2225, 2015. [Google Scholar]
38. S. Singh and J. G. Andrews, “Joint resource partitioning and offloading in heterogeneous cellular networks,” IEEE Transactions on Wireless Communications, vol. 13, no. 2, pp. 888–901, 2014. [Google Scholar]
39. Main Roads Western Australia, The Government of Western Australia. (2014, Mar 18). [Online]. Available: https://www.mainroads.wa.gov.au/OurRoads/Facts/ITS/Pages/SCATSSample-Data.aspx. [Google Scholar]
 | This work is licensed under a Creative Commons Attribution 4.0 International License, which permits unrestricted use, distribution, and reproduction in any medium, provided the original work is properly cited. |