DOI:10.32604/cmc.2022.024269
| Computers, Materials & Continua DOI:10.32604/cmc.2022.024269 | |
| Article |
Accurate Location Estimation of Smart Dusts Using Machine Learning
1Institute of Applied Data Analytics (IADA), Universiti Brunei Darussalam (UBD), Gadong, BE1410, Brunei Darussalam
2School of Digital Sciences (SDS), Universiti Brunei Darussalam (UBD), Gadong, BE1410, Brunei Darussalam
*Corresponding Author: Shariq Bashir. Email: shariq.bashir@ubd.edu.bn
Received: 11 October 2021; Accepted: 30 November 2021
Abstract: Traditional wireless sensor networks (WSNs) are not suitable for rough terrains that are difficult or impossible to access by humans. Smart dust is a technology that works with the combination of many tiny sensors which is highly useful for obtaining remote sensing information from rough terrains. The tiny sensors are sprinkled in large numbers on rough terrains using airborne distribution through drones or aircraft without manually setting their locations. Although it is clear that a number of remote sensing applications can benefit from this technology, but the small size of smart dust fundamentally restricts the integration of advanced hardware on tiny sensors. This raises many challenges including how to estimate the location of events sensed by the smart dusts. Existing solutions on estimating the location of events sensed by the smart dusts are not suitable for monitoring rough terrains as these solutions depend on relay sensors and laser patterns which have their own limitations in terms of power constraint and uneven surfaces. The study proposes a novel machine learning based localization algorithm for estimating the location of events. The approach utilizes timestamps (time of arrival) of sensed events received at base stations by assembling them into a multi-dimensional vector and input to a machine learning classifier for estimating the location. Due to the unavailability of real smart dusts, we built a simulator for analysing the accuracy of the proposed approach for monitoring forest fire. The experiments on the simulator show reasonable accuracy of the approach.
Keywords: Smart dust; sensor localization; remote sensing; machine learning algorithms; Internet of Things; sensor applications
In recent years, studies on wireless sensor networks (WSNs) have demonstrated their effectiveness for many remote sensing applications including precision agriculture [1–3], logistics carrier monitoring [4], industrial monitoring and control [5], underground coal mines monitoring [6,7], monitoring forest fire [8,9], monitoring seismic activity [10], marine environment monitoring [11], etc. The major advantage of WSNs technology is that it is ad-hoc and easy to manage and configure. However, deployment of WSNs technology requires support from humans and thus it is not suitable for rough terrains that are difficult or impossible to approach by humans. In this article, we use a new technology (smart dust) to monitor the remote sensing applications for the rough terrains [12–14]. We test the effectiveness of smart dust for monitoring forest fires. Smart dust is a technology that works with the collaboration of many tiny microelectromechanical sensors (MEMS) [15–17]. These tiny sensors are capable to sense many parameters including pressure, humidity, temperature, vibration, acceleration, and light [14,17,18]. Each tiny sensor is equipped with its own circuitry for sensing and wireless communication. Smart dust receives an autonomous power supply that can be from solar power and thick-film batteries. All these capabilities are packed in a tiny sensor within a space of only a few millimetres [19–21]. Fig. 1 shows the architecture of a smart dust.

Figure 1: Architecture of the smart dust proposed by [14]
Smart Dust is an emerging technology. The Gartner's 2018 hype cycle has listed smart dust technology as one of the emerging technologies in the next 10 years1. In recent years, it has received a considerable amount of attention from the research community because many remote sensing applications can benefit from this technology for monitoring rough terrains such as forests, frozen lands, mountains, sea, space, planets, etc. [22–25]. For example, environmental researchers can use this technology for monitoring air quality, pollution, carbon, or any chemical substances in the air. The agriculture domain can utilize this technology for monitoring soil quality, monitoring optimal time for harvesting crops, or other sensing information suitable for the growth of plants [26]. Geologists can benefit by monitoring seismic or earthquake activities and their roles on the structure of bridges and buildings. Biologists can use this technology for obtaining movement trajectories of small insects or other wild animals for discovering their natural habitats. Furthermore, the military can utilize this technology for tracking troops or detecting any radioactivity2 or poisonous chemical gases in the air [25,27].
As smart dusts are deployed in large numbers on a monitoring region without manually setting their locations, airborne distribution through drones or aircraft is the most suitable way to sprinkle the sensors on a specific area [12]. Once deployed, these sensors can remain in the environment like dust and thus be difficult to detect and remove. The smart dusts sense programmed events, and the sensed events are transmitted from sensor to sensor until they reach base stations. The base stations further transmit the events to the cloud or processing and analytics to accomplish a certain task. The main functions of smart dusts are sensing events, storing the events in limited memory, and wirelessly transmitting the events to neighbour sensors or base stations. Although, it is clear that a number of remote sensing applications can benefit from this technology, but distributing a large number of smart dust sensors over a specific monitoring region raises many challenges such as sensor localization, device failure, and bottleneck [28]. In WSNs research, the problem of localization is about determining the location of sensors [29,30]. Since sensors are used for monitoring the presence of programmed events, therefore determining the exact location of an event is critical for many applications including monitoring forest fire, wild animals, or movement of troops, etc. On the other hand, the small size of smart dust enables many limitations including energy, wireless communication, and scalability which fundamentally makes this technology different from similar technologies such as WSNs or the internet of things (IoT) [31]. For example, most of the currently available sensors for IoT applications are of matchbox size which provides enough space to equip them with an embedded processor of good speed, a radio transceiver with a larger communication range of tens of meters, few KB of RAM, and a shared bandwidth of tens of kilo-bits. However, these sensors are too costly, too large, and offer short-lived batteries. Thus, these are not suitable for applications which require energy-efficient sensors that should remain active for years without charging and replacing batteries. Furthermore, these applications require the sensors to be light and small enough so that they can be easily mixed in the coating and paint, and cheap enough to easily sprinkle on a monitoring region.
The energy, size, and cost constraints of this technology imply that the processing, communication, and storage capabilities of smart dust sensors are very limited as compared to WSNs or IoT devices [31]. Moreover, the smart dust cannot determine its location through GPS or radio waves as equipping the smart dust with GPS or radio requires additional resources which are not suitable in terms of space, cost, and energy. Furthermore, due to specific applications of the technology, in the future the hardware advancements of this technology will likely be more focused on reducing size, optimizing energy and communication rather than equipping the smart dusts with advanced technologies [32]. In recent years, many range-based and range-free sensor localization approaches have been proposed in the context of WSNs and IoT domains [29,30,33,34]. These approaches require sensors to be equipped with long-range wireless chips so that the sensors can directly transmit their signals to anchor (base) sensors for estimating the location of sensors. However, due to resource constraints (unavailability of long-range wireless hardware on smart dusts) these localization approaches cannot be directly applied to smart dusts [31]. Hence, there is a need to develop new localization approaches that work well in the context of smart dust. By considering these constraints in this article, we propose a novel localization approach for smart dust that efficiently determines the location of events sensed by the smart dusts. The proposed approach identifies the location of events through signal timestamps (time of arrival) received at base stations.
The approach works as follows. For estimating the location of an event, the monitoring region is divided into n cells. The approach assumes each cell contains an equal number of sprinkled smart dusts. The monitoring region contains m base stations that are manually placed at the boundary of the monitoring region. These base stations contain advanced hardware and software features and can report their exact locations through GPS. Fig. 2 shows an example of how the system monitors forest fire using smart dusts and base stations. Upon sensing an event, the smart dust transmits the signal to neighbouring smart dusts. The neighbouring smart dusts re-transmit the signal to other neighbours. Using this mechanism, the sensed event propagates from source smart dusts to base stations. Furthermore, due to different geographical placements of base stations and the length of the monitoring region, each base station receives different (time of arrival) timestamps for different sensed events occurring at different geographical locations. Using this concept, we generated many samples for training a machine learning classifier by simulating many events at different geographical locations of a simulated monitoring region. We then trained a machine learning (ML) classifier using neural network and training samples. Once the ML classifier is available, the system correctly estimates the location of each sensed event from the signals’ timestamps (time of arrival) received at base stations. The proposed approach is specifically tailored to tiny sensors containing only RFID communication. The proposed approach is highly scalable for very large networks.
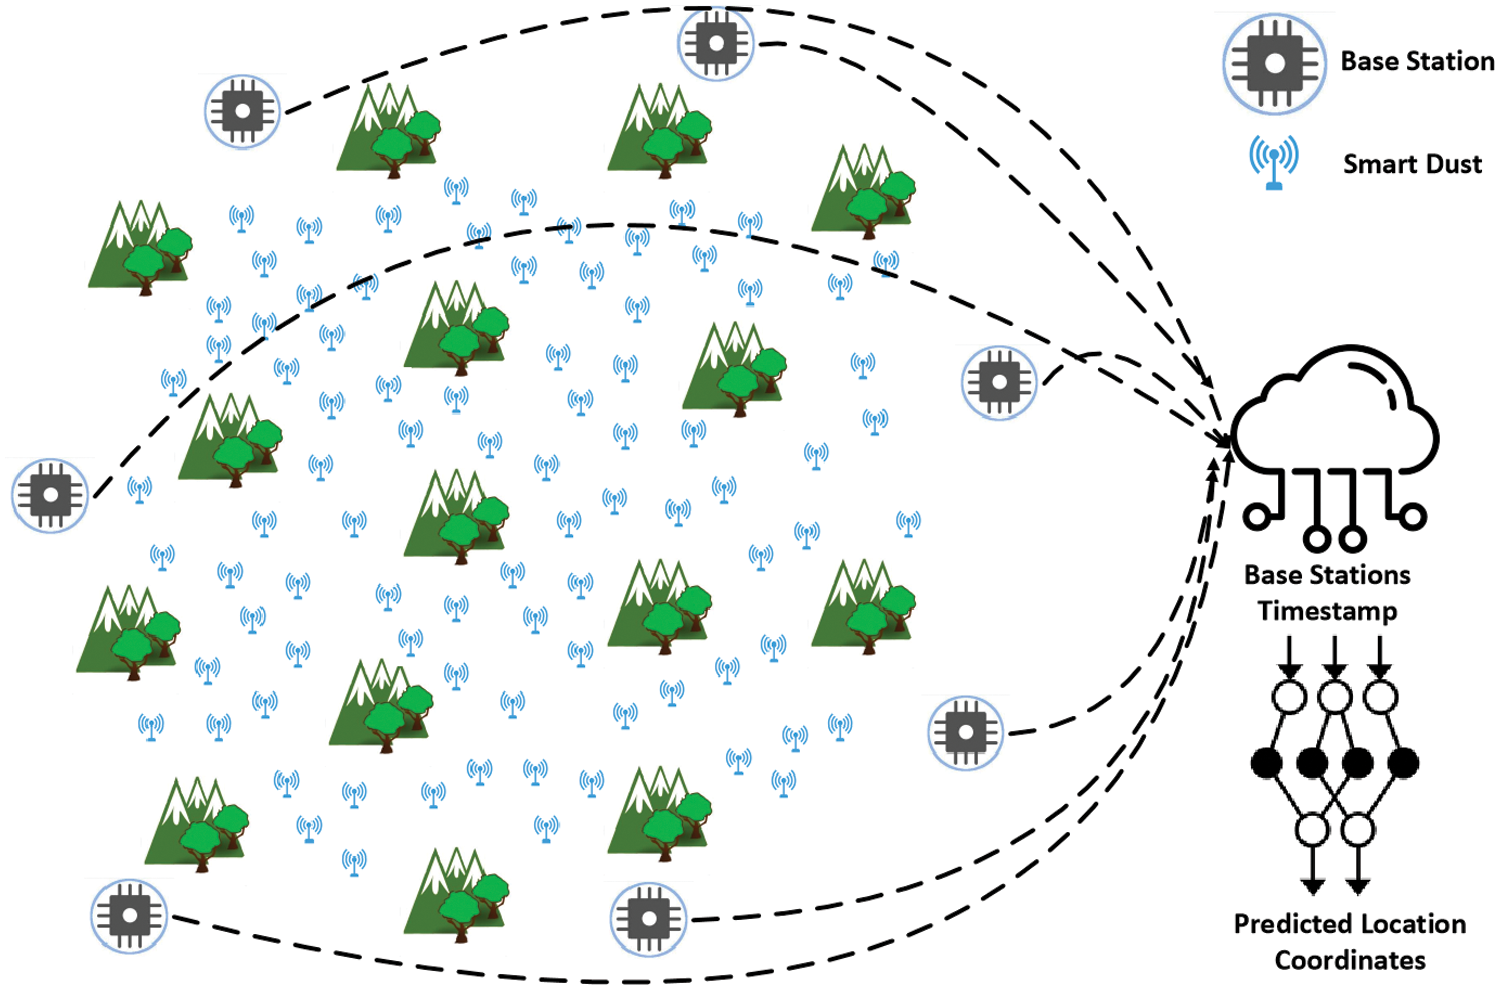
Figure 2: The figure shows an example how the system monitors forest fire using smart dust and base stations
The smart dust technology raises many challenges due to the small size and limited resources available on the sensor. Park et al. [12] proposed a hierarchical layered architecture for the deployment of smart dusts. The authors claim the proposed architecture reduces the transmission bottleneck that is caused by a large number of smart dusts and dynamically estimates plan partitions for a given workload. The proposed architecture works by placing smart dust and devices into three layers. The first layer contains smart dusts used for sensing events around them. The smart dusts have a limited communication range and cannot transmit sensed events in a long-range environment. The second layer contains relay dust sensors. These sensors are limited in number, however, contain enough computing and transmission capabilities for processing and transmitting data to the upper layer on a long-range distance. The third layer contains smart IoT server with many processing nodes and a pool control node. The objective of processing nodes is to process the data received from the relay dust sensors. The pool control node dynamically distributes the workload on the processing nodes. In [16], the authors used this hierarchical layered architecture for monitoring the climate data of a simulated remote region.
Park et al. [28] proposed a transmission protocol to efficiently transmit events sensed by the smart dusts to the IoT server. The proposed protocol divides the sensed data into two classes: urgent sensed data and normal sensed data. The urgent class contains the data that requires urgent transmission to the IoT server, and the normal class contains the data that can be slightly delayed due to transmitting data of the urgent class. Furthermore, for securing the data of normal class the authors used blockchain technology. The data of the urgent class is urgently transmitted to the IoT server for processing. However, the data of the normal sensed class is stored first on the blockchain ledger and transmitted later when there is no data available for the urgent class.
Mohan et al. [27] proposed an application of smart dust technology for surveillance. They discussed how smart dust technology can help in border surveillance against terrorism. Jain et al. [35] proposed a smart judiciary system using smart dust technology. In their work, they discussed how the technology can be used for detecting and reducing crimes in smart cities. They also discussed how the smart dust technology can be used for emerging applications such as meta security, privacy protection system, and reducing disease spread by bacteria and fungi.
Romer et al. [31] proposed a localization approach for tracking the locations of smart dusts. The smart dusts estimate their locations by observing certain patterns of laser which are transmitted to them from an infrastructure device. Unfortunately, this approach is not suitable for monitoring regions that have uneven surfaces (e.g., forests, mountains, planets), because due to obstacles on uneven surfaces the smart dusts cannot directly observe the laser patterns of the infrastructure device. Our proposed approach is different from this reported work. We use signal timestamps (time of arrival) received at base stations and train a machine learning classifier to correctly estimate the location of smart dusts. Furthermore, our approach is scalable and can be applied on large rough terrains that are difficult to approach.
3 Estimating Location of Smart Dusts
The objective of the proposed approach is to estimate the location of events sensed by the smart dusts with reasonable accuracy. Furthermore, the proposed approach should also have the ability to cover a large area of the monitoring region by working within the constraints of power, cost, and limited communication range. Smart dust is a tiny device that achieves its objective by collaborating with other smart dusts. These tiny devices have limited computing and communication capabilities and cannot transmit sensed events to long-range. There are two main technologies to provide wireless communication for smart dusts: (i) radio frequency identification (RFID) based, and (ii) a light source based [32]. RFID-based communication is more attractive because, as compared to optical transceivers, it does not require a direct line of sight for communication and thus, can be used for monitoring regions that are difficult to approach. It requires a space of size one cubic millimetre and utilize low-power RF-based communication [36]. Two well-known configurations of RFID tags are passive and battery-assisted. Battery-assisted tags contain a small battery which provides power to the chip. Passive RFID tags harvest energy from radio waves. The waves generated by reader are enough to power the RFID tags. Both configurations contain a small antenna which provides communication with a remote reader by backscattering the RF signal. Recently MIT researchers have designed a tiny RFID based sensor [37]. Their proposed design turns the passive RFID tag into the sensor. Because the passive RFID harvests energy from the radio waves, therefore, the proposed sensor can remain active for years without charging and replacing batteries. The communication is achieved through RFID's signal strength and frequency. As it is well studied that RFID tag changes the signal frequency and power in the presence of many factors of environment like temperate or gas concentration, therefore, the MIT researchers have engineered the tag's antenna in such a way that upon sensing an event it reflects radio waves back to a reader with a different signal-strength and frequency which indicates that the sensor has sensed an event in the environment. Hitachi's smart tag technology is another example of RFID-based smart dust. The Hitachi microscopic chip3 is a functional RFID chip that contains a microscopic CPU with a ROM of size 128b and it can be used for wireless sensing. All these capabilities are assembled within a chip size of 0.15 × 0.15 mm and a height of 75 μm.
To transmit sensed events over a long distance or to a cloud server, the monitoring region has another layer with advanced sensors which are called base stations [12]. These base stations are manually placed at the boundary of the monitoring region. The base stations contain advanced hardware and software capabilities and can transmit their exact locations to the cloud server through GPS for further predictive analytics and decision support. The smart dust technology for sensing a remote region works as follows. Upon sensing a programmed event, the smart dust transmits the sensed event to neighbouring smart dusts that are within its RFID communication range. Upon receiving the signal, the neighbouring smart dusts re-transmit the received signal to other neighbouring smart dusts. In this way, the sensed event propagates from source smart dusts to base stations. Fig. 2 shows an architecture of remote sensing using smart dust for monitoring forest fires. Each smart dust has a threshold module which reduces the transmission data and saves power and reduces bottleneck [16]. With the help of the threshold module, the smart dust does not transmit the sensed event to neighbouring sensors when the difference between the current event and the old event is less than a specific threshold. When an event is sensed at the monitoring region, the smart dusts transmit the signal to base stations. Due to the different geographical placement of base stations, each base station receives different signal timestamps (time of arrival) for each sensed event occurring at different geographical locations of the monitoring region.
Fig. 3 shows an example of how base sensors receive different timestamps for three events occurring at different locations. The monitoring region has a random number of smart dusts distributed at random locations. Each smart dust can transmit the signal with a transmission range of a few meters. The monitoring region has five base stations placed at an equal distance between them. The base station i senses the event A more quickly than other sensors. This is because the location of event A is closer to sensor i than the other sensors. The timestamps received at other baser sensors for event A is also different according to how closer the sensors are for the event A. Similarly, the base station j senses the event B more quickly than other sensors as it is closer to event B. We used this concept and obtained a large number of training samples to train a machine learning (ML) classifier using a neural network by simulating many events at different locations of the monitoring region. Once the ML classifier is available, the base stations transmit the timestamps of sensed events to the cloud server. The cloud server assembles the timestamps into a multi-dimensional vector and inputs to ML classifier for estimating the location of sensed events.
The system trains an ML classifier using multi-output regression [38,39]. Unlike normal regression where the objective is to predict a single numeric value, the task of multi-output regression is to predict the numeric outputs of two or more numerical attributes. In our case, these are geographical coordinates of sensed events. Many traditional ML classifiers support training a multi-output regression predictor. For example, a decision tree or ensembles of decision trees can be used for this purpose. However, a decision tree is not suitable when the training samples contain a highly structured relationship between the input and output attributes. A neural network using GRNN (general regression neural network) also supports multi-output regression. It trains a continuous function which can learn a more graceful correlation between input and output attributes. GRNN learns the multi-output regression by directly specifying the numeric output attributes on the output layer. The GRNN trains the classifier using kernel regression. It is based on the standard statistical technique, and it is one type of radial basis function (RBF) networks [40]. Previous studies on GRNN have demonstrated that the GRNN is an efficient network in terms of training and provides reasonable high accuracy even if it is trained with limited samples [41,42].
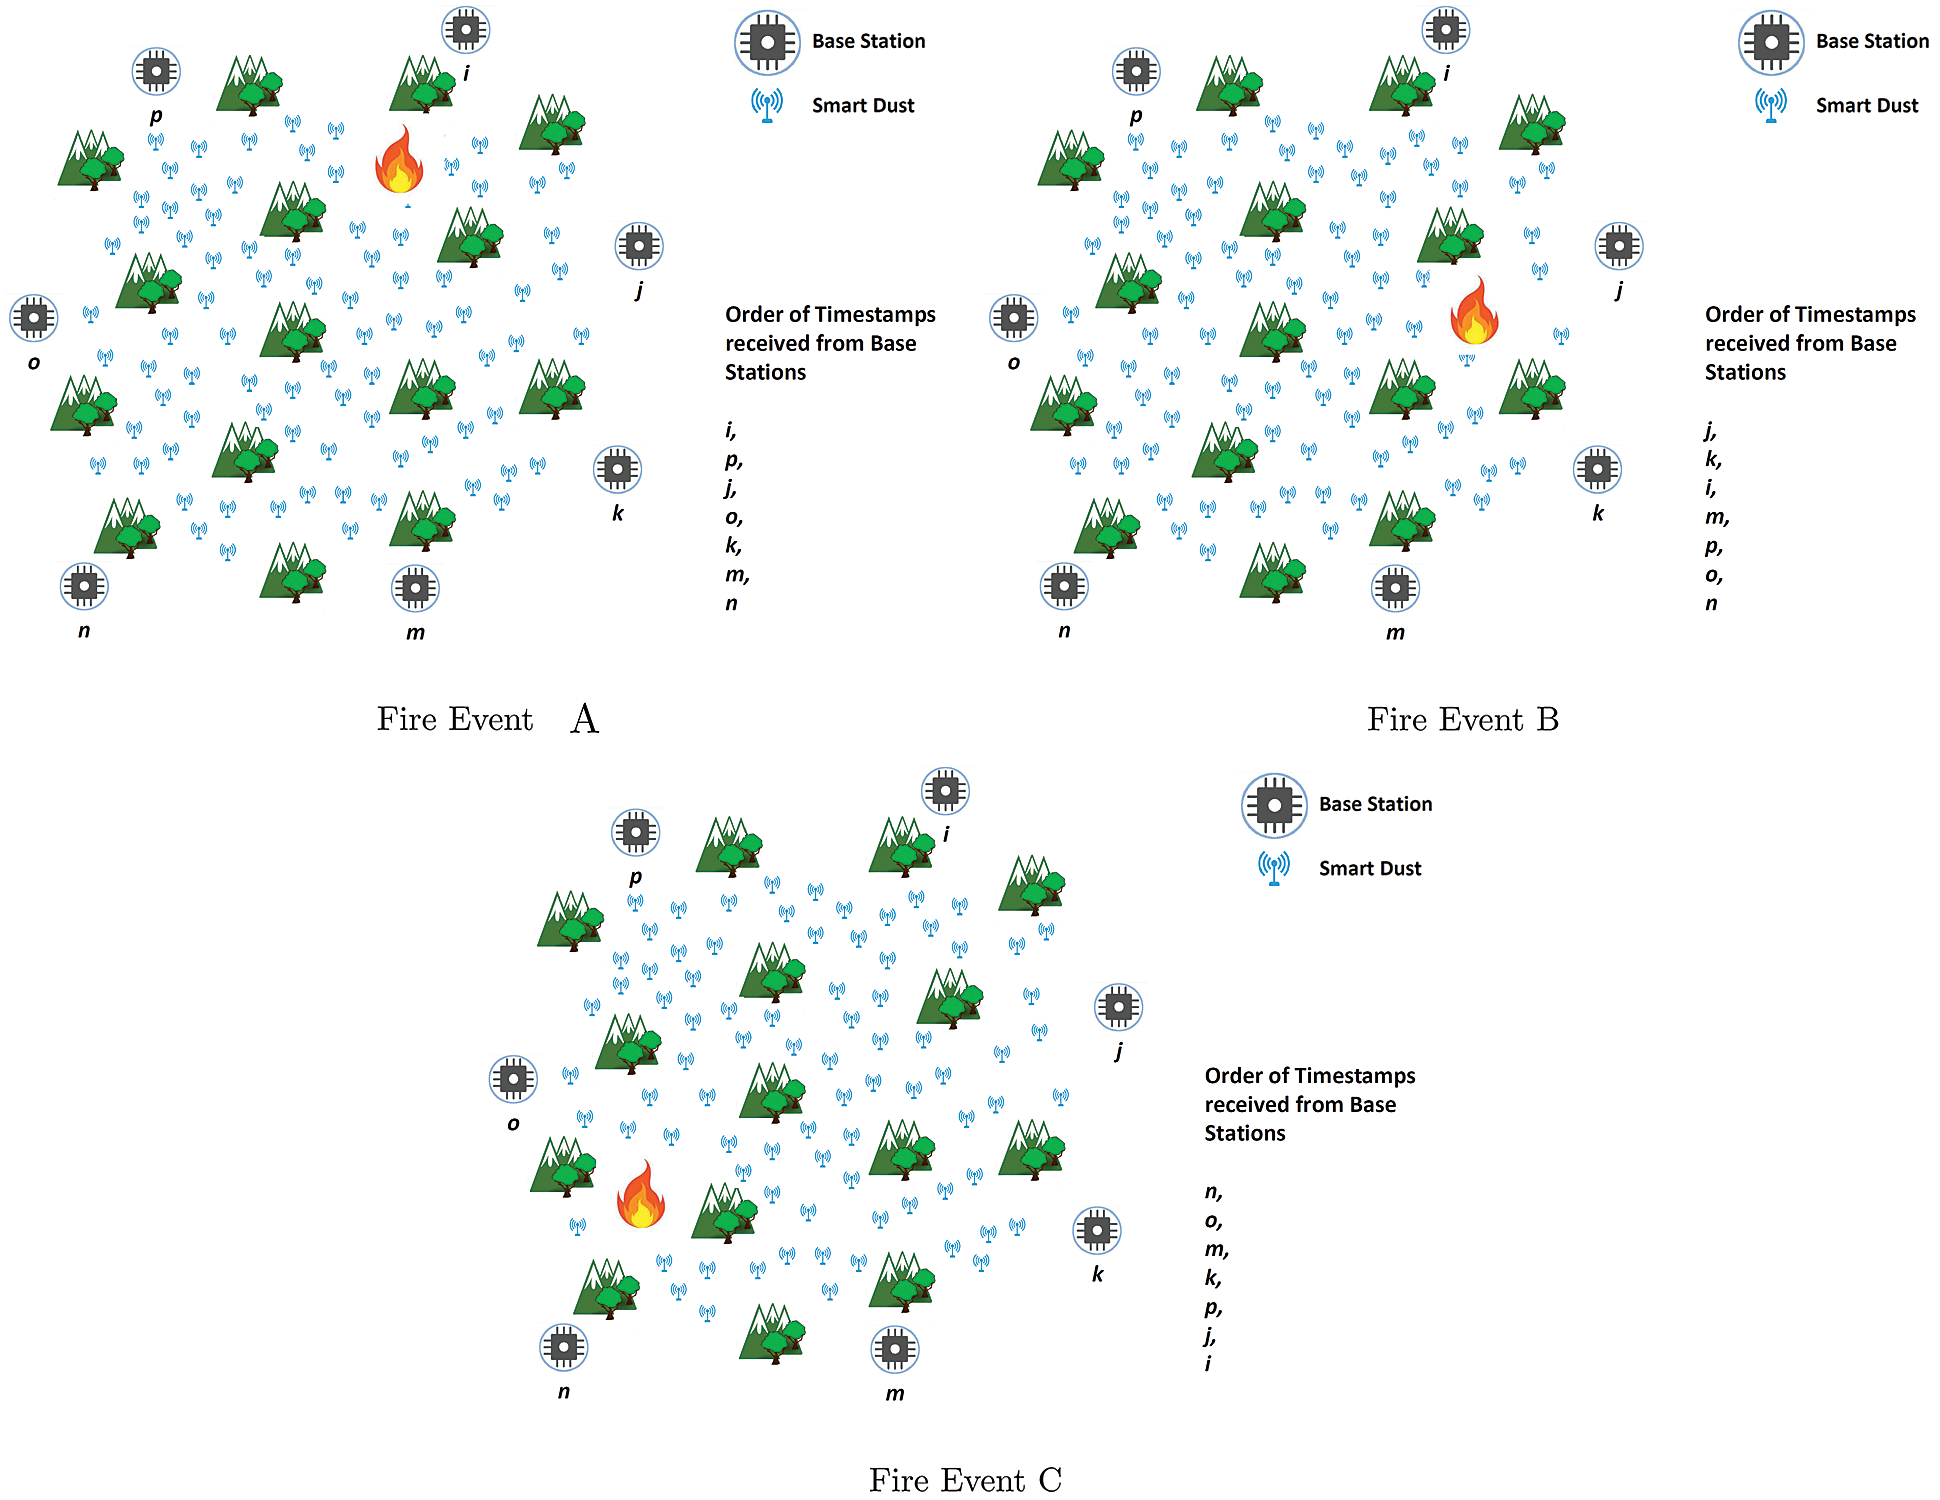
Figure 3: An example showing how the base sensors record signal timestamps (time of arrival) for different fire events that occurred at different locations of the monitoring region. The base stations near to fire event receive the signal earlier than the base stations far away from the fire event
To describe the learning mechanism of GRNN, let us assume that there is a training sample containing input and output vectors. The input vector contains m independent input attributes Xi= [x1, x2,…, xm] and output vector contains k dependent attributes Yi= [y1, y2,…yk]. If enough training samples are provided to the network, the GRNN can efficiently learn the regression surface (linear or non-linear), and has the ability to predict the values of the dependent outputs of a new unknown sample Xj. The training process of GRNN can be described as:
Given an input vector X from training samples n, the E[Y|X] is the predicted value of the attribute Y. The function f(Y, X) represents the join probability density of X and Y.
The architecture of GRNN contains four layers. These are the input layer, pattern layer, summation layer, and output layer. Fig. 4 shows the architecture of GRNN. Nodes (neurons) of the input layer are equal to the total number of attributes of input vector Xi. Each node represents an independent attribute of the input vector. Each node of the input layer sends its data value to all nodes of the pattern layer. The number of nodes on the pattern layer is equal to the total of training samples. The objective of sending the values of input attributes to the pattern layer is to learn the relationship between the nodes of the input layer and the (proper response) nodes of the output layer. This mapping between the input layer and pattern layer non-linearly transforms the input space to the pattern space. The Gaussian function of the pattern layer piis described as:
σ is a smoothing parameter. X is the input variable of the network. Xiis a sample of the training set for the node i of the pattern layer.
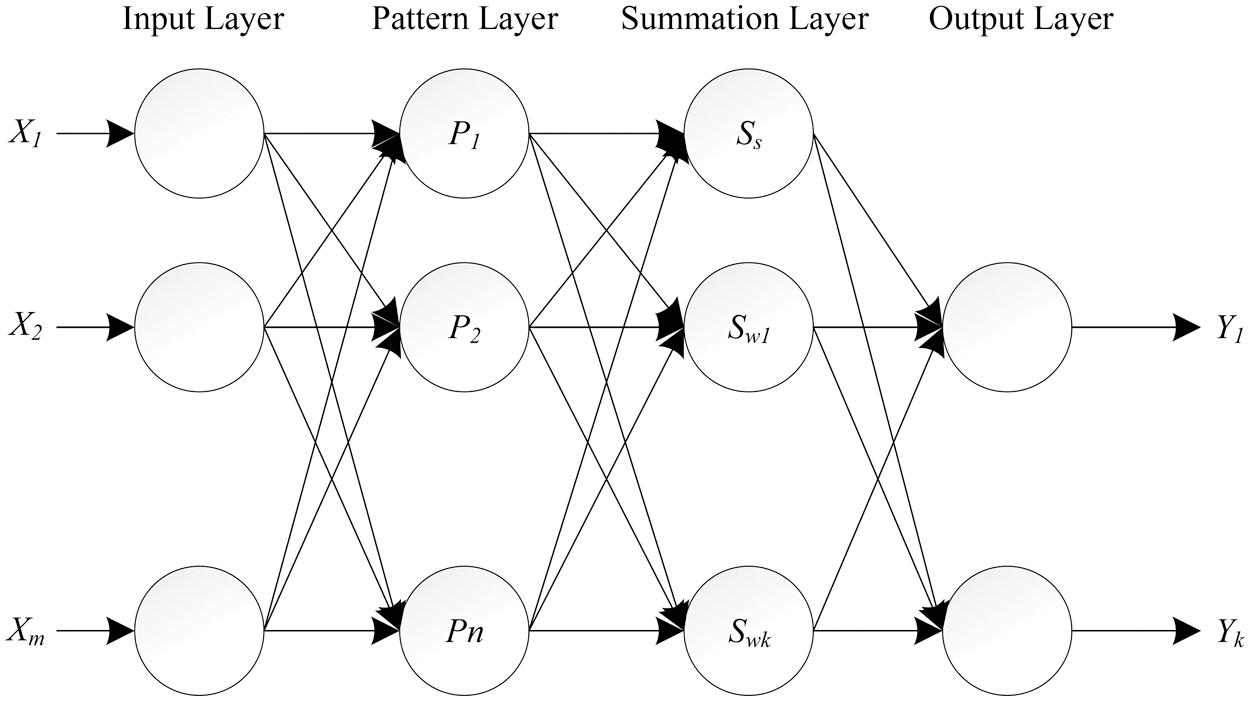
Figure 4: The architecture of GRNN (general regression neural network)
The summation layer contains two types of summation functions. These are simple summation and weighted summation. Ssis the simple summation. It calculates the sum of the values received from the nodes of the pattern layer using the interconnection weight equal to 1. Swcomputes the weighted sum of the nodes of pattern layer using the interconnection weight equal to w. The summation functions are defined as:
The wtis the weight of the node of the pattern layer that is connected with the summation layer.
The last layer is the output layer and the number of nodes at the output layer is equal to the total number of dependent attributes of the training samples. The geographical coordinates prediction task has two numeric attributes and these can be specified on two nodes of the output layer. The summation layer sends the computed values to the output layer. The output of the node at the output layer is computed as follows:
To train the GRNN for the best prediction accuracy, the spread parameter σ holds an important role [43]. For example, training the GRNN with a smaller value of σ can result in a localised regression prediction. In this case, the training samples that are very close to the neighbour of the prediction sample only contribute to the prediction of the final output. On the other hand, training the GRNN with a larger value of σ can result in globalised regression prediction which includes all the samples for predicting the value of the output node. In this case, the predicted value of the output node is very close to the average value of the dependent attribute of all samples of the training dataset.
Due to the stochastic nature of the GRNN, it is important to evaluate the network repeatedly on the same training samples. For this purpose, we evaluate the network on k-fold cross-validation with 10 folds. For doing this, we randomly partitioned the training samples into five groups where each group contains an equal number of samples. Then we select four groups randomly to learn an optimized value of the spread parameter by doing cross-validation. We place the selected four groups into the first set. We then construct a second set which contains the remaining group, and it is used for analysing the prediction accuracy. For training the GRNN using cross-validation, we build the model using a random value of spread parameter on random three groups of the first set. After training, the model is tested on the group of the second set. If the GRNN model provides optimal prediction accuracy on the test partition, then the GRNN is returned as an output. However, if the GRNN model does not produce optimal prediction accuracy then the system again trains the model with a new value (σi) of speared parameter (σ). The new value of σ is generated from the following rule.
σo is an initial spread parameter. In the experiment, we use the σo with a small value of 0.1. The η denotes the learning ratio and is set with a value of 0.1. The training is stopped when the mean square error of the cross-validation is smaller than the predefined error e0, set at 0.01. To avoid over-fitting, another criterion (maximum number of iterations) is used for stopping the training. We perform the experiments with maximum iterations equal to 20. When the total number of iterations during the training phase is greater than 20, the system randomly selects new sets for training, testing, and cross-validation. Because the system selects the sets randomly, therefore, GRNN is optimized for the prediction on a cross-validation set which helps in avoiding overfitting.
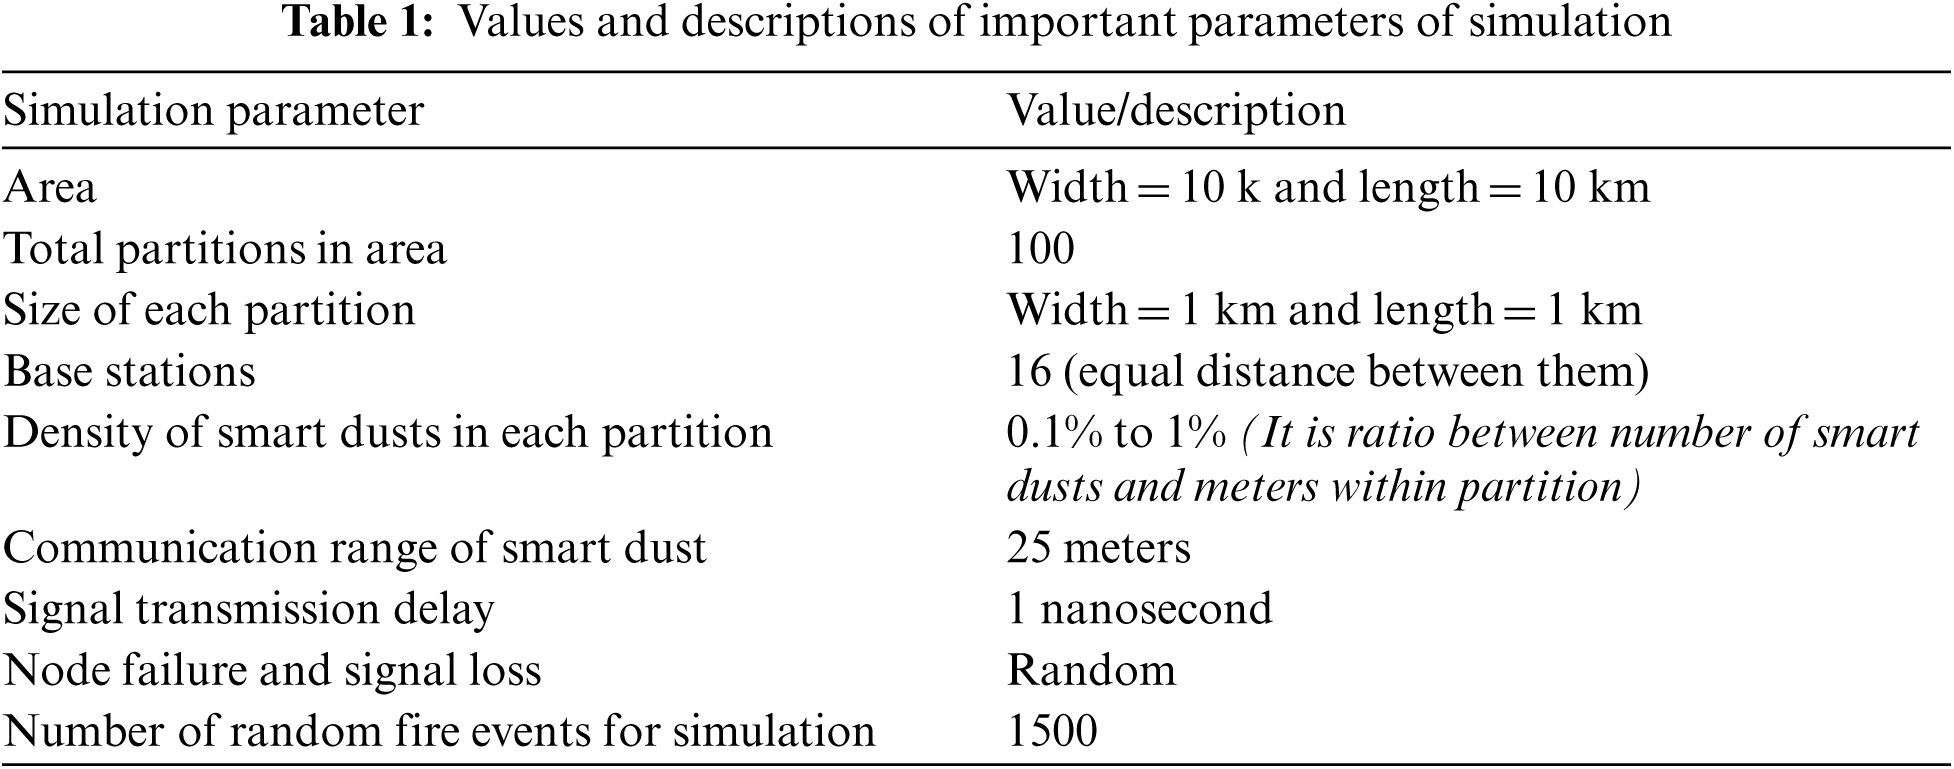
Unfortunately, true smart dust hardware is not yet available. We implemented a simulator to examine the efficiency of the proposed research for monitoring forest fire which is only one way to show the feasibility of the proposed approach. Our ultimate objective is to implement a real project to monitor the forest fire using smart dusts. The experiments were performed on intel core i7-7th generation CPU with a processor speed of 2.11 Ghz and main memory of size 8 GB. We created a simulated monitoring region of rectangle shape with width and length equal to 10 km. The monitoring region was divided into 100 partitions with width and length equal to 1 km. Sixteen base stations were placed on the boundary of monitoring region with an equal distance between them. Through simulation, smart dusts were sprinkled on partitions with varying densities. Each partition received an equal number of smart dusts which were placed randomly on the partition. Each smart dust had the ability to transmit the signal of the sensed event within a range of 25 meters. The signal transmission delay from one smart dust to another smart dust or base station was randomly set to 1 nanosecond. Other network factors such as node failure and signal loss were randomly considered for the simulation. Tab. 1 shows values and descriptions of important parameters of simulation.
The simulator generates the fire events randomly on the monitoring regions. The smart dusts sense fire events if the events are within their range and transmit the signal to base stations. The base stations collect the signal timestamps and forward to the cloud server which assembles them into training samples to train a GRNN. To decrease the bottleneck of transmission, each smart dust contains a threshold for sensing the events. Whenever the value of a sensed event is greater than the threshold, the smart dust generates a signal and transmits to neighbouring smart dusts. Once the enough simulated samples are available, the system trains the GRNN using the approach presented in Section 3.
According to the best of our knowledge currently, there are two studies available on estimating locations of smart dusts. These are hierarchical layered architecture [12] and patterns of laser approach [31]. However, to compare the effectiveness of the proposed approach with the existing solutions we need to take into account the constraints of application that we have addressed in the article. The objective of this study is to monitor rough terrains that are difficult or impossible to access by humans such as forests, frozen lands, mountains, sea, space, planets, etc. The constraints of these applications are: the surface of rough terrain is uneven, and the sensors should offer long-lived battery with an autonomous power supply. Thus we cannot use the wireless sensors or IoT devices with long wireless communication range and GPS as these sensors offer short-lived batteries.
Unfortunately, we cannot computationally compare the performance of the existing approaches with our approach. However, we are providing the reasons that why the existing approaches are not suitable for the regions that we want to monitor in this study. The approach proposed in [31] estimates the locations of smart dusts by observing certain patterns of laser which are transmitted to them from an infrastructure device. This approach is not suitable for the monitoring regions that have uneven surfaces (e.g., forests, mountains, planets), because due to obstacles on an uneven surface the smart dusts cannot directly observe the laser patterns of the infrastructure device. The approach proposed in [12] requires relay sensors for transmitting the signals of smart dusts to the base station. These sensors are limited in number, however, deployed on the monitoring region similar to smart dusts. The relay sensors contain enough computing and transmission capabilities for processing and transmitting data to the upper layer on a long-range, however, offer short-lived battery and are not suitable for the monitoring regions that are difficult to approach by humans.
We tested the accuracy of the proposed approach based on the following two aspects. In the first aspect, we analysed how accurate the approach estimates the location of sensed events on varying densities of smart dusts. The density was measured in terms of the ratio between the number of smart dusts and meters within the partition. The accuracy was measured in terms of the difference (in meters) between the exact coordinates and the predicted coordinates. We analysed the accuracy of a group of test samples which were not used for training. The sensor nodes were annotated with the coordinates (x ± Δx, y ± Δy), where (x, y) represented the true ground positions in meters, ± Δxand ± Δyrepresented the average difference between the locations predicted by the ML classifier and the true ground positions in the x and y-axis, respectively. Fig. 5 shows mean absolute error on varying densities. On 0.9% smart dust density, the mean absolute error for Δxwas 6.38 meters, and for Δyit was 5.41 meters. The maximum errors of the sensor node location estimate were Δx = 17.36 meters and Δy = 16.64 meters. Figs. 6 and 7 show the performance of base stations with respect to sensed events that occurred at different coordinates of the monitoring region. We showed the performance for only selective six base sensors. These sensors are selected three from left edge (left-top, left-middle, left-bottom), and three from right edge (right-top, right-middle, right-bottom). According to results when the sensed events occurred near to base stations the values of signal arrival timestamps were small as compared to when the sensed events occurred far away from the base stations. This shows when an event occurs, the base stations near to sensed event receive the event's signal earlier than the base stations that are far away from the sensed event.
In the second aspect, we analysed the accuracy of the proposed approach in the situation when the smart dusts were assumed faulty and some base stations could not receive the timestamps from the smart dusts. Since values of base stations represent dimensions of an input sample, therefore in this aspect we tried to analyse the accuracy of the ML predictor if the unknown input samples have missing values. For performing experiments, we randomly removed the values of base stations with different percentages. We removed the values of base stations from all edges with 25%, 50%, 75%, and 100% percentages. Fig. 8 shows the accuracy of GRNN predictor on different percentages of missing values. The accuracy of GRNN predictor was significantly decreased when more than 50% base stations had missing values. This shows that the proposed approach can estimate reasonably well the location of sensed event if few smart dusts were faulty and could not report the sensed events to base stations.
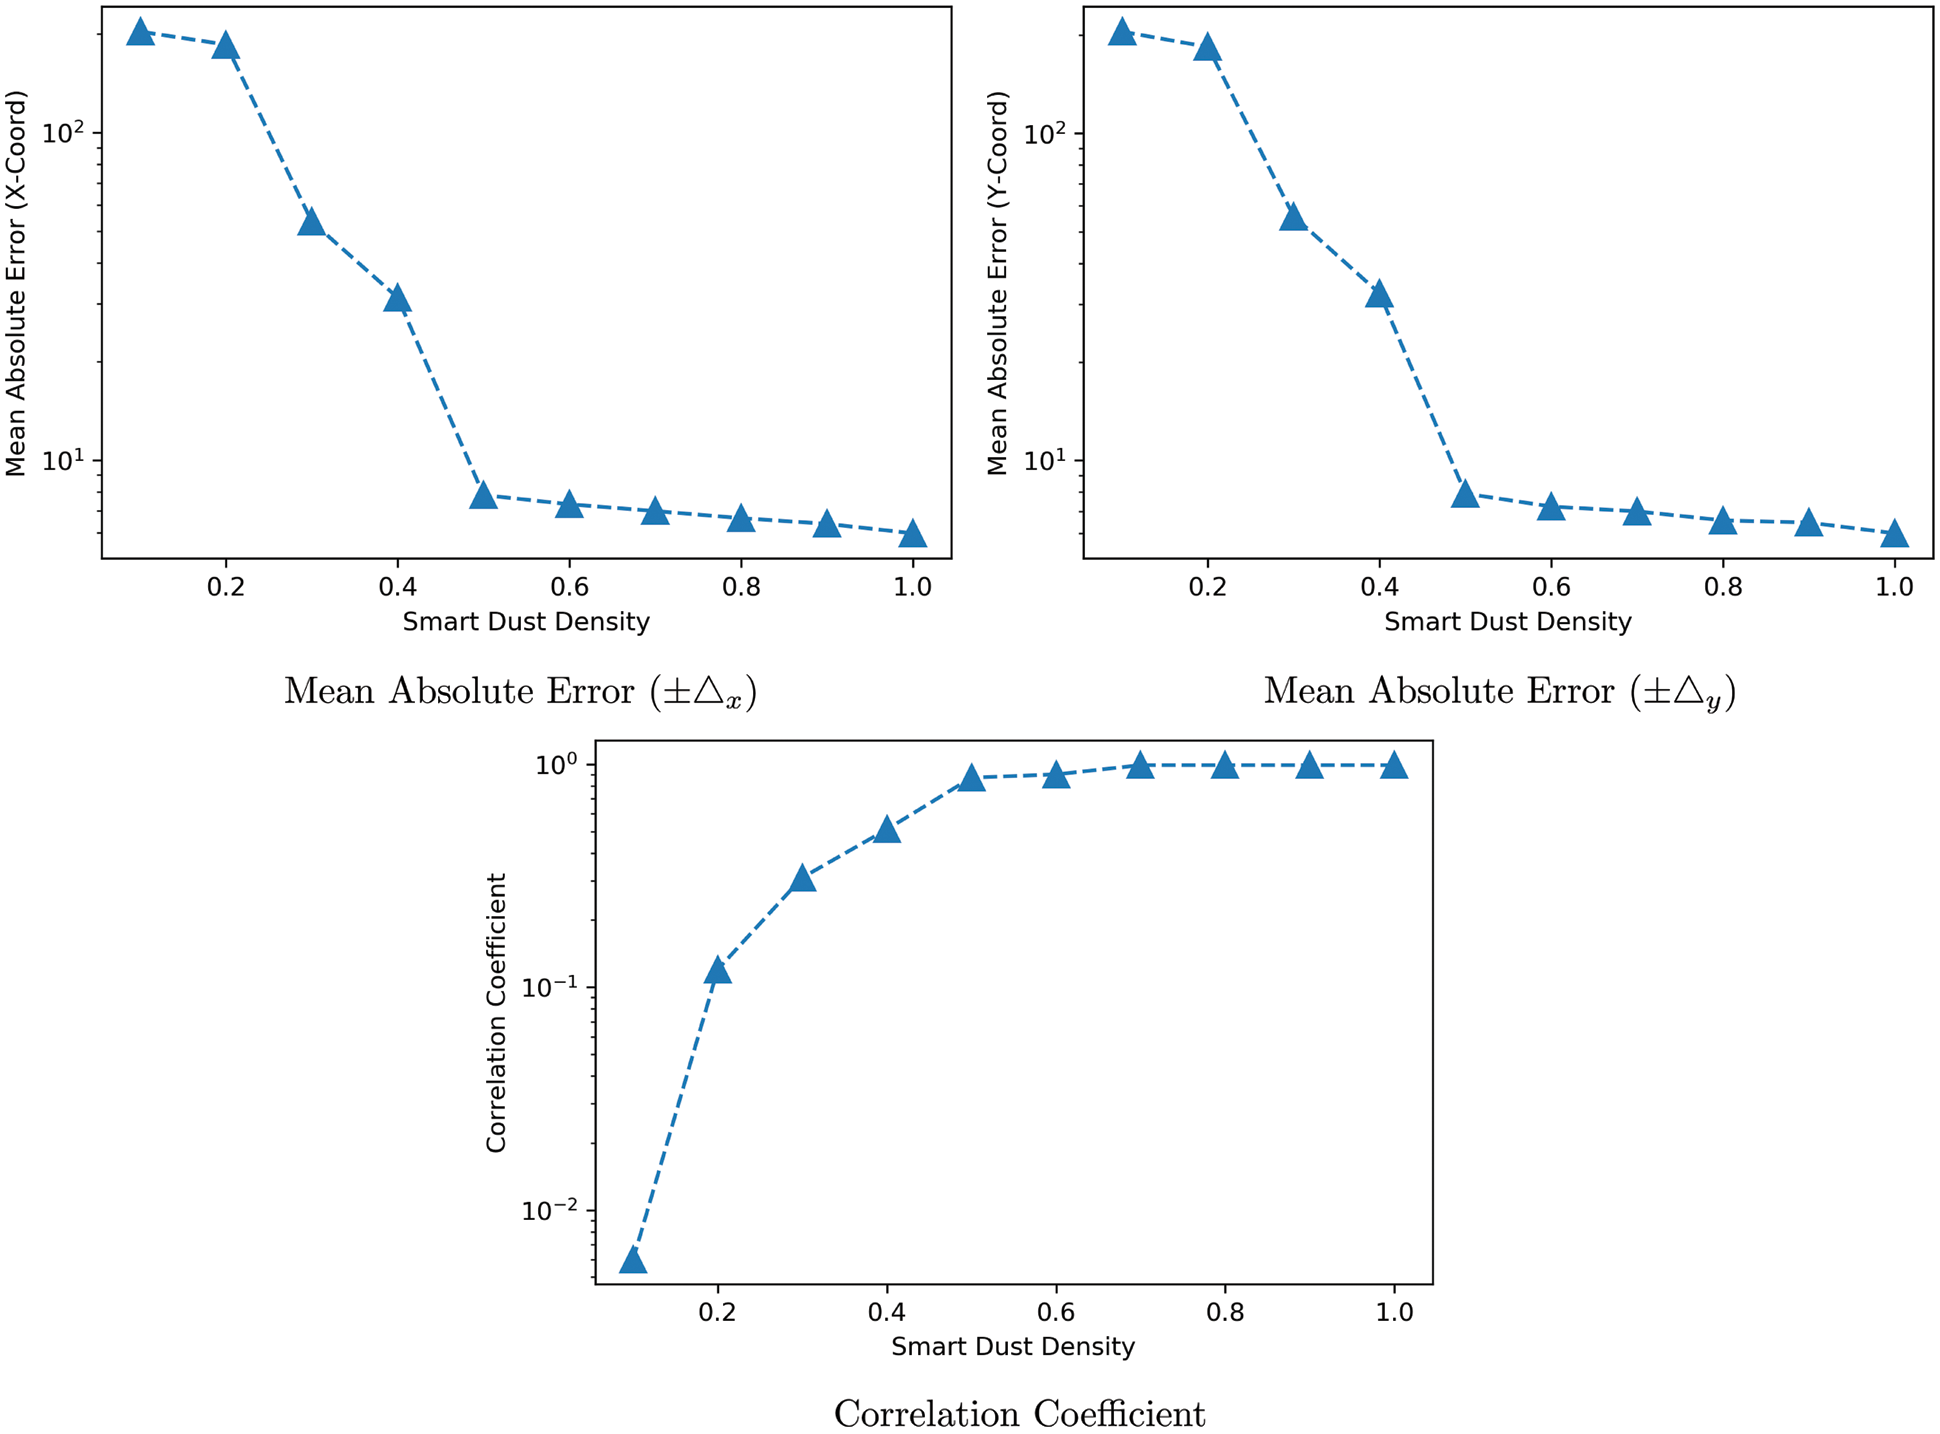
Figure 5: Mean absolute error of coordinates and correlation coefficient of classifier on varying smart dust densities

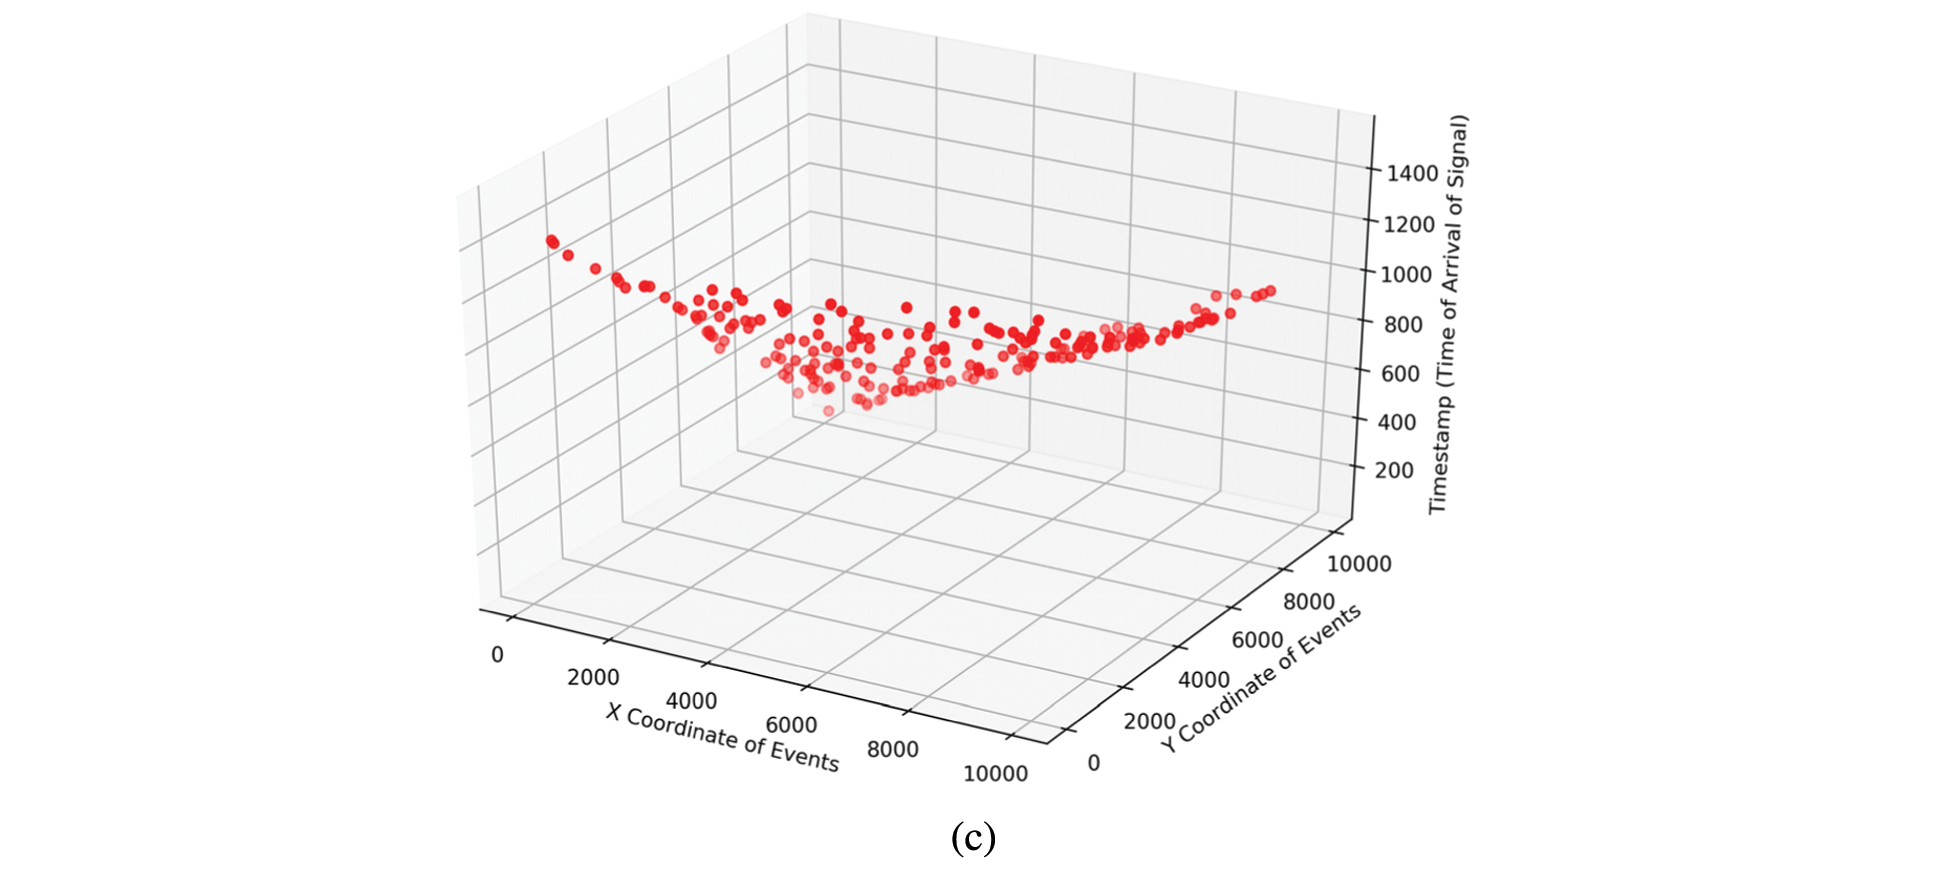
Figure 6: Performance of base stations at left edge with respect to sensed events occurred at different coordinates of monitoring region. The result shows the values of signal arrival timestamps of events are small when the events occurred near to base station as compared to when the events occurred far away from the base station. (a) Left-top Base Sensor (b) Left-Middle Base Sensor (c) Left-bottom Base Sensor
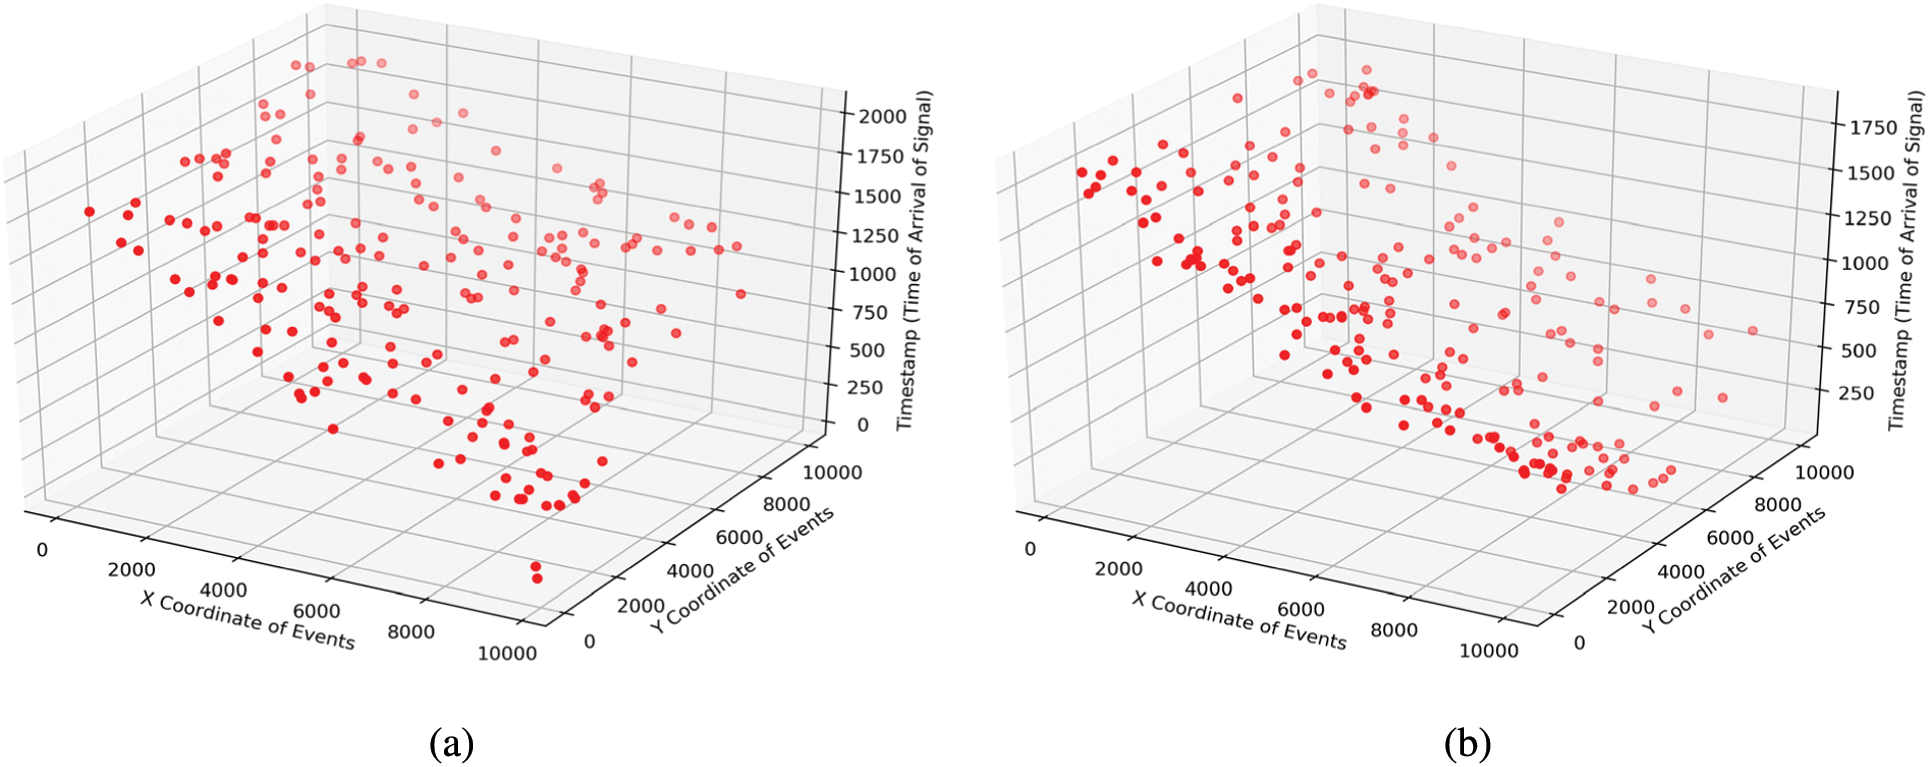
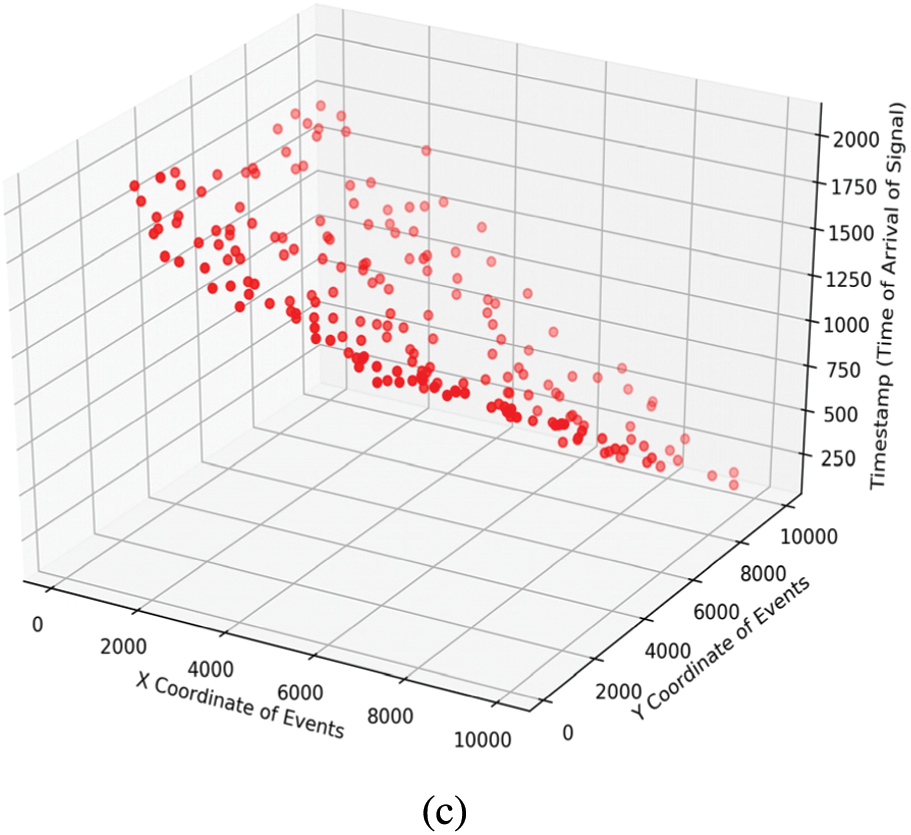
Figure 7: Performance of base stations at right edge with respect to sensed events that occurred at different coordinates of monitoring region. The result shows the values of signal arrival timestamps of events are small when the events occurred near to base station as compared to when the events occurred far away from the base station. (a) Top Base Sensor (b) Middle Base Sensor (c) Bottom Base Sensor

Figure 8: Effectiveness of GRNN on missing values of base stations
Smart dust is an emerging technology which has a number of applications to remotely-sensed regions that are difficult to access by humans. However, the small size of smart dust fundamentally restricts the integration of advanced IoT technologies on tiny sensors. This raised many challenges including how to estimate the location of smart dusts. The article proposes a localization algorithm for detecting the location of events sensed by the smart dusts. The approach predicts the locations using general regression neural network. Due to the unavailability of real smart dusts, we built a simulator for analysing the accuracy of the proposed approach for the application of forest fire detection. While this is the only way to analyse the accuracy of the proposed approach, our ultimate objective is to analyse the accuracy on large monitoring regions with real smart dusts. The experiments on a custom-developed simulator show reasonable accuracy of the approach. We conducted experiments with various aspects to analyse the effectiveness of the approach. The effectiveness of the proposed algorithm increases by 60% when almost 60% of base sensors receive event timestamps from smart dusts. Currently, we trained the predictive model using GRNN (General Regression Neural Network). The GRNN offers advantage in terms of effectiveness but it takes more computation time during training. Further research is possible on developing predictive classifier that can reduce computation time and improve accuracy.
1https://www.gartner.com/en/newsroom/press-releases/2018-08-20-gartner-identifies-five-emerging-technology-trendsthat-will-blur-the-lines-between-human-and-machine.
2https://medium.com/war-is-boring/smart-dust-is-getting-smarter-4b062abd7769.
3https://thefutureofthings.com/3221-hitachi-develops-worlds-smallest-rfid-chip/.
Funding Statement: This research is supported by Universiti Brunei Darussalam (UBD) under FIC allied research grant program.
Conflicts of Interest: The authors declare that they have no conflicts of interest to report regarding the present study.
1. P. Sanjeevi, S. Prasanna, B. Sivakumar, G. Gunasekaran, I. Alagiri et al., “Precision agriculture and farming using internet of things based on wireless sensor network,” Emerging Telecommunications Technologies, vol. 31, no. 12, pp. 1–12, 2020. [Google Scholar]
2. C. Jamroen, P. Komkum, C. Fongkerd and W. Krongpha, “An intelligent irrigation scheduling system using low-cost wireless sensor network toward sustainable and precision agriculture,” IEEE Access, vol. 8, no. 1, pp. 172756–172769, 2020. [Google Scholar]
3. L. Garcia, L. Parra, J. M. Jimenez, J. Lloret and P. Lorenz, “IoT-Based smart irrigation systems: An overview on the recent trends on sensors and IoT systems for irrigation in precision agriculture,” Sensors, vol. 20, no. 4, 2020. [Google Scholar]
4. W. Wang, “A remote monitoring system of logistics carrier based on wireless sensor network,” International Journal of Online and Biomedical Engineering, vol. 14, no. 1, pp. 4–16, 2018. [Google Scholar]
5. J. A. Luis, J. A. G. Galan, F. Gomez-Bravo, M. Sanchez-Raya, J. A. Espigado et al., “An efficient wireless sensor network for industrial monitoring and control,” Sensors, vol. 18, no. 1, pp. 182–197, 2018. [Google Scholar]
6. W. Chen and X. Wang, “Coal mine safety intelligent monitoring based on wireless sensor network,” IEEE Sensors Journal, vol. 21, no. 22, pp. 25465–25471, 2021. [Google Scholar]
7. L. Muduli, D. P. Mishra and P. K. Jana, “Application of wireless sensor network for environmental monitoring in underground coal mines: A systematic review,” Journal of Network and Computer Applications, vol. 106, no. 1, pp. 48–67, 2018. [Google Scholar]
8. H. Noureddine and K. Bouabdellah, “Using wireless multimedia sensor networks to enhance early forest fire detection,” International Journal of Distributed Systems and Technologies, vol. 11, no. 3, pp. 1–21, 2020. [Google Scholar]
9. N. Varela, D. -M. Jorge L, A. Ospino and N. A. L. Zelaya, “Wireless sensor network for forest fire detection,” Procedia Computer Science, vol. 175, no. 1, pp. 435–440, 2020. [Google Scholar]
10. K. K. Khedo, Y. Bissessur and D. S. Goolaub, “An inland wireless sensor network system for monitoring seismic activity,” Future Generation Computer Systems, vol. 105, no. 1, pp. 520–532, 2020. [Google Scholar]
11. G. Xu, Y. Shi, X. Sun and W. Shen, “Internet of things in marine environment monitoring: A review,” Sensors, vol. 19, no. 7, pp. 1711–1732, 2019. [Google Scholar]
12. J. Park and K. Park, “A dynamic plane prediction method using the extended frame in smart dust IoT environments,” Sensors, vol. 20, no. 5, pp. 1364–1380, 2020. [Google Scholar]
13. L. Niccolai, M. Bassetto, A. A. Quarta and G. Mengali, “A review of smart dust architecture, dynamics, and mission applications,” Progress in Aerospace Sciences, vol. 106, no. 1, pp. 1–14, 2019. [Google Scholar]
14. B. Warneke, M. Last, B. Liebowitz and K. S. J. Pister, “Smart dust: Communicating with a cubic-millimeter computer,” Computer, vol. 34, no. 1, pp. 44–51, 2001. [Google Scholar]
15. M. Holler, B. van Giffen, L. Barth and R. Fuchs, “Smart dust for smart(er) industrial product-service-systems: Three strategies and their application,” in Proc. of Smart Services Summit, Third Smart Services Summit 2020, Zurich (onlineSwitzerland, pp. 15–20, 2021. [Google Scholar]
16. J. Park and K. Park, “Construction of a remote monitoring system in smart dust environment,” Journal of Information Processing Systems, vol. 16, no. 3, pp. 733–741, 2020. [Google Scholar]
17. J. M. Kahn, R. H. Katz and K. S. J. Pister, “Emerging challenges: Mobile networking for smart dust,” Journal of Communications and Networks, vol. 2, no. 3, pp. 188–196, 2000. [Google Scholar]
18. J. M. Kahn, R. H. Katz and K. S. J. Pister, “Next century challenges: Mobile networking for smart dust,” in Proc. of Fifth Annual ACM/IEEE Int. Conf. on Mobile Computing and Networking, Seattle, Washington, USA, pp. 271–278, August 15–19, 1999. [Google Scholar]
19. B. Atwood, B. Warneke and K. Pister, “Preliminary circuits for smart dust,” in Proc. of 2000 Southwest Symp. on Mixed-Signal Design, San Diego, CA, USA, pp. 87–92, 2000. [Google Scholar]
20. Z. Karakehayov, “Zero-power design for smart dust networks,” in Proc. of First Int. IEEE Symp. Intelligent Systems, Varna, Bulgaria, vol. 1, pp. 302–305, 2002. [Google Scholar]
21. T. Watteyne, “Crystal-free architectures for smart dust and the industrial IoT,” in Proc. of 2020 7th Int. Conf. on Internet of Things: Systems, Management and Security, Paris, France, pp. 1–1, 2020. [Google Scholar]
22. M. Holler, J. Haarmann, B. van Giffen and A. G. Frank, “Smart dust in the industrial economic sector-on application cases in product lifecycle management,” in Proc. of IFIP Int. Conf. on Product Lifecycle Management, Rapperswil, Switzerland, pp. 165–175, 2020. [Google Scholar]
23. M. Holler, C. Dremel, B. van Giffen and R. Fuchs, “Smart dust und micro robots im industriellen sector,” HMD Praxis der Wirtschaftsinformatik, vol. 57, no. 1, pp. 1239–1250, 2020. [Google Scholar]
24. R. M. Aileni, G. Suciu, M. Serrano, R. Maheswar, C. A. V. Sakuyama et al., “The perspective of smart dust mesh based on IoEE for safety and security in the smart cities,” in Integration of WSN and IoT for Smart Cities, Book Chapter, Springer International Publishing, pp. 151–179, 2020. [Google Scholar]
25. S. Sathyan and S. R. Pulari, “A deeper insight on developments and real-time applications of smart dust particle sensor technology,” in Computational Vision and Bio Inspired Computing, Book Chapter, Springer, Cham, pp. 193–204, 2018. [Google Scholar]
26. G. N. Rameshaiah, J. pallavi and S. Shabnam, “Nano fertilizers and nano sensors - an attempt for developing smart agriculture,” International Journal of Engineering Research and General Science, vol. 3, no. 1, pp. 314–320, 2015. [Google Scholar]
27. C. Mohan and S. Arulselvi, “Smart dust network for tactical border surveillance using multiple signatures,” IOSR Journal of Electronics and Communication Engineering, vol. 5, no. 1, pp. 1–10, 2013. [Google Scholar]
28. J. Park and K. Park, “A Two-class data transmission method using a lightweight blockchain structure for secure smart dust IoT environments,” Sensors, vol. 20, no. 21, pp. 6078–6095, 2020. [Google Scholar]
29. A. K. Paul and T. Sato, “Localization in wireless sensor networks: A survey on algorithms, measurement techniques, applications and challenges,” Journal of Sensor and Actuator Networks, vol. 6, no. 4, pp. 24–47, 2017. [Google Scholar]
30. F. Mekelleche and H. Haffaf, “Classification and comparison of range-based localization techniques in wireless sensor networks,” Journal of Communications, vol. 12, no. 4, pp. 221–227, 2017. [Google Scholar]
31. K. Romer, “Tracking real-world phenomena with smart dust,” in Proc. of First European Workshop, EWSN 2004, Springer, Berlin, Germany, pp. 28–43, January 19-21, 2004. [Google Scholar]
32. D. Sadana, N. Li, S. Bedell and G. S. Shahidi, “Smart dust and internet of things (IoTProgress & challenges,” Journal of Lasers, Optics & Photonics, vol. 4, no. 1, 2017. [Google Scholar]
33. H. Xu, “Semi-supervised manifold learning based on polynomial mapping for localization in wireless sensor networks,” Signal Processing, vol. 172, no. 1, pp. 107570, 2020. [Google Scholar]
34. K. M. Akhil and S. Sinha, “Self-localization in large scale wireless sensor network using machine learning,” in Proc. of 2020 Int. Conf. on Emerging Trends in Information Technology and Engineering, Vellore, India, pp. 1–5, 2020. [Google Scholar]
35. S. K. Jain and N. Kesswani, “Smart judiciary system: A smart dust based IoT application,” in Proc. of Emerging Technologies in Computer Engineering: Microservices in Big Data Analytics, Singapore, pp. 128–140, 2019. [Google Scholar]
36. M. Buettner, B. Greenstein, A. P. Sample, J. R. Smith and D. Wetherall, “Revisiting smart dust with RFID sensor networks,” in Proc. of 7th ACM Workshop on Hot Topics in Networks (HotNetsCalgary, Alberta, Canada, pp. 37–42, October 6--7, 2008. [Google Scholar]
37. S. N. R. Kantareddy, R. Bhattacharyya and S. E. Sarma, “UHF RFID tag IC power mode switching for wireless sensing of resistive and electrochemical transduction modalities,” in Proc. of 2018 IEEE Int. Conf. on RFID, Orlando, FL, USA, pp. 1–8, April 10--12, 2018. [Google Scholar]
38. O. Polat and T. Yildirim, “Hand geometry identification without feature extraction by general regression neural network,” Expert Systems with Applications, vol. 34, no. 2, pp. 845–849, 2008. [Google Scholar]
39. D. Specht, “A general regression neural network,” IEEE Transactions on Neural Networks, vol. 2, no. 6, pp. 568–576, 1991. [Google Scholar]
40. H. B. Celikoglu, “Application of radial basis function and generalized regression neural networks in non-linear utility function specification for travel mode choice modelling,” Mathematical and Computer Modelling, vol. 44, no. 7, pp. 640–658, 2006. [Google Scholar]
41. A. H. Manek and P. K. Singh, “Comparative study of neural network architectures for rainfall prediction,” in Proc. of 2016 IEEE Technological Innovations in ICT for Agriculture and Rural Development (TIAR), Chennai, India, pp. 171–174, 2016. [Google Scholar]
42. Y. Ni and M. Li, “Wind pressure data reconstruction using neural network techniques: A comparison between BPNN and GRNN,” Measurement, vol. 88, no. 1, pp. 468–476, 2016. [Google Scholar]
43. J. Liu, W. Bao, L. Shi, B. Q. Zuo and W. Gao, “General regression neural network for prediction of sound absorption coefficients of sandwich structure nonwoven absorbers,” Applied Acoustics, vol. 76, no. 1, pp. 128–137, 2014. [Google Scholar]
 | This work is licensed under a Creative Commons Attribution 4.0 International License, which permits unrestricted use, distribution, and reproduction in any medium, provided the original work is properly cited. |