DOI:10.32604/cmc.2022.024364
| Computers, Materials & Continua DOI:10.32604/cmc.2022.024364 | |
| Article |
Fusion Based Tongue Color Image Analysis Model for Biomedical Applications
1School of Engineering, Princess Sumaya University for Technology, Amman, 11941, Jordan
2Management Information Systems Department, College of Business Administration, University of Business and Technology, Jeddah, 21448, Saudi Arabia
*Corresponding Author: Bassam A. Y. Alqaralleh. Email: b.alqaralleh@ubt.edu.sa
Received: 14 October 2021; Accepted: 29 November 2021
Abstract: Tongue diagnosis is a novel and non-invasive approach commonly employed to carry out the supplementary diagnosis over the globe. Recently, several deep learning (DL) based tongue color image analysis models have existed in the literature for the effective detection of diseases. This paper presents a fusion of handcrafted with deep features based tongue color image analysis (FHDF-TCIA) technique to biomedical applications. The proposed FDHF-TCIA technique aims to investigate the tongue images using fusion model, and thereby determines the existence of disease. Primarily, the FHDF-TCIA technique comprises Gaussian filtering based preprocessing to eradicate the noise. The proposed FHDF-TCIA model encompasses a fusion of handcrafted local binary patterns (LBP) with MobileNet based deep features for the generation of optimal feature vectors. In addition, the political optimizer based quantum neural network (PO-QNN) based classification technique has been utilized for determining the proper class labels for it. A detailed simulation outcomes analysis of the FHDF-TCIA technique reported the higher accuracy of 0.992.
Keywords: Tongue color image; tongue diagnosis; biomedical; healthcare; deep learning; metaheuristics
Tongue colour is regarded as a key indicator of somatic healthcare in the field of East Asian medication that was initially invented in early China [1]. Generally, physicians estimate tongue features and utilize resulting conclusions to notify their intelligence and decision regarding medical conduct. Tongue colour is categorized by various subclasses that offer valuable diagnostic data of a personal conflict. E.g., a reddish colour recommends psychological issues/extreme inner body heat, whereas a bluish colour recommends blood coldness/blood congestion, amongst others [2]. Moreover, researchers used certain pattern detection methods like artificial intelligence, to assess relationships among disease state tongue colour and [3]. But, indications for the use of tongue body colour estimations in consolidative medication still remain uncertain, since assessment models utilized before haven't often been adequately reproducible/quantitative (medical experience/tacit knowledge have always been prioritized in evaluations) [4]. When relationships among tongue body colour, as evaluated through a noninvasive tongue inspection, and certain medical results are determined, subsequently tongue colour evaluation may permit for the earlier recognition of human body disease/irregularities.
Traditionally, medical doctors would examine this colour feature based on thorough understanding [5]. However, ambiguity and subjectivity are frequently followed by their diagnosis's result. In order to remove these qualitative features [6], tongue colour analysis is studied objectively using its colour characteristics which offer a novel methodology to diagnose diseases, one that decreases the physical injuries caused to the patient (associated with another medical study) [7]. The current publication has been determined and applied DL models to extract higher level representations to wide vision analyses procedures such as handwritten digit recognition, face identification, and object detection. However, there arises small or no research on CAD tongue image analysis through DL methods [8], in which CAD expert system using unambiguity and objectivity tongue analyses results are employed to facilitate the Western and TCM diagnoses results.
Kawanabe et al. [9] evaluate either tongue colour assessments, as accomplished in Kampo (classical Japanese) medication, through an automatic image acquisition scheme that has been related to specific indexes of personal healthcare. Information on age, diastolic blood pressure, sex, systolic blood pressure, body temperature, pulse rate (PR), past medical history (PMH), body mass index (BMI), and blood inspection results (creatinine, haemoglobin) have been gathered. Jiang et al. [10] proposed methods according to the computer tongue image analyses technique for observing the tongue features of 1778 contributors. Integrating quantitative tongue image characteristics, serological indexes, and fundamental data, involving the FLI and HSI, they used ML algorithms, involving LR, SVM, RF, GBDT, AdaBoost, NB, and NN for NAFLD diagnoses. The optimal fusion method to diagnose NAFLD using LR comprised the tongue image parameter.
Li et al. [11] established the prediction method which is employed for evaluating patients with blood glucose in higher and crisis situations. They establish the diabetes risk predictive method generated by integrated TCM tongue diagnoses with ML models. The 1512 subjects have been employed from the medical centre. Afterward, data preprocessing, they receive the 1 and 2 datasets. Dataset 1 has been utilized for training traditional ML method, whereas dataset 2 has been utilized for training DL method. Li et al. [12] established the noninvasive diabetics risk predictive method on the basis of tongue feature fusions and forecast the risk of diabetics and prediabetics. They gather tongue images, extracting texture features with TDAS and tongue features with colour, and extracting the innovative tongue feature using ResNet50, attains the combination of 2 features using GA_XGBT, lastly established the non-invasive diabetics risk predictive method and estimate the efficiency of testing efficiency.
Fan et al. [13] examine distinct characteristics in patients with diabetic Mellitus, gastric indications with images gathered from digital tongue images. Multitype feature extraction and election from 466 tongue images have been carried out. In the classifier phase, 2 dissimilar classifier models have been used, RF and SVM, for classifying gastric disease symptoms of TCM and DM.
Kawanabe et al. [14] use advancement in digital imaging processing to verify and quantify medical data tongue colour diagnoses by characterizing variances in tongue features. Estimation of body, coating, and tongue colour has been carried out using 10 skilled Kampo medical doctors. The attained images are categorized into 6 tongue coating colour classes and 5 tongue body colour classes according to the evaluation from ten medical doctors with widespread Kampo medical knowledge. K-means clustering model has been employed as an ML method (the research of pattern detection using computation learning) approach to the attained images for quantifying coating colour and tongue body data. Gholami et al. [15] focus on increasing the precision of gastric cancer diagnoses through integration of DNN, SVM, and DCNN depending on the colour and surface features of the tongue. The presented model has been estimated in 7 CNN frameworks.
This paper presents a fusion of handcrafted with deep features based tongue color image analysis (FHDF-TCIA) model for biomedical applications. Primarily, the FHDF-TCIA technique comprises Gaussian filtering based preprocessing to eradicate the noise. The proposed FHDF-TCIA model encompasses a fusion of handcrafted local binary patterns (LBP) with MobileNet based deep features for the generation of optimal feature vectors. In addition, the political optimizer based quantum neural network (PO-QNN) based classification approach has been utilized for determining the proper class labels for it. A detailed simulation outcomes analysis of the FHDF-TCIA technique occurs on benchmark images and the outcomes are inspected in varying aspects.
In this study, a new FHDF-TCIA technique has been developed for automated tongue color image analysis. The proposed FHDF-TCIA technique comprises preprocessing, fusion based feature extraction, QNN based classification. Fig. 1 demonstrates the overall block diagram of FHDF-TCIA model.
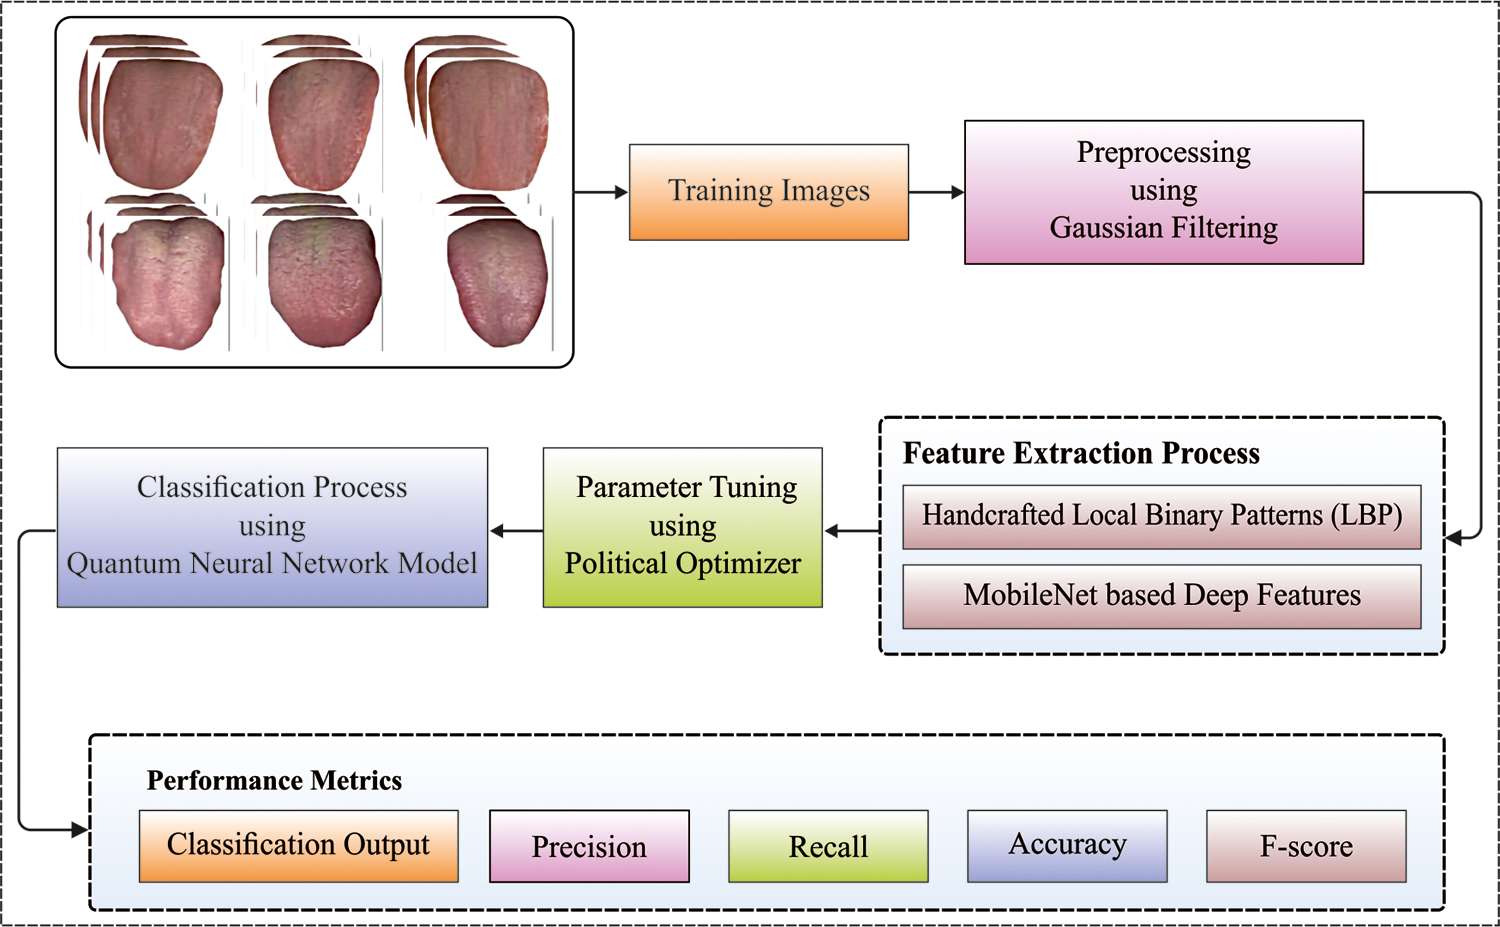
Figure 1: Overall block diagram of FHDF-TCIA model
The GF has been utilized to smoothen and eradicate noise. It needs high computation resources. The convolutional operators are the Gaussian operators and the method of Gaussian smoothing has been attained using convolution. It can be represented in Eq. (1):
The optimal smoothening filter for an image can be limited in spatial as well as frequency domain, thus satisfies the uncertainty relationships:
The Gaussian operator in
where
where,
The peak signal-to-noise ratio (PSNR) defines the ratio of highest probable power of a pixel value and the power of distorted noise, which can be mathematically defined using Eq. (5):
whereas
2.2 Fusion of Feature Extraction Models
The proposed FHDF-TCIA model encompasses a fusion of handcrafted LBP with MobileNet based deep features for the generation of optimal feature vectors. The LBP model integrates the histogram into separate vectors and each one is considered as a pattern vector. It can be represented as an operator for texture definition that mainly relies on the signs of differences amongst nearby and central pixels. The binary codes are called binary patterns. Therefore, the nearby pixels are 1 in case of having increased pixel values over the threshold values [17]. The patterns denote the feasibility of binary patterns present in the images. The histogram bin count relies on pixel count involved in the computation of LBP. The basic mechanism of LBP employs the measure of intermediate pixel as a threshold to the
The MobileNet is utilized to enhance the performance of the DL models in the limited hardware setting. It reduces the parameter count with no compensation in accuracy.
whereas z represents the pixels values in the feature map. The general convolution architecture can be defined using Eq. (8):
whereas
When the size and channel of input image can be defined as
where
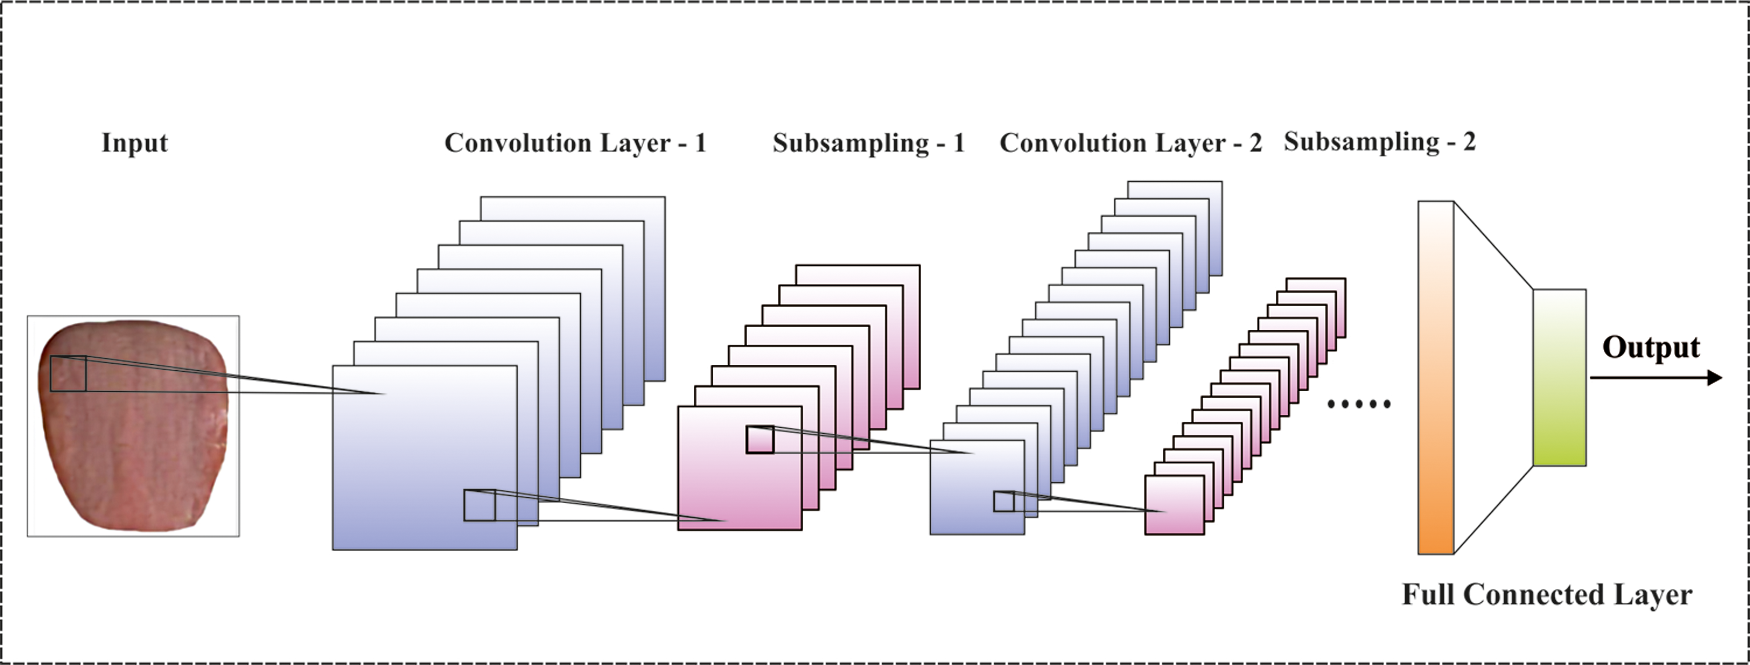
Figure 2: CNN structure
The deep separable conv framework of MobileNet has been obtained the same output as classical conv dependent upon the same input. The Dw need M filters utilizing one channel and the sizes of
The feature fusion process takes place for fusing the features of LBP and deep features. The fusion process is important and is done by the use of entropy process. The two feature vectors can be defined as follows.
Moreover, the features derived are integrated into a single vector, as provided below.
where f signifies fused vector
The fused features are applied to the QNN model to carry out the classification process. The QNN is mainly based on the quantum logic gate, comprising the phase rotation, input, reverse rotation, output, and aggregation. The steps involved in the QNN model are listed as follows.
Step 1: Assume
Next, the aggregation process can be resulted into
where
Step 2: The output of Eq. (14) generates the reverse rotation process using controlled NOT gate:
where f implies sigmoid function which can be achieved using Eq. (16):
Hence, the relations amongst the output and input of the quantum neurons can be represented as follows.
According to the quantum neuron module a QNN, the NN includes input, hidden, and output layers. It assumes the input variable as
Whereas
To optimally modify the variables involved in the QNN model, the PO algorithm is applied. The PO was simulated by the western political procedure of optimized that contains 2 features. An initial statement is that every citizen tries for optimizing its goodwill to win the selective. The second statement has that each party effort for obtaining further seats from parliament. The PO has consisted of 5 phases that contain party development and constituency distribution, selective campaign, party switching, interparty selective, and parliamentary affair.
The whole population has been separated as to n political parties that are demonstrated as in Eq. (19).
All the parties have of n party members, as represented in Eq. (20).
All the parties member contains d dimensional, as depicted in Eq. (21)
All the solutions are also selective candidates. Supposing there are n electoral districts as signified in Eq. (22).
It can be considered as n members from all constituencies, as expressed in Eq. (23).
The party leader has been determined as member with optimum fitness from the party, as illustrated in Eq. (24).
Each party leader has been written as in Eq. (25).
The winners of distinct constituencies are known as members of parliament, as demonstrated in Eq. (26).
In the selective campaign stage, Eqs. (27) and (28) have been utilized for updating the place of potential solutions [20].
For balancing exploration as well as exploitation, party switching has been implemented. An adaptive parameter λ was utilized that is linearly reduced in [1–0] under the whole iterative manner. All the candidates are chosen based on probabilities λ and replaced with least member of an arbitrarily chosen party, as represented in Eq. (29)
During the selective stage, the winner in constituency has been reached, as revealed in Eq. (30)
The FHDF-TCIA technique is simulated utilizing Python 3.6.5 tool on a standard dataset, including 936 images with 78 images in 12 distinct class labels. Fig. 3 illustrates a few sample images.
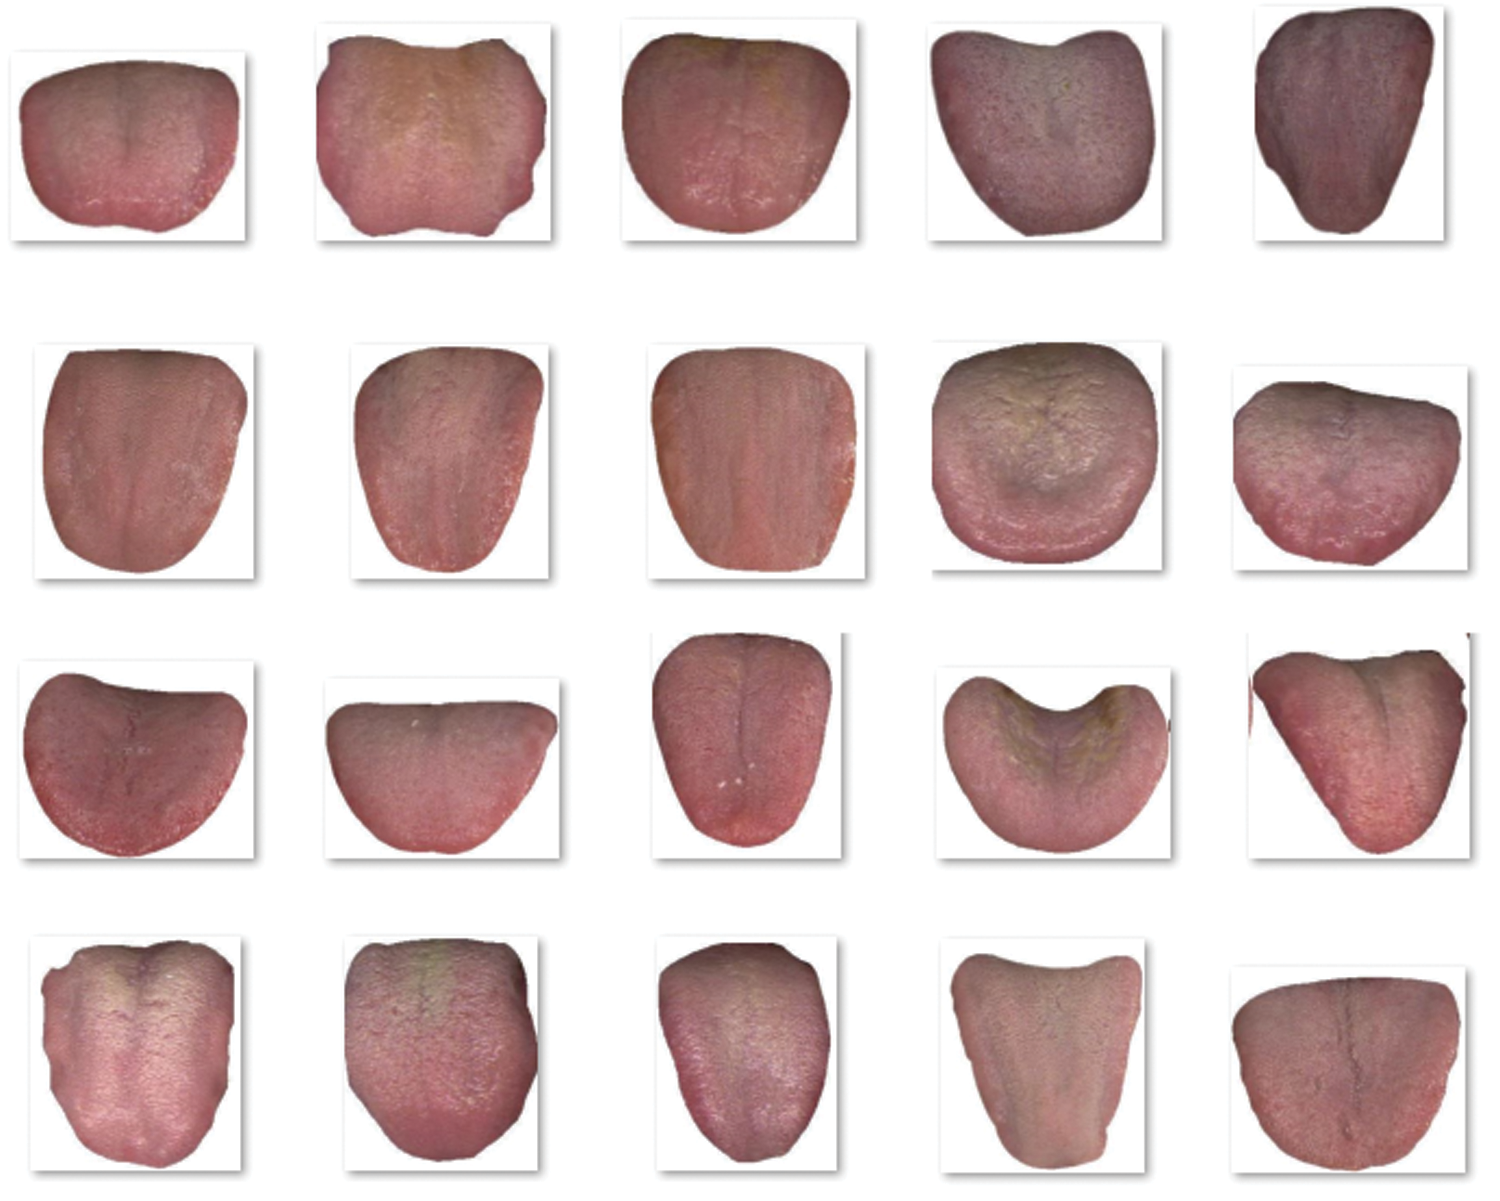
Figure 3: Sample tongue images
Tab. 1 and Figs. 4 and 5 demonstrates the overall results analysis of the FHDF-TCIA technique under ten test runs. The results depicted that the FHDF-TCIA technique has accomplished enhanced outcomes under every run. For instance, with run-1, the FHDF-TCIA technique has gained precision, recall, accuracy, F1-score, and kappa of 98.00%, 97.58%, 99.68%, 98.80%, and 98.80% respectively. Moreover, with run-2, the FHDF-TCIA approach has reached precision, recall, accuracy, F1-score, and kappa of 98.06%, 98.57%, 99.12%, 98.85%, and 98.55% correspondingly. Furthermore, with run-4, the FHDF-TCIA manner has attained precision, recall, accuracy, F1-score, and kappa of 99.10%, 98.80%, 99.33%, 98.67%, and 97.44% respectively. In line, with run-6, the FHDF-TCIA system has attained precision, recall, accuracy, F1-score, and kappa of 99.76%, 99.33%, 98.88%, 98.55%, and 99.54% correspondingly. Along with that, with run-8 the FHDF-TCIA methodology has achieved precision, recall, accuracy, F1-score, and kappa of 99.22%, 98.83%, 98.99%, 99.78%, and 97.57% respectively. Finally, with run-10, the FHDF-TCIA algorithm has gained precision, recall, accuracy, F1-score, and kappa of 98.74%, 98.56%, 99.33%, 99.54%, and 99.57% correspondingly.
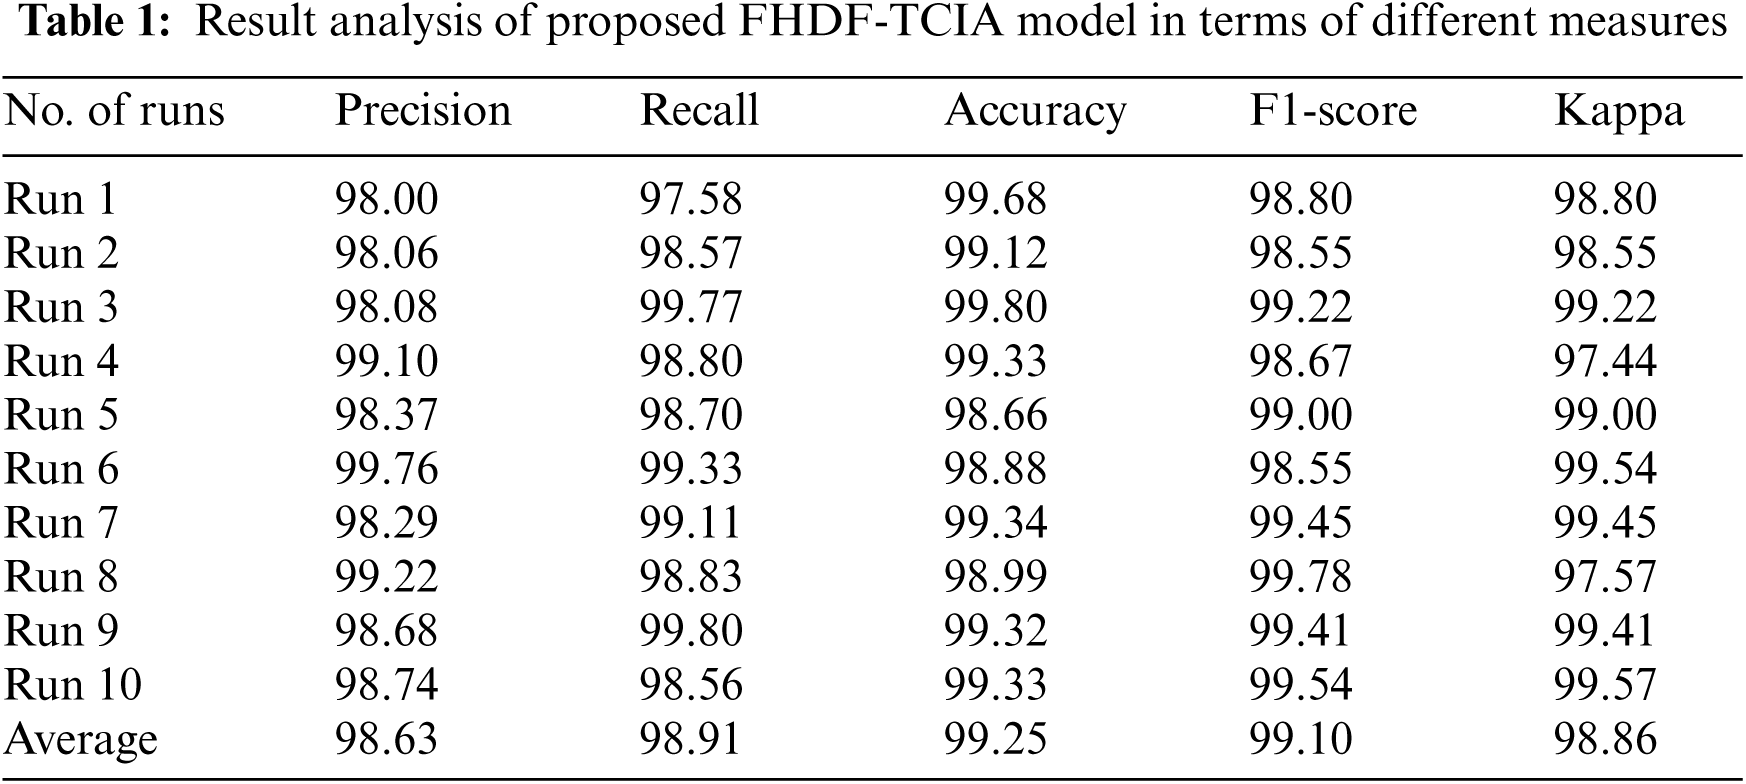
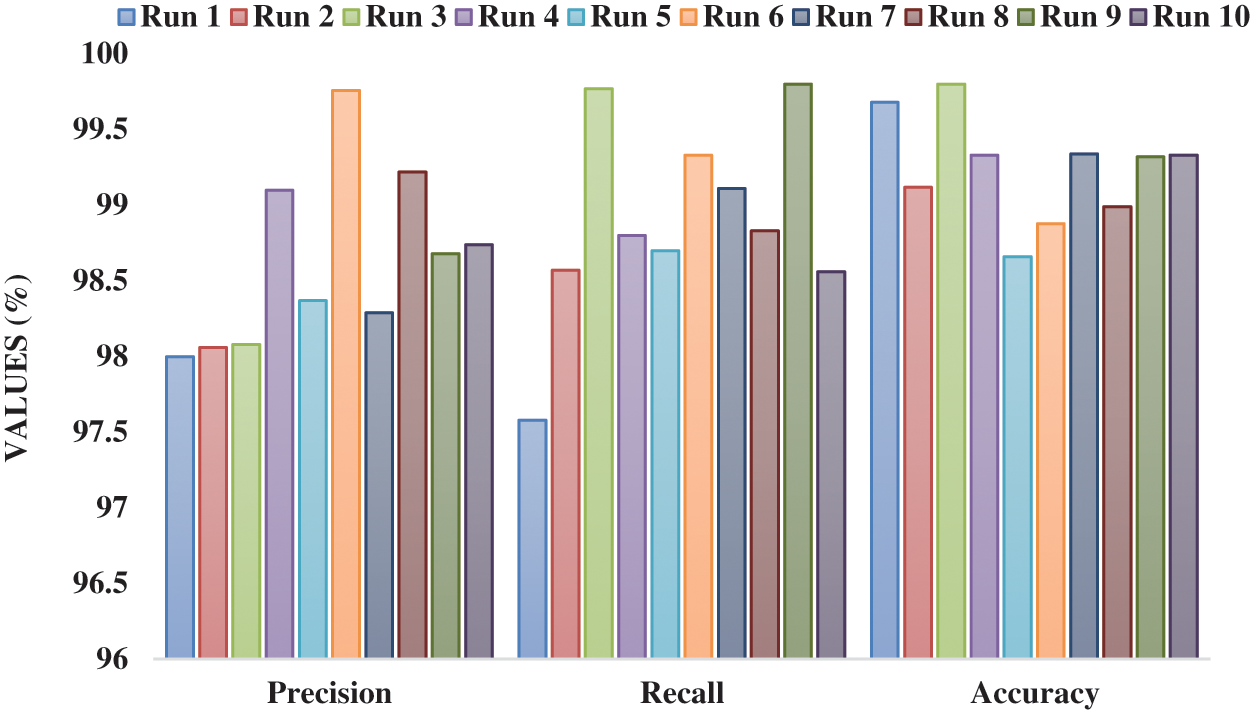
Figure 4: Result analysis of FHDF-TCIA approach with varying measures
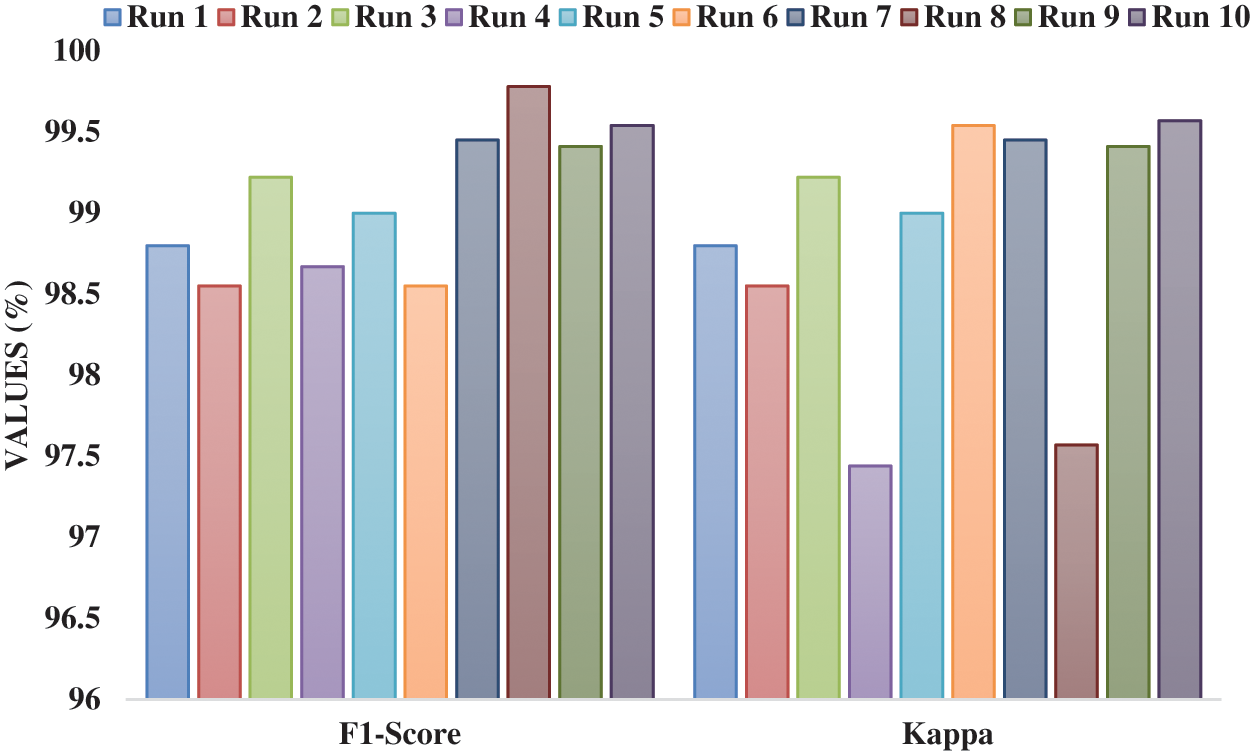
Figure 5: F1-score and kappa analysis of FHDF-TCIA model under varying runs
Fig. 6 demonstrates the average outcomes analysis of the FHDF-TCIA technique on the test images applied. The figure depicted that the FHDF-TCIA technique has resulted in to increase in average precision, recall, accuracy, F1-score, and kappa of 98.63%, 98.91%, 99.25%, 99.10%, and 98.86% respectively.
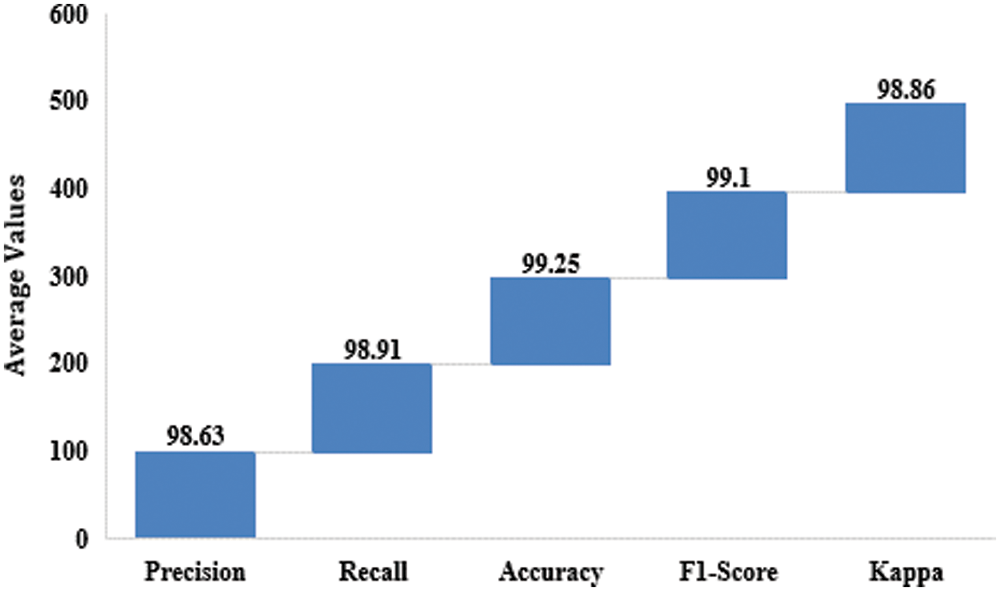
Figure 6: Average analysis of FHDF-TCIA technique
A comparative outcomes analysis of the FHDF-TCIA system with recent ones take place in Tab. 2 and Fig. 7. The outcomes depicted that the S-DTA manner has reached lower result with an accuracy of 82.40%. Besides, the S-SVM, H-DTA, H-SVM, and DL-GNB methods have attained a moderately closer 84.10%, 88.90%, 91.10%, and 92.50%. Afterward, the DL-RF and ASDL-TCI methodologies have resulted in a competitive accuracy of 93.70% and 98.30%. At last, the presented FHDF-TCIA manner has accomplished maximal efficiency with the superior accuracy of 99.25%.
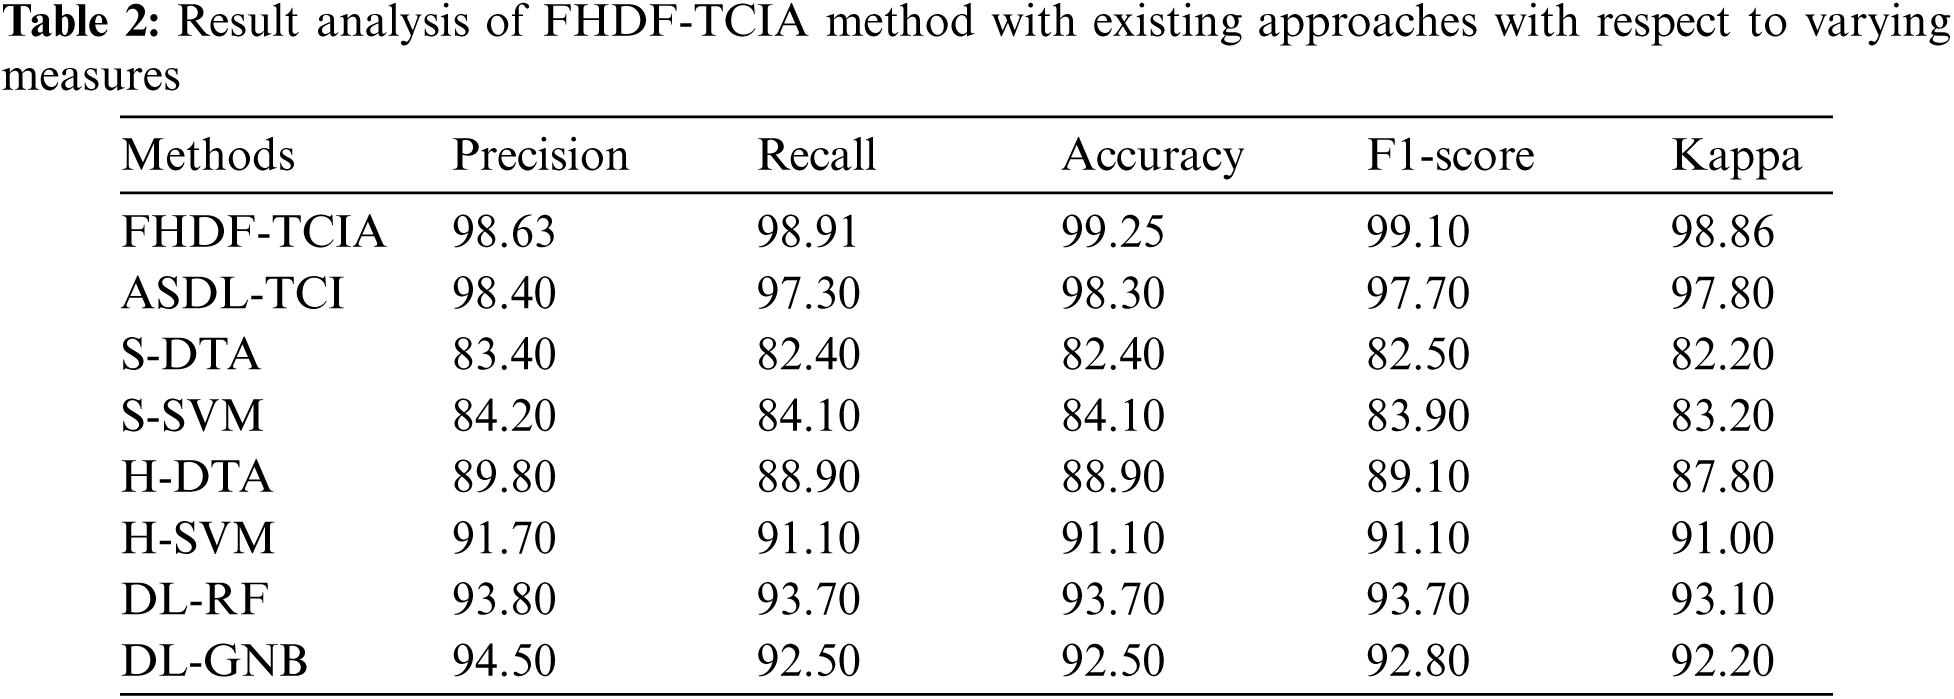
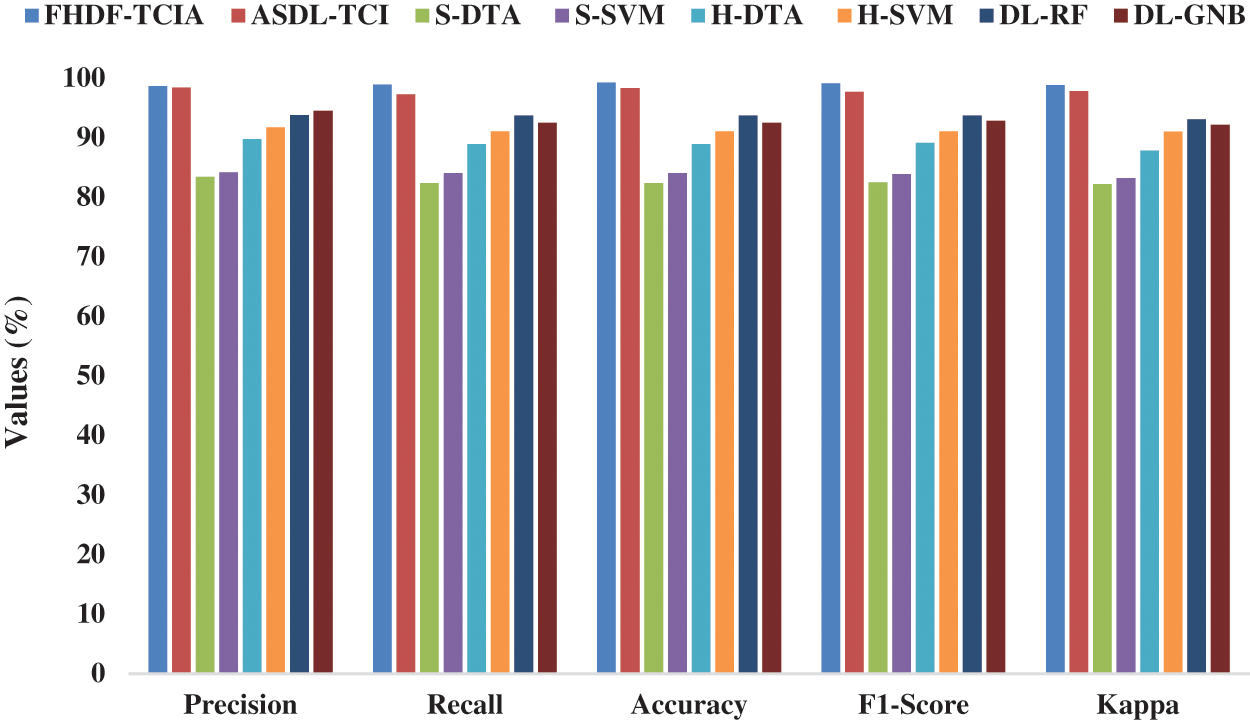
Figure 7: Comparative analysis of FHDF-TCIA approach with varying measures
Tab. 3 and Fig. 8 highlights the comparative study of the FHDF-TCIA technique with other techniques. The results demonstrated that the VGG-SVM technique has gained worse outcomes with an accuracy of 0.594. At the same time, the KNN, Bayesian, Geometry features, SVM, and GF-SRC techniques have obtained a moderately closer 0.734, 0.75, 0.762, 0.765, 0.77, and 0.792. Followed by, the GA-SVM and ASDL-TCI models have resulted in a competitive accuracy of 0.831 and 0.983. However, the proposed FHDF-TCIA system has accomplished maximum performance with a higher accuracy of 0.992. Therefore, the FHDF-TCIA technique is found to be an effective tool for tongue color image analysis.
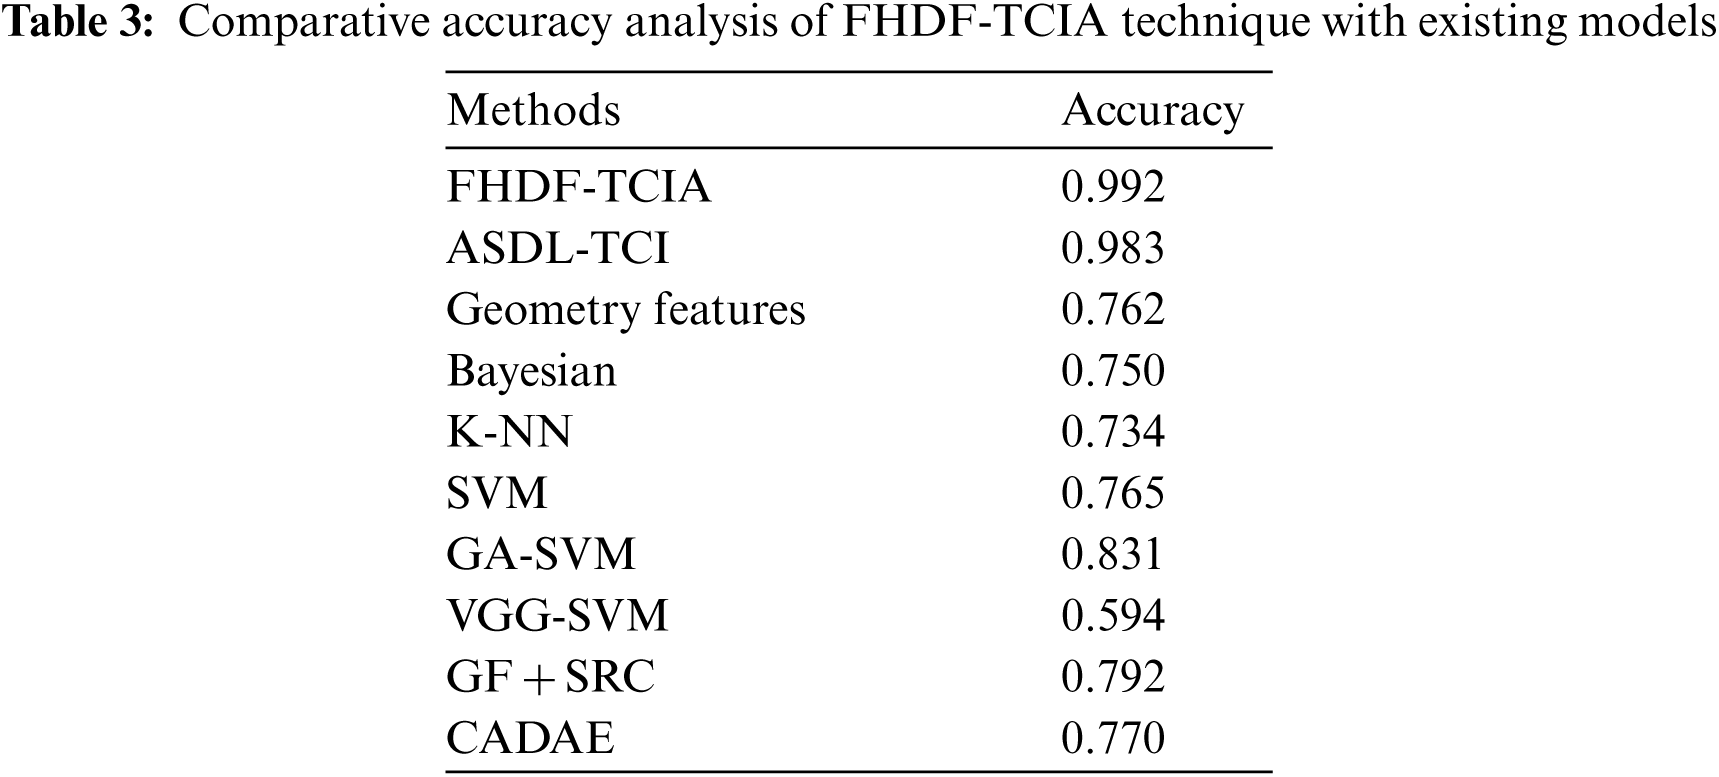
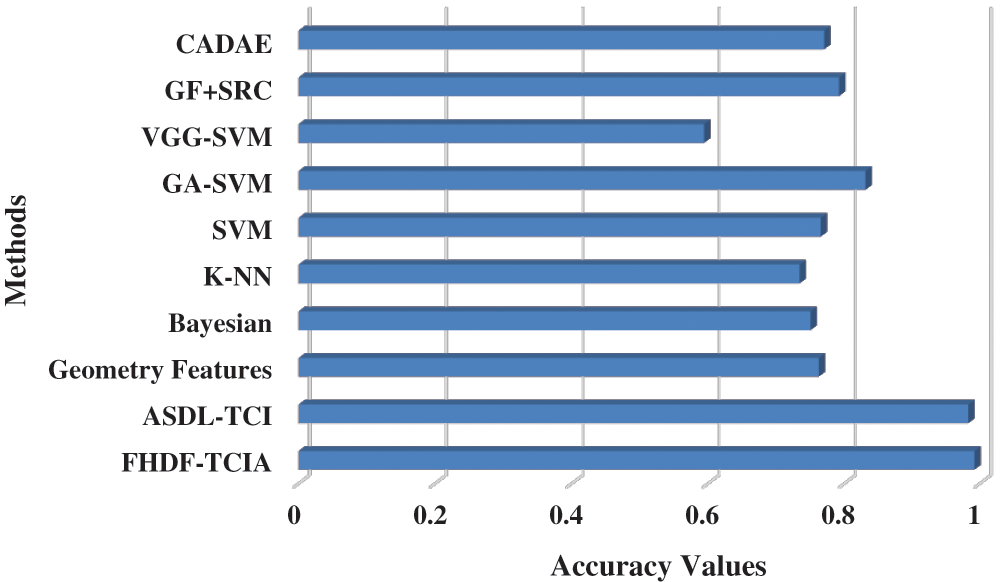
Figure 8: Accuracy analysis of FHDF-TCIA technique with recent manner
In this study, a new FHDF-TCIA technique has been developed for automated tongue color image analysis. The proposed FHDF-TCIA technique comprises preprocessing, fusion based feature extraction, QNN based classification, and PO based parameter optimization. The proposed FHDF-TCIA model encompasses a fusion of handcrafted local binary patterns (LBP) with MobileNet based deep features for the generation of optimal feature vectors. In addition, the political optimizer based quantum neural network (PO-QNN) based classification technique has been utilized for determining the proper class labels for it. A detailed simulation outcomes analysis of the FHDF-TCIA technique occurs on benchmark images and the outcomes are inspected in varying aspects. The detailed comparative results analysis showcased the improved efficiency of the FHDF-TCIA approach compared to other techniques. In future, the FHDF-TCIA technique can be deployed in real time environment.
Funding Statement: This Research was funded by the Deanship of Scientific Research at University of Business and Technology, Saudi Arabia.
Conflicts of Interest: The authors declare that they have no conflicts of interest to report regarding the present study.
1. Z. Li, Z. Yu, W. Liu and Z. Zhang, “Tongue image segmentation via color decomposition and thresholding,” in 2017 4th Int. Conf. on Information Science and Control Engineering (ICISCE), Changsha, China, pp. 752–755, 2017. [Google Scholar]
2. S. K. Shankar, L. P. Prieto, M. J. R. Triana and A. RuizCalleja, “A review of multimodal learning analytics architectures,” in 2018 IEEE 18th Int. Conf. on Advanced Learn. Techn. (ICALT), Mumbai, India, pp. 212–214, 2018. [Google Scholar]
3. X. Wang, B. Zhang, Z. Yang, H. Wang and D. Zhang, “Statistical analysis of tongue images for feature extraction and diagnostics,” IEEE Transactions on Image Processing, vol. 22, no. 12, pp. 5336–5347, 2013. [Google Scholar]
4. M. Elhoseny, K. Shankar and J. Uthayakumar, “Intelligent diagnostic prediction and classification system for chronic kidney disease,” Scientific Reports, vol. 9, no. 1, pp. 9583, 2019. [Google Scholar]
5. Q. Zhao, D. Zhang and B. Zhang, “Digital tongue image analysis in medical applications using a new tongue ColorChecker,” in 2016 2nd IEEE Int. Conf. on Computer and Communications (ICCC), Chengdu, China, pp. 803–807, 2016. [Google Scholar]
6. J. Uthayakumar, N. Metawa, K. Shankar and S. K. Lakshmanaprabu, “Intelligent hybrid model for financial crisis prediction using machine learning techniques,” Information Systems and e-Business Management, vol. 18, no. 4, pp. 617–645, 2020. [Google Scholar]
7. J. Du, Y. Lu, M. Zhu, K. Zhang and C. Ding, “A novel algorithm of color tongue image segmentation based on hsi,” in 2008 Int. Conf. on BioMedical Engineering and Informatics, Sanya, China, pp. 733–737, 2008. [Google Scholar]
8. L. Chen, B. Wang, Y. Ma and H. Hu, “The retrieval of the medical tongue images based on color analysis,” in 2016 11th Int. Conf. on Computer Science & Education (ICCSE), Nagoya, Japan, pp. 113–117, 2016. [Google Scholar]
9. T. Kawanabe, M. Tanigawa, S. Kakizaki, N. D. Kamarudin and X. Mi et al., “Correlation between tongue body colour, as quantified by machine learning, and clinical indices,” Advances in Integrative Medicine, vol. 7, no. 1, pp. 8–13, 2020. [Google Scholar]
10. T. Jiang, X. Guo, L. Tu, Z. Lu, J. Cui et al., “Application of computer tongue image analysis technology in the diagnosis of NAFLD,” Computers in Biology and Medicine, vol. 135, pp. 104622, 2021. [Google Scholar]
11. J. Li, Q. Chen, X. Hu, P. Yuan, L. Cui et al., “Establishment of noninvasive diabetes risk prediction model based on tongue features and machine learning techniques,” International Journal of Medical Informatics, vol. 149, pp. 104429, 2021. [Google Scholar]
12. J. Li, P. Yuan, X. Hu, J. Huang, L. Cui et al., “A tongue features fusion approach to predicting prediabetes and diabetes with machine learning,” Journal of Biomedical Informatics, vol. 115, pp. 103693, 2021. [Google Scholar]
13. S. Fan, B. Chen, X. Zhang, X. Hu, L. Bao et al., “Machine learning algorithms in classifying TCM tongue features in diabetes mellitus and symptoms of gastric disease,” European Journal of Integrative Medicine, vol. 43, pp. 101288, 2021. [Google Scholar]
14. T. Kawanabe, N. D. Kamarudin, C. Y. Ooi, F. Kobayashi, X. Mi et al., “Quantification of tongue colour using machine learning in Kampo medicine,” European Journal of Integrative Medicine, vol. 8, no. 6, pp. 932–941, 2016. [Google Scholar]
15. E. Gholami, S. R. K. Tabbakh and M. Kheirabadi, “Increasing the accuracy in the diagnosis of stomach cancer based on color and lint features of tongue,” Biomedical Signal Processing and Control, vol. 69, pp. 102782, 2021. [Google Scholar]
16. D. Nandan, J. Kanungo and A. Mahajan, “An error-efficient Gaussian filter for image processing by using the expanded operand decomposition logarithm multiplication,” Journal of Ambient Intelligence and Humanized Computing, 2018. https://doi.org/10.1007/s12652-018-0933-x. [Google Scholar]
17. E. Prakasa, “Texture feature extraction by using local binary pattern,” INKOM Journal of Informatics, Control Systems, and Computers, vol. 9, no. 2, pp. 45, 2016. [Google Scholar]
18. Y. Li, H. Huang, Q. Xie, L. Yao and Q. Chen, “Research on a surface defect detection algorithm based on mobilenet-ssd,” Applied Sciences, vol. 8, no. 9, pp. 1678, 2018. [Google Scholar]
19. S. K. Jeswal and S. Chakraverty, “Recent developments and applications in quantum neural network: A review,” Archives of Computational Methods in Engineering, vol. 26, no. 4, pp. 793–807, 2019. [Google Scholar]
20. G. Manita and O. Korbaa, “Binary political optimizer for feature selection using gene expression data,” Computational Intelligence and Neuroscience, vol. 2020, pp. 1–14, 2020. [Google Scholar]
 | This work is licensed under a Creative Commons Attribution 4.0 International License, which permits unrestricted use, distribution, and reproduction in any medium, provided the original work is properly cited. |