DOI:10.32604/cmc.2022.024639
| Computers, Materials & Continua DOI:10.32604/cmc.2022.024639 | |
| Article |
Exploration of IoT Nodes Communication Using LoRaWAN in Forest Environment
1Embedded Systems & Robotics Research Group, Chandigarh University, Mohali, 140413, Punjab, India
2Graduate School, Duy Tan University, Da Nang, 550000, Vietnam
3Faculty of Information Technology, Duy Tan University, Da Nang, 550000, Vietnam
4Department of Computer Science, Prince Sultan University, Riyadh, 11586, Saudi Arabia
*Corresponding Author: Anand Nayyar. Email: anandnayyar@duytan.edu.vn
Received: 25 October 2021; Accepted: 10 December 2021
Abstract: The simultaneous advances in the Internet of Things (IoT), Artificial intelligence (AI) and Robotics is going to revolutionize our world in the near future. In recent years, LoRa (Long Range) wireless powered by LoRaWAN (LoRa Wide Area Network) protocol has attracted the attention of researchers for numerous applications in the IoT domain. LoRa is a low power, unlicensed Industrial, Scientific, and Medical (ISM) band-equipped wireless technology that utilizes a wide area network protocol, i.e., LoRaWAN, to incorporate itself into the network infrastructure. In this paper, we have evaluated the LoRaWAN communication protocol for the implementation of the IoT (Internet of Things) nodes’ communication in a forest scenario. The outdoor performance of LoRa wireless in LoRaWAN, i.e., the physical layer, has been evaluated in the forest area of Kashirampur Uttarakhand, India. Hence, the present paper aims towards analyzing the performance level of the LoRaWAN technology by observing the changes in Signal to Noise Ratio (SNR), Packet Reception Ratio (PRR) and Received Signal Strength Indicator (RSSI), with respect to the distance between IoT nodes. The article focuses on estimating network lifetime for a specific set of LoRa configuration parameters, hardware selection and power constraints. From the experimental results, it has been observed that transmissions can propagate to a distance of 300 m in the forest environment, while consuming approx. 63% less energy for spreading factor 7 at 2 dBm, without incurring significant packet loss with PRR greater than 80%.
Keywords: LoRa; LoRaWAN; IoT; communication protocol; wireless sensor networks; packet reception ratio
When providing M2M (Machine to Machine) networking for sensors and other equipment, there is an availability of numerous technologies, depending upon the intended application [1]. Networking for nearby (ranging from a few meters to hundreds of meters) equipment's is possible with any short-range technology like Zigbee, Wi-Fi Zones, Bluetooth, or it can also be achieved using cabling. However, if the site is remote and cabling is not an option, then if the equipment and data are of sufficient value, connections can be made using cellular mobile networks or satellite modems [2]. Between the scenarios-nearby machines vs. the remote high-value data, there are a plethora of applications where the cost-benefit is insufficient to justify the cost of mobile network connection, and the distance is far too great for existing ISM band technologies. The majority of IoT applications fall under this category, where the device is required to communicate through long distances at a low cost. The research community is intrigued by the Low Power Wide Area Network (LPWAN) that shows abundant potential in completing the puzzle for the upcoming IoT application [3–5]. The main focus for the current LPWAN developments is towards eliminating the limitations of IoT devices, namely-battery life and communication range [6].
IoT networks have been revolutionized by the introduction of a new long-range, low power technology in the ISM band, called LoRa [7,8]. With its open LoRaWAN protocol it has filled the gap of Wi-Fi/BLE (Bluetooth Low Energy) and Cellular networks by offering an economical, flexible and effective solution to both outdoor and indoor applications [9,10]. Another prominent technology is SigFox [11], a subscription-based network service where the SigFox company has erected base stations in numerous cities and regions. Low-cost Sigfox radio devices can be incorporated into a sensor system that can transmit tens of bytes in a packet to the base station, from where it is routed to the owner via other Sigfox base stations. Other competing technologies include On-Ramp [12], a full propriety networking solution that claims a significant advantage in base station requirements compared to either LoRa or Sigfox. There is also a longer range Zigbee, nWave—an ultra-narrow band software-defined radio [13], and a number of other small players. The imminent or already occurred shut-down of the 2G and/or 3G mobile networks in many countries have focused attention on 4G networking with proposals for rival mobile technologies to cover the void created by the end of the low cost and low power 2G M2M technology. A few of the technologies currently being researched are: LoRa-Zigbee Hybrid Communication Technology [14], NB-IoT [15], a Narrow Band service for M2M communications that make use of the gaps in licensed cellular network bands; NB-LTE-M [16] and LTE-M [17].
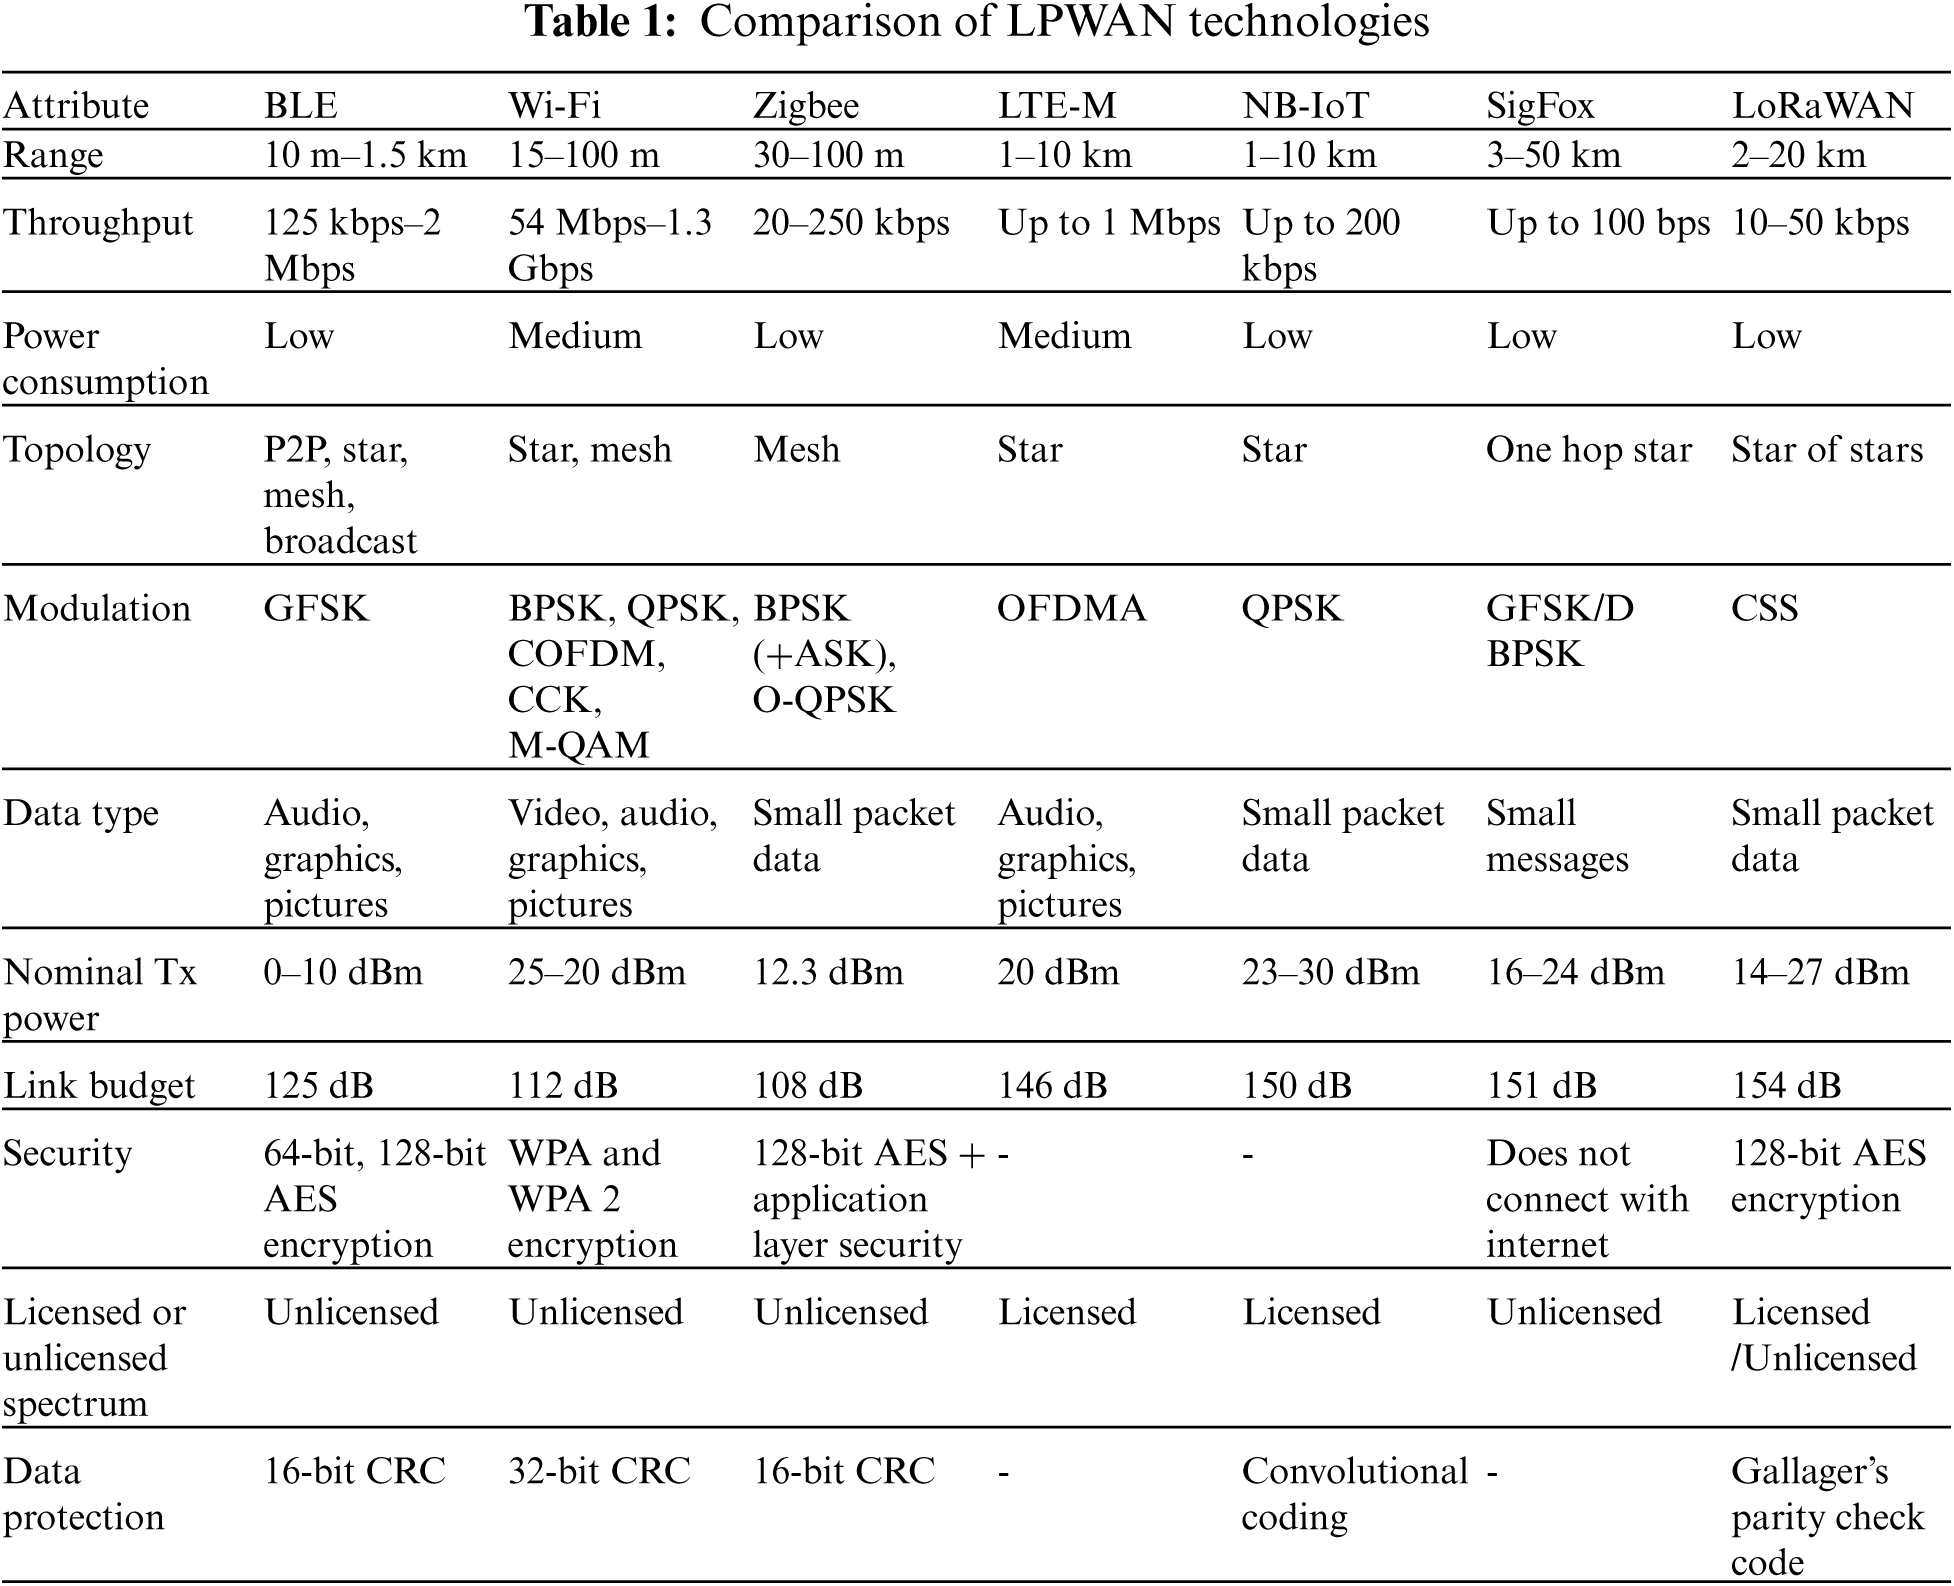
Tab. 1 provides a quick analysis of the above discussed LPWAN technologies for wireless sensor networks and IoT applications [18]. It can be seen that all technologies provide energy efficiency and scalability, an essential requirement for IoT applications. However, ZigBee and the likewise short-range wireless networking solutions provide limited networking capacities that restrict its use for large network delivery across a wide variety of regions [19]. On the other hand, LoRa can meet the low-cost, large-area, and low-energy massive node network specifications because of its Chirp Spread Spectrum (CSS) technology [6]. Its simple topology layout advocates easy deployment and maintenance for the network that provides excellent interference immunity, flexibility, and localization capabilities [20]. Also, battery life is far better than NB-IoT or LTE-M (8 years as compared to 1–2 years) and also in comparison to Sigfox [21]. When it comes to data rates, LTE-M (min. 200 kbps) achieves a much higher data rate as compared to LoRaWAN (min. 290 bps), but still, LoRaWAN manages to get slightly better data rates relative to Sigfox (min. 100 bps) [22]. In link budget also, LoRa is slightly ahead (154 dB vs. 151 dB (Sigfox) or 146 dB (LTE-M)) of all other technologies [21]. Real time packet loss utilizing LoRa communication falls even lower than 0.1% proving its effectiveness [23].
There are several studies in the literature about the propagation and performance of LoRaWAN, but only a few have done an experimental analysis. The goal of this paper is to assess the effectiveness of LoRa transmission technology in a real-world experiment involving devices deployed in forest environment. It can be observed that LoRa outperforms other LPWAN technologies in a majority of features, but it is also worth mentioning that Sigfox and LTE-M can be alternatively used instead of LoRa in specific applications considering the coverage and scalability features [24]. However, the environmental factors often affect the wireless signals as it propagates. Grass, Shrubs and Trees in the forest always influence the efficiency of the LoRa transmissions (e.g., multipath, interruption, attenuation, etc.) [10]. Therefore, appropriate experiments are required to be carried out in the real-world environment so that wireless communication behaviors of LoRa can be investigated prior to its deployment in the forest area. Henceforth, the objectives of the paper are:
• Evaluating the performance of LoRa wireless transmission/reception, through the relationship between RSSI, SNR and PRR, with respect to the distance between Tx and Rx modules.
• Analyzing the factors affecting the transmission distance, and evaluating the range of LoRa transmissions under the effect of environmental conditions.
• Estimating IoT network's lifetime for different transmission parameters, hardware unit selection, and transmission power.
The paper is organized as follows. Section 2 reviews LoRa technology, where LoRa modulation, key parameters, packet structure and operation has been discussed. Section 3 describes the problem and experimental setup in the forest environment. The experimental results and discussions are emphasized in Section 4, and finally, the concluding remarks are given in Section 5.
Before exploring LoRa's wireless communication behavior, it is essential to understand the protocol and the factors determining the link's performance [25,26].
Signals are modulated in LoRa using Chirp Spread Spectrum (CSS) modulation [27]. A chirp can be defined as a signal with a frequency that is continuously rising (upchirps) or decreasing (downchirps), which spreads across and roll over the predefined bandwidth. The chirp signal increases the instantaneous frequency
where,
CSS's most straightforward execution is the On-off keying, where the data is modulated in upchirps and downchirps [28]. Nevertheless, the implementation of CSS LoRa varies and modulates data by adjusting the beginning frequency location of the chirp, which helps it attain data rates as far as 27 kbit/s. In certain LPWAN applications, the communication range is of more priority than the data rate. Although restricted, this data rate is more than adequate for such applications. However, the range and signal quality may be further enhanced by modifying some key parameters [25].
LoRa uses a special variation of code rate (CR), transmission power (Tx), Bandwidth (BW), and spreading factor (SF) to the modulation of CSS [25]. A mixture of downchirps and upchirps is used to shape a whole packet, and all packets have a uniform angle of chirp called the spreading factor. For a device with a bandwidth consisting of constant frequency, the final data rate is determined by the spread factor. At the moment, LoRa modulation supports seven distinct spread factors between SF6 and SF12 [6]. A higher value of SF results in increased Signal to Noise Ratio (SNR), which ultimately offers an increase in the range and sensitivity [25]. However, it increases the time for which the packet remains in the air.
Semtech LoRa provides predefined values for transmission parameters like frequency, bandwidth (BW) and spreading factor (SF). These parameters are used to define the chirp gradient which can be modified by changing the transmission parameters [6]. Each chirp has an SF number of data bits and comprises of
There is a variety of spreading factors to choose from, which not only regulates the data rate but also increase the chances of LoRa equipment to exist together. It means that by changing the spreading factors, all the simultaneous transmissions on the same channel will be demodulated because of the resilience developed by Chirp gradients (different SFs) in the demodulator. To a greater extent, this function improves the multiple access efficiency of LoRa as well.
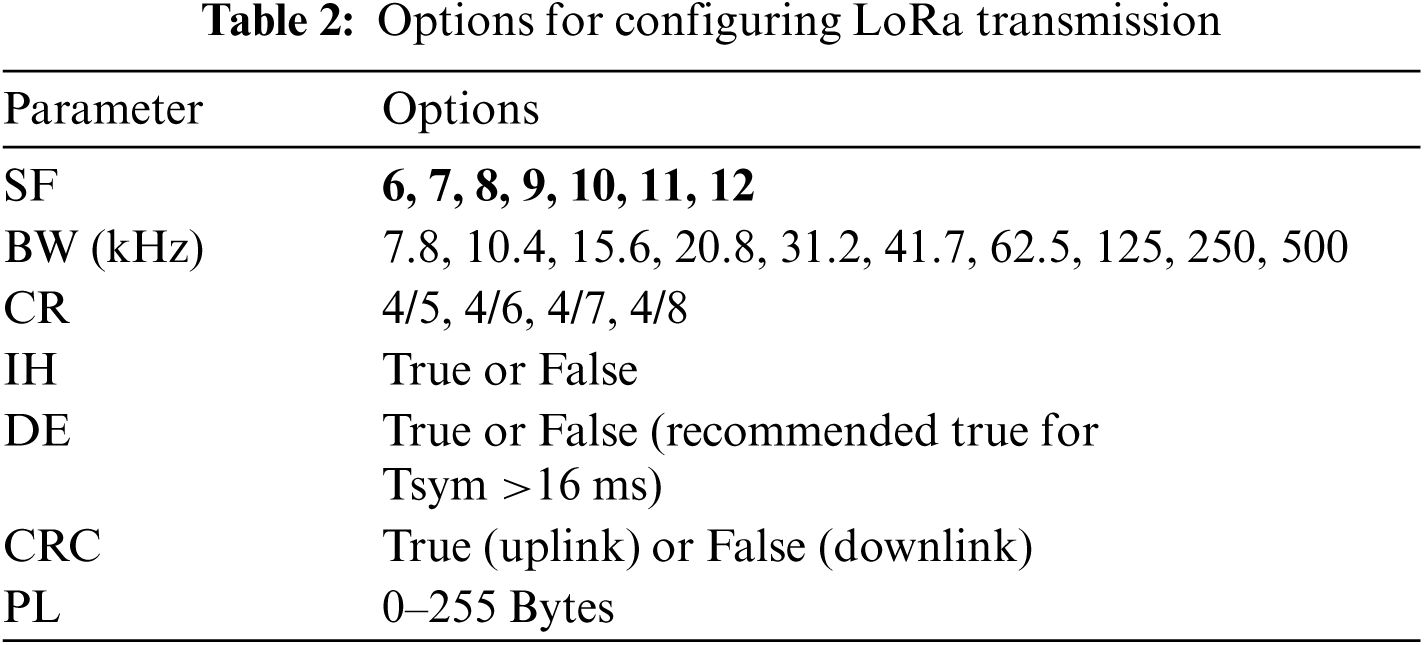
Therefore, it can be observed that SF and BW effect transmitting time and data rate. Hence, to ensure appropriate distance and data rate flow, the Semtech [30] LoRa chipset already defines several parameters and its configuration options (as given in Tab. 2). For example, the Spreading factor's recommended values vary from SF7 to SF12, whereas the code rate can be chosen from 4/5, 4/6, 4/7 and 4/8 [31].
2.3 LoRa Transmission Packet Structure
The LoRa packet configuration can be divided as uplink and downlink packets, where payload cyclic redundancy check (CRC) in a packet is used to classify uplink and downlink packets based on their presence or absence, respectively [32]. As shown in Fig. 1, the size of the LoRa packet depends upon the spreading factor used, and it has a fixed format that consists of fixed preamble symbols (Spre), packet header (optional), payload, and payload CRC. The preamble has 2.25 start frame delimiter (SFD) symbols preceding by 2 sync word symbols and 8 fixed preamble symbols [29].

Figure 1: LoRa packet structure
About header, each LoRa chirp applies a range of parameters that includes enabling optimisation for low data rate (DE), implicit header (IH), code (CR), and CRC. Here CR defines Hamming code based error correction capabilities (20 bits), given by 4/x, implying 4 bits of information with x bits of parity, where x varies from 1 to 4. Allowing IH (setting IH to 1) could be used to exclude the PHY Header. Payload CRC (16 bits) is managed at the end of the packet by the CRC flag that is adjusted to indicate between uplink and downlinks packets. Finally, the payload contains coded data specified according to the Coding rate [29].
2.4 LoRa and LoRaWAN Operation
To meet the data and range requirements, LoRa wireless optimises the modulation using chirp spread spectrum modulation with different options for BW and SF [28]. The combination of SF and Bandwidth trades off speed for the range [31]. Based on the wireless standards in a country, LoRa uses ISM bands of 915, 868 MHz or even 433 MHz for communication, and each band is divided into multiple channels. For example, in Europe, 863–870 MHz band is used, in the United States, LoRa works in the 902 to 928 MHz Frequency Band, while in Asia, 923 MHz Frequency Band is used for the LoRa operations.
LoRaWAN incorporates LoRa wireless at the physical layer in its protocol stack [33]. In LoRaWAN, motes at the physical layer communicate over the air with a gateway that offers dual functionality by decoding multiple concurrent transmissions with an integrated receiver and simultaneously forwarding the data to the network server [34]. If multiple gateways detect a LoRaWAN mote transmission, the network server decides which gateway to use to send an acknowledgement (if required). The network server passes the data package to an Application Server, and finally, the application server passes the data to the Customer Server [34].
3 Problem Definition and Experimental Setup
While designing scalable WSN's, one of the most concerning factors is the communication distance between the end devices [22]. With LoRa, Semtech provides long-range networking for end devices [30]. The attempt was made to measure the range of LoRa devices under a forest environment.
3.1 Communication Distance Between LoRa End Devices
While designing scalable WSN's, one of the most concerning factors is the communication distance between the end devices [22]. Additional constraints are put forth by the environment depicted through the path loss. Although LoRa, Semtech provides long-range networking for end devices [30]. The attempt was made to measure the range of LoRa devices under a forest environment.
3.2 Parameters Affecting LoRa Signals
Appropriate selection of the transmission parameter like bandwidth, code rate, spreading factor and transmission power ensures transmission distance and link quality between LoRa devices [10,25]. To explain the impact of each transmission parameter under a forest environment, we must first understand in general how each of these parameters influences the resultant wireless signals. The LoRa signals are influenced majorly by four parameters:
As discussed earlier, several bits are stashed into a single chirp that makes the chirp to spread out, and the spread is determined by the value of LoRa's Spreading factor [35]. For example, the spreading factor of 7 implies that 7 bits are representing a chirp. Now, the chirp has to travel across a defined bandwidth in a period calculated by Eq. (3) and the period taken to increase/decrease a chirp frequency from
Bandwidth specifies the transmission signal width, and from Eq. (3), it could also be used to ascertain the time period of the chirp. Because the chirp consists of
The intensity of power used to relay a chirp is specifically influenced by transmitting power. By raising TX power, the signal would have an increased probability of immunity from the ambient attenuation that essentially raises the signal intensity Psignal received by the receiver. Semtech SX1276 chipset [30] reports a sensitivity of −139 dBm.
A forward error correction code, in the form of Hamming code, is applied to a packet before transmission, which is termed as Code Rate [38]. Tab. 2 displays the configurations that are inserted into the chips. A 4/5 CR means that one-bit correction coding is applied for every four bits of data, and similarly, four bits of correctional bits are used for four bits of data in CR 4/8. By increasing the amount of bit to be transmitted, CR leads to increased overhead to the transmission that enables the user to verify, if the chirps obtained are right and gives the chance to correct any faulty chirp bits.
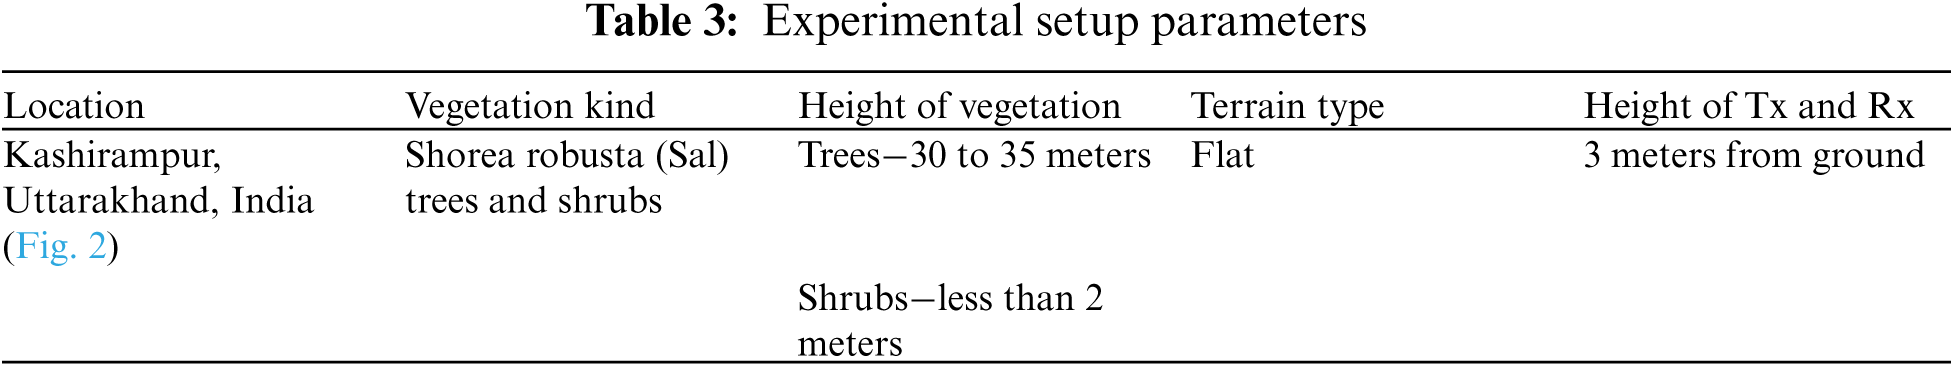
For the evaluation of the LoRa wireless and LoRaWAN an experimental setup was made with two Heltec ESP32 Lora modules in a forest environment. Both the modules were attached with omnidirectional antenna of maximum −30 dbm gain which acted as transmitter and receiver modules powered by 2000 mAh LiPo battery. The parameters for the location and the hardware are specified in the Tab. 3 below.

Figure 2: (a) Satellite view of the experimental area (b) vegetation between Tx and Rx nodes (c) location of the test nodes
4 Testing Results and Discussion
This part illustrates the experiment results of the link performance of LoRa by varying the parameters as suggested in the datasheet provided by the Semtech chipsets. The LoRa wireless was tested for range using a symmetrical RF network link comprising two Semtech SX1276 [30] transceivers with the identical antenna of 3 dbi gain. The LoRa nodes consist of ESP 32 embedded with SX1276 from Heltec Automation [39]. The receiver node logged the connection data, and GPS coordinates ware taken from Garmin eTrex20. The logging unit was portable and therefore carried in the field for experimentation. It was used to receive and log sequentially numbered beacon messages along with the received signal strength (RSSI) and the signal to noise ratio (SNR). To maximize the range, a modulation mode with a higher receive sensitivity was used, and the resultant data was plotted across a map. As the data collection was conducted on foot, at times, it was limited due to the terrain conditions.
LoRa is explicitly based on wireless sensing. Therefore, data transmission characteristics would have a crucial impact in suggesting its use in the field. For this purpose, the Packet Reception Ratio (PRR) is used for estimating link quality. PRR is a software-based estimator similar to the Estimated number of Transmissions (ETX), the Required Packet Transmission Number (RNP) and the Acquired Reception Ratio (ARR). It is a passive strategy for tracking the received number of packets, which is given by the percentage of effective transmission packets to the complete transmission packets. It was preferred over any other link quality estimator because of numerous reasons. Firstly, whenever there is a shift in the transmission, PRR responds very quickly. Secondly, since it is installed on the receiver's side, it provides an advantage that it ensures that the receiver responds and conducts the measurements in the case there is a delay in transmission or data failure. Additionally, experimental calculations were required for the unidirectional link quality estimator because during the experiment, it was observed that there was no influence of rebounds and interferences on the results, which could probably be credited to the good wireless atmosphere at the test site. Therefore, because of its unidirectional behavior and passive monitoring, PRR came out to be the most preferred option for link quality estimation.
Based on the measurements made for different transmission parameters, the transmission characteristic (PRR) of LoRa was evaluated in the forest. For this, an experiment was repeatedly conducted to measure the packet reception rate (PRR) at different communication distance with changes in SF, TX Power, CR and BW. Moreover, the packet rate method was used to calculate the link quality estimation through the Packet Reception Ratio (PRR) from Eq. (4) to approximate the performance of the LoRa transmission. Through this method of LoRa-PRR, the loss in the data between Rx and Tx is calculated.
Here,
Tab. 4 provides the values of the parameters involved in the experiment. To test the efficiency of the LoRa transmission, the length of the LoRa packet was kept at 10 bytes. The transmitter node was fixed; however, it is to be observed that its distance to the receiver node was altered arbitrarily by moving the receiver node. Tx node was made to send packets frequently to the Rx, and in the end, to highlight the changes occurring during LoRa propagation, the transmission data rate and power were set at the minimum levels.

LoRa was configured at 867 MHz of frequency for data transmission between the devices with transmission powers of 2, 5, 10, 14 dBm and variable data rates. At first, the PRR was computed over 100 packets for varying distance. The test was repeated for various transmission powers (2, 7, 10 and 14 dBm) with the initial setting as <CR-4/5, SF-12, BW-500 kHz>, that would give the maximum distance. With a packet delay of 100 ms, 10 Bytes of the payload was transmitted repeatedly during the tests conducted in the forest environment under clear weather conditions, with no wind and an average temperature of 24°C.
Moving away from the beacon transmitter, the remote unit (Receiver) was still receiving transmissions at 300 m at a transmission power of 2 dBm. However, during the tests, it was noticed that there was a drop in the PRR at certain locations for any of the tested transmission power. For this, even the maximum allowed value of transmission power (20 dBm) was used, but no improvement in PRR was observed at such locations. For other locations and transmission powers, the obtained PRR was varying in the range from 60%–80%. Therefore, it was concluded that under a flat terrain, the sudden drop in the PRR could be attributed to the tree canopy and the sudden wind effects. In a nutshell, vegetation induces a substantial drop in range/quality of transmission. Furthermore, it needs to be considered that these tests were conducted through thick vegetation/trees in a forest environment which could act as the worst possible scenario considering wireless transmission.
The surprising observation was that the radio transmission power for LoRa is not a dominant parameter to have an effect on the PRR or the range and connectivity, once established. On the contrary, more significant roles are played by other transmission parameters like SF, BW and CR, which is interesting, considering the deviation from typical Wireless Sensor Network (WSN) radio technologies where the transmission power played an important role in deciding the range and connectivity.
After establishing that the communication range is not much influenced by the transmission power post reaching a particular level, the focus shifted to finding out as to which other parameter influences LoRa's communication range the most. To analyze the variation in communication range, experiments were conducted with different sets of parameter configurations. Different combinations of the values were tried for every parameter: SF values of 7 and 12, BW values of 125 and 500 kHz, coding rates of 4/5, 4/6, 4/7 and 4/8, and finally, radio transmission power at 2, 7, 10 and 14 dBm. But, by this time, the weather conditions changed, there was no wind, and the weather was warmer with a temperature of 36°C and 30% relative humidity.
Moving away from the beacon transmitter, the remote unit (Receiver) was still receiving transmissions at 300 m. There were intermittent connection losses that could be attributed to the tree canopy and the heavy vegetation. It was observed that the bandwidth has the maximum impact over the communication range, which was evident from the fact that at most of the locations (till the maximum distance of testing, i.e., 300 m), an improvement in PRR was observed just by changing the bandwidth from 500 to 125 kHz. Another noticeable impact on PRR was observed when the spreading factor was changed. Although the variations could only be noted for longer distances, but it was seen that the PRR increased with the increase in the spreading factor from 7 to 12, as depicted in Fig. 3a. However, this increase in PRR came at the cost of increased transmission time, which reached 782 ms resulting in increased energy consumption and lower data rates. Keeping the same settings for transmission parameters (SF-12, CR-4/5 and BW-500 kHz), the distance at which 100% PRR was obtained (300 m) for 24°C, dropped by almost half (150 m) when observed under an increased temperature of 36°C. Therefore, environmental factors were also found to have a substantial impact on the communication range, especially at the higher temperatures, something which has also been observed in other technologies (e.g., IEEE 802.15.4) [40].
The observed trend in RSSI is shown in Fig. 3b. A general decrease with distance was seen, except for certain variations, which could be attributed to disturbance because of the tree canopy. The SNR, on the other hand (Fig. 3c), remained almost the same with variations within the range of 4 dB for any of the combinations. The RSSI value seems to max out at ∼120 dBm for SF7, while for SF12, the observed value of RSSI maxed out at ∼127 as no package was observed with a lower value, which verified the fact that with an increase in spreading factor, the sensitivity of the receiver is increased.

Figure 3: Change in (a) RSSI, (b) SNR, and (c) PRR with distance
The authors in [41] utilized an omnidirectional antenna with a transmission power of 13 dBm resulting in a communication range of approximately 390 m. In comparison, present experimental results showcased the maximum achievable range to around 300 m with no significant packet-loss while using a transmission power of 2 dBm. Marginal improvement in communication range were obtained for transmit power as high as 20 dBm. Conclusively, initial range of LoRa increases with incremental transmit power but is limited to a finite maximum depending upon the vegetation.
Experiments were conducted to explore the useful information from the energy utilization of microcontrollers and LoRa Transceiver under different strategic conditions. Variations in transmitted power, bandwidth, spreading factor and code rate were used for exhibiting different conditions so that the energy consumption of microcontrollers and transceivers at the node could be analyzed. For this, the standardized transmission energy profile for a single transmission of the end node was defined. Monsoon Power Monitor was used to obtain the energy profile since it allows for the export of readings, for further analyses. An instance of the data exported from the power monitor has been shown in Fig. 4 for TX Pow-2 dBm, CR-4/5, SF-7, BW-125 kHz and payload of 10 Bytes as transmission parameters.

Figure 4: Energy consumption readings from the power monitor
Energy usage of a single transmission can be split into two different components classified as sleep and active states. In an active state, the microcontroller unit consumes power for its operations, and the transceiver utilizes energy for the transmission of data packets, whereas, in the sleep state, the microcontroller unit takes up significantly less energy, and the energy is utilized only to keep the timer operations active. However, it is worth mentioning that even this small energy can be quite considerable for longer sleep states and should be neglected carefully. For instance, 2.5 min of sleep mode consumes same energy as 1 s of active mode for Heltec LoRa.
Throughout the experiment, the Monsoon Power Monitor was used to observe the hardware components’ power consumption. The first test was carried out to determine the energy per transmission for varying Spread Factors of 7–12 with a payload of 10 bytes. The configuration of the parameters was set at two extremities, consuming the lowest and highest energy. At one end, a spreading factor of 7 with transmission power at 2 dBm was used, while at the other extreme, a spreading factor of 12 with transmission power at 20 dBm was used. The transceiver and microcontroller's energy profile for each transmission has been separately reported in Tab. 5 (Battery Capacity-3.7 V, 2 Ah. BW-125 kHz, CR-4/5, PL-10 Bytes, Transmission rate-15 min per Packet for SF7 and SF12). It has been observed that if the data packets are transmitted at an interval of 15 min, then for spreading factor of 12 and 7, LoRa nodes can last a lifetime of 1.37 years and 4.60, respectively. Therefore, it can be concluded that for achieving a long lifetime, a careful selection of configuration of the parameters and duty cycle is required.

Eq. (5) has been used for calculating the values in Tab. 5.
Now, if
Also, the duty cycle is the proportion of time a transmitter is allowed to transmit. Therefore, a function of the duty cycle can be used in Eq. (7) to calculate the duration of the transmission cycle (
Further, using
Here, PL is the payload in bytes, SF is spreading factor, CR is code rate, IH is the implicit header set to true or false (0 or 1), indicating implicit or explicit header, respectively. Both cyclic redundancy check (CRC) and low data rate optimization enabled (DE) are set as 0 or 1 to indicate nonexistence or existence as per requirement. If
Since the microcontroller operates in both active and sleep mode between two transmissions,
Tab. 6 gives the energy expended by the microcontroller unit during active and sleep states.

For predicting
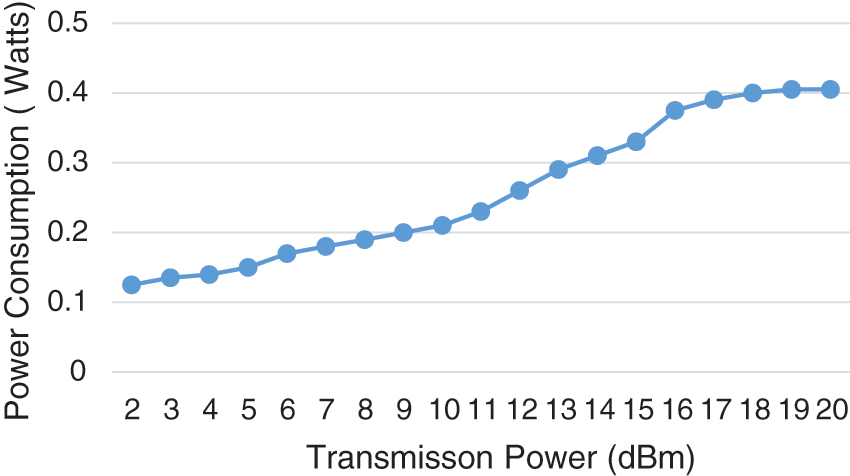
Figure 5:
A polynomial function, given in Eq. (11), was derived through Gompertz model [42], based on the results obtained from Fig. 5.
where,
Tab. 7 illustrates how the configuration of the transmission parameter affects the lifespan of the end nodes. Firstly, for a specific set of transmission parameters, the power consumption of the transmitter (

As intended, the duty cycle is the main element deciding the lifetime of the node because sleep mode decreases energy usage dramatically and offers longer life [43]. It has also been observed that the spreading factor and transmission power play a significant role in deciding the lifespan of the end nodes because of their impact on the time period and resource used during the transmission.
This paper addresses crucial questions about the importance and selection of Low power long-range communication protocol for IoT nodes in the forest environment. The underlying experimental testing identified some vital issues that affect the LoRa functionality, for example, LoRa transmission distance. This paper has attempted to answer the following questions: “How much far can a LoRa node transmit in a forest environment?”, “What criteria can be used for maximal coverage by a node?” and “How do the parameters of modulation influence the node life?”. LoRa wireless performance was evaluated for SNR, PRR, and RSSI with respect to the distance between the IoT nodes. Further, the experimental observations demonstrate that LoRa transmissions can propagate to a distance of 300 meters in forest environments via numerous tests under different scenarios. It has also been observed that LoRa's coverage reduces significantly with obstructions blocking line of sight. The importance of spread-factor (SF) over other parameters has also been tested, and developers/users need to choose the smallest SF wherever necessary. The estimated energy usage of IoT nodes during transmission has been recorded for different values of transmission parameters. The paper presents a method to optimally select the configuration parameters of LoRa such as SF, CR, BW, low duty cycle, and choice of equipment/component, in order to support the LoRa communication operation for a number of years, by estimating IoT network lifetime.
In future, we plan to analyze the impact of meteorological factors on communication range of LoRa in dynamic outdoor environments, while utilizing machine learning algorithms.
Funding Statement: The authors would like to acknowledge the support of Prince Sultan University for paying the Article Processing Charges (APC) of this publication.
Conflicts of Interest: The authors declare that there is no conflict of interest regarding the publication of the paper.
1. J. -S. Lee, Y. -W. Su and C. -C. Shen, “A comparative study of wireless protocols: Bluetooth, UWB, ZigBee, and Wi-Fi,” in IECON 2007–33rd Annual Conf. of the IEEE Industrial Electronics Society, Taipei, Taiwan, pp. 46–51, 2007. [Google Scholar]
2. B. E. Benhiba, A. A. Madi and A. Addaim, “Comparative study of the various new cellular iot technologies,” in 2018 Int. Conf. on Electronics, Control, Optimization and Computer Science (ICECOCS), Kenitra, Morocco, pp. 1–4, 2018. [Google Scholar]
3. Y. Song, J. Lin, M. Tang and S. Dong, “An internet of energy things based on wireless LPWAN,” Engineering, vol. 3, no. 4, pp. 460–466, 2017. [Google Scholar]
4. M. O. Ojo, D. Adami and S. Giordano, “Experimental evaluation of a LoRa wildlife monitoring network in a forest vegetation area,” Future Internet, vol. 13, no. 5, pp. 115, 2021. [Google Scholar]
5. J. de Carvalho Silva, J. J. Rodrigues, A. M. Alberti, P. Solic and A. L. Aquino, “LoRaWAN—A low power WAN protocol for internet of things: A review and opportunities,” in 2017 2nd Int. Multidisciplinary Conf. on Computer and Energy Science (SpliTech), Split, Croatia, pp. 1–6, 2017. [Google Scholar]
6. Semtech, “Wireless and sensing products,” in Datasheet, vol. 1. Cmarillo, CA, USA: Semtech Corporation, pp. 1–132, 2020. [Online]. Available: https://www.semtech.com/products/wireless-rf/lora-transceivers/sx1276. [Google Scholar]
7. A. Augustin, J. Yi, T. Clausen and W. M. Townsley, “A study of LoRa: Long range & low power networks for the internet of things,” Sensors, vol. 16, no. 9, pp. 1466, 2016. [Google Scholar]
8. A. Lavric and A. I. Petrariu, “LoRaWAN communication protocol: The new era of IoT,” in 2018 Int. Conf. on Development and Application Systems (DAS), Suceava, Romania, pp. 74–77, 2018. [Google Scholar]
9. E. D. Ayele, C. Hakkenberg, J. P. Meijers, K. Zhang, N. Meratnia et al., “Performance analysis of LoRa radio for an indoor IoT applications,” in 2017 Int. Conf. on Internet of Things for the Global Community (IoTGC), Funchal, Portugal, IEEE, pp. 1–8, 2017. [Google Scholar]
10. J. Lim, J. Lee, D. Kim and J. Kim, “Performance analysis of LoRa (long range) according to the distances in indoor and outdoor spaces,” Journal of KIISE, vol. 44, no. 7, pp. 733–741, 2017. [Google Scholar]
11. K. Mekki, E. Bajic, F. Chaxel and F. Meyer, “Overview of cellular LPWAN technologies for IoT deployment: Sigfox, LoRaWAN, and NB-IoT,” in 2018 IEEE Int. Conf. on Pervasive Computing and Communications Workshops (PerCom Workshops), Athens, Greece, pp. 197–202, 2018. [Google Scholar]
12. C. Evans-Pughe, “The M2M connection,” Engineering & Technology, vol. 8, no. 11, pp. 39–43, 2013. [Google Scholar]
13. T. L. Pham, H. Nguyen, H. Nguyen, V. Bui, V. H. Nguyen et al., “Low power wide area network technologies for smart cities applications,” in 2019 Int. Conf. on Information and Communication Technology Convergence (ICTC), Jeju, South Korea, pp. 501–505, 2019. [Google Scholar]
14. V. -T. Truong, A. Nayyar and S. A. Lone, “System performance of wireless sensor network using LoRa–Zigbee hybrid communication,” Computers, Materials & Continua, vol. 68, no. 2, pp. 1615–1635, 2021. [Google Scholar]
15. R. Ratasuk, B. Vejlgaard, N. Mangalvedhe and A. Ghosh, “NB-IoT system for M2M communication,” in 2016 IEEE Wireless Communications and Networking Conf., Doha, Qatar, pp. 1–5, 2016. [Google Scholar]
16. S. Dawaliby, A. Bradai and Y. Pousset, “In depth performance evaluation of LTE-M for M2M communications,” in 2016 IEEE 12th Int. Conf. on Wireless and Mobile Computing, Networking and Communications (WiMob), New York, NY, USA, pp. 1–8, 2016. [Google Scholar]
17. R. K. Singh, P. P. Puluckul, R. Berkvens and M. Weyn, “Energy consumption analysis of LPWAN technologies and lifetime estimation for IoT application,” Sensors, vol. 20, no. 17, pp. 4794, 2020. [Google Scholar]
18. D. Patel, Low power wide area networks (lpwanTechnology review and experimental study on mobility effect (M.S. thesis). Computer Science, South Dakota State University, South Dakota, 2018. [Google Scholar]
19. J. Petajajarvi, K. Mikhaylov, A. Roivainen, T. Hanninen and M. Pettissalo, “On the coverage of LPWANs: Range evaluation and channel attenuation model for LoRa technology,” in 2015 14th Int. Conf. on its Telecommunications (ITST), Copenhagen, Denmark, pp. 55–59, 2015. [Google Scholar]
20. M. Rizzi, P. Ferrari, A. Flammini and E. Sisinni, “Evaluation of the IoT LoRaWAN solution for distributed measurement applications,” IEEE Transactions on Instrumentation Measurement, vol. 66, no. 12, pp. 3340–3349, 2017. [Google Scholar]
21. K. E. Nolan, W. Guibene and M. Y. Kelly, “An evaluation of low power wide area network technologies for the Internet of Things,” in 2016 Int. Wireless Communications and Mobile Computing Conf. (IWCMC), Paphos, Cyprus, pp. 439–444, 2016. [Google Scholar]
22. B. Vejlgaard, M. Lauridsen, H. Nguyen, I. Z. Kovács, P. Mogensen et al., “Coverage and capacity analysis of Sigfox, LoRa, GPRS, and NB-IoT,” in 2017 IEEE 85th Vehicular Technology Conf. (VTC Spring), Sydney, NSW, Australia, pp. 1–5, 2017. [Google Scholar]
23. V. -T. Truong, A. Nayyar and M. Masud, “A novel air quality monitoring and improvement system based on wireless sensor and actuator networks using LoRa communication,” PeerJ Computer Science, vol. 7, no. e711, pp. 1–25, 2021. [Google Scholar]
24. K. Mekki, E. Bajic, F. Chaxel and F. Meyer, “A comparative study of LPWAN technologies for large-scale IoT deployment,” ICT Express, vol. 5, no. 1, pp. 1–7, 2019. [Google Scholar]
25. M. Bor and U. Roedig, “LoRa transmission parameter selection,” in 2017 13th Int. Conf. on Distributed Computing in Sensor Systems (DCOSS), Ottawa, ON, Canada, pp. 27–34, 2017. [Google Scholar]
26. E. Ruano Lin, LoRa protocol. Evaluations, limitations and practical test (M.S. thesis). Grenoble Institute of Technology, University in Grenoble, France, 2016. [Google Scholar]
27. B. Reynders and S. Pollin, “Chirp spread spectrum as a modulation technique for long range communication,” in 2016 Symp. on Communications and Vehicular Technologies (SCVT), Mons, Belgium, pp. 1–5, 2016. [Google Scholar]
28. A. Springer, W. Gugler, M. Huemer, L. Reindl, C. Ruppel et al., “Spread spectrum communications using chirp signals,” in IEEE/AFCEA EUROCOMM 2000. Information Systems for Enhanced Public Safety and Security (Cat. No. 00EX405), Munich, Germany, pp. 166–170, 2000. [Google Scholar]
29. Semtech, LoRa Modulation Basics, 2nd edition. Cmarillo, CA, USA: Semtech Corporation, pp. 1–26, 2015. [Online]. Available: https://www.semtech.com/uploads/documents/an1200.22.pdf. [Google Scholar]
30. Semtech, SX1276/77/78/79—137 to 1020 MHz Low Power Long Range Transceiver, Cmarillo, CA, USA: Semtech Corporation, pp. 1–132, 2020. [Online]. Available: https://semtech.my.salesforce.com/sfc/p/#E0000000JelG/a/2R0000001Rbr/6EfVZUorrpoKFfvaF_Fkpgp5kzjiNyiAbqcpqh9qSjE. [Google Scholar]
31. J. Haxhibeqiri, E. De Poorter, I. Moerman and J. Hoebeke, “A survey of LoRaWAN for IoT: From technology to application,” Sensors, vol. 18, no. 11, pp. 3995, 2018. [Google Scholar]
32. T. Elshabrawy and J. Robert, “Closed-form approximation of LoRa modulation BER performance,” IEEE Communications Letters, vol. 22, no. 9, pp. 1778–1781, 2018. [Google Scholar]
33. F. Adelantado, X. Vilajosana, P. Tuset-Peiro, B. Martinez, J. Melia-Segui et al., “Understanding the limits of LoRaWAN,” IEEE Communications Magazine, vol. 55, no. 9, pp. 34–40, 2017. [Google Scholar]
34. J. Haxhibeqiri, E. De Poorter, I. Moerman and J. Hoebeke, “A survey of LoRaWAN for IoT: From technology to application,” Sensors, vol. 18, no. 11, pp. 3995, 2018. [Google Scholar]
35. G. Ferré and A. Giremus, “LoRa physical layer principle and performance analysis,” in 2018 25th IEEE Int. Conf. on Electronics, Circuits and Systems (ICECS), Bordeaux, France, pp. 65–68, 2018. [Google Scholar]
36. F. Cuomo, M. Campo, A. Caponi, G. Bianchi, G. Rossini et al., “EXPLoRa: Extending the performance of LoRa by suitable spreading factor allocations,” in 13th IEEE Int. Conf. on Wireless and Mobile Computing, Networking and Communications (WiMob), Rome, Italy, pp. 1–8, 2017. [Google Scholar]
37. E. D. Widianto, M. S. Pakpahan and R. Septiana, “LoRa QoS performance analysis on various spreading factor in INDONESIA,” in Int. Symp. on Electronics and Smart Devices (ISESD), Bandung, Indonesia, pp. 1–5, 2018. [Google Scholar]
38. T. Elshabrawy and J. Robert, “Enhancing LoRa capacity using non-binary single parity check codes,” in 14th Int. Conf. on Wireless and Mobile Computing, Networking and Communications (WiMob), Limassol, Cyprus, pp. 1–7, 2018. [Google Scholar]
39. S. Gutiérrez, I. Martínez, J. Varona, M. Cardona and R. Espinosa, “Smart mobile LoRa agriculture system based on Internet of Things,” in 2019 IEEE 39th Central America and Panama Convention (CONCAPAN XXXIX), Guatemala City, Guatemala, pp. 1–6, 2019. [Google Scholar]
40. C. A. Boano, N. Tsiftes, T. Voigt, J. Brown and U. Roedig, “The impact of temperature on outdoor industrial sensornet applications,” IEEE Transactions on Industrial Informatics, vol. 6, no. 3, pp. 451–459, 2009. [Google Scholar]
41. O. Iova, A. L. Murphy, G. P. Picco, L. Ghiro, D. Molteni et al., “LoRa from the city to the mountains: Exploration of hardware and environmental factors,” in Proc. of the 2017 Int. Conf. on Embedded Wireless Systems and Networks, Uppsala, Sweden, pp. 317–323, 2017. [Google Scholar]
42. D. Tran, Modeling and forecasting stock market prices (Ph.D. dissertation). California State University, Los Angeles, USA, 2017. [Google Scholar]
43. S. Fahmida, V. P. Modekurthy, M. Rahman, A. Saifullah and M. Brocanelli, “Long-lived LoRa: Prolonging the lifetime of a LoRa network,” in 28th IEEE Int. Conf. on Network Protocols (ICNP), Madrid, Spain, pp. 1–12, 2020. [Google Scholar]
 | This work is licensed under a Creative Commons Attribution 4.0 International License, which permits unrestricted use, distribution, and reproduction in any medium, provided the original work is properly cited. |