DOI:10.32604/cmc.2022.024658
| Computers, Materials & Continua DOI:10.32604/cmc.2022.024658 | |
| Article |
Optimized Deep Learning Model for Colorectal Cancer Detection and Classification Model
1Information Technology Department, Faculty of Computing and Information Technology, King Abdulaziz University, Jeddah, 21589, Saudi Arabia
2Center of Artificial Intelligence for Precision Medicines, King Abdulaziz University, Jeddah, 21589, Saudi Arabia
3Department of Mathematics, Faculty of Science, Al-Azhar University, Naser City, 11884, Cairo, Egypt
4Department of Pharmacy Practice, Faculty of Pharmacy, King Abdulaziz University, Jeddah, 21589, Saudi Arabia
5Information Systems Department, Faculty of Computing and Information Technology, King Abdulaziz University, Jeddah, 21589, Saudi Arabia
6Electrical and Computer Engineering Department, Faculty of Engineering, King Abdulaziz University, Jeddah, 21589, Saudi Arabia
7Computer Science Department, Faculty of Computers and Information, Luxor University, 85951, Egypt
8Mathematics Department, Faculty of Science, South Valley University, Qena, 83523, Egypt
9Department of Mathematics, Faculty of Science, Taif University, Taif, 21944, Saudi Arabia
*Corresponding Author: Mahmoud Ragab. Email: mragab@kau.edu.sa
Received: 26 October 2021; Accepted: 08 December 2021
Abstract: The recent developments in biological and information technologies have resulted in the generation of massive quantities of data it speeds up the process of knowledge discovery from biological systems. Due to the advancements of medical imaging in healthcare decision making, significant attention has been paid by the computer vision and deep learning (DL) models. At the same time, the detection and classification of colorectal cancer (CC) become essential to reduce the severity of the disease at an earlier stage. The existing methods are commonly based on the combination of textual features to examine the classifier results or machine learning (ML) to recognize the existence of diseases. In this aspect, this study focuses on the design of intelligent DL based CC detection and classification (IDL-CCDC) model for bioinformatics applications. The proposed IDL-CCDC technique aims to detect and classify different classes of CC. In addition, the IDL-CCDC technique involves fuzzy filtering technique for noise removal process. Moreover, water wave optimization (WWO) based EfficientNet model is employed for feature extraction process. Furthermore, chaotic glowworm swarm optimization (CGSO) based variational auto encoder (VAE) is applied for the classification of CC into benign or malignant. The design of WWO and CGSO algorithms helps to increase the overall classification accuracy. The performance validation of the IDL-CCDC technique takes place using benchmark Warwick-QU dataset and the results portrayed the supremacy of the IDL-CCDC technique over the recent approaches with the maximum accuracy of 0.969.
Keywords: Colorectal cancer; deep learning; medical imaging; bioinformatics; metaheuristics; parameter tuning
Colorectal cancer (CRC) is the third most common type of cancer, accounting for around 10% of each case worldwide. Various studies have demonstrated that the precise classification of healthcare images could efficiently establish the growth of colorectal cancer [1]. Most common tissue types, namely polyps, normal colon mucosa (NORM), adipose tissue (ADI), cancer-associated stroma (STR), and lymphocytes (LYM) could extract prognosticators straightaway from these eosin stains (HE stains) and hematoxylin, that is primary tissue stains utilized in histology [2]. Optical colonoscopy is the clinical process i.e., extensively employed for examining a sequence of abnormalities on surface of the colon, involving morphology, position, and pathological modifications to generate medical diagnoses. Thereby enhancing the exactness of the diagnoses and the capability to forecast the seriousness of the disease for applying the most suitable medical treatment. Nonetheless, even though the accurate classification of pathological images is a significant feature in supporting physicians to accurately recognize the optimal treatment, a lot of effort and time is needed for analyzing histopathological images, as well as the analysis of tissue classifications is affected directly by various factors [3].
Generally, it can be implemented by pathologists that automatically analysis the histological slides images of CRC tissues that remain the standard for cancer staging and diagnosis [4]. But, the experience, training, time pressure/assessment conditions to every pathologist might lead to distinct diagnoses judgments. Therefore, the universal automated classifications of CRC pathological tissue slide images for moderate assessment have significant medical importance. Based on the pathologists’ experience, state of the pathologist, and the certain disease entity outcomes might considerably differ [5]. Furthermore, the determination of circling of tumor regions and tumor content on H&E slides for identifying regions to sample for downstream genomic analyses is an essential preanalytical step by accreditation bodies to enrich tumor content and guarantee precise determination of genomic variants. Since the size of tumor region could be smaller, pathologists are frequently utilizing higher magnification to detect tumor cells. These requirements considerably increase the amount of work for pathologists.
The deep learning (DL) method has been effectively employed in several tasks involving language translation, image processing, and sound/voice processing [6]. Current developments have shown that the DL method could be employed in medical image processing, namely computed tomography, magnetic resonance imaging, endoscopy, and biopsy. Generally, AI applications in the medical fields have 2 major sections: physical and virtual. Machine learning (ML) and DL constitute the virtual components of AI. ML algorithm is additionally divided into reinforcement, supervised, and unsupervised learning [7]. In the meantime, the primary DL system, a CNN approach, signifies a specific kind of multi-layer artificial neural network (ANN) i.e., very effective for image classification. So far, the growth of neural network (NN) methods has permeated the medical field with major achievements.
In recent times, digital pathology dataset has turned out to be an open-source platform and has opened the opportunity of estimating the possibility of employing DL approach to increase the quality and efficiency of histologic diagnoses. e.g., the aim of CAMELYON17 is automatic classification and detection of breast cancer metastasis in overall-slide images of histological lymph node section. By using a CNN framework, former studies have shown 92.4% sensitivity on the CAMELYON datasets, i.e., much greater than human pathologists attempting comprehensive research that results in 73.2% of sensitivity. Additionally, DL method is utilized for predicting experimental results straightaway from histological images [8]. According to 100,000 H&E image patches, a CNN has been trained by a 9-class accurateness of >94%. These data have shown effective results to improve survival predictions than the Union for International Cancer Control staging scheme.
This study presents an intelligent DL based CC detection and classification (IDL-CCDC) model for bioinformatics applications. The proposed IDL-CCDC technique involves fuzzy filtering technique for noise removal process. In addition, water wave optimization (WWO) based EfficientNet model is utilized to derive feature vectors from the test images. Finally, chaotic glowworm swarm optimization (CGSO) based variational auto encoder (VAE) is applied for the classification of CC into benign or malignant. The design of WWO and CGSO algorithms helps to improve the overall classification performance. To showcase the improved performances of the IDL-CCDC model, a wide range of simulations is carried out against benchmark Warwick-QU dataset and the results are inspected under various aspects.
2 Prior Works on Colorectal Cancer Classification
Kather et al. [9] presented a DL based methodology in colorectal cancer segmentation and detection from digitized H&E-stained histology slides. Xu et al. [10] focused on using CNN method, a DL software, to promotion in cT1b diagnoses. AlexNet and Caffe have been employed to ML method. Finetuning of data to rise image numbers was accomplished. Oversampling to the training images was carried out to prevent impartiality in image number, and learning was conducted. The 3-fold cross-validation technique has been utilized.
Ito et al. [11] estimated the efficiency, performance, and agreement of an FCN for liver lesion segmentation and detection at CT examination in person with colorectal liver metastasis CLM. The efficiency of fully automatic and user-corrected segmentation was related to automatic segmentation. The user-corrected segmentations, inter user agreement, and interaction time of manual have been measured. Vorontsov et al. [12] proposed the pathomics method, called Ensembled Patch Likelihood Aggregation (EPLA) depends on 2 successive phases: WSI-level and patch level predictions. Initially, it has been validated and developed in TCGA-COAD, later generalized in Asian-CRC via TL method. The pathological signature extracted from the method has been examined using transcriptomic and genomic profiles for model interpretation.
Cao et al. [13] introduced an image-based method for predicting CRC CMS from typical H&E section with DL method. Sirinukunwattana et al. [14] showed that spatial light interference microscopy (SLIM) could offer a path to intrinsic objective markers which is independent of preparation and human bias. In addition, the sensitivity of SLIM to collagen fibres produces data related to the outcome of patients, that isn't accessible in H&E. Now, they demonstrate that DL and SLIM could form an effective integration to screen applications: trained on 1660 SLIM images of colon glands and validate on 144 glands.
Zhang et al. [15] designed a pattern-detection optical coherence tomography to automatically diagnose human colorectal tissue in real-world. It can be attained using early experience with eighteen ex vivo human samples. Zeng et al. [16] described a new supervised cancer classification architecture, deep cancer subtype classification (DeepCC), based DL method of functional spectra quantifying activities of biological pathways. Experimental research about breast cancer and colorectal classification, DeepCC single sample predictor, and DeepCC classifier attained high accuracy, sensitivity, and specificity than other extensively employed classification models.
Gao et al. [17] utilized a joint DL and graphical method-based architecture for depth assessment from endoscopy image. As depth is an intrinsically continual properties of an objects, it could be simply modeled as a graphical learning problems. Different from prior methods, this technique doesn't need handcrafted features. A huge number of increased data is needed for training this architecture. Because there is restricted accessibility of colonoscopy imagee using ground-truth depth map and colon texture was extremely patients-specific, they produced trained image with a synthetic, texture-free colon phantom for training this model.
Mahmood et al. [18] examined the possibility of SSD architecture to detect polyps in colonoscopy video. SSD is a one-phase model that utilizes feedforward CNN method for producing a set of fixed-sizes bounding box for all the objects from distinct feature mappings. The 3 distinct feature extractor, includes InceptionV3, ResNet50, and VGG16 have been measured. Multiscale feature maps combined with SSD have been developed for InceptionV3 and ResNet50, correspondingly.
3 The Proposed IDL-CCDC Technique
In this study, a novel IDL-CCDC technique has been presented to detect and classify different classes of CC. The proposed IDL-CCDC technique encompasses fuzzy filtering based preprocessing, EfficientNet based feature extraction, WWO based hyperparameter tuning, VAE based classification, and CGSO based parameter optimization. The procedures included in every module are elaborated in the succeeding sections.
3.1 Fuzzy Filtering Based Pre-Processing
At the initial stage, the fuzzy filtering approach is applied to eliminate the existence of noise exist in the image. The basic concept behindhand this filter is to average pixels with another pixel value from its neighbourhood, but at the same time, deal with significant image structure as edge. The major concerns of the presented filter are to differentiate among local variations because of noise and image structures. To achieve this, all the pixels derive a value which express the degree where the derivative in a specific directions are smaller. These values are acquired for all the directions equivalent to the adjacent pixel of the processed pixel by a fuzzy rule [19]. Then, further construction of the filter is depending on the observation that a huge fuzzy derivative more likely is caused by an edge in an image e, whereas a smaller fuzzy derivative more likely is caused by noise. Subsequently, for every direction, we employ 2 fuzzy rules which consider this observation (distinguish among local variations because of image structures and noise), which determines the contributions of neighbouring pixel value. The results of this rule are defuzzified and a “correction term” is attained for processing pixel values.
3.2 Design of WWO with EfficientNet Based Feature Extraction
During feature extraction, the preprocessed image is fed into the EfficientNet model to derive valuable set of feature vectors. The EfficientNet technique was utilized as feature extraction component for generating a helpful group of feature vectors of the input satellite image. The DL is most well-known framework as DL approaches have been learned significant features in an input image at different convolutional levels similar to the purpose of human brain. The DL was solving complex problems usually well as well as quickly with high classifier accuracy and lower error rate. The DL approach was contained different modules (convolutional, pooling, and fully connected (FC) layers, and activation function). In DL design aim for gaining optimal performance accuracy and efficiency with smaller manners.
Distinct from another existing DL approaches, the EfficientNet structure was compound scaling manner that employs the compound coefficients to uniformly scale network resolution, width, depth and. An EfficientNet has eight different methods from B0 to B7. Fig. 1 depicts the layers in EfficientNet model [20]. The EfficientNet employs inverted bottleneck convolution which is primarily well-known from the MobileNetV2 approach that is a layer that primarily expands the network and subsequently compresses the channel. This structure reduced computation with the factor of 2 as compared with normal convolution, where f signifies the filter size. The investigators depicted that EfficientNetB0 was easiest of all 8 approaches as well as employs minimal parameters. So, it can be directly employed EfficientNetB0 to evaluate performance.
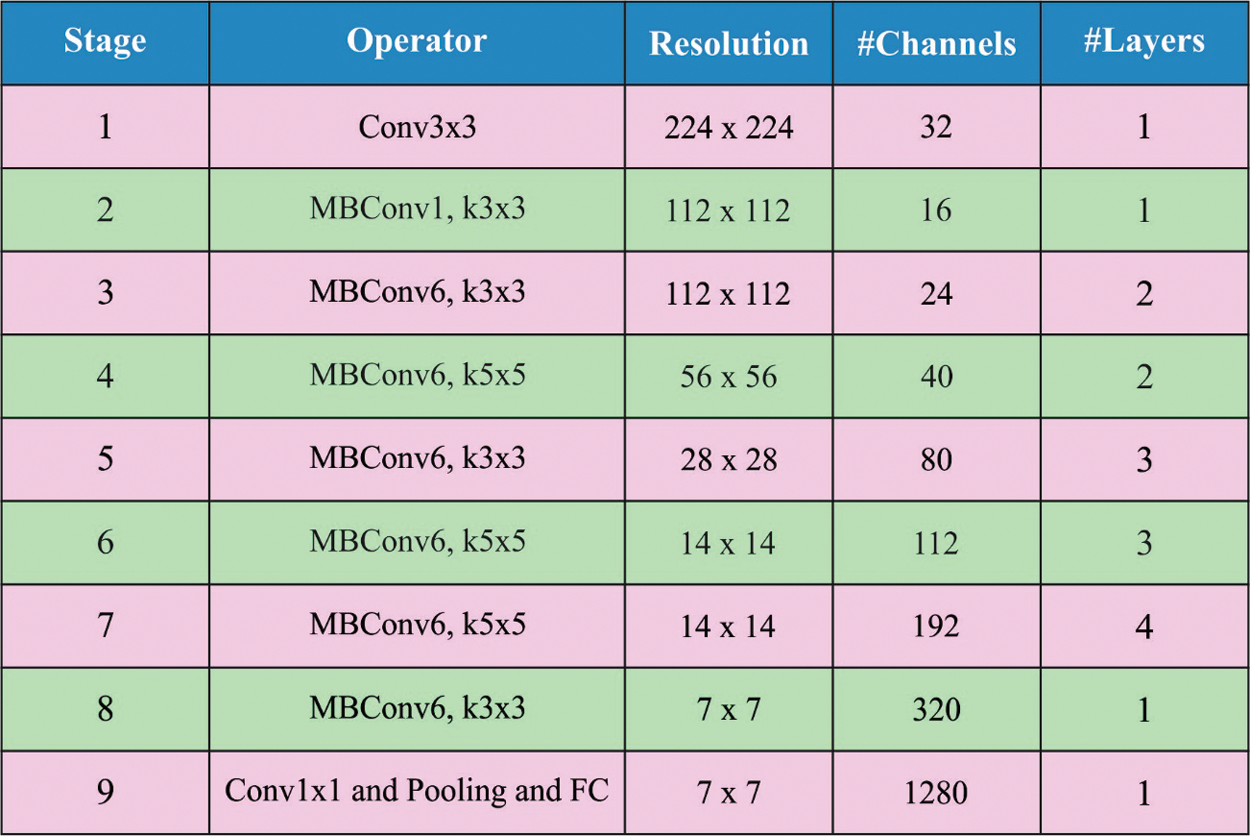
Figure 1: Layers in EfficientNet model
For optimally adjusting the hyperaprameters involved in the EfficientNet model, the WWO algorithm is applied. Now, the WWO approach was employed to tune hyperparameter of the Effective model. Also, it is progressed from the shallow water wave method for overcoming the optimization problem. The lack of generality leads to a maximization problem with
where as ran
When
Let
It is calculated by limited height to 0, as well as employ a simple methodology to determine the location using refraction as follows:
In which
The wave shift to a position is minimal than the prior values and wave crest velocity exceeds the wave celerity. Next, breaking function of wave
In which
3.3 Design of CGSO with VAE Based Classification
Lastly, the VAE is utilized to define the appropriate class labels for the test images applied. In the classification method, the features are fed to the VAE method for allotting the appropriate class label. Auto encoder (AE) is the early generative module trained for reproducing or recreating the input vectors x. The AE has consisted of 2 main structures: encoder and decoder, i.e., multi layered NN parameterized with
The different kinds of the AE become a widespread generative model using the integration of Bayesian inference and efficacy of NN to accomplish a non-linear lower dimension latent space. The Bayesian inference is achieved by another layer used to sample the latent vector z with formerly stated distribution
where
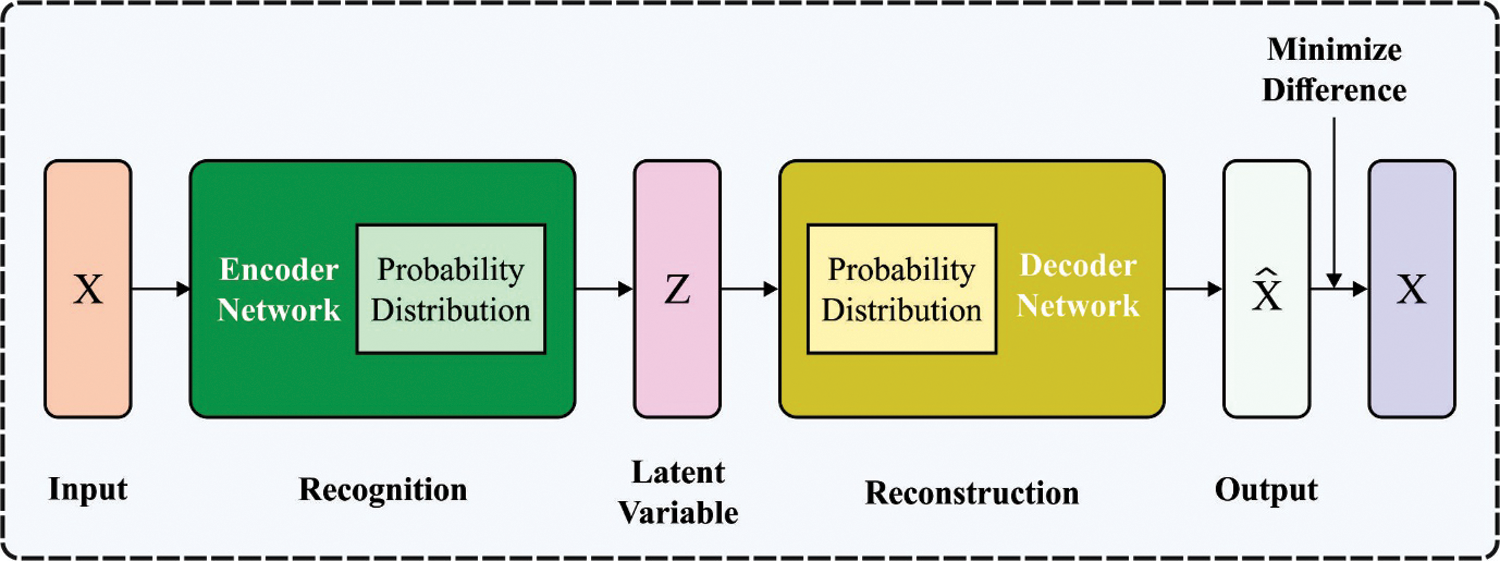
Figure 2: VAE structure
In order to effectually tune the parameters involved in the VAE approach, the CGSO is employed and thereby the classifier results get enhanced. In the GSO algorithm, n firefly individual is arbitrarily dispersed in D dimension searching space, also all the fireflies carry
In which
Probability selection: j-th individual likelihood
Amongst others, the field set is
Let s be the moving step.
Dynamic decision region radius upgrade:
GSO method consists of luciferase update, early distribution of fireflies, decision-making domain update, and firefly movement. To expand the performances of the GSO algorithm, the CGSO algorithm is applied by the inclusion of chaos concept.
Chaos phenomenon is an exclusive phenomenon in deterministic non-linear model that are made without including any arbitrary factor. Since chaotic variable has their individual arbitrariness, they could continuously traverse and search the whole space and shows followable laws in the procedure. According to this features, chaos is frequently utilized for optimizing search problem to prevent falling towards local optimal. Logistic mapping is a standard chaotic method. Because the method is quite easy, the traversal unequally in the initiation method would decrease the optimization effects. The study that the Tent maps traverse uniformly and the searching speed is quicker when compared to the Logistics map. It can be expressed by:
The Tent chaotic maps are denoted as Bernoulli shift transformation:
Afterward analyses, it is found that there is smaller period in the Tent chaotic order, as well as unstable periodic point. To avoid it from falling towards an unstable period point/a smaller period point [24]. The arbitrary parameter
afterward Bernoulli transformation is:
In which: NA represents the amount of particles in the chaotic order, rand (0, 1) denotes an arbitrary value chosen in the interval of zero and one. Based on the features of Tent chaotic map, the steps of employing the enhanced chaotic maps to create a chaotic order in the possible region:
Step 1 Arbitrarily produce the early value
Step 2 Utilize Eq. (14) to initiate the iterative evaluation to make Y order, and every time i incremented by 1.
Step 3 Stop once the iteration count attains maximal and store the generated Y order.
The performance evaluation of the IDL-CCDC technique is carried out against the Warwick-QU dataset [25]. It comprises a total of 165 images with 74 images under benign class and 91 images underclass. Few sample images are demonstrated in Fig. 3.
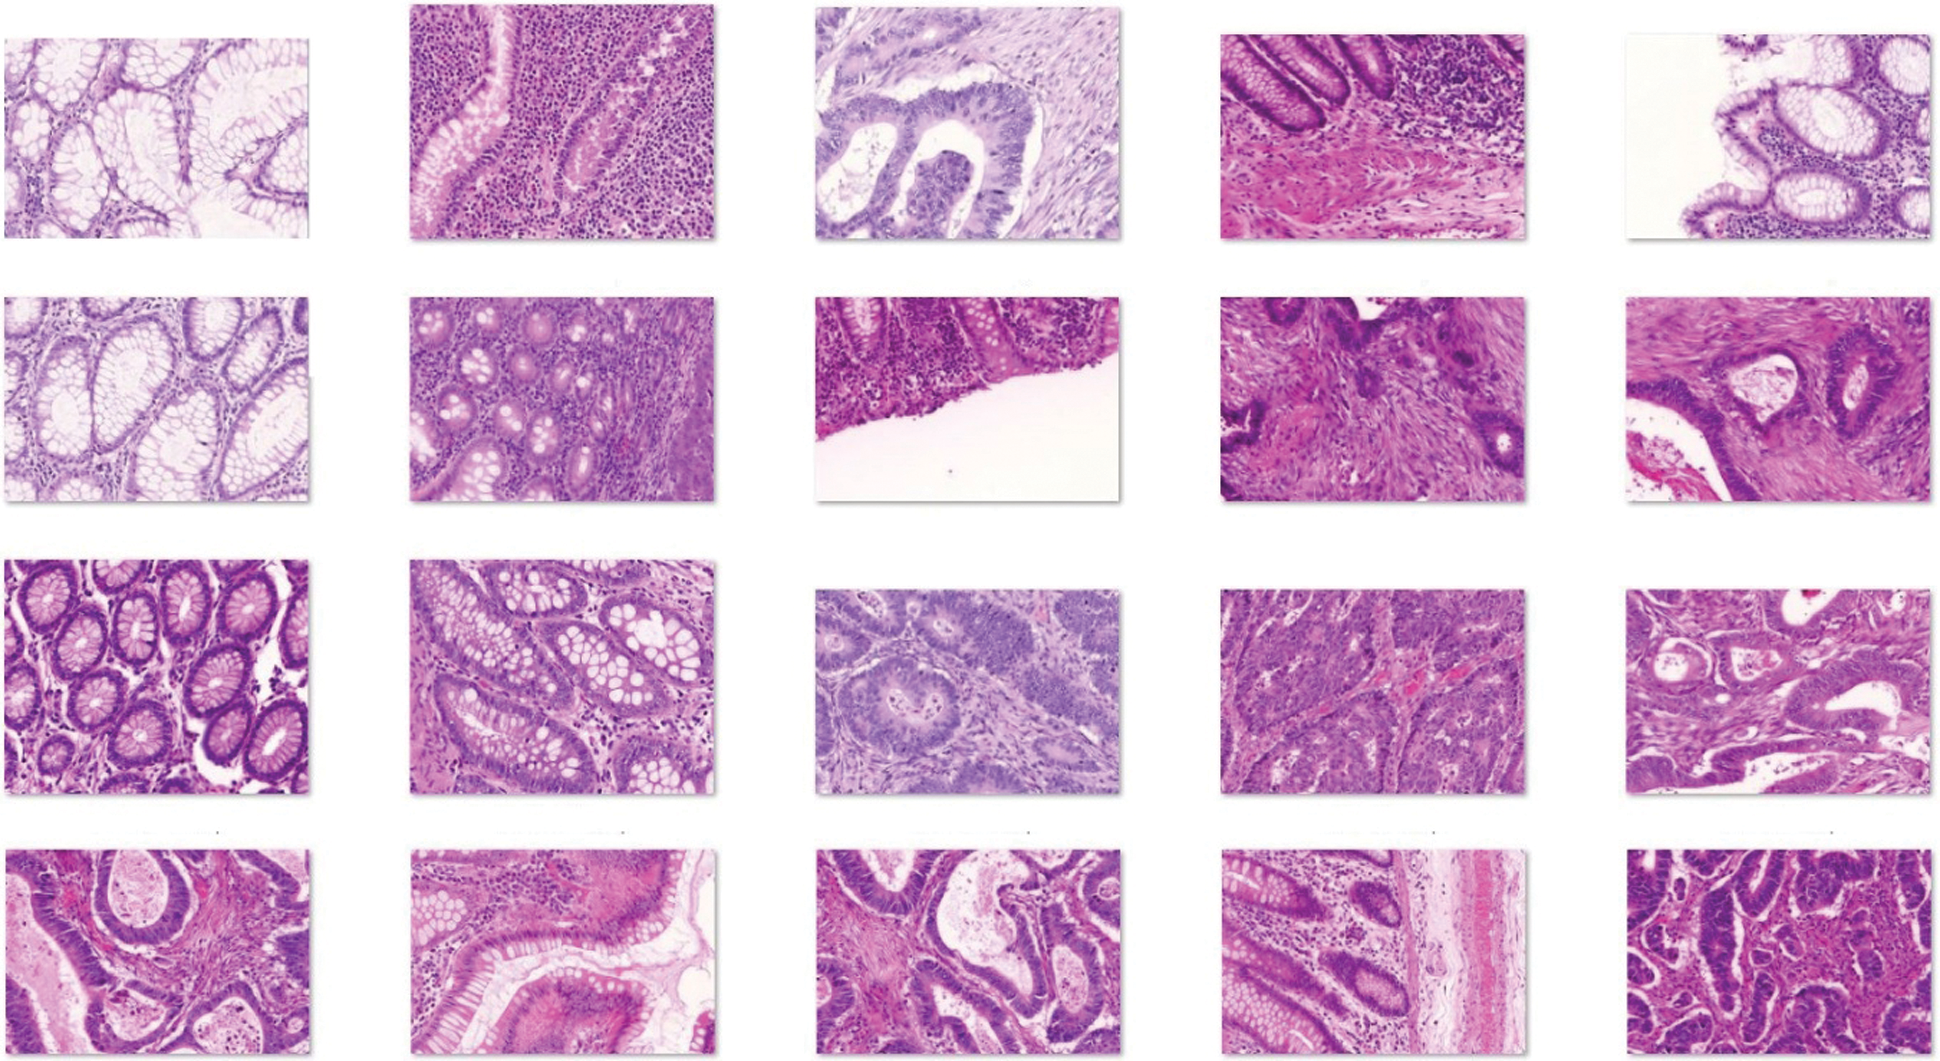
Figure 3: Sample images
Tab. 1 investigates the result analysis of the IDL-CCDC technique on CC classification under varying training/testing data.
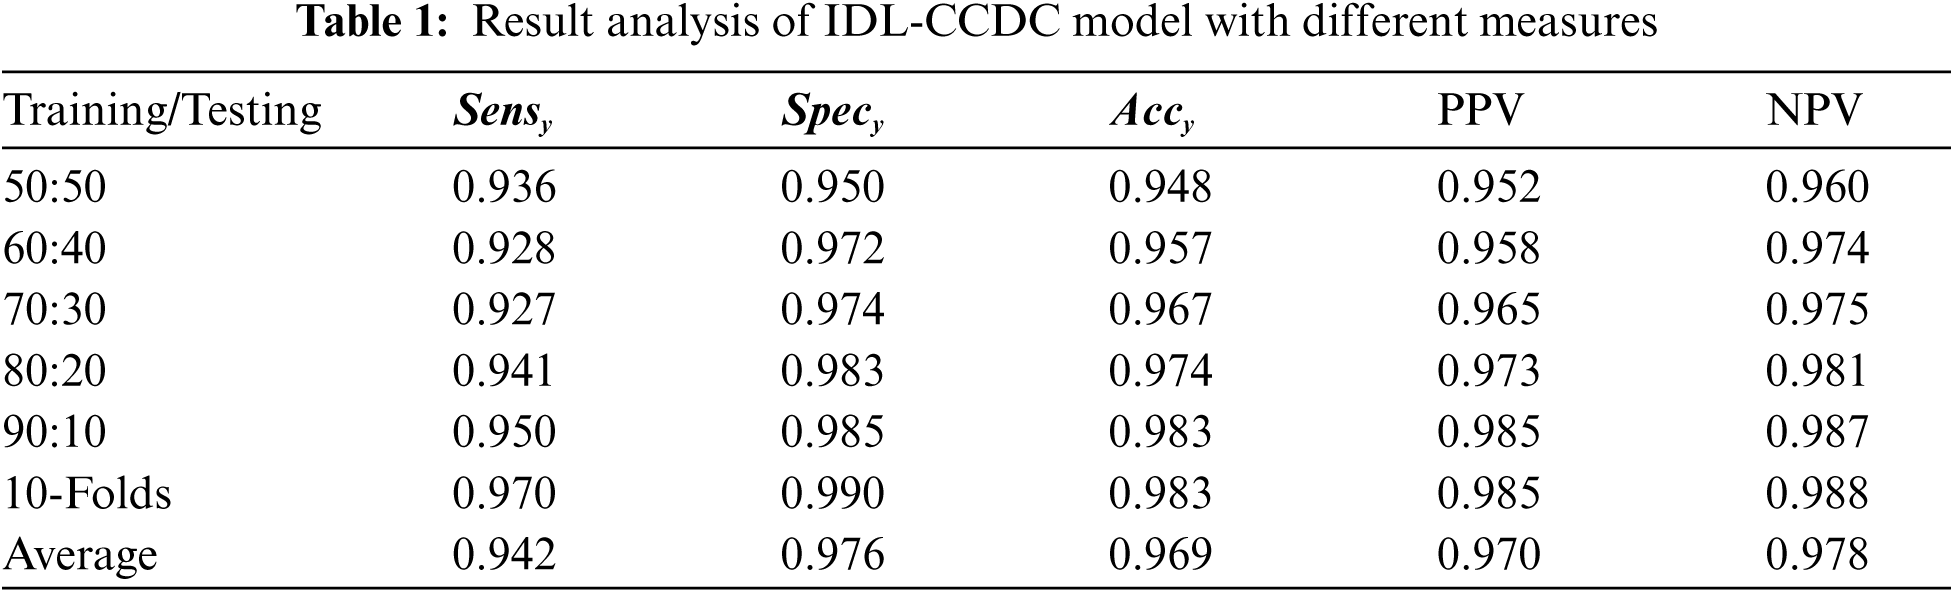
Fig. 4 depicts the
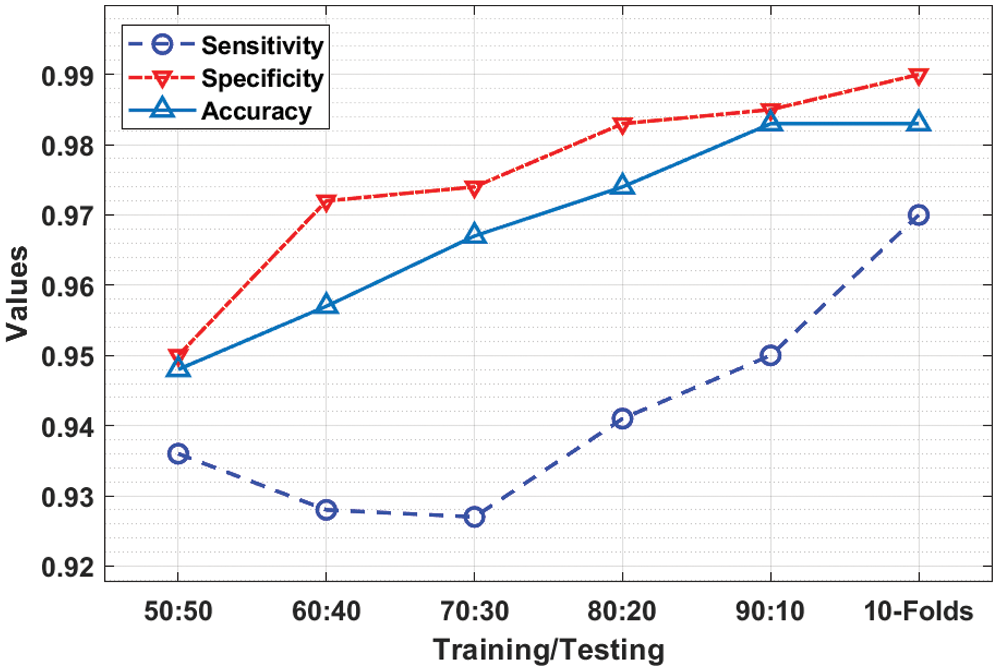
Figure 4: Result analysis of IDL-CCDC model with distinct measures
Fig. 5 demonstrates the PPV and NPV analysis of the IDL-CCDC technique under distinct training/testing data. The results implied that the IDL-CCDC technique has gained effective CC classification performance under all data sizes. For instance, with training/testing data of 50:50, the IDL-CCDC technique has resulted in PPV and NPV of 0.952 and 0.960. At the same time, with training/testing data of 70:30, the IDL-CCDC manner has resulted in PPV and NPV of 0.965 and 0.975. Moreover, with training/testing data of 90.10, the IDL-CCDC approach has resulted in PPV and NPV of 0.985 and 0.987. Furthermore, with training/testing data of 10-folds, the IDL-CCDC system has resulted in PPV and NPV of 0.985 and 0.988.
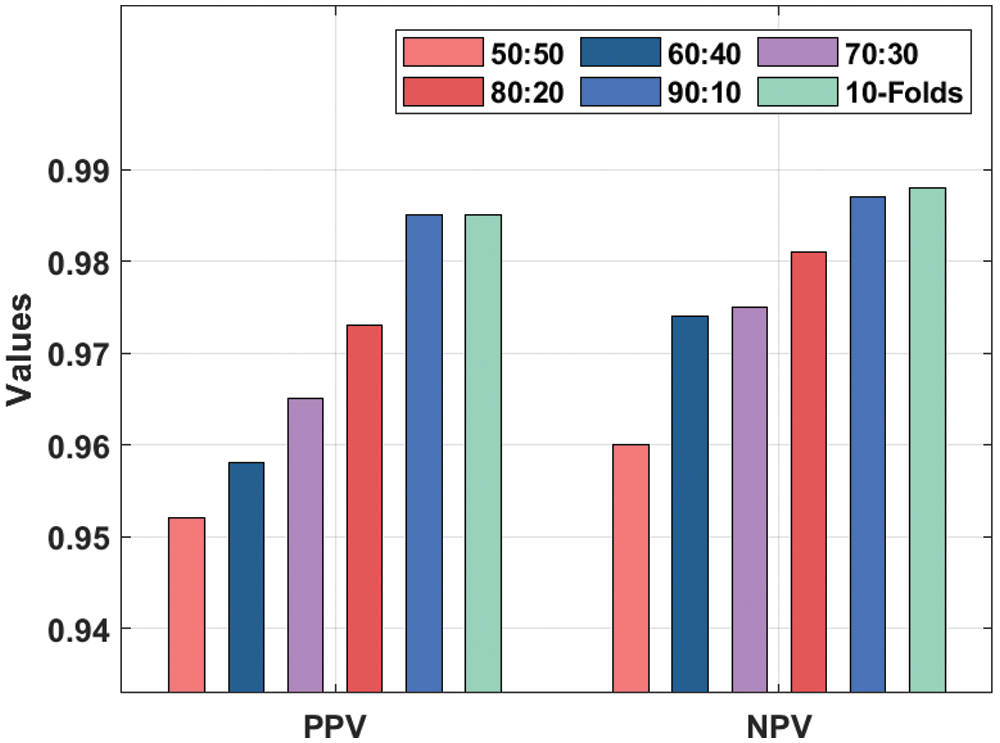
Figure 5: PPV and NPV analysis of IDL-CCDC model
An average CC classification results analysis of the IDL-CCDC technique on the benchmark test images is demonstrated in Fig. 6. The figure portrayed that the IDL-CCDC technique has resulted in an effectual outcome with the maximum
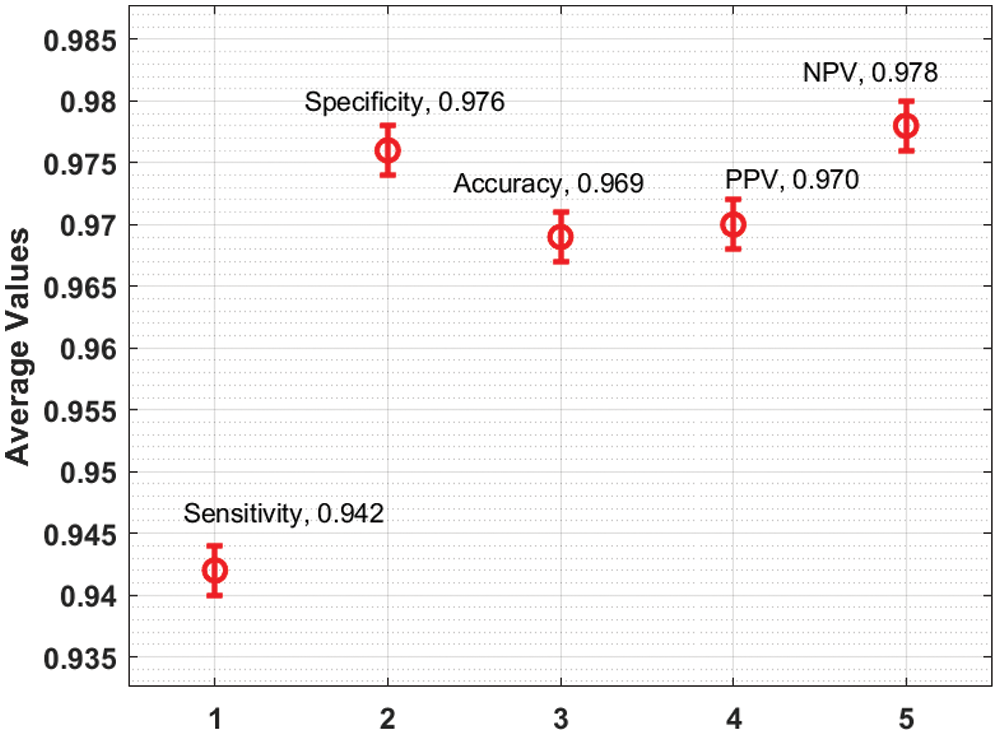
Figure 6: Average analysis of IDL-CCDC model
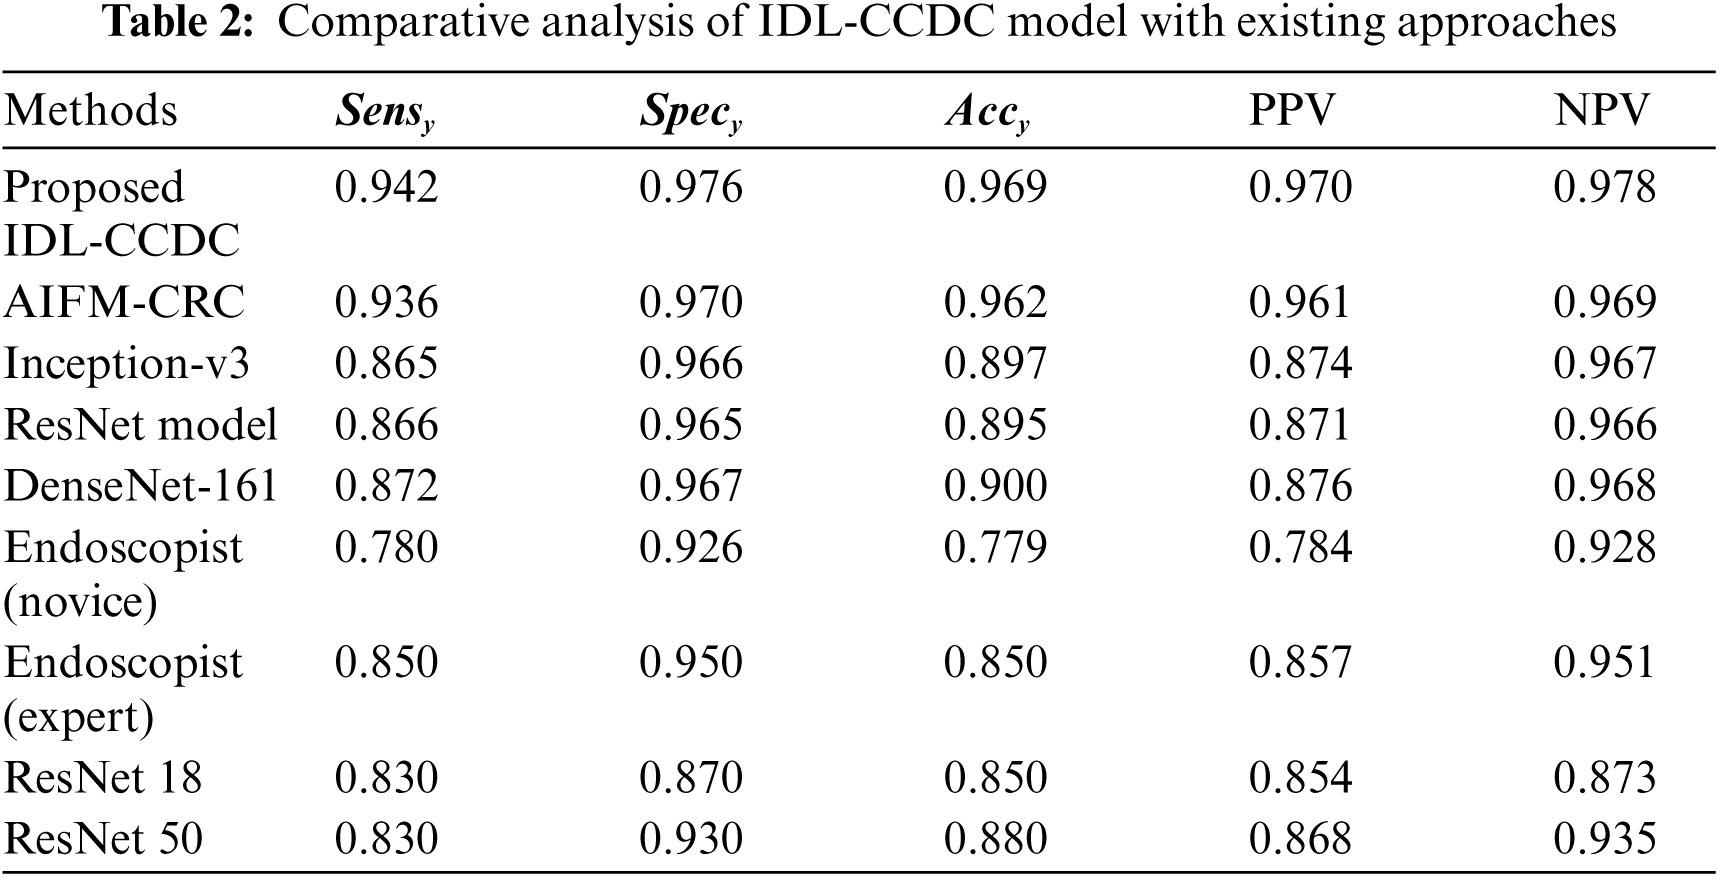
Tab. 2 shows the comparative analysis of IDL-CCDC model with existing approaches [26–28] in terms of distinct measures.
A briefly comparative
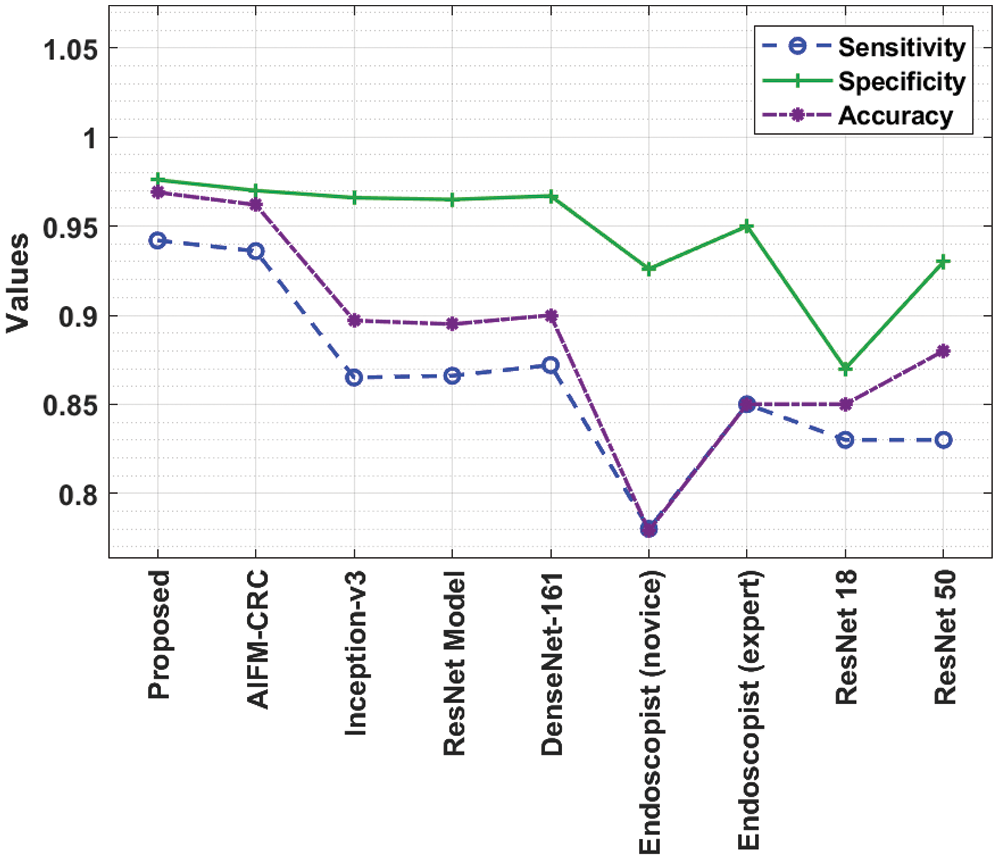
Figure 7: Comparative analysis of IDL-CCDC technique with existing approaches
A detailed comparative PPV and NPV results from analysis of the IDL-CCDC technique is made in Fig. 8. The figure reported that the Endoscopist (novice) approach has resulted in poor outcomes with the PPV and NPV of 0.784 and 0.928. On continuing with, the ResNet18 model has gained slightly enhanced performance with the PPV and NPV of 0.854 and 0.873. In line with, the Endoscopist (expert) approach has attained moderate PPV and NPV of 0.857 and 0.951. Moreover, the ResNet50, ResNet, Inception, and DenseNet-161 models have attained somewhat acceptable PPV and NPV values.
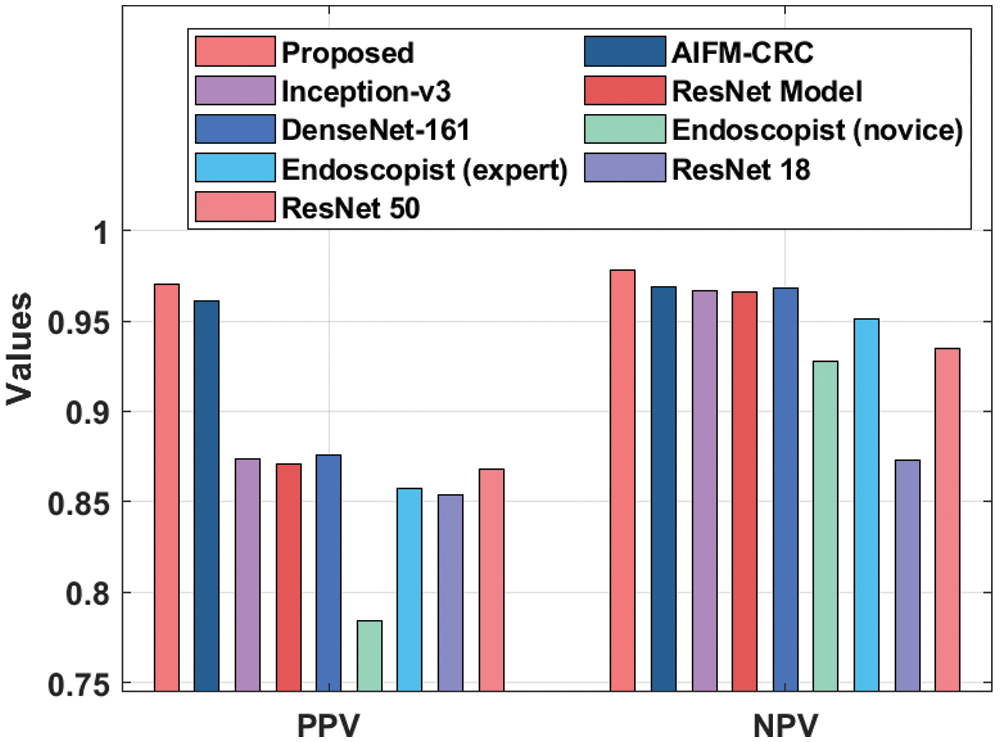
Figure 8: PPV and NPV analysis of IDL-CCDC technique with existing approaches
Furthermore, the AIFM-CRC technique has accomplished near optimal CC classification performance with the PPV and NPV of 0.961 and 0.969 respectively. However, the proposed IDL-CCDC technique has outperformed all the other current techniques with the maximal PPV and NPV of 0.970 and 0.978.
The current research work introduced Enhanced Virtual Neural Network method to diagnose White Blood Cell cancer i.e., leukemia and classify the disease based on medical images. This method is significant in detecting leukemia using WBC images based on following features; non-invasive sampling procedure, non-biased results due to difference in nationality, complete utilization of WBCs, usage of different parameters and multi-parameter clustering techniques. The proposed method yielded excellent results within the best possible time. Further, Enhanced Virtual Neural Network classifiers were used in this research to recognize different types of WBCs. The proposed model was found to be efficient in classification and was able to predict the disease earlier through images. The probabilities of disease detection and development were also highly optimistic. The classification method achieved 97.8% accuracy in comparison with other methods. Future researchers can expand the research work using different images from other standard datasets and use different scenarios.
Funding Statement: This research work was funded by Institution Fund projects under Grant No. (IFPRC-214-166-2020) Therefore, authors gratefully acknowledge technical and financial support from the Ministry of Education and King Abdulaziz University, DSR, Jeddah, Saudi Arabia.
Conflicts of Interest: The authors declare that they have no conflicts of interest to report regarding the present study.
1. R. J. A. Cabrera, C. A. P. Legaspi, E. J. G. Papa, R. D. Samonte and D. D. Acula, “HeMatic: An automated leukemia detector with separation of overlapping blood cells through image processing and genetic algorithm,” in 2017 Int. Conf. on Applied System Innovation, ICASI 2017. Proceedings: IEEE, Sapporo, Japan, pp. 985–987, 2017. [Google Scholar]
2. M. J. Tsai and Y. -H. Tao, “Deep learning techniques for the classification of colorectal cancer tissue,” Electronics, vol. 10, no. 14, pp. 1662, 2021. [Google Scholar]
3. M. Egeblad, E. S. Nakasone and Z. Werb, “Tumors as organs: Complex tissues that interface with the entire organism,” Developmental Cell, vol. 18, no. 6, pp. 884–901, 2010. [Google Scholar]
4. J. N. Kather, C. A. Weis, F. Bianconi, S. M. Melchers, L. R. Schad et al., “Multi-class texture analysis in colorectal cancer histology,” Scientific Reports, vol. 6, no. 1, pp. 27988, 2016. [Google Scholar]
5. J. N. Kather, J. Krisam, P. Charoentong, T. Luedde, E. Herpel et al., “Predicting survival from colorectal cancer histology slides using deep learning: A retrospective multicenter study,” PLOS Medicine, vol. 16, no. 1, pp. e1002730, 2019. [Google Scholar]
6. H. Brunnström, A. Johansson, S. W. Fremer, M. Backman, D. Djureinovic et al., “PD-L1 immunohistochemistry in clinical diagnostics of lung cancer: Inter-pathologist variability is higher than assay variability,” Modern Pathology, vol. 30, no. 10, pp. 1411–1421, 2017. [Google Scholar]
7. I. Sutskever, O. Vinyals and Q. V. Le, “Sequence to sequence learning with neural networks,” Advances in Neural Information Processing Systems, vol. 2, pp. 3104–3112, 2014. [Google Scholar]
8. J. Deng, W. Dong, R. Socher, L. J. Li, K. Li et al., “ImageNet: A large-scale hierarchical image database,” in 2009 IEEE Conf. on Computer Vision and Pattern Recognition, Miami, FL, pp. 248–255, 2009. [Google Scholar]
9. J. N. Kather, J. Krisam, P. Charoentong, T. Luedde, E. Herpel et al., “Predicting survival from colorectal cancer histology slides using deep learning: A retrospective multicenter study,” PLOS Medicine, vol. 16, no. 1, pp. e1002730, 2019. [Google Scholar]
10. L. Xu, B. Walker, P. I. Liang, Y. Tong, C. Xu et al., “Colorectal cancer detection based on deep learning,” Journal of Pathology Informatics, vol. 11, no. 1, pp. 28, 2020. [Google Scholar]
11. N. Ito, H. Kawahira, H. Nakashima, M. Uesato, H. Miyauchi et al., “Endoscopic diagnostic support system for ct1b colorectal cancer using deep learning,” Oncology, vol. 96, no. 1, pp. 44–50, 2019. [Google Scholar]
12. E. Vorontsov, M. Cerny, P. Régnier, L. D. Jorio, C. J. Pal et al., “Deep learning for automated segmentation of liver lesions at ct in patients with colorectal cancer liver metastases,” Radiology: Artificial Intelligence, vol. 1, no. 2, pp. 180014, 2019. [Google Scholar]
13. R. Cao, F. Yang, S. C. Ma, L. Liu, Y. Zhao et al., “Development and interpretation of a pathomics-based model for the prediction of microsatellite instability in colorectal cancer,” Theranostics, vol. 10, no. 24, pp. 11080–11091, 2020. [Google Scholar]
14. K. Sirinukunwattana, E. Domingo, S. D. Richman, K. L. Redmond, A. Blake et al., “Image-based consensus molecular subtype (imCMS) classification of colorectal cancer using deep learning,” Gut, vol. 70, no. 3, pp. 544–554, 2021. [Google Scholar]
15. J. K. Zhang, Y. R. He, N. Sobh and G. Popescu, “Label-free colorectal cancer screening using deep learning and spatial light interference microscopy (SLIM),” APL Photonics, vol. 5, no. 4, pp. 040805, 2020. [Google Scholar]
16. Y. Zeng, S. Xu, W. C. Chapman, S. Li, Z. Alipour et al., “Real-time colorectal cancer diagnosis using PR-OCT with deep learning,” in Biophotonics Congress: Biomedical Optics 2020 (Translational, Microscopy, OCT, OTS, BRAIN), Washington, DC, pp. OW2E.5, 2020. [Google Scholar]
17. F. Gao, W. Wang, M. Tan, L. Zhu, Y. Zhang et al., “DeepCC: A novel deep learning-based framework for cancer molecular subtype classification,” Oncogenesis, vol. 8, no. 9, pp. 44, 2019. [Google Scholar]
18. F. Mahmood and N. J. Durr, “Deep learning-based depth estimation from a synthetic endoscopy image training set,” in Medical Imaging 2018: Image Processing, Houston, United States, pp. 72, 2018. [Google Scholar]
19. M. Liu, J. Jiang and Z. Wang, “Colonic polyp detection in endoscopic videos with single shot detection based deep convolutional neural network,” IEEE Access, vol. 7, pp. 75058–75066, 2019. [Google Scholar]
20. O. P. Verma, M. Hanmandlu, A. K. Sultania and A. S. Parihar, “A novel fuzzy system for edge detection in noisy image using bacterial foraging,” Multidimensional Systems and Signal Processing, vol. 24, no. 1, pp. 181–198, 2013. [Google Scholar]
21. M. Tan and Q. Le, “Efficientnet: Rethinking model scaling for convolutional neural networks,” in Int. Conf. on Machine Learning, PMLR, pp. 6105–6114, 2019. [Google Scholar]
22. Y. Jin, S. Li and L. Ren, “A new water wave optimization algorithm for satellite stability,” Chaos, Solitons & Fractals, vol. 138, pp. 109793, 2020. [Google Scholar]
23. M. Elbattah, C. Loughnane, J. L. Guérin, R. Carette, F. Cilia et al., “Variational autoencoder for image-based augmentation of eye-tracking data,” Journal of Imaging, vol. 7, no. 5, pp. 83, 2021. [Google Scholar]
24. P. Qiong, Y. Liao, P. Hao, X. He and C. Hui, “A Self-adaptive step glowworm swarm optimization approach,” International Journal of Computational Intelligence Systems, vol. 18, no. 1, pp. 1950004, 2019. [Google Scholar]
25. O. Chengtian, L. Yujia and Z. Donglin, “An adaptive chaotic sparrow search optimization algorithm,” in 2021 IEEE 2nd Int. Conf. on Big Data, Artificial Intelligence and Internet of Things Engineering (ICBAIE), Nanchang, China, pp. 76–82, 2021. [Google Scholar]
26. K. Sirinukunwattana, D. R. J. Snead and N. M. Rajpoot, https://www.warwick.ac.uk/fac/sci/dcs/research/tia/glascontest/download. 2015. [Google Scholar]
27. R. F. Mansour, N. M. Alfar, S. A. Khalek, M. Abdelhaq, R. A. Saeed et al., “Optimal deep learning based fusion model for biomedical image classification,” Expert Systems, vol. Article in press, https://doi.org/10.1111/exsy.12764, 2021. [Google Scholar]
28. R. F. Mansour, J. E. Gutierrez, M. Gamarra, V. G. Díaz, D. Gupta et al., “Artificial intelligence with big data analytics-based brain intracranial hemorrhage e-diagnosis using CT images,” Neural Computing & Applications, https://doi.org/10.1007/s00521-021-06240-y, 2021. [Google Scholar]
 | This work is licensed under a Creative Commons Attribution 4.0 International License, which permits unrestricted use, distribution, and reproduction in any medium, provided the original work is properly cited. |