DOI:10.32604/cmc.2022.022735
| Computers, Materials & Continua DOI:10.32604/cmc.2022.022735 | |
| Article |
Intelligent Cloud IoMT Health Monitoring-Based System for COVID-19
1Department of Information Systems and Operation Management, College of Business Administration, Kuwait University, 13060, Kuwait
2Atria Institute of Technology, Bengaluru, Karnataka, India
3Electronics and Communication Engineering, SRM Institute of Science & Technology, Delhi-NCR, 201204, India
4Business Technology Analyst, ZS Associates, Pune, 411014, India
*Corresponding Author: Hameed AlQaheri. Email: hameed.alqaheri@ku.edu.kw
Received: 17 August 2021; Accepted: 18 October 2021
Abstract: The most common alarming and dangerous disease in the world today is the coronavirus disease 2019 (COVID-19). The coronavirus is perceived as a group of coronaviruses which causes mild to severe respiratory diseases among human beings. The infection is spread by aerosols emitted from infected individuals during talking, sneezing, and coughing. Furthermore, infection can occur by touching a contaminated surface followed by transfer of the viral load to the face. Transmission may occur through aerosols that stay suspended in the air for extended periods of time in enclosed spaces. To stop the spread of the pandemic, it is crucial to isolate infected patients in quarantine houses. Government health organizations faced a lack of quarantine houses and medical test facilities at the first level of testing by the proposed model. If any serious condition is observed at the first level testing, then patients should be recommended to be hospitalized. In this study, an IoT-enabled smart monitoring system is proposed to detect COVID-19 positive patients and monitor them during their home quarantine. The Internet of Medical Things (IoMT), known as healthcare IoT, is employed as the foundation of the proposed model. The least-squares (LS) method was applied to estimate the linear model parameters for a sequential pilot survey. A statistical sequential analysis is performed as a pilot survey to efficiently collect preliminary data for an extensive survey of COVID-19 positive cases. The Bayesian approach is used, based on the assumption of the random variable for the priori distribution of the data sample. Fuzzy inference is used to construct different rules based on the basic symptoms of COVID-19 patients to make an expert decision to detect COVID-19 positive cases. Finally, the performance of the proposed model was determined by applying a four-fold cross-validation technique.
Keywords: Pandemic; COVID-19; internet of medical things; least square; fuzzy inference
The Coronavirus pandemic (also referred to as the COVID-19 epidemic) has generated social and financial disruption worldwide, causing the most significant worldwide downturn since the Great Depression. Up to 100 million people have fallen into destitution, and worldwide starvation influences 265 million people. It has prompted the delay or crossing out of brandishing, strict, political, and social occasions, far-reaching deficiencies exacerbated by alarm purchasing, and decreased emissions of contaminants and greenhouse gasses. Educational institutions have been shut down at national or local levels in 161 nations, influencing approximately 98.6% of the world's student population [1].
The Coronavirus pandemic remains an ongoing worldwide pandemic. The first outbreak was recognized in December 2019 in Wuhan, China. Consequently, the WHO declared a global health emergency in early 2021. Since then, the outbreak has created extensive worldwide damage to human lives and economies. Even after numerous measures to halt the spread of COVID-1—such as strict lockdown measures, the shutdown of workplaces, educational institutions, housing production, and daily transport system—it was nevertheless impossible to control or stop the spread of the virus. Recognized in late 2019 as an infectious disease, the Coronavirus affects the human body in several ways. It causes shortness of breath or trouble breathing, fatigue, headache, body aches, loss of taste, loss of smell nausea, or vomiting. Coronavirus spread is considered to occur mainly via saliva droplets or the nasal discharge from an infected person. It belongs to a large family of viruses with a wide variety of severities. Whenever a country suffers from such an infectious and deadly virus, as is the case with the Coronavirus, the entire world is affected, and everybody must bear the effects. Therefore, sharing national data concerning this virus becomes important.
The Internet of Things (IoT) is capable of introducing a variety of conceivable outcomes in chronic care management with its capabilities. The information regarding the corona positive patients is collected through IoT framework, eliminating the need for manual data collection and at the same time maintaining social distancing. Associated with the health information network, a customer's wearable IoT device can ceaselessly screen and continuously provide health suggestions to the patient. The IoT is a system of interconnected frameworks and advanced data analytics, Artificial Intelligence (AI), and omnipresent networks, that is capable of providing an early warning and detection framework to control the spread of infectious diseases. Allamand et al. [2] proposed an IoT technique to share national data securely by making neighboring countries aware of the spread of the disease. Song et al. [3] likewise proposed a novel technique using IoT and AI that can serve patients with minimal contact, including long-distance communication and medical assistance in hospitals. Thus, social distancing is maintained. At the time of an infectious disease outbreak, the main focus of attention must be on implementing measures to stop the spread of the disease. Zhu et al. [4] reported a highly cost-effective technique using IoT and the polymerized chain reaction of deoxyribonucleic acid to control the spread of the disease. The data collected using technique could be easily transferred to a global virus network using the Android Bluetooth transfer system. According to reports of various disease control organizations, an early-stage warning system can be established with IoT, AI, and data analytics to stop the spread of infectious diseases.
Facial recognition technologies can be helpful in monitoring, tracking, and tracing infected people. Although it is not possible to set up global level surveillance, in a country like China, an existing system of Closed-Circuit Tele Vision (CCTV) cameras could be leveraged to build a video surveillance in the entire country. To fight such a deadly virus, the first war is to stop or control its spread. Currently, it is challenging and almost impossible to manually trace back the contacts of an infected person. Nonetheless, the IoT proves to be favorable for this task. Another measure that can be established to control the disease spread is the setup of massive thermal scanning in public spaces. As it is not possible nor feasible to manually maintain and manage the thermal data of every person, IoT and thermal scanners can be used to scan and collect data of people in a group of at least 8–10 people at a time. Along with the thermal scanning techniques, CCTV video surveillance can be set up in the entire environment to capture contacts in the case of an infected person. During this pandemic, maintaining social distance is the highest priority to save lives. Hence, it is challenging for health service people to monitor the movement and behavior of the COVID-19 patients.
In this study, we propose an intelligent health monitoring system to detect COVID-19 positive cases through IoT devices. A data set of COVID-19 from the World Health Organization (WHO) is analyzed to validate the system and understand how the Coronavirus spreads in different parts of the world, as well as the rate of increase of COVID-19 positive cases. Fuzzy inference is deployed based on MISO to form fuzzy rules, and the fuzzy inference is applied to implement a decision-making system using these rules. Statistical analysis was performed on the existing dataset to create a pilot survey to normalize the data. The proposed model is deployed in an Internet of Medical Things (IoMT) environment, known as healthcare IoT. The Arduino UNO board, temperature sensor named LM35, and SIM 900 embedded circuit were used to implement the proposed model. Finally, the performance of the proposed model was evaluated and compared with that of the existing model.
The remainder of this paper is organized as follows. Relevant studies are described in Section 2. Section 3 presents a hybrid intelligent IoMT could-based system for monitoring COVID-19 along with the proposed model and algorithms. The data preparation is discussed in Section 4 followed by fuzzy rules exploration in Section 5. The results and simulations are presented in Section 6, followed by the discussion in Section 7. Finally, Section 8 presents the conclusion and directions for future research.
COVID-19 is a family of Coronaviruses that cause mild to severe respiratory disease in humans. This family of viruses causes severe acute respiratory syndrome Coronavirus 2 (SARS-COV-2, also known as 2019-nCOV). The first case was reported in Wuhan, China, on December 31st, 2019, by the WHO. On March 11th, 2020, it was declared a global pandemic [5]. The SARS-COV-2 virus is zoonotic, meaning that transmission can occur between animals and humans. It has been observed that among this family of viruses (COVID-19), there are some found in animals that have not yet affected the human species [6].
Abir et al. [7] proposed a novel cloud-based model for the identification and treatment of COVID-19 patients. The questionnaire-based online communication is maintained through the page selection key. After receiving and analyzing the answers, the results are stored into three categories, namely, confirmed, suspected, or suspicious. After this confirmation, guidance for the respective users’ treatment is established with experts and doctors at the front line. This helps to block the transmission of the disease and has a better impact on its treatment.
Dewey et al. [8] provided practical recommendations to support the clinician workforce during the pandemic. Whenever any medical equipment is considered, it must be considered both logistically and with regard to the medical personnel. Currently, sensors and devices are limited in their scalability factors. The use of Radio Frequency Identification (RFID) proposes a reasonable solution to both problems through cheap tag designs, allowing real-time monitoring of medical equipment and presenting itself as a new means of design diagnosis in patients [9]. The ongoing COVID-19 pandemic has not only affected people's physical health but also their mental health on a vast scale. The information and statistics presented by the media have created large-scale anxiety in people's day-to-day lives. Roy et al. [10] conducted a survey and recorded the participants’ mental health based on their responses. In this survey, people's awareness about the coronavirus and actions were also studied. The study showed that many people are aware and taking precautions regarding the disease, and a significant percentage declared their anxiety levels through several symptoms, such as sleeplessness and social media paranoia. Thus, it is essential to carefully consider the mental health of individuals in this scenario.
Since the start of the Coronavirus's spread, significant confusion and panic were generated regarding the treatment of the disease. Gupta et al. [11] presented research on chloroquine and hydroxychloroquine for COVID-19 patients. An analysis was presented on using inhibitors of the renin-angiotensin system, unusual symptoms such as gastronomical issues, and cardiac enzyme functionalities which are not symptoms of a normal patients. COVID-19 patients are identified by the analysis of the unusual symptoms. It was also observed and verified that diabetic patients are at a high risk of influenza and pneumonia. The same effect was noted in patients with heart and kidney disease. Research based on the relationship between COVID-19 and diabetes has been published, suggesting several critical and meticulous ways of treating COVID-19 patients with the existing disease [12]. Dhiman et al. [13] proposed a fuzzy inference framework to analyze the COVID-19 condition by considering six information factors: ethanol, atmospheric temperature (AT), body temperature (BT), breath shortness (BS), cough, and cold. The yield factor was partitioned into three linguistic classes that indicate the severity level of the infected patients. Al-Qaness et al. [14] proposed an Improved Versatile Neuro-Fuzzy Inference System (ANFIS) model utilizing an upgraded flower pollination algorithm (FPA) by using the SalpSwarm Algorithm (SSA). As a rule, SSA is used to improve the FPA to avert its downsides (i.e., getting caught at the nearby optima). The primary aim of the proposed model, called FPASSA-ANFIS, is to improve the exhibition of ANFIS by determining the boundaries of ANFIS utilizing FPASSA. With the outburst of COVID-19, there are several approaches of handling and improving the quality of the treatment to reduce the risk in patients with Coronavirus disease. Singh et al. [15] proposed 12 possible IoT applications that could be used in different ways to identify COVID-19 patients and enhance their treatment rapidly with minimal human contact and minimal human error. Tang et al. [16] proposed an availability performance improving (API) method for the Healthcare Internet of Things (IoT) System that can help patients or users in this field. Markov state-space models are used for the modelling and performance evaluation of the whole IoT enabled system model. The implementation of the API technique enhances the service availability.
A review article on the Internet of Things (IoT) empowered healthcare service providers to undertake the challenges of COVID 19 epidemic. Doctors can easily detect various parameters of COVID 19 and other parameters such as asthma, diabetes, and arthritis using the IoT-based system, leading to a decrease in the risk associated with the patient's health condition [17]. Pradhan et al. [18] reviewed healthcare applications of IoT (HIoT). The HIoT framework and applications are explained and show how remote medical services can be provided with the help of devices and sensors using HIoT techniques. The advantages and limitations of HIoT were also discussed by the researchers.
A review of contact tracing methods and applications were presented by Jahmunah et al. [19] to combat the COVID-19 epidemic. A novel intelligent method was proposed, which may improve contact tracing and the prediction of COVID-19 clusters. The existing limitation of contact tracing is explained, and a solution provided to overcome false predictions of COVID cases. Hegde et al. [20] reviewed the different smart healthcare monitoring technologies. Chronic diseases affect the day-to-day lives of people, and proper monitoring of their daily health data can be used to prevent health hazards. The health-related information can be collected from patients using various sensors and can be stored for further analysis. The stored information can be sent to the doctor for consultation purposes. Since COVID-19 was identified, research indicated that people with diabetes and heart disease and those that are suffering from mental disorders are also very prone to the coronavirus, and their treatment must be carefully addressed [21].
3 Hybrid Intelligent IoMT Cloud-Based System for COVID-19 Monitoring
The COVID-19 pandemic has become a hotspot in clinical research. Novel developments can be a panacea for this global emergency. For the IoTs and IoMTs in particular, the sky is the limit when it comes to addressing the difficulties of recognition, observation, contact following, and control of this ailment. As an all-encompassing, healthcare-specific, explicit form of the IoT [22], IoMT alludes to the interconnectedness of clinical hardware, programming applications, and information related to the medicinal services industry. It could be utilized to construct a clinical stage to help patients obtain appropriate healthcare services at home and build up a complete disease management database for government and healthcare providers. The accompanying areas include diverse novel utilizations of IoMT to counter the continuous COVID-19 health emergency. Individuals with mild symptoms can receive demonstrative and healthcare equipment. They can upload data of their health status routinely to the IoMT cloud platform through the web, and their data can be moved to the nearest clinics, the Center for Disease Control (CDC), and state and nearby health authorities. Hence, medical clinics could offer online health consultations for every patient's health condition, and governments could allot equipment and crucial isolation stations.
Mohammed et al. [23] proposed a research model to identify Coronavirus patients with minimal human interactions using smart glasses based on IoT technology. This technology can be used to trace back infected users, as it is also capable of facial recognition and storing data. The information captured through this device can add information about the visiting location through Google Location History (GLH) to provide accurate and trustworthy data. Utilizing the IoMT platform, individuals can monitor their disease status and obtain legitimate clinical requirements without spreading the infection to other people. Such technology would diminish the cost of national healthcare, relieve the stresses of clinical device deficiency, and provide a proper database that permits the government to promptly monitor the spread of disease, adequately disseminate supplies, and execute emergency strategies.
As we gradually move towards normalcy, it is essential to identify people in large gatherings with visible coronavirus symptoms, such as high body temperature, to halt the spread of the disease. Thermal body temperature scanning is widely used in public places such as restaurants, markets, offices, institutions and malls. However, on an ongoing basis, this approach is not sufficient. Utilizing an IoMT-based platform is a more effective alternative. The IoMT framework comprises clinical devices and applications interconnected by the Internet, measuring the temperature, carbon dioxide, Electrocardiography/Electroencephalogram/Electromyography (ECG/EEG/EMG), pressure, gyrator, blood oxygen immersion, moistness, breath, and circulatory strain. All of these empower the perception and monitoring of the patients’ wellbeing. In this study, an IoMT-based health monitoring system was developed with Arduino UNO [24,25] and SIM 900. The proposed model is illustrated in Fig. 1.

Figure 1: Smart monitoring system for COVID-19 patients
In Fig. 1, the temperature sensor Linear Monolithic (LM35), CC camera, and different sensors are interfaced with the Arduino UNO board. The temperature sensor (LM35) is used to continuously measure the patients’ temperature. SIM 900, a Global System for the Mobile Communications (GSM) module, is interfaced to transmit data from Arduino to the cloud platform and the data are stored in the data center for further analysis. An intelligent model is deployed within the cloud to analyze the data and produce an expert Arduino, which aids doctors and health providers. The utilization of IoMT brings significant changes to the analytical-based health care industry. It offers a remote monitoring facility for patients with chronic diseases. IoMT is associated with data transmission to online analytic dashboards and medical clinic beds with sensors to measure the patients’ acute symptoms.
3.1.1 Thematic Treatment for COVID-19 Patients
To detect COVID-19 positivity, the existing COVID-19 dataset must be analyzed. The dataset for COVID-19 is a linear pattern model, such that statistical inference [26] based on linear models is used for expectation and structures specifications of the dataset's variances and covariance. The least square (LS) method [27] is applied to estimate the parameters in a linear model. To optimally estimate unknown parameters, the LS method is used from a broad class of possible estimates. The estimation process is done under unusual assumptions for process modeling. LS makes efficient use of data, such that the desired result can be obtained. In this research, the dataset is has a small volume, hence LS is an efficient method for use with this data set.
As a typical application of sequential analysis, a pilot survey is conducted to efficiently collect preliminary information to plan an extensive study of COVID-19 positive cases. The sequential analysis consists of two state sampling plans. We assume that the sample size is C, where C1 and C2 are the lower limit and upper limit of the sample, respectively. A random entity
If
If
If
If the total number of COVID-19 positive cases r in both samples is less than C, then the lot is accepted, otherwise it is rejected.
This decision-making problem is based on the results of different disjoint observations. To enhance the optimized decision between the two samples, a sequential analysis is performed. Let
Assume that D is a sample space of the terminal final decision d, and the condition for the termination rule r, where r is an independent random variable of the “future”.
Let
The Markovian time is considered, and in this Markovian period, the event
The Bayesian approach [28] is applied based on the assumption of a random variable parameter
To solve Eq. (4), some conditions are defined as follows.
If
3.1.2 Fuzzy Rules Implementation
Fuzzy logic [29] is applied to control the uncertainty of symptoms and predict COVID-19 positive cases. Assume that set S represents all positive symptom cases. Any case x either belongs to S or does not. The membership
where,
If x does not belong to S, then it belongs to the inverse set
To render the proposed model more efficient, more than one dataset is considered for validation, and two different fuzzy sets
where n is the number of input variables and the jth rule is implemented in Eq. (7).
The total implementation ITotal of N is expressed as shown in Eq. (8).
where R is a fuzzy relation on
The proposed model comprises two parts, as shown in Fig. 1. The first part implements the Arduino UNO interfaced with the SIM 900 (GSM module) and different sensors. The second part implements the intelligent model for an expert system deployed on a cloud platform. The hardware component is implemented in the laboratory, where different light-emitting diode (LED) indicators blink based on various output. The intelligent model, on the other hand, is designed using statistical and fuzzy inference techniques [31], and the proposed algorithm is shown as follows:
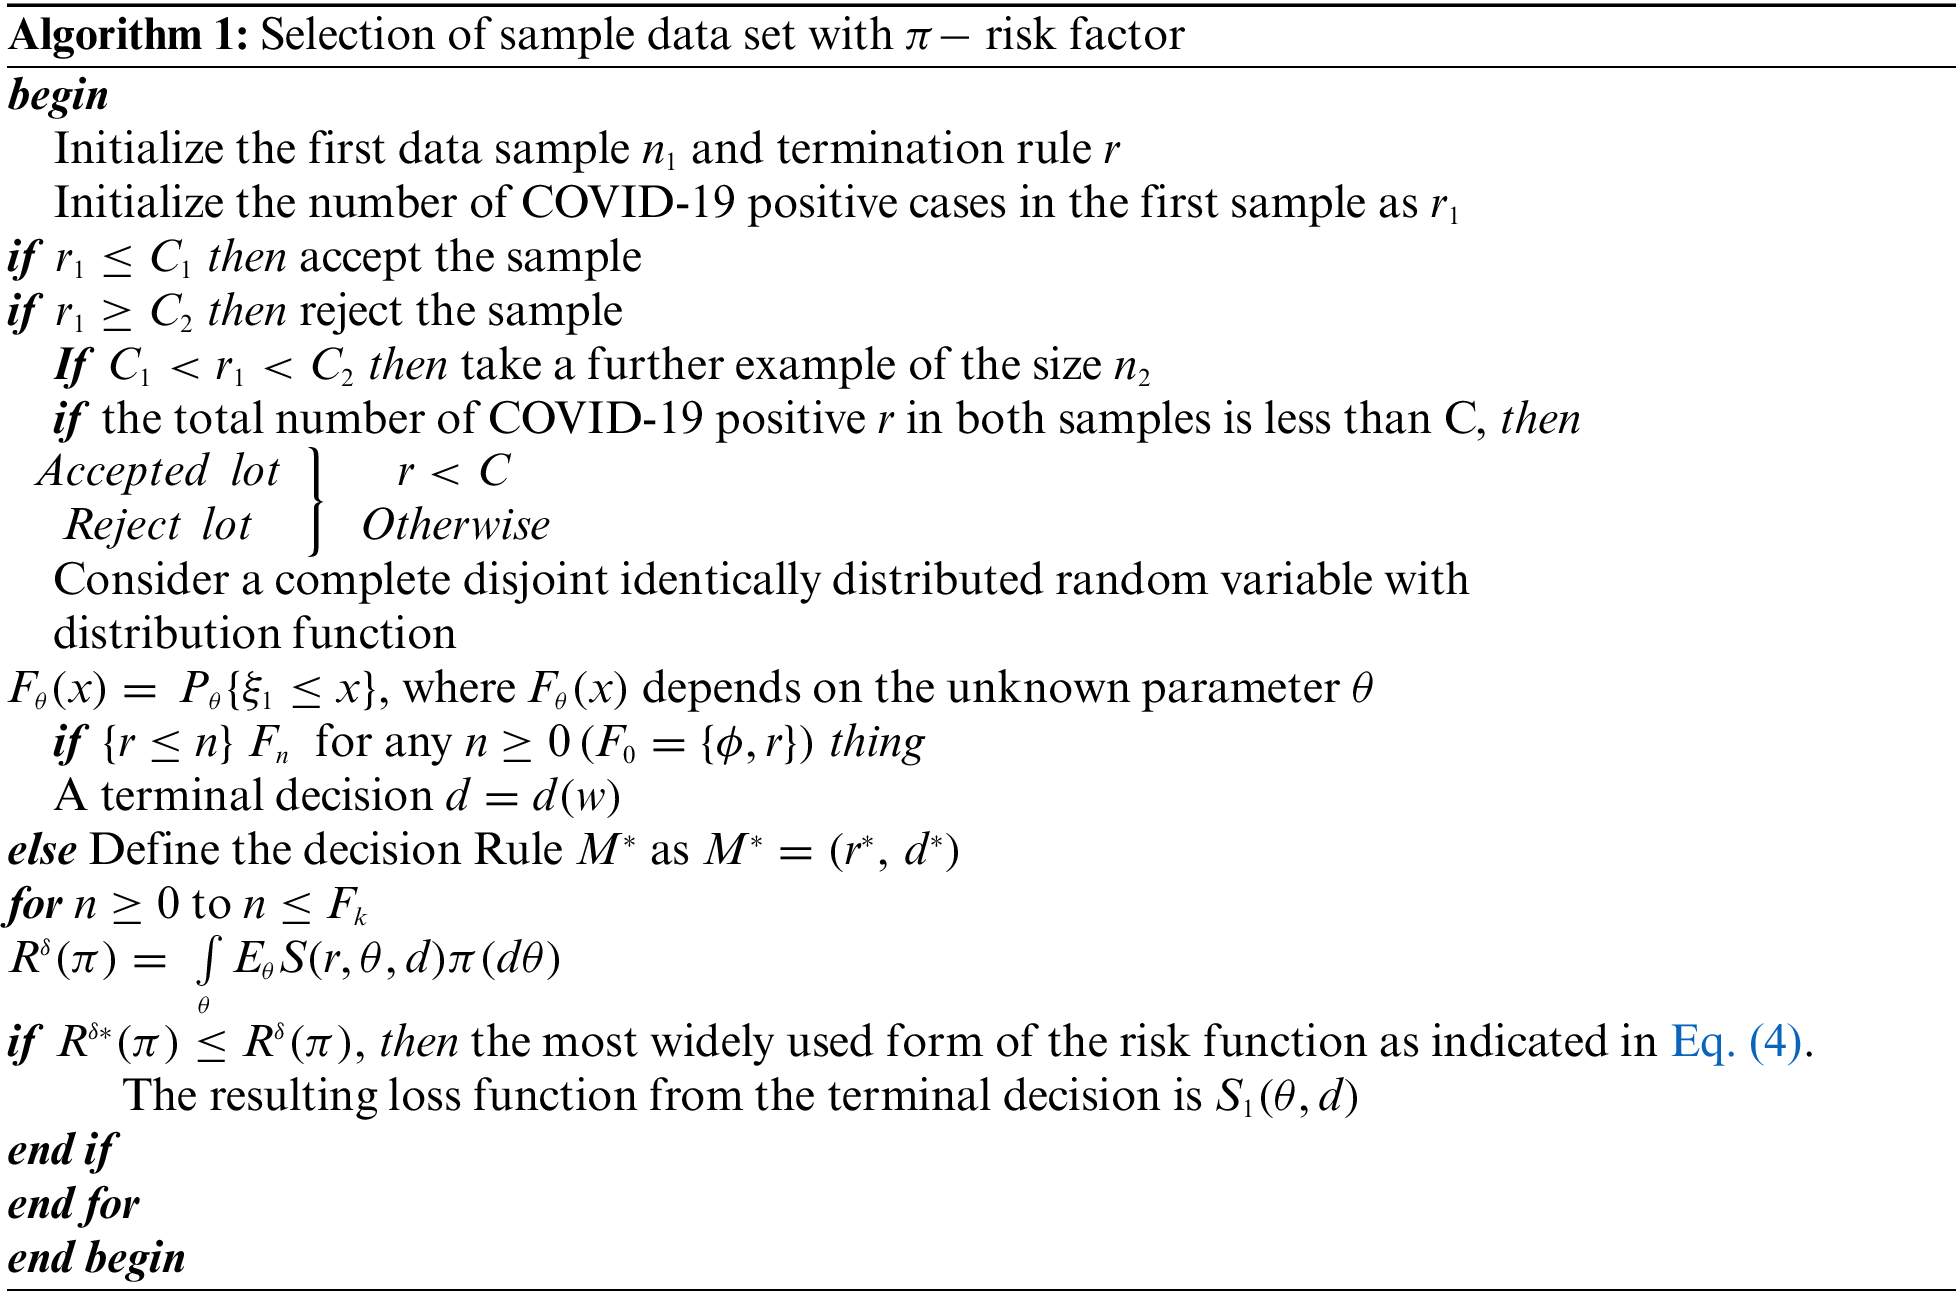
Algorithm 1 describes the selection of the dataset with
Nineteen individual data records were collected on June 10th, 2020 from a real dataset from the WHO's official website [32] and Kaggle [33]. Each record contains two attributes: the number of confirmed cases and the number of deaths during 7 days. Each record includes the same details for three different regions: India, Southeast Asia, and the world. Tab. 1 shows data from only 15 weeks from 28th February to 7th June 2020. The dataset was prepared according to the requirements of the proposed methodology. The modified dataset is presented in Tab. 1.
The data in Tab. 1a covers the period from February 28th, 2020, to September 1st, 2020. Tabs. 1a and 1b show the report of COVID-19 cases in India and the world. Tab. 1b is also derived from the WHO data collected from January 29th, 2020, to July 23rd, 2021. In Tab. 1b, the case fatality ratio (CFR %) is shown [34]. Before applying the proposed logic, Figs. 2 and 3 are plotted based on the datasets from India and Kuwait, respectively.
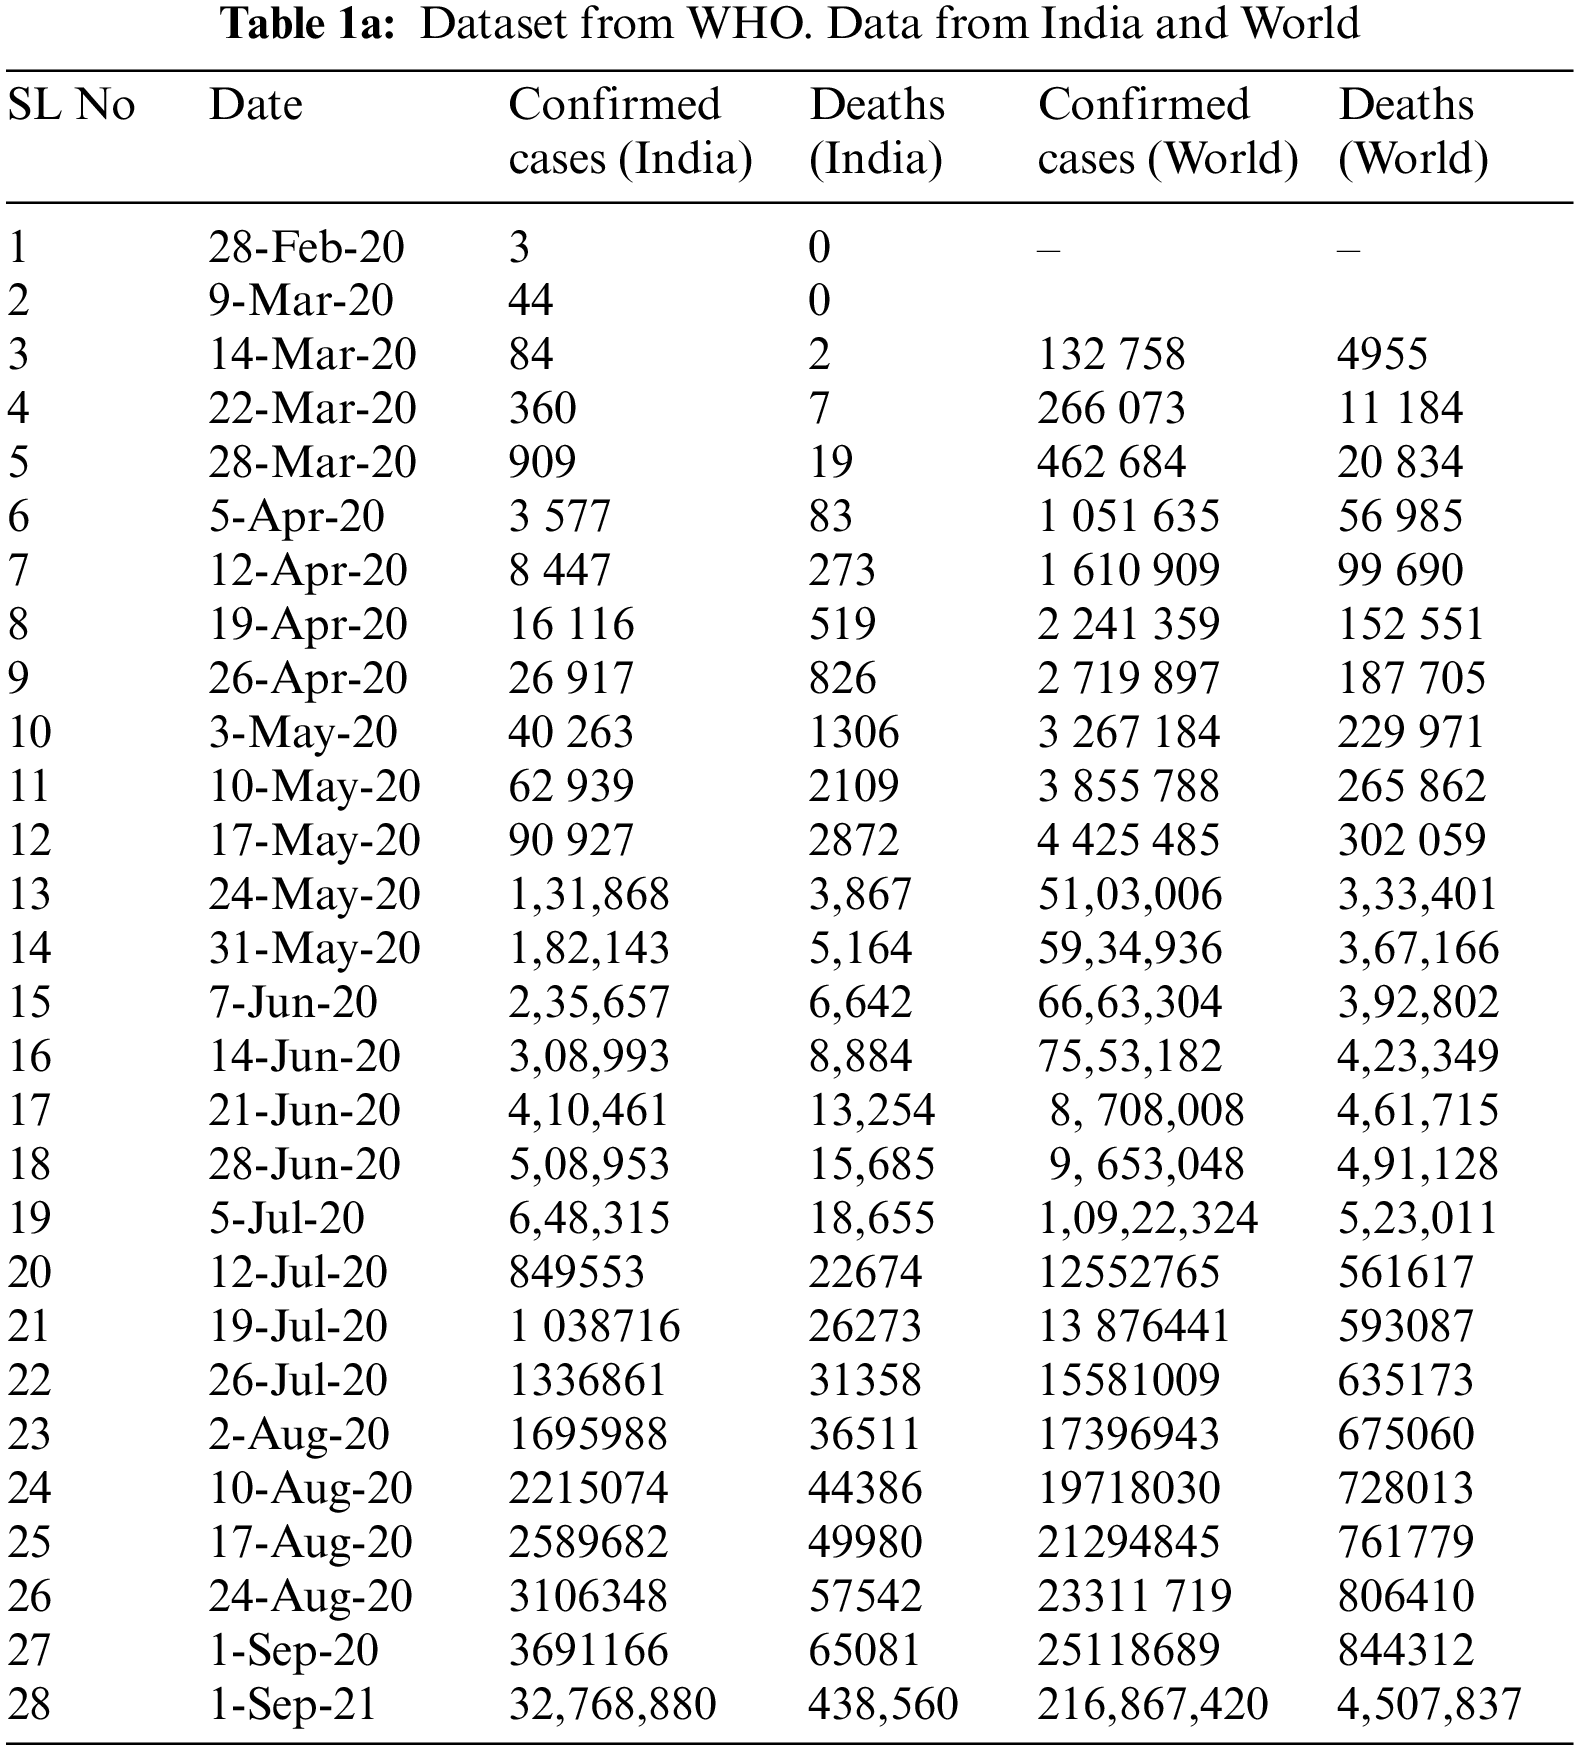
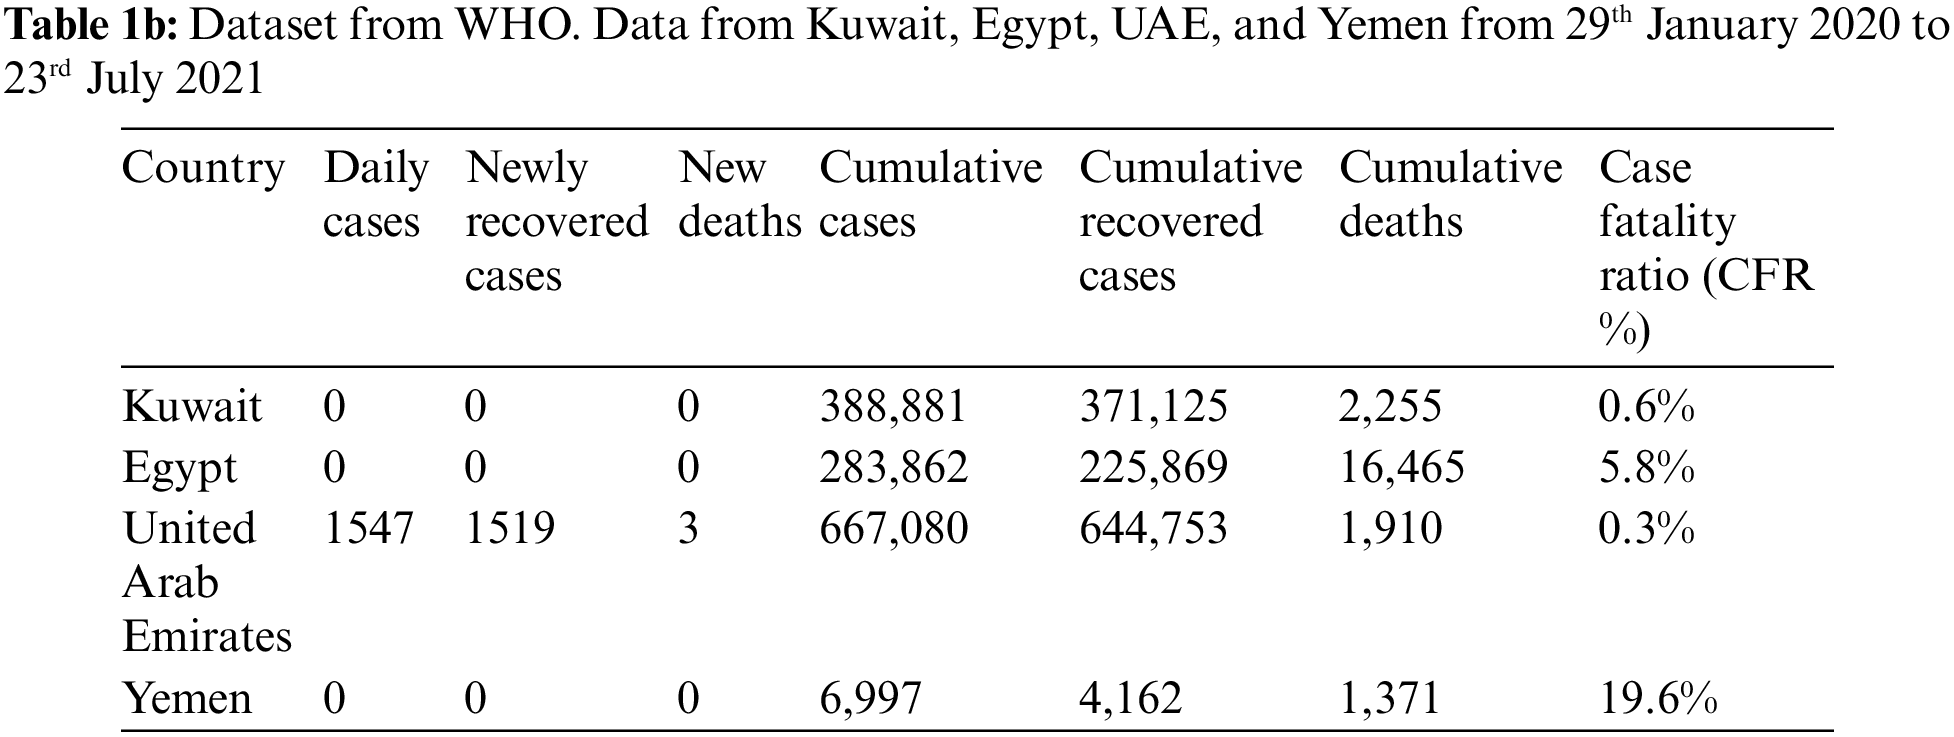
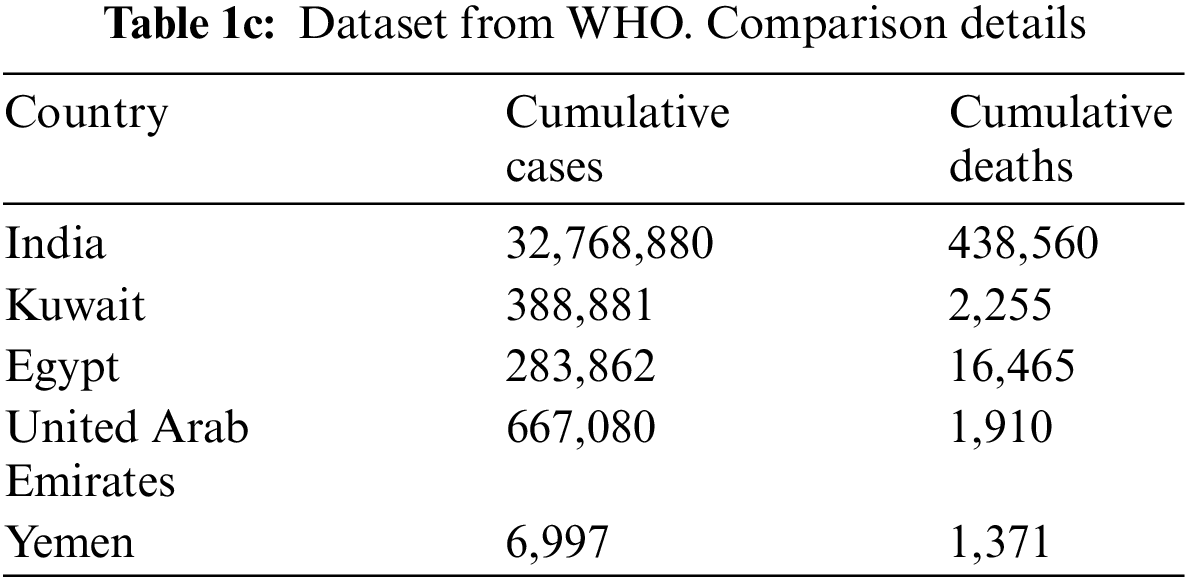
Figs. 2 and 3 show that the death rate is very low compared to the respective confirmed cases. The rates of confirmed cases and deaths exhibit a continuous pattern. Tabs. 1a and 1b show confirmed cases and deaths in various countries including India, Kuwait, Egypt, United Arab Emirates, and Yemen. In Tabs. 1a and 1b, a comparison is drawn among these countries. Tab. 1c is derived from Tabs. 1a and 1b.

Figure 2: COVID-19 cases in India from 28 February 2020 to 28 August 2020 shows the number of confirmed cases and death cases

Figure 3: COVID-19 dataset for confirmed cases and death cases from Kuwait [34]
The comparison of the cumulative cases and cumulative deaths is visualized in Fig. 4.

Figure 4: Confirmed cases and deaths
Fig. 4 shows the ratio of cumulative deaths with respect to cumulative confirmed cases in five different countries. In Fig 4, X axis denotes the various countries and Y axis denotes the number of cumulative cases and cumulative deaths. The death rate is significantly lower than the number of cumulative cases for all. Among of these five countries, the number of cumulative cases for India is the highest. Tab. 2 reveals that the recovery rate for COVID-19 depends on the age of the patients and it plays an important role on the death cases. The recovery rate is high for the young aged patients. The impact of the age group on the death rate is also shown in Tab. 2.

The ages were categorized into nine groups. Tab. 2 shows that the highest recovery rate is attributed to ages between 20–29 (Group 3). It is difficult to identify COVID-19 positive cases each time due to the variability in the symptoms. The primary symptoms are presented in Tab. 3. Based on the severity of these symptoms, they are considered to be mild, moderate, and severe. All symptom parameters have a standard maximum and minimum weight value such as a fixed threshold value. In this study, a threshold value was assigned for each symptom, as shown in Tab. 3.

Based on the threshold value in Tab. 3, a set of fuzzy rules were constructed to implement the fuzzy inference model.
To implement the smart healthcare monitoring system, ten fuzzy rules are proposed, based on the threshold values listed in Tab. 3. In this study, ten basic rules are derived based on COVID-19 positive symptoms.
Fuzzy Rules
Rule 1: IF “Fever” > 100.4 AND “Dry cough” > 0.2
THEN COVID‐19 is Positive
Rule 2: IF “Fever” > 100.4 AND “Chest pain” OR “Pressure” > 0.54
THEN COVID‐19 is Positive
Rule 3: IF “Loss of smell” < 0.75 AND “Fatigue” > 0.14
THEN COVID‐19 is Negative
Rule 4: IF “Vomiting and Diarrhea” > 0.37 OR “Loss of smell” > 0.75
THEN COVID‐19 is Positive
Rule 5: IF “Loss of smell” > 0.75 OR “Dry Cough” > 0.25
THEN COVID‐19 is Positive
Rule 6: IF “Fever < 100.4 OR “Vomiting and Diarrhea” < 0.37
THEN COVID‐19 is Negative
Rule 7: IF “Chest pain” < 0.54 OR “Dry Cough” > 0.25
THEN COVID‐19 is Negative
Rule 8: IF “Fatigue” > 0.14 OR “Chest Pain” > 0.54
THEN COVID‐19 is Positive
Rule 9: IF “ Fever” > 100.4 OR “Loss of Smell” >0.75
THEN COVID‐19 is Positive
Rule 10: IF “Vomiting and Diarrhea” > 0.37 OR “Fatigue” > 0.14
THEN COVID‐19 is Positive
The proposed working model, which is implemented using Arduino UNO With LM35, is validated with the dataset. It takes temperature as an input. The experimental output for two different cases are shown in Figs. 5 and 6.

Figure 5: Circuit diagram of arduino interfaced with temperature sensor LM35 (36.66°C)
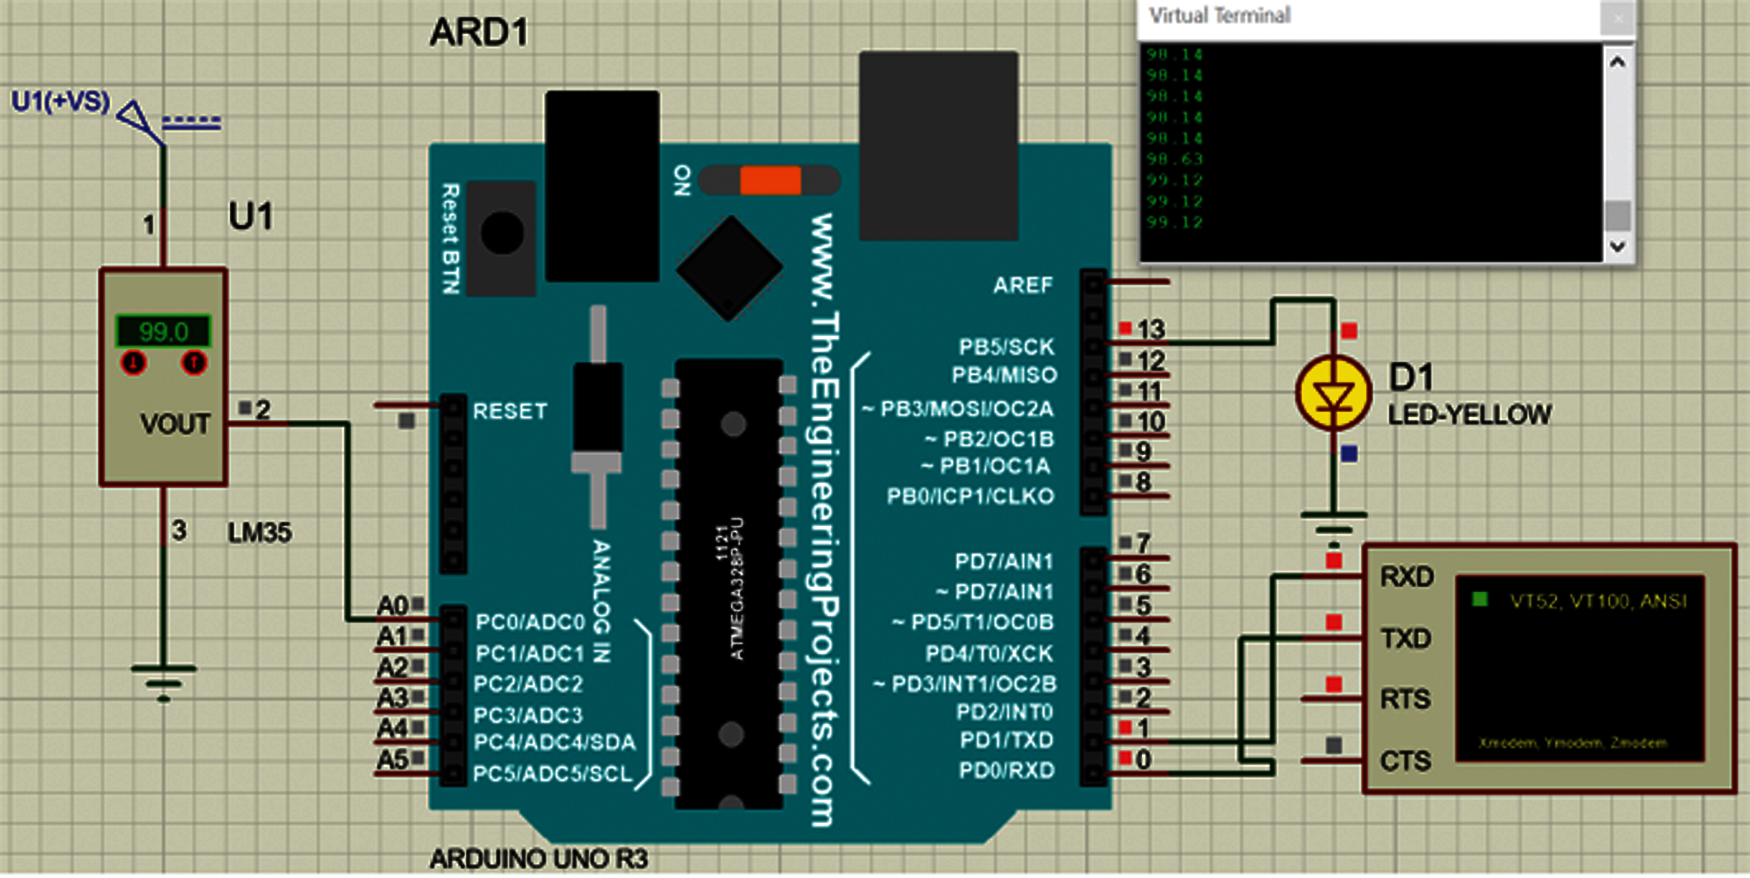
Figure 6: Circuit diagram of arduino interfaced with temperature sensor LM35 (Temp > 36.66°C)
The LM35 temperature sensor with 5 V is attached to Arduino to collect the patient's temperature, as shown in Fig. 5. The code is written in such a manner that if the human body temperature increases above the given threshold, i.e., above the average human body temperature of 36.66°C, then the D1 LED (Yellow) glows, notifying that the temperature is rising, as shown in Fig. 6.
The topology for the data transfer in an IoMT environment is shown in Fig. 7. Here, three nodes are offered. Among them, two are wired nodes, and one is a wireless node. The wired nodes are connected via a router; the wireless node is connected to the wireless access point, and the router is connected to the wireless access point.

Figure 7: Topology for data transfer in the IoMT environment
The link throughput for a constant bit rate is shown in Fig. 8. The link throughput is consistent after a fraction of a second of data transmission. The CBR throughput is 0.583 Mbps.

Figure 8: Link throughput graph for constant bit rate (CBR) data
The link throughput for the database type data is shown in Fig. 9. It is not constant and reached 0.077 Mbps.
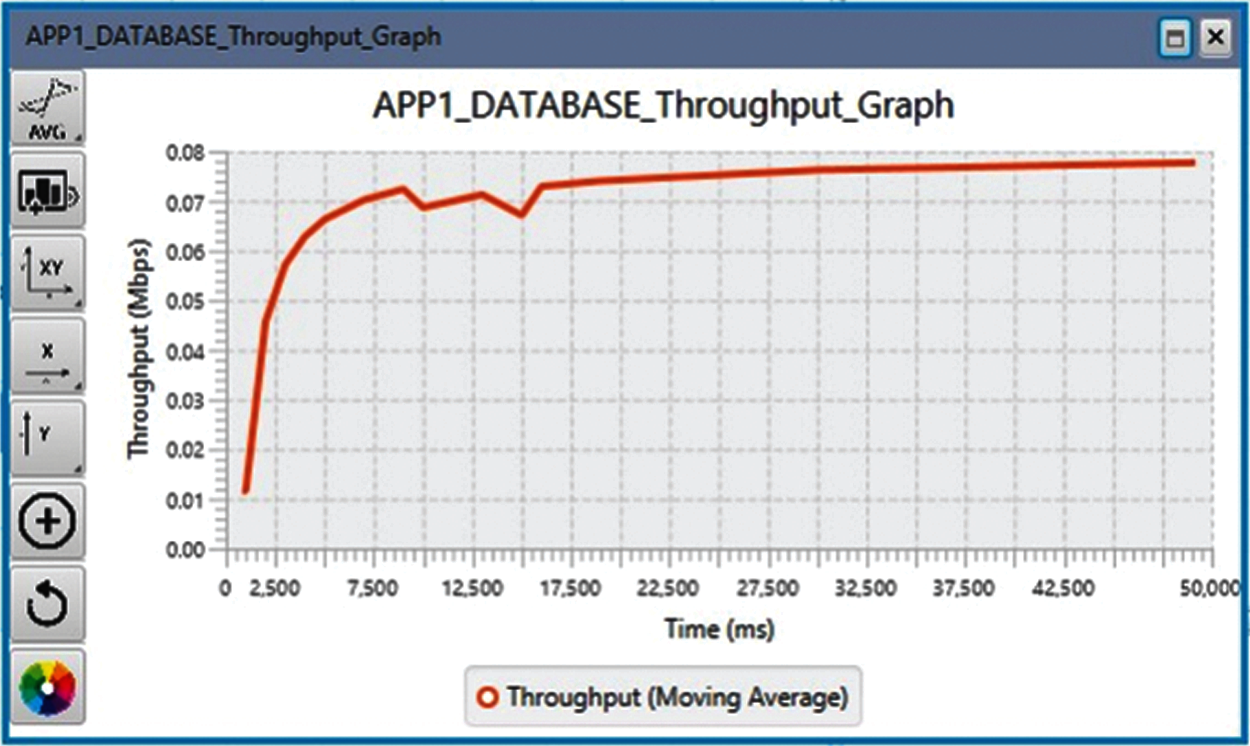
Figure 9: Link throughput graph for database type data
Fig. 10 shows the simulation results using the data in Tab. 2. The simulation results show that the rate of recovery for those affected depends on the age of the patient, such that the quality of treatment is the highest at age group 3 (ages 20 to 29), and the Coronavirus infection consequences do not lead to death. The recovery rate is higher than the rate of death. The variation in the number of deaths and recovered cases is shown in Fig. 11.

Figure 10: Rate of cure cases based on the age of the patients

Figure 11: Variation of confirmed and recovered cases, and deaths
The population density is among the most critical causes of death in the Coronavirus pandemic. The population density of all 32 states in India was considered in this study. The density unit is persons per square kilometer. In Fig. 12, the x-axis denotes 35 different provinces in India. At this point, X = 20 indicates the province of Maharashtra (365/km2 or 950/sq mi), where the population density is 929, and the number of deaths is 20265, which is the highest number in India. The proposed model is validated using this dataset.

Figure 12: Number of deaths is dependent on population density
In this study, a smart monitoring system is explored to detect COVID-19 positive cases as the first testing level. Due to the insufficient number of laboratories for testing COVID-19, large number of suspected patients, and shortage of quarantine rooms, a model is proposed for monitoring suspected patients during their home quarantine. The Arduino Uno enables the smart monitoring model to identify COVID-19 positive patients based on primary symptoms. The model is validated by a real dataset before deployment. The proposed model is based on an intelligent algorithm and makes decisions based on fuzzy rules that are set, and their corresponding threshold values are also fixed. The proposed model is not able to determine Pressure Injury (Pi) risk factors which is a multifactorial phenomenon for the patients in critical condition. The Pi risk factor is calculated based on the previous Pi factor of the patients. Pi includes the humoral immune defect in congenital for the patients in their critical condition. For patients in critically ill condition, true risk is both pervasive or elusive. This analysis is required to examine the risk factors associated with the adult patients with critical condition. The proposed model is designed for the detection of COVID-19 patients based on their current symptoms, and not their previous Pi risk factors. The performance of the model is also determined, and the error is minimized at every iteration.
The performance of the proposed model is analyzed based on different parameters of the confusion matrix [35]. A four-fold cross-validation [36] is performed based on the given data set. Because the dataset is not balanced, error correction is required to enhance the accuracy of the model. The proposed model is deployed as a monitoring system in health care, and recall and precision are critical indices for performance measurement. The performance metrics are listed in Tab. 4 using four different strategies, showing the ratios of the training and testing data and values for the accuracy, recall, and precision for different adopted training and testing strategies. The means of these four strategies determine the considerable value of the performance metrics. The average rate of the performance metrics is shown in Fig. 13.
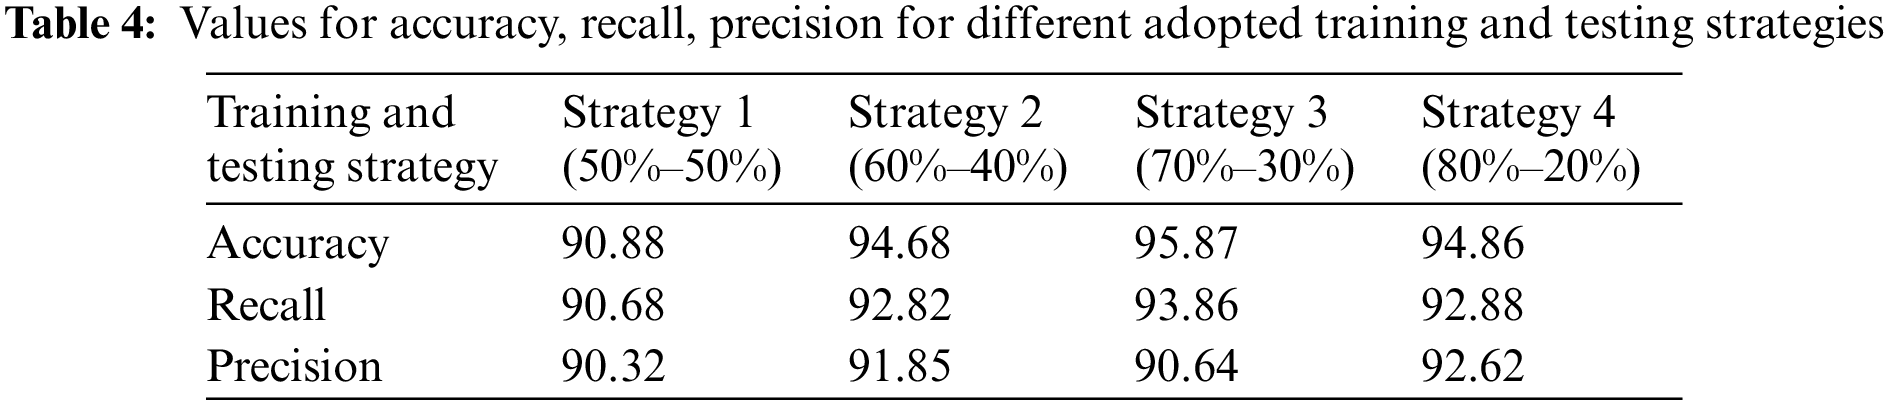

Figure 13: Performance metrics for proposed model
Because the symptoms of COVID-19 positive cases are not firmly established each time, suggesting an approach for combating the Coronavirus is a challenge for the researchers involved in this area. In the year 2020, different approaches were developed to diagnosis COVID-19 patients and combat against COVID-19. In this section, an analytical comparison is drawn between the proposed methodology and two other existing methods. Tab. 5 presents two approaches, along with their limitations.

8 Conclusion and Future Studies
The rapid spread of the coronavirus continues to fuel the infection rate of COVID-19. The WHO declared a worldwide health emergency. Health ministries around the world have taken initiative regarding this issue and provided standard updates to keep the coronavirus from spreading further. However, due to insufficient medical test facilities and quarantine rooms, governments around the world must act further to properly monitor the movement and behaviour of COVID-19 positive patients. This study proposes a smart monitoring system to detect COVID-19 patients at the first level of testing and monitor them during their home quarantine period. The symptoms of the patients are collected by the smart monitoring model with the help of various electronic devices. A camera, LM35 sensor, and humidity sensor are used to measure the temperature, carbon dioxide, and Electrocardiography/Electroencephalogram/Electromyography of the patients. The data is sent to the cloud by the IoT with SIM 900 GSM module for analysis. A statistical analysis is performed on the collected dataset, and Fuzzy inference is applied to make decisions based on the primary symptoms of patients. The proposed model is validated with a real data set from the WHO and Kaggle. The performance of the proposed model is determined by applying a four-fold cross-validation system. The overall recall and precision of the proposed model are 92% and 91%, respectively. Improving the performance of the proposed model and enhancing the link throughput of data transmission will be considered as future research directions. The model proposed in this paper can be modified to accommodate both variants of COVID-19 or any virus within the COVID family.
Funding Statement: The authors received no specific funding for this study.
Conflicts of Interest: The authors declare that they have no conflicts of interest to report regarding the present study.
1. COVID-19_pandemic. 2020. [Online]. Available: https://en.wikipedia.org/wiki/ (accessed on September 1st, 2020). [Google Scholar]
2. Z. Allamand and D. S. Jones, “On the coronavirus (COVID-19) outbreak and the smart city network: Universal data sharing standards coupled with artificial intelligence (AI) to benefit urban health monitoring and management,” Healthcare, vol. 8, no. 1, pp. 1–9, 2020. [Google Scholar]
3. Y. Song, J. Jiang, X. Wang, D. Yang and C. Bai, “Prospect and application of internet of things technology for prevention of SARIs,” Clinical EHealth, vol. 3, pp. 1–4, 2020. [Google Scholar]
4. M. Nasajpour, S. Pouriyeh, R. M. Parizi, M. Dorodchi, M. Valero et al., “Internet of things for current COVID-19 and future pandemics: An exploratory study,” Journal of Healthcare Informatics Research, vol. 4, no. 4, pp. 325–364, 2020. [Google Scholar]
5. D. J. Cennimi and M. S. Bronze, Coronavirus Disease 2019 (COVID-192021. Available: https://emedicine.medscape.com/article/2500114-overview#a1 (accessed on May 17th, 2020). [Google Scholar]
6. About COVID-19, World Health Organization (WHO). 2020. [Online]. Available: http://www.emro.who.int/health-topics/corona-virus/about-covid-19.html (accessed on May 17th, 2020). [Google Scholar]
7. S. M. A. A. Abir, S. Naz Islam, A. Anwar, A. Naser Mahmood and A. M. T. Oo, “Building resilience against COVID-19 pandemic using artificial intelligence, machine learning, and IoT: A survey of recent progress,” IoT, vol. 1, no. 2, pp. 506–528, 2020. [Google Scholar]
8. C. Dewey, S. Hingle, E. Goelzand and M. Linzer, “Supporting clinicians during the COVID-19 pandemic,” Annals of Internal Medicine, vol. 172, no. 1, pp. 752–753, 2020. [Google Scholar]
9. A. J. Healey, P. Fathiand and N. C. Karmakar, “RFID sensors in medical applications,” IEEE Journal of Radio Frequency Identification, vol. 4, no. 3, pp. 212–221, 2020. [Google Scholar]
10. D. Roy, S. Tripathy, S. Kumar Kar, N. Sharma, S. Kumar Verma et al., “Study of knowledge, attitude, anxiety & perceived mental healthcare need in Indian population during COVID-19 pandemic,” Asian Journal of Psychiatry, vol. 51, pp. 1–7, 2020. [Google Scholar]
11. R. Gupta and A. Misra, “Contentious issues and evolving concepts in the clinical presentation and management of patients with COVID-19 infection with reference to use of therapeutic and other drugs used in Co-morbid diseases (Hypertension, diabetes etc),” Diabetes & Metabolic Syndrome: Clinical Research & Reviews, vol. 14, no. 3, pp. 251–254, 2020. [Google Scholar]
12. R. Gupta, A. Ghosh, A. Kumar Singh and A. Misra, “Considerations for patients with diabetes in times of COVID-19 epidemic,” Diabetes & Metabolic Syndrome: Clinical Research & Reviews, vol. 14, no. 3, pp. 211–212, 2020. [Google Scholar]
13. N. Dhiman and M. K. Sharma, “Fuzzy logic inference system for identification and prevention of coronavirus (COVID-19),” International Journal of Innovative Technology and Exploring Engineering, vol. 9, no. 6, pp. 1575–1580, 2020. [Google Scholar]
14. M. A. A. Al-Qaness, A. A. Ewees, H. Fan and M. Abd El-Aziz, “Optimization method for forecasting confirmed cases of COVID-19 in China,” Journal of Clinical Medicine, vol. 9, no. 3, pp. 1–15, 2020. [Google Scholar]
15. R. P. Singh, M. Javaid, A. Haleem and R. Suman, “Internet of things (IoT) applications to fight against COVID-19 pandemic,” Diabetes & Metabolic Syndrome: Clinical Research & Reviews, vol. 14, no. 4, pp. 521–524, 2020. [Google Scholar]
16. S. Tang and Y. Xie, “Availability modeling and performance improving of a healthcare internet of things (IoT) system,” IoT, vol. 2, no. 2, pp. 310–325, 2021. [Google Scholar]
17. M. Javaid and I. H. Khan, “Internet of things (IoT) enabled healthcare helps to take the challenges of COVID-19 pandemic,” Journal of Oral Biology and Craniofacial Research, vol. 11, no. 2, pp. 209–214, 2021. [Google Scholar]
18. B. Pradhan, S. Bhattacharyya and K. Pal, “IoT-based applications in healthcare devices,” Journal of Healthcare Engineering, vol. 2021, no. Special Issue, pp. 1018, 2021. [Google Scholar]
19. V. Jahmunah, V. K. Sudarshan, S. L. Oh, R. Gururajan, R. Gururajan et al., “Future IoT tools for COVID-19 contact tracing and prediction: A review of the state-of-the-science,” International Journal of Imaging Systems and Technology, vol. 31, no. 2, pp. 455–471, 2021. [Google Scholar]
20. R. Hegde, S. Ranjana and C. D. Divya, “Survey on development of smart healthcare monitoring system in IoT environment,” in 5th Int. Conf. on Computing Methodologies and Communication, Erode, India, pp. 395–399, 2021. [Google Scholar]
21. A. Jon Stoessl, K. P. Bhatia and M. Merello, “Movement disorders in the world of COVID-19,” Movement Disorders, vol. 35, no. 5, pp. 709–710, 2020. [Google Scholar]
22. G. I. Joyia, R. M. Liaqat, A. Farooq and S. Rehman, “Internet of medical things (IoMTApplications, benefits and future challenges in healthcare domain, “Journal of Communications, vol. 12, no. 4, pp. 240–247, 2017. [Google Scholar]
23. M. N. Mohammed, N. Aslamiah-Hazairin, H. Syamsudin, S. Al-Zubaidi, A. K. Sairahet et al., “2019 novel coronavirus disease (Covid-19Detection and diagnosis system using IoT based smart glasses,” International Journal of Advanced Science and Technology, vol. 29, no. 7s, pp. 954–960, 2020. [Google Scholar]
24. L. Louis, “Working principle of arduino and using it as a tool for study and research,” International Journal of Control, Automation, Communication and Systems (IJCACS), vol. 1, no. 2, pp. 10–29, 2016. [Google Scholar]
25. M. Prasad, P. Kumar, R. K. Singhand and S. R. Pradhan, “Home automation using microcontroller (Arduino Uno),” International Journal of Engineering Research & Technology (IJERT), vol. 6, no. 3, pp. 383–385, 2017. [Google Scholar]
26. G. Casella and R. Berger, Statistical Inference Duxbury Advanced Series,, 2nd edition. CA: Pacific Grove, 2002. [Google Scholar]
27. H. Abdi, “Least squares,” In: Lewis-Beck, M., Bryman, A., Futing, T., (Eds.Encyclopedia of Social Sciences, Research Methods, Thousand Oaks (CASage, 2003. [Google Scholar]
28. N. Petra, C. G. Petra, Z. Zhang, E. M. Constantinescu and M. Anitescu, “A Bayesian approach for parameter estimation with uncertainty for dynamic power systems,” IEEE Transactions on Power Systems, vol. 32, no. 4, pp. 2735–2743, 2017. [Google Scholar]
29. T. J. Ross, Fuzzy logic with engineering applications, Second edition. United Kingdom: John Wiley & Sons, 2005. [Google Scholar]
30. S. Vijayachitra, A. Tamilarasi and N. Kasthuri, “Multiple input single output (MISO) process optimization using GA based fuzzy clustering,” in Int. Conf. on Education Technology and Computer, Singapore, pp. 17–20, 2009. [Google Scholar]
31. D. Singh, R. Upadhyay, H. Singh Pannu, and D. Leray, “Development of an adaptive neuro fuzzy inference system based vehicular traffic noise prediction mode,” Journal of Ambient Intelligence and Humanized Computing, vol. 12, no. 30, pp. 2685–2701, 2021. [Google Scholar]
32. World Health Organization India, “Novel Coronavirus Disease (COVID-19) Situation Update Report-32,” 2020. [Online] Available: https://cdn.who.int/media/docs/default-source/wrindia/situation-report/india-situation-report-32.pdf?sfvrsn=38d85632_2 (accessed on September 8 2020). [Google Scholar]
33. SRK, “COVID-19 in India---Dataset on novel corona virus disease 2019 in India,” 2019. [Online]. Available: https://www.kaggle.com/sudalairajkumar/covid19-in-india# (accessed on September 6 2020). [Google Scholar]
34. World Health Organization, “Eastern Mediterranean Regional Office COVID-19 Dashboard,” 2021. [Online]. Available: https://app.powerbi.com/view?r=eyJrIjoiN2ExNWI3ZGQtZDk3My00YzE2LWFjYmQtNGMwZjk0OWQ1MjFhIiwidCI6ImY2MTBjMGI3LWJkMjQtNGIzOS04MTBiLTNkYzI4MGFmYjU5MCIsImMiOjh9 (accessed on July 23 2021). [Google Scholar]
35. S. Visa, B. Ramsay, A. Ralescuand and E. van der Knaap, “Confusion matrix-based feature selection,” in Proc. of the 22nd Midwest Artificial Intelligence and Cognitive Science Conf., Cincinnati, Ohio, USA, 2011, pp. 16–17. [Google Scholar]
36. Y. Jung and J. Hu, “A k-fold averaging cross-validation procedure,” Journal of Nonparametric Statistics, vol. 27, no. 2, pp. 1–13, 2015. [Google Scholar]
 | This work is licensed under a Creative Commons Attribution 4.0 International License, which permits unrestricted use, distribution, and reproduction in any medium, provided the original work is properly cited. |