DOI:10.32604/cmc.2022.023191
| Computers, Materials & Continua DOI:10.32604/cmc.2022.023191 | |
| Article |
Classification of Desertification on the North Bank of Qinghai Lake
1School of Geographical Sciences, Nanjing University of Information Science & Technology, Nanjing, 210044, China
2School of Environmental Science & Engineering, Nanjing University of Information Science & Technology, Nanjing, 210044, China
3Public Meteorological Service Center, China Meteorological Administration, Beijing, 100081, China
4Center for Wind and Solar Energy Resources, China Meteorological Administration, Beijing, 100081, China
5Faculty of Science, The University of Auckland, 1010, New Zealand
*Corresponding Author: Yanbo Shen. Email: shenyb@cma.gov.cn
Received: 30 August 2021; Accepted: 16 November 2021
Abstract: In this paper, RS, GIS and GPS technologies are used to interpret the remote sensing images of the north shore of Qinghai Lake from 1987 to 2014 according to the inversion results of vegetation coverage (FVC), albedo, land surface temperature (LST), soil moisture (WET) and other major parameters after image preprocessing, such as radiometric correction, geometric correction and atmospheric correction. On this basis, the decision tree classification method based on landsat8 remote sensing image is used to classify the desertification land in this area, and the development and change of desertification in this period are analyzed. The results show that the fluctuation of desertification land area in this area increased during the study period, but from 2003 to 2014, the land area of mild desertification, moderate desertification and severe desertification land were respectively decreased 0.92, 145.89 and 29.39 km2, while the area of serious desertification land still has a slow increasing trend. Whether the driving force of desertification change trend in this area is caused by human factors or global change needs to be further studied.
Keywords: Remote sensing; Qinghai Lake; desertification; classification
Desertification is one of the serious ecological, social and economic problems in the arid and semi-arid areas of the world, which seriously affects and puzzles the survival of all mankind and the sustainable development of society. Therefore, the research of regional desertification classification, dynamic monitoring, evolution rules, driving mechanism and so on has also become a hot and key field of academic research [1–6].
Since 1990s, with the development of “3S” technology, desertification research has been further developed. Different scholars used the normalized exposure index and multi-temporal moderate-resolution imaging spectroradiometer (MODIS) remote sensing data to classify and dynamically monitor desertification by using the spatiotemporal dynamic indicators of vegetation coverage [1,2,7–9]. From these studies, for different scales of remote sensing images, the accuracy of classification results obtained by using thematic index is not very ideal, and there are many indicators that can reflect desertification. However, in the application of remote sensing monitoring, it is necessary to select an appropriate index system to extract desertification information according to the land use characteristics of the study area.
At present, the research on desertification in the north bank of Qinghai Lake area mainly focuses on two aspects: 1. The spatial distribution pattern of desertification land is analyzed, and the stability and sensitivity of desertification land are evaluated. It is considered that the instability of the patch sandy land is higher than that of the continuous sandy land, and the sensitivity of desertification is mainly moderate and highly sensitive. 2. Monitoring land use, extracting land change information, analyzing land spatial-temporal change and differentiation pattern, and simply analyzing and discussing the driving forces of land change [1,4,10,11].
This paper mainly uses different methods and technologies, using high-resolution images, decision tree classification and other mathematical statistical methods to quantitatively analyze the evolution mechanism and rule of desertification on the North Bank of Qinghai Lake, so as to provide decision support for desertification prevention and control in Qinghai Lake area.
2 Data Source and Preprocessing
In this paper, the time scale is from June to September, 1987 to 2014, the data of Landsat 5 TM images with the track number of 133/34, Landsat 8 OLI and TIRS images are used. The background information and specific parameters of remote sensing images are shown in the following Tab. 1.

2.2 Preprocessing of Remote Sensing Images
In general, the gain and offset parameters given by USGS are used to calculate the radiometric correction of images. Formula:
where, DN: pixel brightness value of image, dimensionless, value range 0–255; L: radiance, W⋅m2⋅sr−1⋅um−1; gain: W⋅m−2⋅sr−1⋅um−1; Bias: W⋅m−2⋅sr−1⋅um−1; There are two sets of parameters (Tab. 2) for the gain and bias of TM images with different dates, and the differences mainly appear in the gain. The calibration parameters of landsat8 image are queried in the MTL file attached to the image [12,13].

55 geometric correction points are selected, all points are evenly distributed on the image, and the error is controlled within one pixel.
This paper uses the fast line-of-sight atmospheric analysis of spectral hypercubes module of environment for visualizing images (ENVI) software for atmospheric correction, and the relevant parameters can be obtained from the MTL attached to the image File.
2.3.1 Vegetation Coverage (FVC)
According to the distribution of normalized difference vegetation index (NDVI) values of TM images in different years in the study area, combined with experts’ opinions, and are assigned values. The range of is generally between-0.1 and 0.2, and the range of is generally between 0.6 and 0.8, the inversion results are shown in Fig. 1:
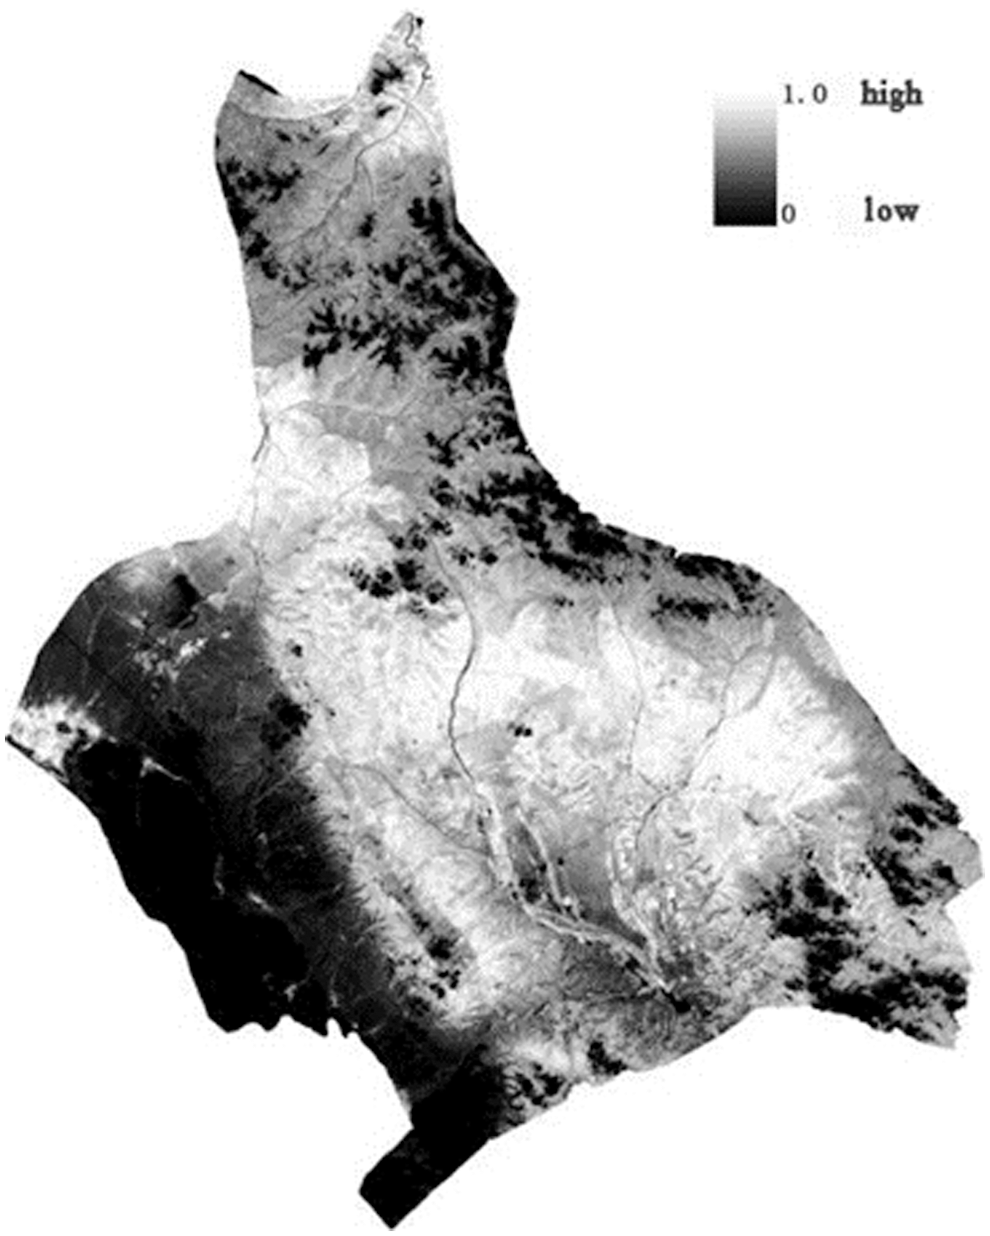
Figure 1: FVC inversion results
The modified soil adjusted vegetation index (MSAVI) was used as the calculation formula:
In the formula, NIR and R are the near infrared band and red band of the image respectively [9,13]. The inversion results are shown in Fig. 2:
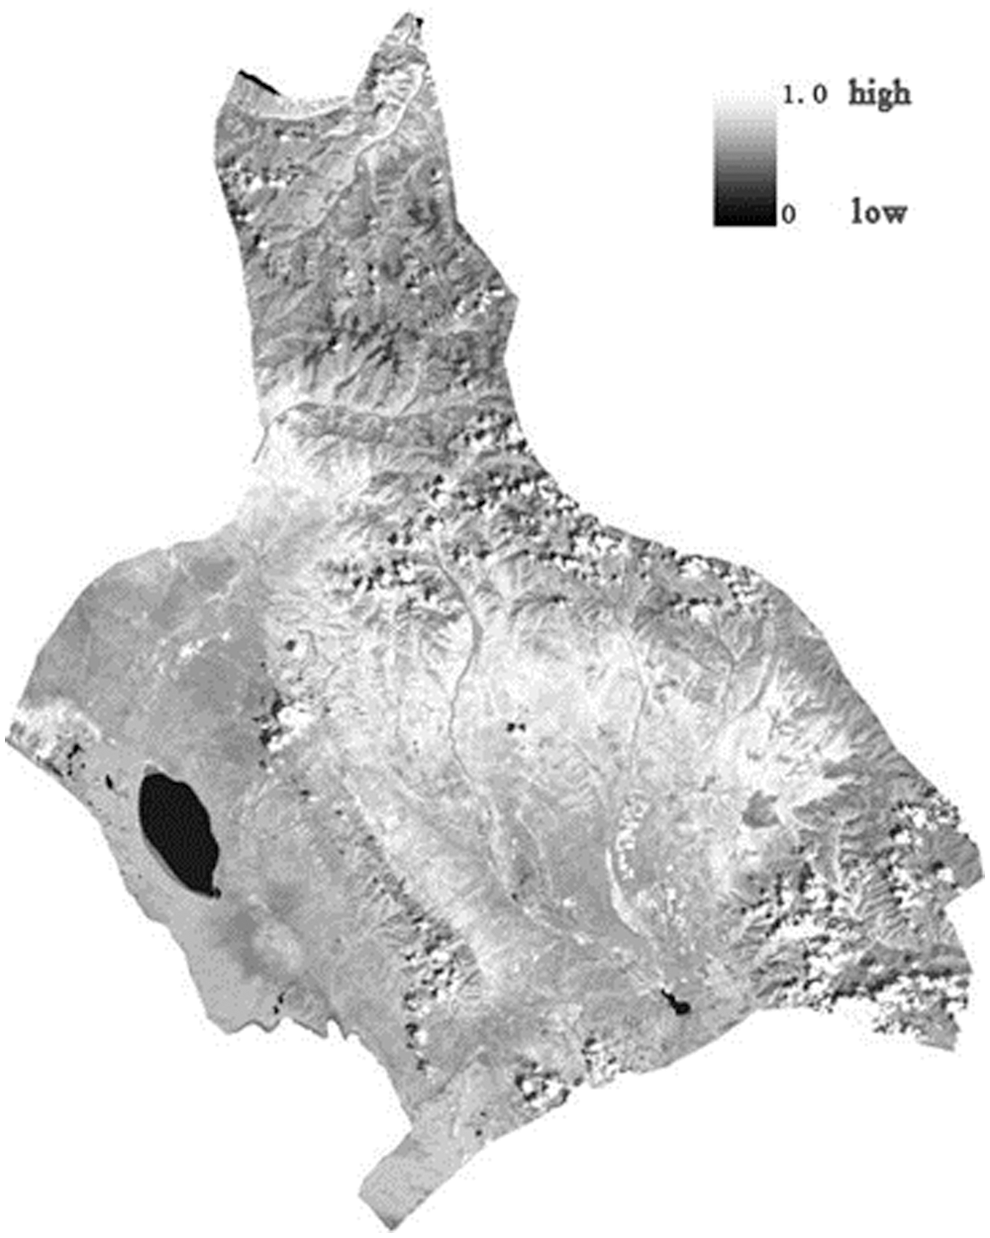
Figure 2: Inversion results of soil-adjusted vegetation index
The direct inversion method is used in this paper. The albedo formula of TM is:
In the formula, R1, R3, R5, R5 and R7 are bands 1, 3, 4, 5 and 7 of TM image respectively [9,12,14]. The inversion results are shown in Fig. 3.
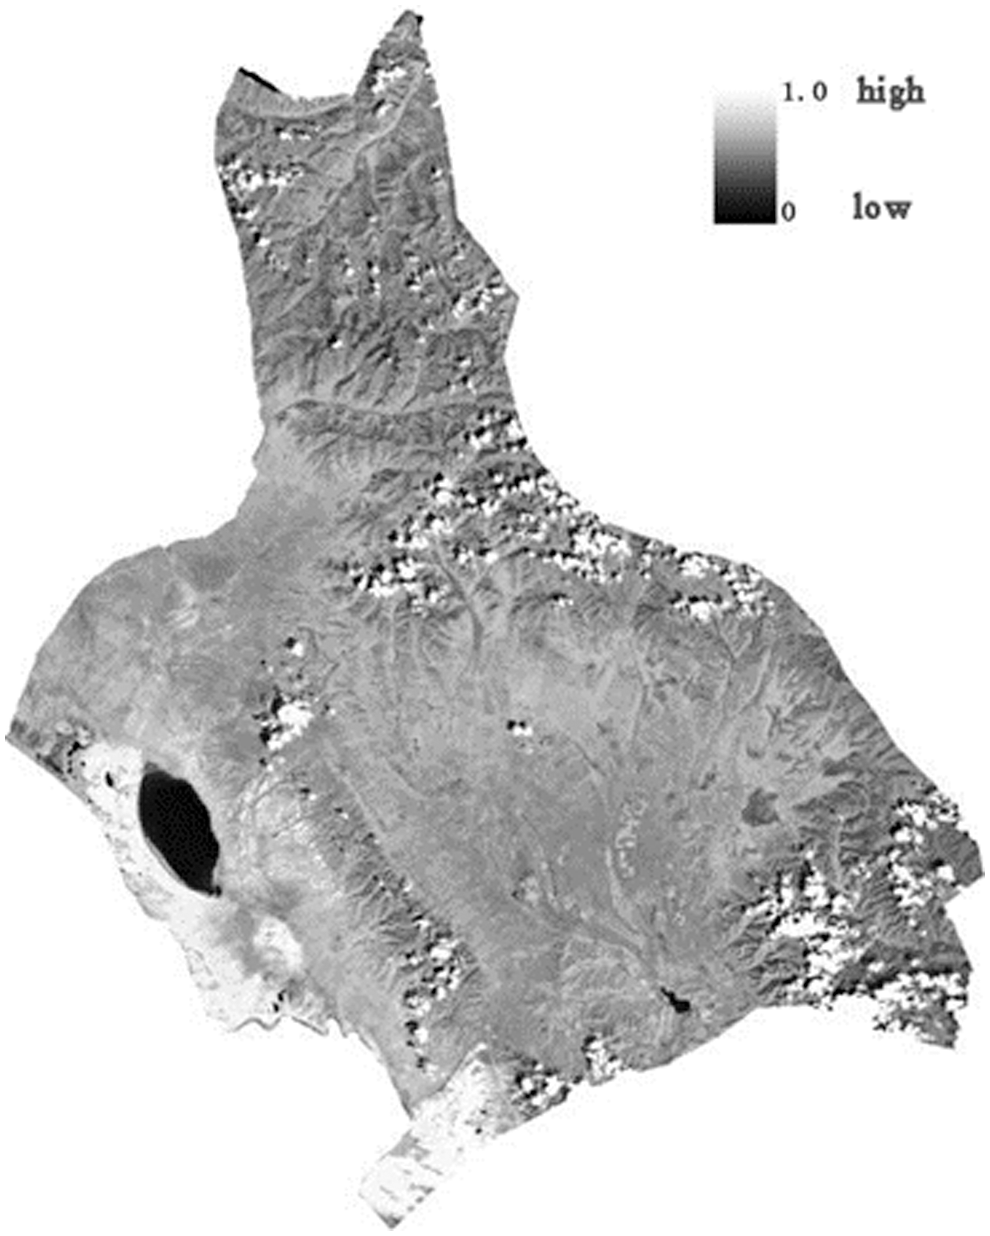
Figure 3: Albedo inversion results
2.3.3 Land Surface Temperature (LST)
The resolution of Landsat TM5 image used in this paper is 30 m. The study area is dominated by grassland bare land, but it is difficult to have 100% vegetation coverage or bare soil surface. Due to different seasons, the growth of vegetation is not the same the method to improve emissivity through NDVI threshold was proposed [9], [12–14], the formula is:
In the formula,
In the formula,
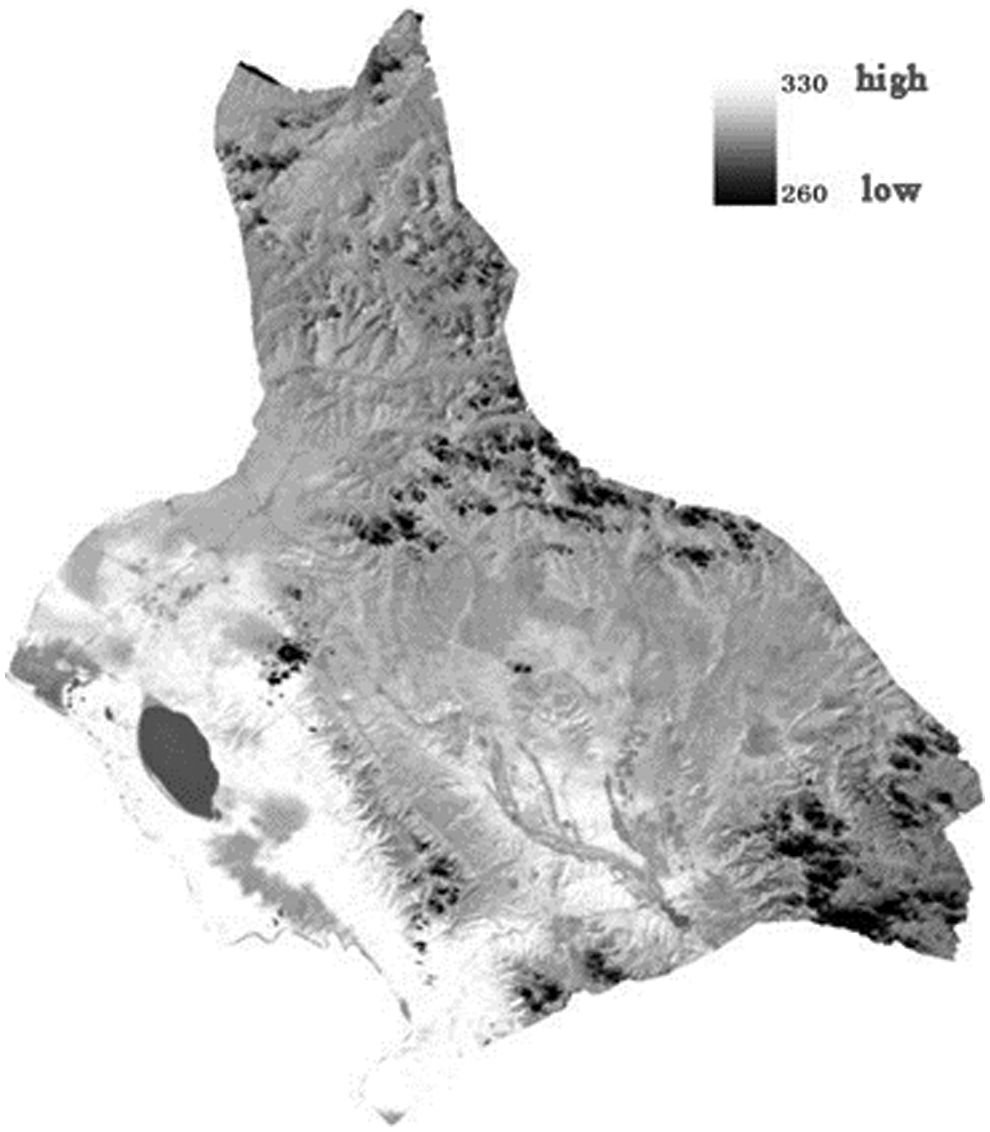
Figure 4: Surface temperature inversion results
According to the characteristic space of TS NDVI, the dry edge equation and wet edge equation are obtained.
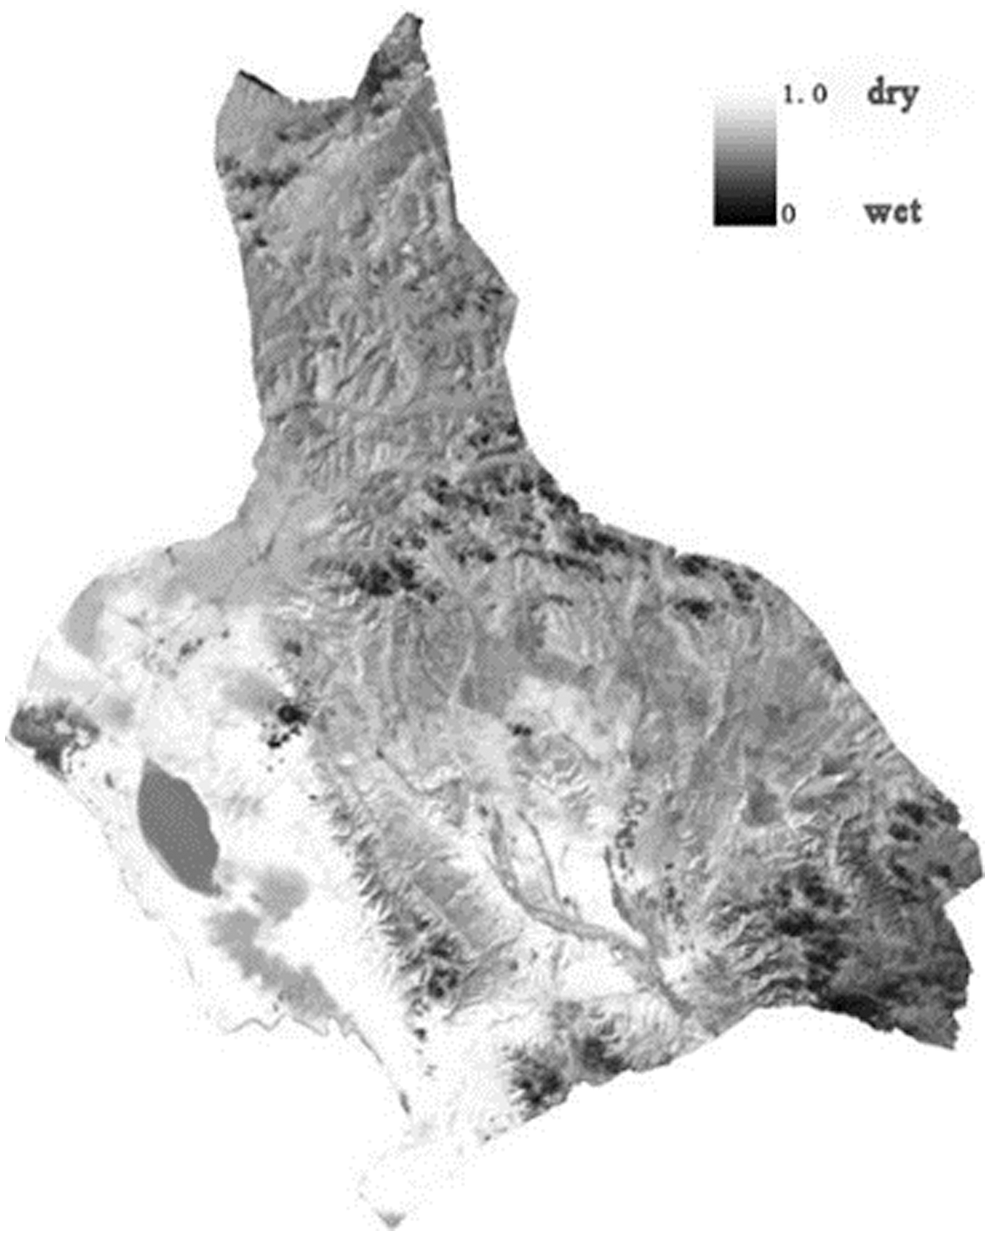
Figure 5: TVDI inversion results
3 Classification of Desertification
3.1 Analysis of Desertification Classification Methods
Maximum likelihood method and minimum distance method are the most commonly used statistical methods for remote sensing image classification. The maximum likelihood method is a classification method based on Bayesian criterion, while the minimum distance method is a variety of classification methods based on various decision distance functions. With the development of remote sensing technology, the data of remote sensing image is more and more abundant. When facing multi band image data, the maximum likelihood classification method has some problems, such as large amount of data, slow operation speed and so on. Because the objects feature in the remote sensing image are scattered and the gray value range is wide, there are often linear and non-linear classification problems between targets and between targets and background, which greatly affect the classification accuracy of the minimum distance method [12,15–18].
Decision tree classification algorithm has the characteristics of clear, intuitive, flexible and high efficiency, which shows great advantages in classification accuracy. At present, the commonly used desertification classification methods of medium and low-resolution remote sensing images mainly include supervised classification, unsupervised classification and decision tree classification. The object-oriented classification method has better effect on high resolution remote sensing images [15,19,20]. However, other classification methods, such as neural network classification, fuzzy classification, support vector machine classification and so on, cannot be popularized and applied in the field of desertification research because of the complexity of the algorithm or the higher requirements of Geoscience Knowledge. Huo Aidi, Ma Jingyu et al. adopted three methods of supervised classification, unsupervised classification and decision tree classification. Based on the four desertification monitoring indicators retrieved from MODIS data, they classified the Western Hunshandake desertification area in the autumn equinox of 2000, and compared the classification accuracy of the three classification methods [9,14, 19–21]. The results are shown in Tab. 3.

Liu Aixia and Shen Wenming used unsupervised classification, maximum likelihood method and decision tree classification respectively, based on the five desertification monitoring indicators retrieved from MODIS data, the desertification degree of Horqin Sandy Land in 2001 was classified. Combined with the desertification monitoring map of Horqin Sandy Land in the late 1990s based on TM image, the classification results of the three classification methods were evaluated [14,19]. The results are shown in Tab. 4.

It can be seen from Tabs. 3 and 4 that among the three classification methods, the overall accuracy and kappa coefficient of decision tree classification method are the highest. Therefore, according to the current situation of desertification in Qinghai Lake area and the characteristics of TM image, the decision tree classifier is selected to carry out the classification of desertification in Qinghai Lake area.
3.2 Desertification Classification Based on Landsat8 Images
Landsat8 carries two main loads: OLI land imager and TIRS thermal infrared sensor. The OLI land imager consists of 9 bands with a spatial resolution of 30 m, including a 15 m panchromatic band with an imaging width of 185 × 185 km. OLI includes all bands of TM sensor. In order to avoid the atmospheric absorption characteristics, OLI readjusts the band. The larger adjustment is OLI band 5 (0.845–0.885 μm), excluding the water vapor absorption characteristics at 0.825 μm; OLI panchromatic band band8 has a narrow band range, which can better distinguish vegetation and non-vegetation features in panchromatic images; In addition, there are two new bands: one is the blue band (band 1: 0.433–0.453 μm), which is mainly used for coastal zone observation, and the other is the short wave infrared band (band 9: 1.360–1.390 μm), which can detect the strong absorption characteristics of water vapor for cloud detection. The parameters of the two sensors are shown in Tabs. 5 and 6.


3.2.2 Desertification Decision Tree Classification Based on Landsat8 Images
Landsat8 uses a new OLI land imager and TIRS thermal infrared sensor. It is not clear whether the retrieval methods of NDVI, vegetation coverage, soil adjusted vegetation index, albedo, land surface temperature and soil moisture suitable for landsat5 are also suitable for landsat8 images. According to the existing research results, landsat5 NDVI and vegetation coverage inversion methods are also suitable for landsat8 images. However, there are still many uncertainties in the two thermal infrared bands of landsat8. At the same time, NASA does not recommend using split window algorithm to retrieve land surface temperature. Therefore, this paper attempts to use the single window algorithm to retrieve the first thermal infrared band of landsat8. The newly added cirrus band in landsat8 can be used for cloud detection, so NDVI, vegetation coverage, land surface temperature, soil moisture and cirrus band apparent emissivity are used as landsat8 desertification monitoring system to classify the desertification in the study area. The parameters of NDVI, vegetation coverage, land surface temperature and soil moisture based on landsat8 image were obtained by using parameter inversion method. The apparent emissivity of cirrus cloud band can be retrieved from the formula provided by NASA [10,14,19], and the formula is as follows:
In the formula, ρ λ′ is the atmospheric top reflectance without sun angle correction;
The formula of the atmospheric top reflectance with solar angle correction is as follows:
In the formula,
According to the above parameters, NDVI values of severe desertification land, moderate desertification land, mild desertification land and non-desertification land are all greater than 0. The vegetation coverage of non-desertification land is more than 60%, that of mild desertification land is between 30% and 60%, that of moderate desertification land is between 10% and 30%, and that of severe desertification land is less than 10%. The surface features with NDVI value less than 0 include water body, severely desertified land, cloud, cloud shadow and snow cover. The surface temperature of the desertified land is between 288–302 k, the surface temperature of the seriously desertified land is about 300 K, the temperature of the water body is about 285 k, and the surface features below 290 k are clouds, cloud shadows and snow. The soil moisture of seriously desertified land is about 0.5% larger than that of water body. On the surface reflectance image of cirrus band, the reflectance of cloud free area is below 0.05, while that of cloud covered area is above 0.1. According to the above features, the decision tree classification process based on landsat8 is constructed, as shown in Fig. 6.
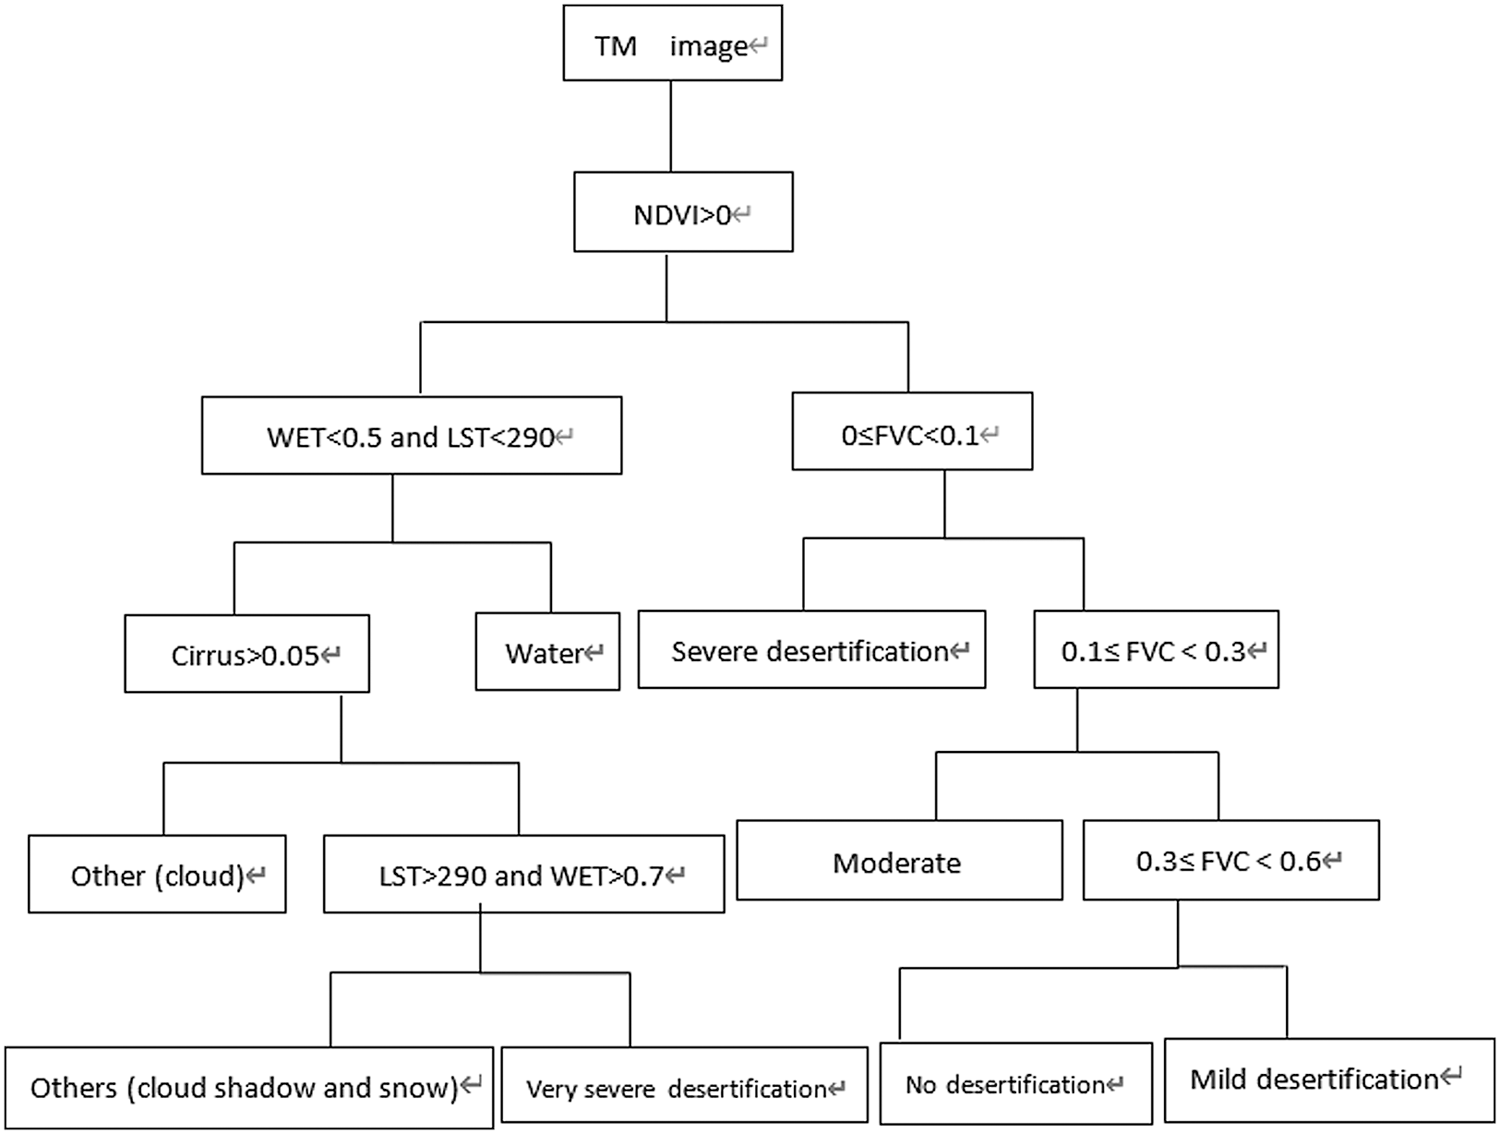
Figure 6: Classification flow chart of decision tree
4 Classification Results and Accuracy Evaluation
Based on the existing research results and field investigation, this paper uses the decision tree classification method to interpret the TM remote sensing images of desertification on the North Bank of Qinghai Lake area, and the results are shown in Fig. 7.
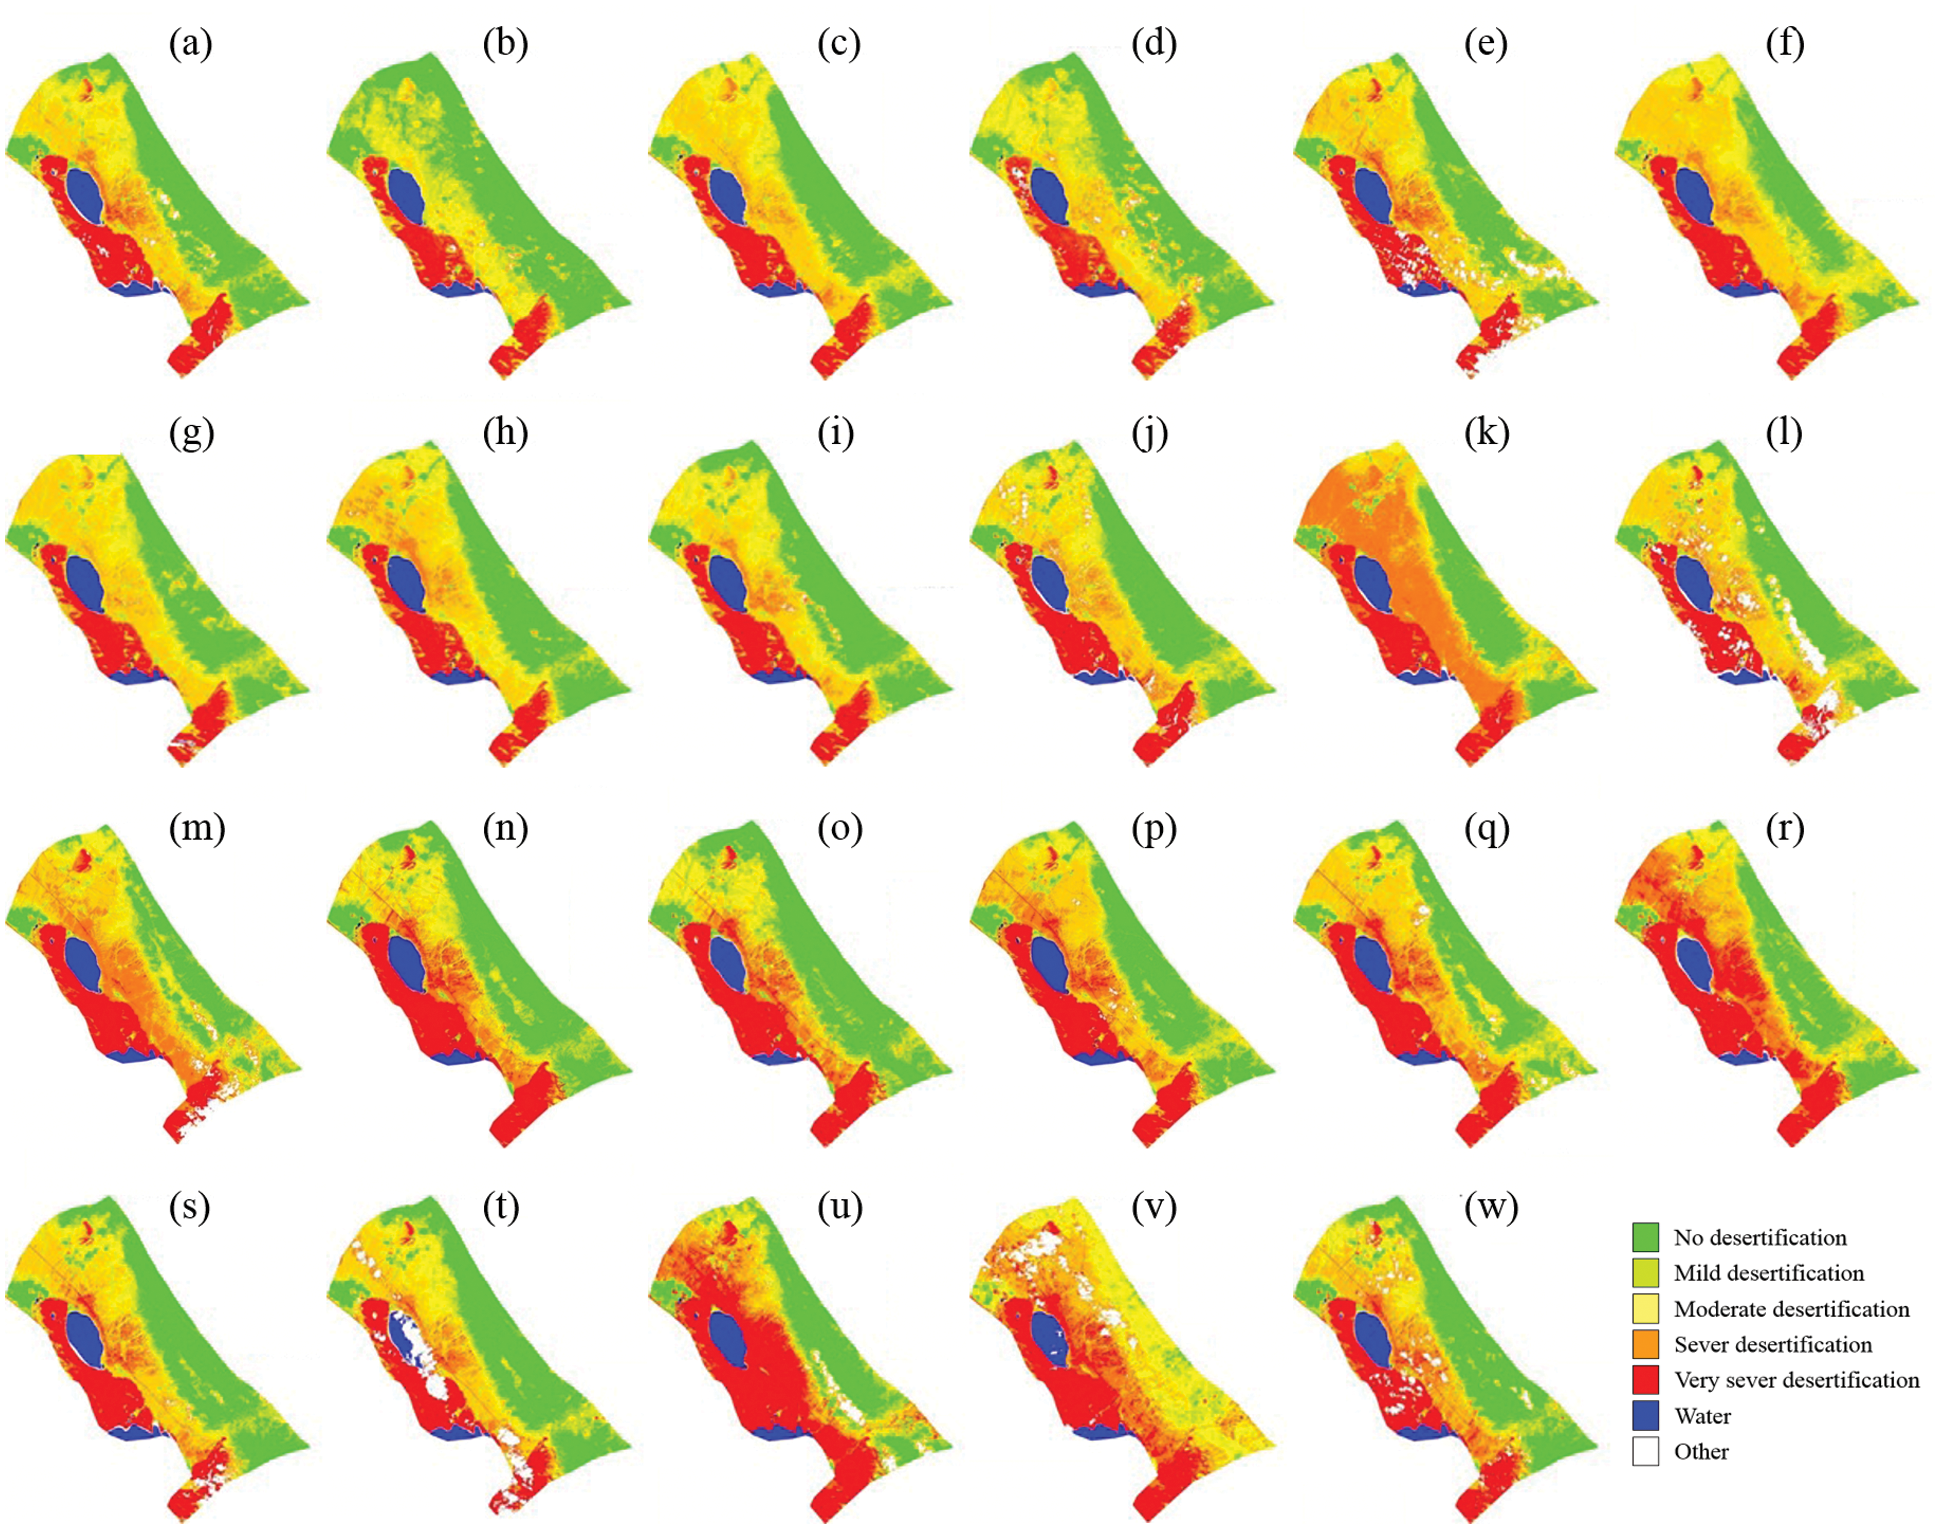
Figure 7: Classification results of desertification on the north bank of Qinghai lake (a) 1987; (b) 1989; (c) 1990; (d) 1993; (e) 1995; (f) 1996; (g) 1997; (h) 1998; (i) 1999; (j) 2000; (k) 2001; (l) 2002; (m) 2003; (n) 2004; (o) 2005; (p) 2006; (q) 2007; (r) 2008; (s) 2009; (t) 2010; (u) 2011; (v) 2013; (w) 2014
The accuracy evaluation of this paper is based on the classification results of TM images in 1987, 1995 and 2006 of Hu Mengjun et al. Based on the desert resolution signs established by earth, the classification results of 1987, 1995, 2006, 2013 and 2014 are compared with the visual interpretation results. The accuracy evaluation results are shown in Tab. 7. It can be seen from Tab. 7 that the decision tree classification method based on vegetation coverage, adjusted soil vegetation index, albedo, land surface temperature and soil moisture have high extraction accuracy. The overall classification accuracy of the three periods is more than 80%, and the kappa coefficient exceeds the minimum allowable discrimination accuracy of 0.7, which meets the requirements of remote sensing image classification accuracy.

4.3 Statistical Results of Desertification on the North Bank of Qinghai Lake
According to the results of TM remote sensing interpretation, this paper uses Envi's classification statistical tool to make statistics on the land area of different degrees of desertification in Haiyan Lake Basin in different years. The incomplete data of individual years are supplemented by linear interpolation method. The results are shown in Tab. 8.

4.4 Analysis on the Evolution Law of Desertification Land in the North Bank of Qinghai Lake
This paper analyzes the evolution law of different types of desertification land in Qinghai Lake area from 1987 to 2014, and the results are shown in Fig. 8. As shown in Fig. 8, from 1987 to 1996, the total area of desertified land increased by 175.82 km2, of which the area of mild desertified land increased by 60.47 km2, the area of moderate desertified land increased by 121.33 km2, the area of severe desertified land increased by 18.23 km2, the area of severe desertified land decreased by 24.21 km2, and the area of moderate desertified land developed the fastest. This is mainly due to the rapid growth of population in the area around Qinghai Lake in the 1990s, which leads to the increasing demand for the development of agriculture and animal husbandry, the excessive reclamation of grassland and the aggravation of desertification. After 1996, the area of desertified land began to decline, but after entering the 21st century, the area of desertified land has an increasing trend. Compared with 1996, the area of desertified land in 2003 decreased by 35.56 km2, the area of mild and moderate desertified land showed a reverse trend, and the area of severe and very severe desertified land still showed an increasing trend. This is mainly due to the continuous increase of cultivated land around Qinghai Lake in the late 1990s. According to the data, the cultivated land around Qinghai Lake increased by 5299 km2 from 1994 to 1999. The population growth and overgrazing led to the destruction of grassland and the aggravation of desertification. After 2001, the area of desertified land began to reverse obviously. The area of desertified land decreased from 1003 km2 in 2003 to 858.72 km2 in 2014, and the area of desertified land decreased by 144.28 km2. The area of mild, moderate and severe desertified land decreased by 0.92, 145.89 and 29.39 km2 respectively. However, the land area of serious desertification is still increasing slowly.
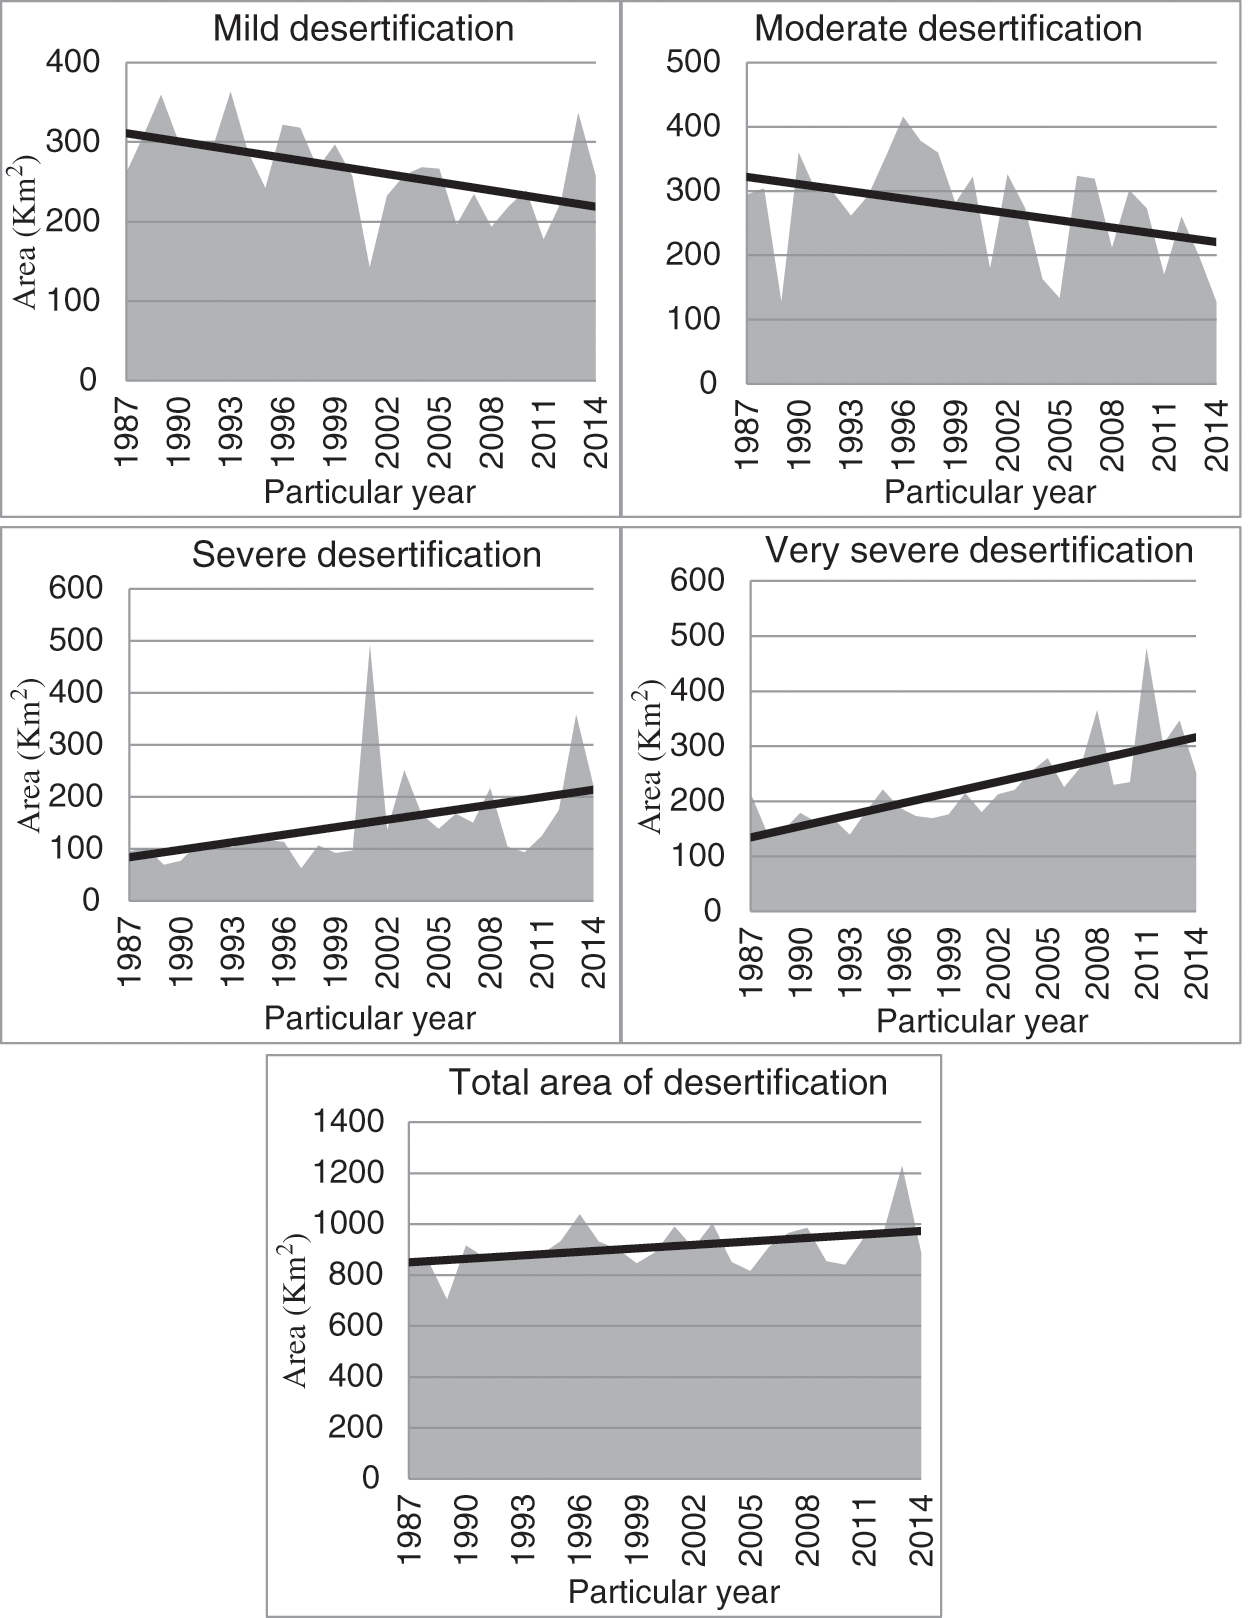
Figure 8: The evolution law of different types of desertification land in qinghai lake area
In this paper, RS, GIS and GPS technologies are used to interpret the remote sensing images of Hubei coast of Qinghai Province from 1987 to 2014 based on the retrieval results of main parameters such as FVC, albedo, LST and WET after image preprocessing such as radiometric correction, geometric correction and atmospheric correction. On this basis, the decision tree classification method based on landsat8 remote sensing image was used to classify the desertification land in this area, and the development and change of desertification in this period were analyzed. The results showed that the fluctuation of desertification land area in this area increased during the study period, but from 2003 to 2014, the area of mild desertification, moderate desertification and severe desertification land decreased by 0.92, 145.89 and 29.39 km2 respectively, while the area of serious desertification land still has a slow increasing trend. Whether the driving force of desertification change trend in this area is caused by human factors or global change needs to be further studied.
Funding Statement: This work was supported by the National Natural Science Foundation of China “Study on the dynamic mechanism of grassland ecosystem response to climate change in Qinghai Plateau” under grant number U20A2098, and the Second Tibet Plateau Scientific Expedition and Research Program (STEP) under grant number 2019QZKK0804.
Conflicts of Interest: The authors declare that they have no conflicts of interest to report regarding the present study.
1. Y. Y. Zhao, H. Y. Wu, G. D. Ding, G. L. Gao and W. Z. Tu, “A review on the aeolian desertification in the otindag sandy land,” Journal of Desert Research, vol. 40, no. 5, pp. 1–11, 2020. [Google Scholar]
2. T. Wang, X. Song, C. Z. Yan, S. Li and J. L. Xie, “Remote sensing analysis on aeolian desertification trends in Northern China during 1975–2010,” Journal of Desert Research, vol. 31, no. 6, pp. 1351–1356, 2011. [Google Scholar]
3. Y. Zhou, X. C. Yang, Y. X. Jin and B. Xu, “Classification of the desertification control models in north China,” Journal of Desert Research, vol. 40, no. 3, pp. 106–114, 2020. [Google Scholar]
4. C. Zhao, R. J. Lu and J. F. Li, “Land desertification and grain size characteristics of landsurface deposits in the qinghai lake watershed,” Journal of Desert Research, vol. 35, no. 2, pp. 276–283, 2015. [Google Scholar]
5. L. Y. Han, Z. C. Zhang, Q. Zhang and X. Wan, “Desertification assessments in the hexi corridor of northern China's gansu province by remote sensing,” Natural Hazards, vol. 75, no. 3, pp. 2715–2731, 2015. [Google Scholar]
6. X. Ding, G. P. Lei, D. Y. Xu, D. J. Li and Z. Y. Wang, “Impact of desertification dynamics on regional ecosystem service values in inner Mongolia from 1981–2010,” Research of Soil and Water Conservation, vol. 25, no. 1, pp. 298–303, 2018. [Google Scholar]
7. X. Y. Han, G. Yang, F. C. Qin, G. P. Jia, X. Ling et al., “Spatial and temporal dynamic patterns of sandy land in Mu Us in the last 30 years,” Research of Soil and Water Conservation, vol. 26, no. 5, pp. 144–150, 2019. [Google Scholar]
8. A. R. Han, L. Du, Y. Sheng and A. S. Na, “Driving forces on land desertification in duolun county inner Mongolia based on logistic regress model,” Arid Land Geography, vol. 42, no. 1, pp. 137–143, 2019. [Google Scholar]
9. G. M. Guo and Q. S. Yang, “Retrieving land surface temperature from MODIS data,” Remote Sensing Technology and Application, vol. 19, no. 1, pp. 34–36, 2004. [Google Scholar]
10. M. Zhang, “Indicator system and assessment of land desertification in qinghai-lake basin based on remote sensing,” Territory and Natural Resources Study, 2016, no. 3, pp. 35–37, 2016. [Google Scholar]
11. H. C. Zhang, Z. J. Sha, T. T. Zhang, L. H. Guo and Y. F. Ma, “Spatial variation and driving force of sandy desertification in the peripheral area of the lake qinghai lake in recent 20 years,” Journal of Arid Land Resources and Environment, vol. 25, no. 3, pp. 59–64, 2011. [Google Scholar]
12. W. P. Kang and S. L. Liu, “A review of remote sensing monitoring and quantitative assessment of aeolian desertification,” Journal of Desert Research, vol. 34, no. 5, pp. 1222–1229, 2014. [Google Scholar]
13. Y. J. Duan, Z. Y. He, Y. Q. Wang, J. F. Liu and G. Huang, “Monitoring land desertification of tibet autonomous region based on remote sensing,” Journal of Arid Land Resources and Environment, vol. 28, no. 1, pp. 55–61, 2014. [Google Scholar]
14. J. Y. Ma, “Estimating the Desertification Boundary of Remote Sensing Using Vegetation Abundance Derived from MODIS Data Based on Pixel Unmixing,” M.S. dissertation, Zhejiang University, China, 2018. [Google Scholar]
15. B. R. Niu, J. R. Liu and Z. W. Wang, “Remote sensing information extraction based vegetation fraction in semiarid area,” Geo-Information Science, vol. 7, no. 1, pp. 84–86, 2005. [Google Scholar]
16. X. Liu, J. Yu, W. Song, X. Zhao, L. Zhao et al., “Remote sensing image classification algorithm based on texture feature and extreme learning machine,” Computers, Materials & Continua, vol. 65, no. 2, pp. 1385–1395, 2020. [Google Scholar]
17. H. Wu, Q. Liu and X. Liu, “A review on deep learning approaches to image classification and object segmentation,” Computers, Materials & Continua, vol. 60, no. 2, pp. 575–597, 2019. [Google Scholar]
18. M. B. Nejad B and M. E. Shir, “A new enhanced learning approach to automatic image classification based on SALP swarm algorithm,” Computer Systems Science and Engineering, vol. 34, no. 2, pp. 91–100, 2019. [Google Scholar]
19. W. M. Shen, W. J. Wang, H. J. Luo, F. Zhang and X. M. Liu, “Classification methods of remote sensing image based on decision tree technologies,” Remote Sensing Technology and Application, vol. 22, no. 3, pp. 333–338, 2007. [Google Scholar]
20. Z. Jia, Q. Han, Y. Li, Y. Yang and X. Xing, “Prediction of web services reliability based on decision tree classification method,” Computers, Materials & Continua, vol. 63, no. 3, pp. 1221–1235, 2020. [Google Scholar]
21. Y. J. Duan, Z. Y. He, Y. Q. Wang, J. F. Liu and G. Huang, “Monitoring land desertification of tibet autonomous region based on remote sensing,” Journal of Arid Land Resources and Environment, vol. 28, no. 1, pp. 55–61, 2014. [Google Scholar]
 | This work is licensed under a Creative Commons Attribution 4.0 International License, which permits unrestricted use, distribution, and reproduction in any medium, provided the original work is properly cited. |