DOI:10.32604/cmc.2022.023306
| Computers, Materials & Continua DOI:10.32604/cmc.2022.023306 | |
| Article |
Intelligent DoS Attack Detection with Congestion Control Technique for VANETs
1Department of Computer Science and Engineering, Dhanalakshmi Srinivasan Engineering College, Perambalur, 621 212, India
2Department of Computer Science and Engineering, RajaRajeswari College of Engineering, Bengaluru, 560074, India
3Department of Information Technology, Vignan's Institute of Information Technology, Visakhapatnam, 530049, India
4Department of Computer Science, College of Computer Engineering and Sciences, Prince Sattam Bin Abdulaziz University, Alkharj, 11942, Saudi Arabia
5Department of Computer Science, College of Science & Arts at Mahayil, King Khalid University, Muhayel Aseer, 62529, Saudi Arabia & Faculty of Computer and IT, Sana'a University, Sana'a, 15347, Yemen
6Department of Information Systems, College of Computer and Information Sciences, Princess Nourah Bint Abdulrahman University, Riyadh, 11564, Saudi Arabia
7Department of Computer and Self Development, Preparatory Year Deanship, Prince Sattam bin Abdulaziz University, Al-Kharj, 16278, Saudi Arabia
*Corresponding Author: Manal Abdullah Alohali. Email: maalohaly@pnu.edu.sa
Received: 02 September 2021; Accepted: 01 November 2021
Abstract: Vehicular Ad hoc Network (VANET) has become an integral part of Intelligent Transportation Systems (ITS) in today's life. VANET is a network that can be heavily scaled up with a number of vehicles and road side units that keep fluctuating in real world. VANET is susceptible to security issues, particularly DoS attacks, owing to maximum unpredictability in location. So, effective identification and the classification of attacks have become the major requirements for secure data transmission in VANET. At the same time, congestion control is also one of the key research problems in VANET which aims at minimizing the time expended on roads and calculating travel time as well as waiting time at intersections, for a traveler. With this motivation, the current research paper presents an intelligent DoS attack detection with Congestion Control (IDoS-CC) technique for VANET. The presented IDoS-CC technique involves two-stage processes namely, Teaching and Learning Based Optimization (TLBO)-based Congestion Control (TLBO-CC) and Gated Recurrent Unit (GRU)-based DoS detection (GRU-DoSD). The goal of IDoS-CC technique is to reduce the level of congestion and detect the attacks that exist in the network. TLBO algorithm is also involved in IDoS-CC technique for optimization of the routes taken by vehicles via traffic signals and to minimize the congestion on a particular route instantaneously so as to assure minimal fuel utilization. TLBO is applied to avoid congestion on roadways. Besides, GRU-DoSD model is employed as a classification model to effectively discriminate the compromised and genuine vehicles in the network. The outcomes from a series of simulation analyses highlight the supremacy of the proposed IDoS-CC technique as it reduced the congestion and successfully identified the DoS attacks in network.
Keywords: VANET; intelligent transportation systems; congestion control; attack detection; dos attack; deep learning
Vehicular Ad hoc Network (VANET) is one of the advanced and established networks and is named so, since the location of the vehicle alters at all instances of time. The normal speed of vehicular nodes differs from 40 to 80 km/h [1]. This heavy arbitrariness, in terms of position exposes VANET to each form of cyber threat and attacks, particularly hybrid DoS attack. Uncertainties, like hybrid DoS attack, are the main reason for cyber threats. VANET makes use of vehicles as mobile nodes and is a subclass of Mobile Adhoc Network (MANET) to communicate with and amongst the nearby vehicles closer to equipment/roadside unit (RSU). However, it differs from other networks in terms of its features [2]. Mainly, the vehicles (nodes) are insufficient for road topology while stirring. So, the vehicle's upcoming location could be anticipated since the data of the road is accessible. According to IEEE 1471-2000 and ISO/IEC 42010 architecture standard principles, VANET system could be classified into three types such as generic domain, mobile domain, and infrastructure domain. Fig. 1 shows the structure of VANET. Mobile domain transfers the data and communicates with the infrastructure domain. It makes use of IEEE 802.11p signals and beacons that process the information and move on to modulation process [3]. Later, the infrastructure domain communicates with generic domain and exchanges the data. The flow of the information between stationary and the mobile resources leads to efficient usage of the road with users who use IEEE 802.11p beacon transmission standards.
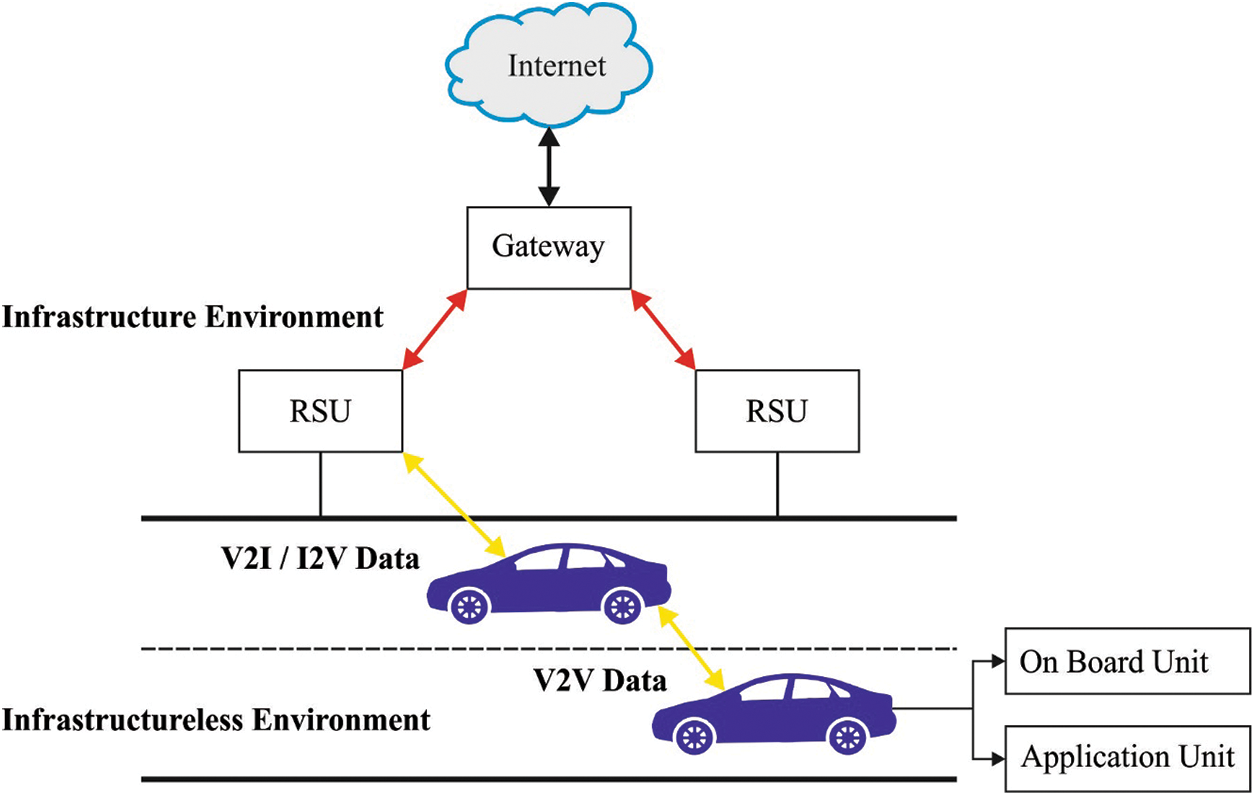
Figure 1: Overview of VANET
The current work considered the broadcast rate of data for real-time IEEE 802.11p data delivery in VANET to be 30 Mbps. Also in VIA, the vehicle co-operation occurs in the group motion for frequent exchange of the sporadic broadcast of security messages [4]. Such transmission carries the data about vehicle's speed and its location while using IEEE 802.11p beacons-devoted channel [5]. Beacon losses tend to occur at the time of standard operations of IEEE 802.11p MAC protocol with arbitrary access requirements. This could be featured as the damage to wireless networks (viz., beacon transmission overlaps the results from various vehicles that could lead to congestion or collision). Collision/Congestion (CC) could be decreased on the basis of suitable selection of MAC protocol real-time broadcast method. This method includes key distribution algorithm and secure authentication methods whereas secure broadcast range model could be placed in VIA network. Depending on this, efficiency parameters are used like real-time end-to-end delay sensitivity to implement the neighbouring node successfully.
In VANET, the consistency of vehicular nodes is measured based on its cooperation, which considers the amount of participation with transmission packets from their neighbors. This is because of absence of centralized control points for transmission [6]. However, the degree of collaborations, provided by the vehicular node, to transmit the packets reduces the existence of malicious activities such as DDoS attacks. Because these attacks unintentionally/intentionally utilize the resources and reduce the efficiency of network so as to stay active in the network with no genuine reason [7]. The existence of DDoS attack possibly decreases the rate of throughput and packet delivery, despite the acquisition of total overhead, great level of delay, and control overhead. In previous years, a substantial amount of mitigation approaches presented DDOs attacks and methods to overcome it.
VANET is a highly scalable network with differing amounts of nodes (vehicles) and RSUs (infrastructure) that keeps changing from time to time. Further, its network topology also gets altered regularly, since the node moves with changeable speed. VANET is incorporated in smart transportation systems [8] to decrease the time consumed on road which includes both waiting time and travel time at the intersection, for a commuter. Travel time could be decreased with the help of shortest paths between two nodes. However, when each vehicle elects the shortest path, then it would create congestion on that path. Therefore, the shortest routes are mostly not the optimum routes [9]. Commuters might select a slightly longer route. However, their primary focus is to evade congestion in their routes by having less number of traffic signals and less waiting time for smoother mobility.
Khoza et al. [10] introduced an IHACO approach to decrease congestion in smart cities. The aim is to select and recommend an optimal route during rush hours. Also, the system follows IHACO approach to improve the QoS to ITS. This method (IHACO) is different than other approaches, for instance PSO, due to pheromone upgrade process that makes it highly effective. In Jindal et al. [11], a new MACO-P approach was presented to reduce the total travelling time. MACO approach was utilized to avoid the congested route by sensing the pheromone trail. The inclusion of pre-emption in the presented MACO approach would lead to decrease in normal queue length at intersections, therefore, lesser waiting times ensure smoother mobility.
Erskine et al. [12] used VFC incorporation with hybrid OA and SI algorithm including CSA, ABC, and GA to provide a real-time recognition of DoS attacks in IEEE 802.11p. In this method, VFC was used for achieving a secured smart vehicular network. The vehicle moves at a particular speed and the data gets transferred at 30 Mbps. FFBPNN approach was utilized in this study as a classifier to distinguish between genuine and the attacked vehicles. Chang et al. [13] proposed a distributed broadcast power adjustment approach to enhance the awareness and transmission congestion control to address the transmission congestion issues that occur in VANET. The aim is to offer maximal awareness of nearby vehicles, when preserving a communication channel load, within the threshold allowed. By altering the broadcast range of the vehicle gradually, on the basis of communication channel load of its neighbouring vehicles, this approach detects the optimum broadcast range that can offer maximum awareness without the congestion of resultant communication. Furthermore, the presented method properly controls the channel load in a reasonable way without sacrificing the awareness of certain vehicles during congested condition.
Sangaiah et al. [14] presented a LACC approach to enhance the advantages of greedy routing and DDM algorithm. LACC focuses on electing receiver vehicles by measuring its end-to-end service capability and connection stability preference. Kumar et al. [15] presented an effective traffic control scheme using IoV technique. The presented approach was implemented in the work area of Vellore district, Tamil Nadu, India. The street map was divided into smaller sections of different maps. ACO approach was employed in all the maps to find the optimum path. Furthermore, FL algorithm-based traffic intensity evaluation function was also presented for modelling heavy traffic conditions. The presented IoV-based path election approach is related to the present shortest route election methods like Dijikstra, Kruskal, and Prim algorithms.
Lyu et al. [16] proposed a DBCC system to control the beacon activities by considering the condition of links such as vehicles with additional neighbours and better condition of link with its neighbours, so that the system would be allocated with high beacon rates. First, the authors used two ML algorithms namely, NB and SVM to train the features and a classification method was conducted online with NLoS links to forecast the output. Using link data, the authors created L-SBM problems of rate adaption under TDMA transmission MAC which is otherwise known as NPhard. A greedy heuristic approach was presented for L-SBM and the efficiency of the method was calculated. In Selvi et al. [17], an ASPBT algorithm was presented as an efficient and reliable emergency message communication technique. This protocol vigorously changes the amount of partitions and the periodicity of beacons to reduce the amount of recommunication. In this method, partition size is defined by network density and the broadcast schedule for all partitions is evaluated by LOA approach. It is a bio-inspired optimization based on the features of lions.
The current research article presents an Intelligent DoS attack Detection with Congestion Control (IDoS-CC) technique for VANET. The presented IDoS-CC technique has two stages namely, Teaching and Learning-Based Optimization (TLBO)-based Congestion Control (TLBO-CC) and Gated Recurrent Unit (GRU)-based DoS detection (GRU-DoSD). IDoS-CC technique includes TLBO algorithm to optimize the routes taken by vehicles via traffic signals and minimize the congestion instantaneously on a particular route which in turn to assure minimal fuel utilization. Besides, GRU-DoSD model is also employed as a classification model to effectively distinguish the compromised as well as genuine vehicles in network. A series of simulation analyses was conducted and the results attained by IDoS-CC technique established its supremacy in terms of reduced congestion and successful identification of DoS attacks in the network.
In this study, a new IDoS-CC technique is designed for VANET. The goal of IDoS-CC technique is to reduce the level of congestion and to detect the attacks that exist in network. It includes a two-stage process namely, TLBO-CC based Congestion Control and GRU-DoSD-based attack detection. The following sections detail the working of these sub-processes.
2.1 Design of TLBO-CC Technique
This approach is inspired by knowledge transfer that occurs between students and the teachers during education period. Assume that two teachers, T1 & T2, teach a topic using identical data to same merit level learners in two dissimilar classes. The mark distributions among the learners of two classes were validated with the teacher. Curve 1 & 2 illustrate the mark attained by the learners who were taught by the teachers, T1 & T2 correspondingly. The standard distributions are considered for the attained mark. But, in real time, it might be skewness. The standard distributions are demonstrated as follows.
where σ2 represents the variance, μ denotes the mean and x indicates the value where the standard distribution functions are needed. Curve 2 indicates the optimum efficiency related to curve 1 and so it is supposed that T2 value is higher than T1 in terms of teaching. An essential variant amongst the efficiency is measured by calculating the mean between them (M1 for Curve and 1M2 for Curve 2). For instance, an excellent teacher achieves optimal means from the result of learner. Also, the learner learns from communication amongst them and it also assists them to improve the outcomes [18]. There are two major levels in TLBO approach i.e., ‘Learner Phase’ (learns through their communication) and ‘Teacher Phase’ (learns from teacher).
The mean of class increases in MA to MB based upon the decent teacher. Teachers are supposed to be optimum, if his/her learner is up to her/his level, depending upon their knowledge. However, it is not possible essentially and the teachers could shift the mean of class up to a certain level based on the ability of class. Let Mi indicates the mean and Ti represents the teacher during all iterations i. Ti shifts the efforts to the mean Mi near their individual level. Hence, the novel means would be Ti which is called as Mn. The solutions get upgraded based on the variant between the present and novel mean compared as follows.
In which TF stands for teaching feature, calculated as a mean value that should be changed. Further, ri denotes an arbitrary amount between zero and one. The value of TF is one or two, i.e., again it is a heuristic phase and is definite in an arbitrary method with similar likelihood as TF = round [1 + rand (0, 1) {2 − 1}]. This difference modifies the present solution based on the equation given below.
The learner enhances their skill utilizing two ways: input by the teachers and their communications with students. The learner endures interface with rest of the learners through group discussion, presentation, and so on. The learners learn novel things, if other learners are highly skilled with regards to the subject. The learner's alteration is given herewith.
Otherwise
End If
End For
Agree Xn once optimal function values are attained.
At the time of journey, a commuter spends their main time in waiting, because of traffic signals at the intersection or congestion en route created by accident, few researches, and so forth. Therefore, to reduce the total travel time, one should decrease the waiting time in these areas concurrently. The current study presents a TLBO-CC approach in VANET to reduce the travel time in the course of road trips. The presented approach decreases the waiting time at intersection through route optimization i.e., by evading congestion en route. This results in travel cost reduction due to decrease in the consumption of fuel and mitigated health hazards like skin disease or asthma or lung-related disorders or irritation to eyes that occur as a result of engine emission and so on. In current situation, vehicles should wait for a long period of time to get their turn to cross the connections, because of pre-timed signal or actuated signal with predetermined time estimation method. This method does not take into account the actual vehicle density. In general, each driver tends to select the shortest route to reach the destination which in turn increases the congestion in that specific route, owing to huge number of vehicles, utilizing the specific route. So, in current study, this parameter is optimized concurrently with TLBO-CC approach to reduce the trip time. In the presented method, TLBO-CC approach is enhanced by integrating pre-emptive traffic signals instead of average traffic signals faced during travel to the destination. Once the TLBO-CC approach is executed, the commuters are capable of reducing their waiting time at the intersection with non-congested optimized path. This results in lesser travel time that additionally decreases the traveling cost to reach the destination, due to low consumption of fuel.
A fitness function is assumed which is dependent upon various parameters like network throughput, residual energy, and packet loss rate to control congestion in VANET:
where i implies the iteration in the range of [1-N] (entire number of nodes),
2.2 Design of GRU-DoSD Technique
GRU method is generally used in the allocation of appropriate class labels for DoS attacks. RNN signifies Neural Network (NN) with one or more recurrent layers in hidden layers. However, it differs from other networks in its reception of input data. It is commonly employed for series data and is approximately connected with data regarding time order, language, weather, and stock price. RNN is a feedback framework that attains and employs the outcome of completed layers as its input. Therefore, the previous data affects the outcome. RNN is planned well to process the time order data; it employs weight as well as bias frequently by passing the data into cyclic vectors. It gains an input vector X and makes the resultant vector, y. It is considered as output as well as input with unrestricted length and Fully Connected (FC) designs. The network of many styles and shapes is developed by changing its structure. The current RNNs are a long-term dependency problem [19]. The weight converges at zero while it deviates at infinity as the time lag increases. Hence, LSTM is projected to resolve the long-term dependence issue of existing RNNs. It can be a modified structure of RNN and is considered as the occurrence of cell state. LSTM contains output, input, and forget gates. All the gates control values using sigmoid layer and pointwise multiplication. LSTM has an outstanding ability to remember long term dependence. So, it gets a long time to train the manner, due to its difficult framework. Thus, GRU is projected to speed up the trained method. It is a type of RNN framework that utilizes gate approach and is enthused by LSTM and east framework.
GRU is different from LSTM while the latter contains three gate functions that are dependent upon RNN network such as output, input, and forgetting gates to resultant values, control input, and memory correspondingly. However, the two gates are projected in GRU manner i.e., reset and upgrade gates. But
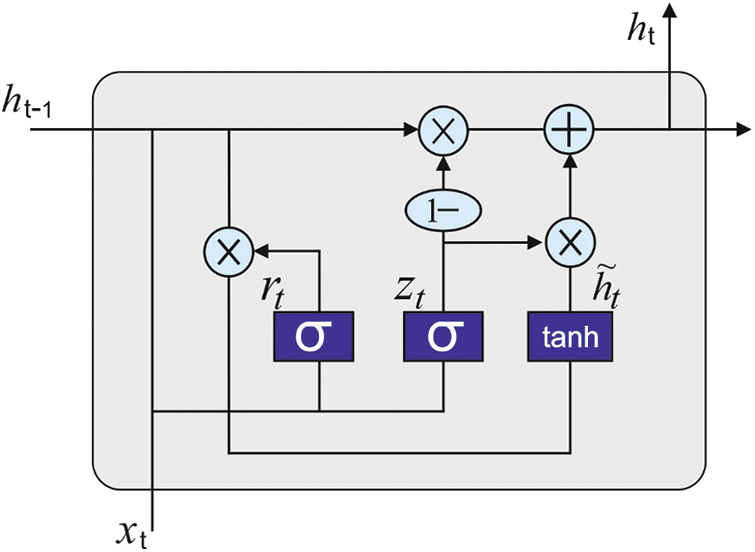
Figure 2: Structure of GRU
GRU integrates input as well as forgetting gates of LSTM for single upgrade gate. These procedures effectually reduce the amount of computations and the probabilities of gradient explosion/disappearance. In particular, the functioning approach is provided as follows
While
Then, the final outcome is obtained and the loss value is evaluated with the help of loss function.
where
BP technique is employed in this study to learn the networks. So, the partial derivatives of loss function are evaluated to all the parameters. Then, the parameter is upgraded and the loss convergence is iteratively defined.
In order to optimally alter the hyperparameters present in GRU technique, NADAM optimizer is utilized. NADAM optimizer has tried to integrate Nesterov's accelerated adaptive moment estimate with Adam. An essential advantage of this combined technique is that the employed adaptive moment estimation assists in the execution of most precise stage in a gradient way. This occurs by upgrading the process variables with momentum phase, before the calculation of gradient [20]. The upgrade rule of NADAM is demonstrated herewith.
But
The current section demonstrates the results of the analysis attained by the presented algorithm in terms of reduced travel time and detection of DoS attacks. The proposed model was simulated using MATLAB tool. The results were examined under varying number of vehicles and prediction intervals. Tab. 1 and Fig. 3 shows the results of Total Distance Covered (TDC) analysis of TLBO-CC method with recent techniques under varying number of vehicles in metres. The results show that the proposed TLBO-CC approach accomplished effectual outcomes with the least TDC value under distinct vehicle counts. For instance, with 300 vehicles, TLBO-CC technique produced a low TDC of 3316 m, whereas ACO, EACO, MACO, and HAPO techniques achieved high TDC values such as 5793, 6831, 7442, and 7042 m respectively. Besides, with 1200 vehicles, the proposed TLBO-CC approach accomplished a less TDC of 7674 m, whereas ACO, EACO, MACO, and HAPO methods got improved TDC values like 9629, 16450, 18920, and 17193 m correspondingly. With 2100 vehicles, the proposed TLBO-CC technique attained a low TDC of 18382 m, whereas other techniques such as ACO, EACO, MACO, and HAPO obtained superior TDC values such as 20841, 28693, 32465, and 28577 m respectively. Furthermore, with 3300 vehicles, TLBO-CC method yielded a low TDC of 32047 m, whereas ACO, EACO, MACO, and HAPO schemes achieved enhanced TDC values namely, 34946, 44422, 49271, and 43659 m correspondingly. Moreover, with 4500 vehicles, the proposed TLBO-CC method produced a reduced TDC of 40657 m, whereas ACO, EACO, MACO, and HAPO algorithms accomplished the maximum TDC values such as 43048, 55976, 61569, and 55319 m correspondingly.

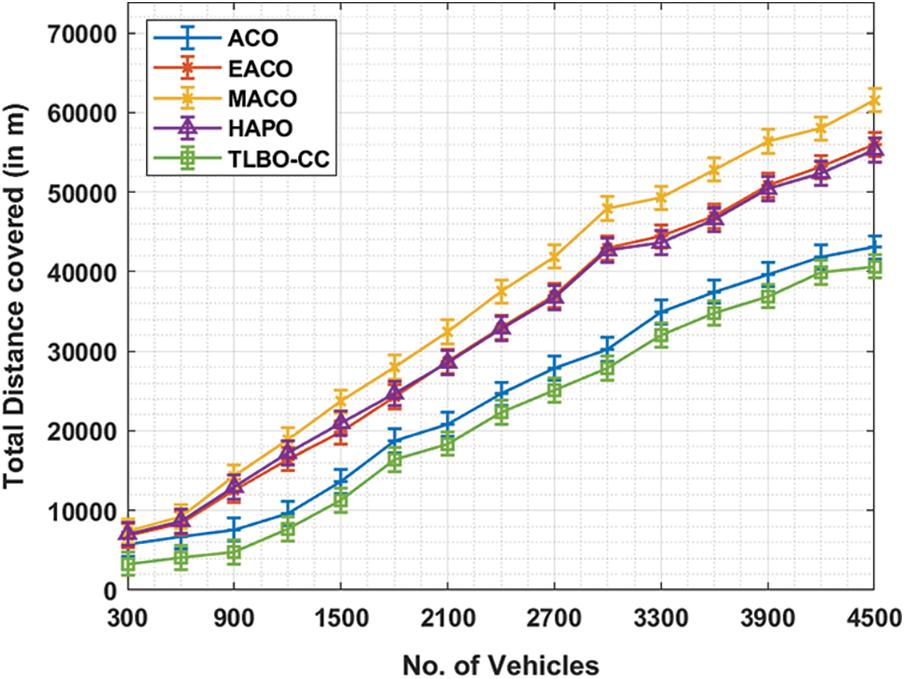
Figure 3: TDC analysis of TLBO-CC model under different counts of vehicles
Tab. 2 and Fig. 4 shows the results from Total Travel Time (TTT) analysis achieved by the proposed TLBO-CC technique against recent methods under varying number of vehicles. The results show that the proposed TLBO-CC algorithm outperformed other methods and produced effective outcomes with the least TTT under varying vehicle counts. For sample, with 300 vehicles, TLBO-CC approach resulted in a reduced TTT of 279 s, whereas ACO, EACO, MACO, and HAPO methods accomplished enhanced TTT values such as 578, 564, 513, and 498 s respectively. Similarly, with 1200 vehicles, TLBO-CC technique produced a low TTT of 773 s, whereas ACO, EACO, MACO, and HAPO methods accomplished superior TTT values such as 1328, 1115, 1303, and 1027 s respectively. Likewise, with 2100 vehicles, TLBO-CC technique achieved a low TTT of 1339 s, whereas ACO, EACO, MACO, and HAPO approaches offered increased TTT values such as 2147, 1892, 2034, and 1634 s respectively. In addition to these, with 3300 vehicles, TLBO-CC method resulted in a decreased TTT value of 1808 s, whereas ACO, EACO, MACO, and HAPO techniques produced high TTT values such as 3109, 2450, 2718, and 2162 s respectively. Finally, with 4500 vehicles, the proposed TLBO-CC method accomplished a low TTT of 2404 s, whereas ACO, EACO, MACO, and HAPO approaches obtained high TTT values namely, 3841, 2935, 3547, and 2743 s correspondingly.

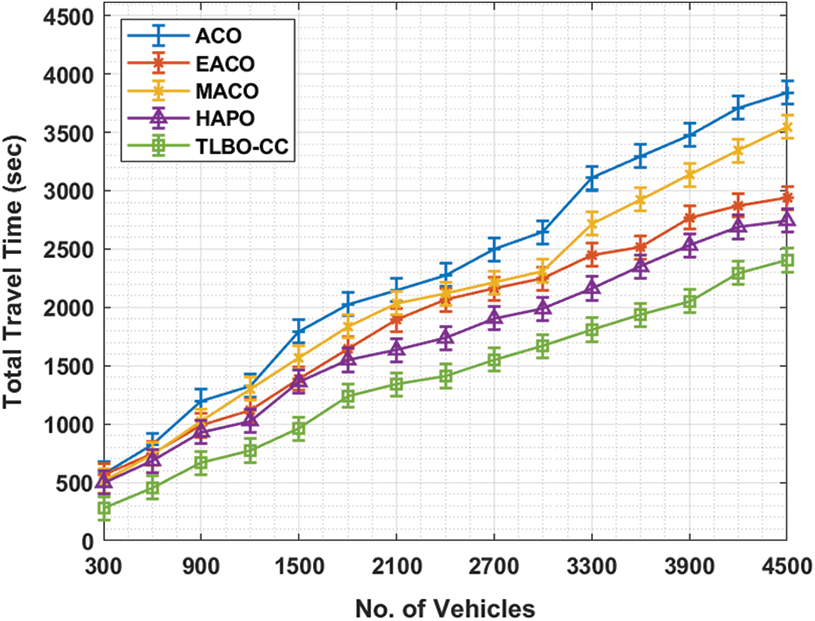
Figure 4: TTT analysis of TLBO-CC model under different counts of vehicles
Tab. 3 and Fig. 5 shows the results of Prediction Variance (PV) analysis accomplished by IDoS-CC technique against state-of-the-art algorithms under varying prediction intervals in 100 nodes. The results demonstrate that the proposed IDoS-CC algorithm accomplished effective outcomes with the worst PV under different vehicle counts. For instance, with 10 intervals, the IDoS-CC method produced a low PV of 154.08 s, whereas CA-PSO, CA-GA, CA-ACOS, and CA-IACOA methods achieved the highest PV values namely, 170.36, 169.90, 167.42, and 156.34 s correspondingly.

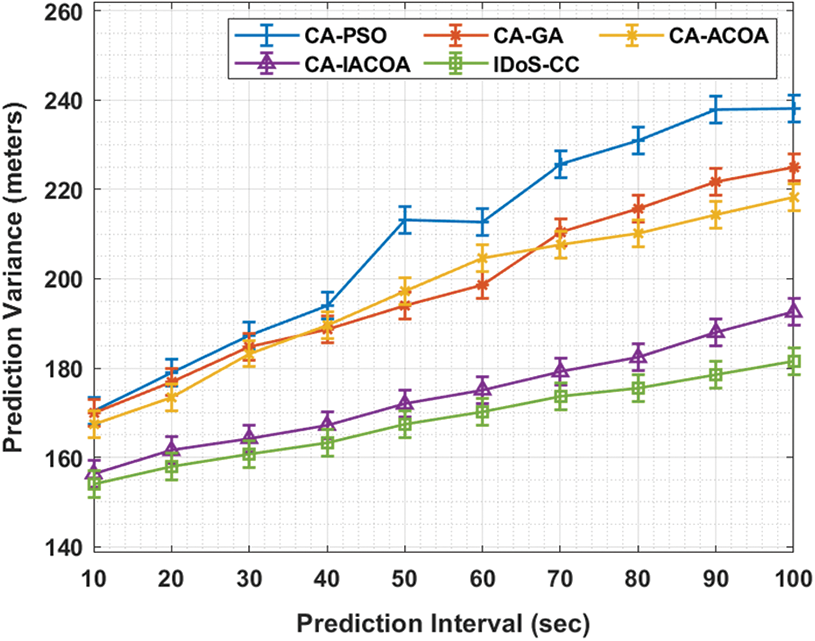
Figure 5: Prediction variance analysis results of IDoS-CC model under 100-nodes
Likewise, with 30 intervals, IDoS-CC technique produced a reduced PV value of 160.64 s, whereas CA-PSO, CA-GA, CA-ACOS, and CA-IACOA techniques offered increased PV values such as 187.31, 184.82, 183.24, and 164.25 s respectively. Also, with 50 intervals, the proposed IDOS-CC technique resulted in a reduced PV value of 167.42 s, whereas CA-PSO, CA-GA, CA-ACOS, and CA-IACOA algorithms accomplished enhanced PV values namely, 213.08, 197.26, 171.94, and 167.42 s respectively. In addition to these, with 70 intervals, IDoS-CC technique resulted in a reduced PV value of 173.75 s, whereas other techniques namely, CA-PSO, CA-GA, CA-ACOS, and CA-IACOA achieved high PV values such as 225.52, 210.37, 207.66, and 179.17 s respectively. Eventually, with 100 intervals, IDoS-CC technique produced a less PV value of 181.43 s, whereas CA-PSO, CA-GA, CA-ACOS, and CA-IACOA methodologies obtained improved PV values namely, 238.17, 224.84, 218.28, and 192.51 s correspondingly.
Tab. 4 and Fig. 6 shows the results of PV analysis attained by IDoS-CC method against recent algorithms under varying prediction intervals in 200 nodes. The results showcase that IDoS-CC manner accomplished effectual outcomes with the least PV under varying vehicle counts. For instance, with 10 intervals, IDoS-CC technique produced a less PV of 155.79 s, whereas CA-PSO, CA-GA, CA-ACOS, and CA-IACOA techniques achieved high PV values namely, 170.66 s, 168.89 s, 189.28 s, and 161.79 s correspondingly. Followed by, with 30 intervals, IDoS-CC technique resulted in a reduced PV value of 160.62 s, whereas CA-PSO, CA-GA, CA-ACOS, and CA-IACOA algorithms presented superior PV values namely, 187.28, 184.40, 203.91, and 167.56 s correspondingly. Along with these, with 50 intervals, the proposed IDOS-CC technique resulted in a reduced PV value of 165.81 s, whereas CA-PSO, CA-GA, CA-ACOS, and CA-IACOA methods obtained improved PV values such as 212.99, 194.60, 209.89, and 175.76 s correspondingly. Furthermore, with 70 intervals, the proposed IDoS-CC algorithm accomplished a low PV value of 175.88 s, whereas CA-PSO, CA-GA, CA-ACOS, and CA-IACOA techniques offered the maximum PV values namely, 225.85, 210.78, 217.87, and 182.85 s respectively. At the same time, with 100 intervals, IDoS-CC method resulted in a reduced PV value of 189.13 s, whereas CA-PSO, CA-GA, CA-ACOS, and CA-IACOA approaches accomplished high PV values such as 238.04, 224.52, 244.91, and 197.04 s correspondingly.

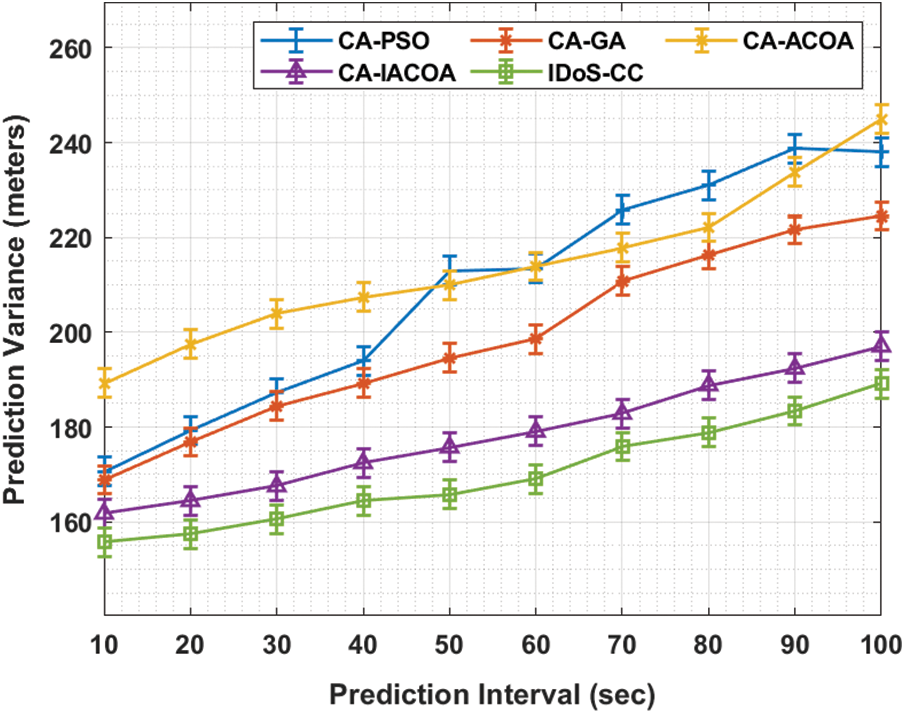
Figure 6: Prediction variance analysis of IDoS-CC model under 200-nodes
Fig. 7 shows the results of PV analysis accomplished by IDoS-CC method against other state-of-the-art approaches under varying prediction intervals in 100 nodes. The results portray that the proposed IDoS-CC approach accomplished an effectual outcome with the least PV under distinct vehicle counts. For instance, with 10 intervals, the proposed IDoS-CC technique resulted in a low PV of 5.24 s, whereas other techniques such as CA-PSO, CA-GA, CA-ACOS, and CA-IACOA accomplished increased PV values namely, 5.80, 5.71, 5.53, and 5.37 s correspondingly. Moreover, with 30 intervals, IDoS-CC technique achieved a low PV of 5.22 s, whereas CA-PSO, CA-GA, CA-ACOS, and CA-IACOA techniques offered the maximum PV values such as 5.62, 5.64, 5.45, and 5.27 s respectively. Similarly, with 50 intervals, the proposed IDOS-CC technique resulted in a reduced PV value of 5.15 s, whereas CA-PSO, CA-GA, CA-ACOS, and CA-IACOA techniques achieved increased PV values namely, 5.48, 5.54, 5.36, and 5.22 s respectively. Besides, with 70 intervals, IDoS-CC method resulted in a reduced PV value of 5.11 s, whereas CA-PSO, CA-GA, CA-ACOS, and CA-IACOA techniques accomplished high PV values namely, 5.44, 5.46, 5.29, and 5.16 s correspondingly. Likewise, with 100 intervals, the IDoS-CC technique resulted in a reduced PV value of 4.74 s, whereas CA-PSO, CA-GA, CA-ACOS, and CA-IACOA techniques achieved high PV values such as 5.36, 5.36, 5.21, and 4.98 s correspondingly.
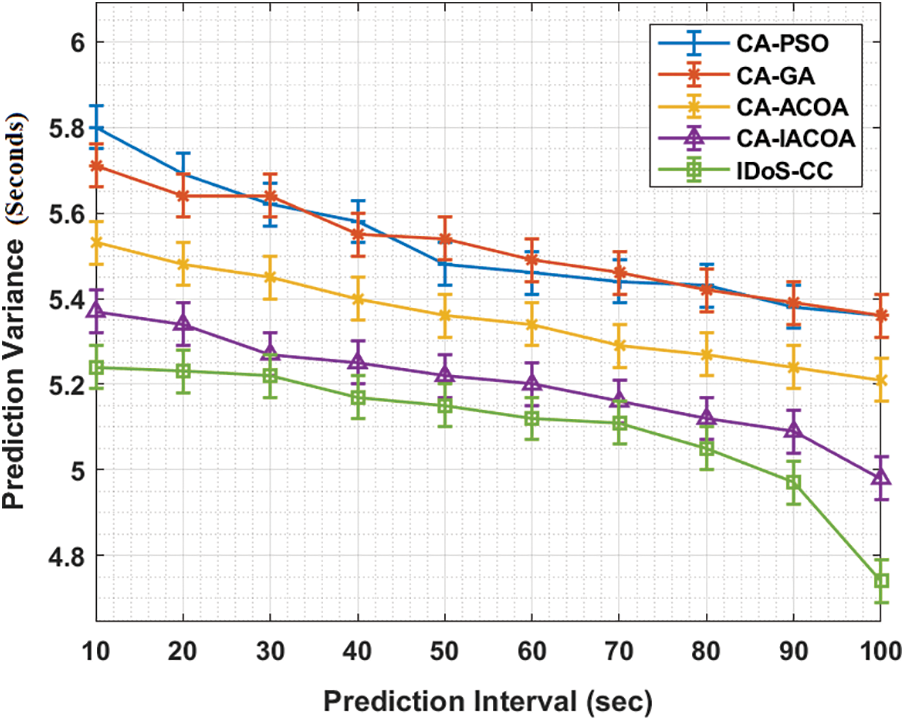
Figure 7: Prediction variance analysis of IDoS-CC model under 100-nodes
Tab. 5 explores the results accomplished during PV analysis by IDoS-CC technique against recent algorithms under different prediction intervals in 200 nodes. The results show that the proposed IDoS-CC method outperformed other methods through its effectual outcomes with the least PV under distinct vehicle counts.

For instance, with 10 intervals, the proposed IDoS-CC technique resulted in a reduced PV value of 5.15 s, whereas CA-PSO, CA-GA, CA-ACOS, and CA-IACOA techniques accomplished high PV values namely, 5.60, 5.70, 5.50, and 5.22 s correspondingly. Followed by, with 30 intervals, the IDoS-CC method produced a low PV of 5.09 s, whereas CA-PSO, CA-GA, CA-ACOS, and CA-IACOA techniques achieved improved PV values such as 5.45, 5.61, 5.40, and 5.18 s respectively. Also, with 50 intervals, the proposed IDOS-CC technique resulted in a low PV value of 5.04 s, whereas CA-PSO, CA-GA, CA-ACOS, and CA-IACOA schemes offered increased PV values namely, 5.40, 5.51, 5.31, and 5.13 s respectively. Likewise, with 70 intervals, IDoS-CC technique attained a low PV of 4.97 s, whereas CA-PSO, CA-GA, CA-ACOS, and CA-IACOA techniques obtained high PV values such as 5.34, 5.42, 5.23, and 5.04 s correspondingly. Eventually, with 100 intervals, the proposed IDoS-CC technique resulted in a reduced PV of 4.78 s, whereas CA-PSO, CA-GA, CA-ACOS, and CA-IACOA techniques offered high PV values namely, 5.23, 5.31, 5.15, and 4.85 s correspondingly. A series of simulation analyses was conducted and the results are discussed above which highlight the better outcomes of IDoS-CC technique. The proposed technique reduced the congestion and successfully identified DoS attacks in the network.
In current research work, a new IDoS-CC approach is designed for VANET. The goal of the proposed IDoS-CC technique is to reduce the level of congestion and detect the attacks that exist in the network. It includes two-stage processes namely TLBO-CC based congestion control and GRU-DoSD based attack detection. IDoS-CC technique includes TLBO algorithm to optimize the routes taken by vehicles via traffic signals and to minimize the congestion instantaneously on a particular route so as to assure minimal fuel utilization. TLBO is applied to avoid congestion on roadways. Besides, GRU-DoSD model is also employed as a classification model to effectively distinguish the compromised as well as genuine vehicles in the network. A series of simulation analyses was conducted and the outcomes illustrate the supremacy of the proposed IDoS-CC technique. The proposed method reduced the congestion and successfully identified DoS attacks in the network. In future, the hyperparameter tuning of the GRU model can be derived by multi-objective TLBO algorithm in order to improve detection accuracy.
Funding Statement: The authors extend their appreciation to the Deanship of Scientific Research at King Khalid University for funding this work under grant number (RGP 2/23/42). This research was funded by the Deanship of Scientific Research at Princess Nourah bint Abdulrahman University through the Fast-Track Research Funding Program.
Conflicts of Interest: The authors declare that they have no conflicts of interest to report regarding the present study.
1. S. K. Erskine and K. M. Elleithy, “Real-time detection of dos attacks in ieee 802.11p using fog computing for a secure intelligent vehicular network,” Electronics, vol. 8, no. 7, pp. 776, 2019. [Google Scholar]
2. D. Gupta, A. Khanna, S. K. Lakshmanaprabu, K. Shankar, V. Furtado et al., “Efficient artificial fish swarm based clustering approach on mobility aware energy-efficient for MANET,” Transactions on Emerging Telecommunications Technologies, vol. 30, no. 9, pp. 1–10, 2019. [Google Scholar]
3. S. Sharma and A. Kaul, “A survey on intrusion detection systems and honeypot based proactive security mechanisms in VANETs and VANET cloud,” Vehicular Communications, vol. 12, pp. 138–164, 2018. [Google Scholar]
4. I. V. Pustokhina, D. A. Pustokhin, E. L. Lydia, M. Elhoseny and K. Shankar, “Energy efficient neuro-fuzzy cluster based topology construction with metaheuristic route planning algorithm for unmanned aerial vehicles,” Computer Networks, vol. 196, pp. 108214, 2021. [Google Scholar]
5. C. Campolo and A. Molinaro, “Multichannel communications in vehicular Ad Hoc networks: A survey,” IEEE Communications Magazine, vol. 51, no. 5, pp. 158–169, 2013. [Google Scholar]
6. T. Vaiyapuri, S. N. Mohanty, M. Sivaram, I. V. Pustokhina, D. A. Pustokhin et al. “Automatic vehicle license plate recognition using optimal deep learning model,” Computers, Materials & Continua, vol. 67, no. 2, pp. 1881–1897, 2021. [Google Scholar]
7. K. D. Thilak and A. Amuthan, “Cellular automata-based improved ant colony-based optimization algorithm for mitigating ddos attacks in vanets,” Future Generation Computer Systems, vol. 82, pp. 304–314, 2018. [Google Scholar]
8. S. Manne, E. L. Lydia, I. V. Pustokhina, D. A. Pustokhin, V. S. Parvathy et al. “An intelligent energy management and traffic predictive model for autonomous vehicle systems,” Soft Computing, vol. 25, pp. 11941–11953, 2021. [Google Scholar]
9. A. Rajagopal, G. P. Joshi, A. Ramachandran, R. T. Subhalakshmi, M. Khari et al. “A deep learning model based on multi-objective particle swarm optimization for scene classification in unmanned aerial vehicles,” IEEE Access, vol. 8, pp. 135383–135393, 2020. [Google Scholar]
10. E. Khoza, C. Tu and P. Owolawi, “Decreasing traffic congestion in vanets using an improved hybrid ant colony optimization algorithm,” Journal of Communications, vol. 15, no. 9, pp. 676–686, 2020. [Google Scholar]
11. V. Jindal and P. Bedi, “Preemptive maco (maco-p) algorithm for reducing travel time in vanets,” Applied Artificial Intelligence, vol. 31, no. 2, pp. 174–196, 2017. [Google Scholar]
12. S. K. Erskine and K. M. Elleithy, “Real-time detection of dos attacks in ieee 802.11p using fog computing for a secure intelligent vehicular network,” Electronics, vol. 8, no. 7, pp. 776, 2019. [Google Scholar]
13. H. Chang, Y. E. Song, H. Kim and H. Jung, “Distributed transmission power control for communication congestion control and awareness enhancement in VANETs,” PLoS ONE, vol. 13, no. 9, pp. e0203261, Sep. 2018. [Google Scholar]
14. A. K. Sangaiah, J. S. Ramamoorthi, J. J. P. C. Rodrigues, M. A. Rahman, G. Muhammad et al. “LACCVoV: Linear adaptive congestion control with optimization of data dissemination model in vehicle-to-vehicle communication,” IEEE Transactions on Intelligent Transportation Systems, pp. 1–10, 2020. [Google Scholar]
15. P. M. Kumar, U. Devi, G. Manogaran, R. Sundarasekar, N. Chilamkurti et al. “Ant colony optimization algorithm with internet of vehicles for intelligent traffic control system,” Computer Networks, vol. 144, pp. 154–162, 2018. [Google Scholar]
16. F. Lyu, N. Cheng, H. Zhou, W. Xu, W. Shi et al., “DBCC: Leveraging link perception for distributed beacon congestion control in vanets,” IEEE Internet Things Journal, vol. 5, no. 6, pp. 4237–4249, 2018. [Google Scholar]
17. M. Selvi and B. Ramakrishnan, “Lion optimization algorithm (LOA)-based reliable emergency message broadcasting system in VANET,” Soft Computing, vol. 24, no. 14, pp. 10415–10432, 2020. [Google Scholar]
18. M. Singh, B. K. Panigrahi and A. R. Abhyankar, “Optimal coordination of directional over-current relays using teaching learning-based optimization (TLBO) algorithm,” International Journal of Electrical Power & Energy Systems, vol. 50, pp. 33–41, 2013. [Google Scholar]
19. M. H. Jeong, T. Y. Lee, S. B. Jeon and M. Youm, “Highway speed prediction using gated recurrent unit neural networks,” Applied Sciences, vol. 11, no. 7, pp. 3059, 2021. [Google Scholar]
20. G. Bargshady, X. Zhou, R. C. Deo, J. Soar, F. Whittaker et al., “The modeling of human facial pain intensity based on temporal convolutional networks trained with video frames in hsv color space,” Applied Soft Computing, vol. 97, pp. 106805, 2020. [Google Scholar]
 | This work is licensed under a Creative Commons Attribution 4.0 International License, which permits unrestricted use, distribution, and reproduction in any medium, provided the original work is properly cited. |