DOI:10.32604/cmc.2022.023418
| Computers, Materials & Continua DOI:10.32604/cmc.2022.023418 | |
| Article |
COVID-19 Severity Prediction Using Enhanced Whale with Salp Swarm Feature Classification
1Singidunum University, Belgrade, 11000, Serbia
2Department of Electronics and Communication Engineering, Amrita School of Engineering, Amrita Vishwa Vidyapeetham, Coimbatore, 641112, India
3Department of Applied Cybernetics, Faculty of Science, University of Hradec Králové, Hradec Králové, 50003, Czech Republic
*Corresponding Author: Nebojsa Bacanin. Email: nbacanin@singidunum.ac.rs
Received: 07 September 2021; Accepted: 06 January 2022
Abstract: Computerized tomography (CT) scans and X-rays play an important role in the diagnosis of COVID-19 and pneumonia. On the basis of the image analysis results of chest CT and X-rays, the severity of lung infection is monitored using a tool. Many researchers have done in diagnosis of lung infection in an accurate and efficient takes lot of time and inefficient. To overcome these issues, our proposed study implements four cascaded stages. First, for pre-processing, a mean filter is used. Second, texture feature extraction uses principal component analysis (PCA). Third, a modified whale optimization algorithm is used (MWOA) for a feature selection algorithm. The severity of lung infection is detected on the basis of age group. Fourth, image classification is done by using the proposed MWOA with the salp swarm algorithm (MWOA-SSA). MWOA-SSA has an accuracy of 97%, whereas PCA and MWOA have accuracies of 81% and 86%. The sensitivity rate of the MWOA-SSA algorithm is better that of than PCA (84.4%) and MWOA (95.2%). MWOA-SSA outperforms other algorithms with a specificity of 97.8%. This proposed method improves the effective classification of lung affected images from large datasets.
Keywords: PCA; WOA; CT-image; lung infection; COVID-19
COVID-19 is a virus infection that has changed human life in various aspects including finance, education, health care, and supply chains. People with COVID-19 infection are facing respiratory problems and can recover with appropriate treatment effectively [1]. Many studies have been done in implementing classification and determining the presence of COVID-19 as well as in detecting the severity of pneumonia. CT and X-ray image modalities are non-invasive and used to detect and severity of lung infection [2,3]. In this study, we used principal component analysis (PCA) for feature extraction of CT images and a modified whale optimization algorithm (MWOA) for feature selection. To classify COVID-affected images from a large dataset and detect severity using the modified whale optimization algorithm (MWA) with the salp swarm algorithm (MWOA-SSA). The main disadvantage of existing algorithms are inefficiency, high execution time, and maximized error rate. To overcome these issues, our proposed MWOA-SSA has high potential in detecting the severity of lung infections such as pneumonia and classifying COVID-19 in affected and unaffected images from a large dataset effectively and quickly.
To predict coronavirus, X-ray images play a more important role than CT because the former is less sensitive. Furthermore, X-ray images are used to diagnose the early and mild stages of coronavirus patients. CT images are also is used in the diagnosis of coronavirus and improving efficiency in terms of dosage in radiation [4]. To enhance the improvement in scanning images in a sliced manner effectively by using multi-slice computerized tomography (MSCT) [5]. To achieve improvement in larger temporal resolution achieved by dual source CT image [6].
Machine learning algorithms have been used for the last decades in medical applications for computer-based diagnosis, helping physicians diagnose at earlier stages of diseases and providing better customized therapies to patients [7,8]. Approaches to find the best solution from all possible solutions of a particular radiology problem are known as meta-heuristic algorithms. The acceptable best solution of the optimization technique requires less computational effort within a stipulated time [9]. For the feature selection, the proposed MWOA is implemented with a binary optimizer in terms of average select size, error rate, mean, standard deviation, average fitness, best fitness, and worst fitness. The main contributions of this study are as follows,
1. A COVID-19 classification based on proposed algorithms for feature classification of WMOA-SSA is developed.
2. A novel approach in detecting severity of lung infection based on severity level is implemented.
3. The proposed WMOA-SSA can effectively classify the input CT images as COVID-19 or non-COVID-19.
The paper has been organized as follows. Section 2 presents the literature review. Section 3 introduces the classification of COVID-19 images using MWOA-SSA. Section 4 discusses the experimented results. Section 5 concludes the paper and provides future directions.
This section describes the recent literature on feature classification and prediction of coronavirus. COVID-19 has affected human beings in every aspect of their daily lives. To diagnosis the coronavirus disease by using various modalities of image such as CT and X-ray image. Through these images, physicians scan and diagnose at early stages and during disease progression. Many studies have been published on the prediction of coronavirus. Our aim is to achieve effectiveness in classifyingCOVID-19 case images from a large dataset and detect the severity of lung infections such as pneumonia. A previous paper [10] proposed evaluating the infection rate in CT scans of lungs using visual and coronal axes. By using visual inspection COVID-19 disease is used to identify the lung infection [11].
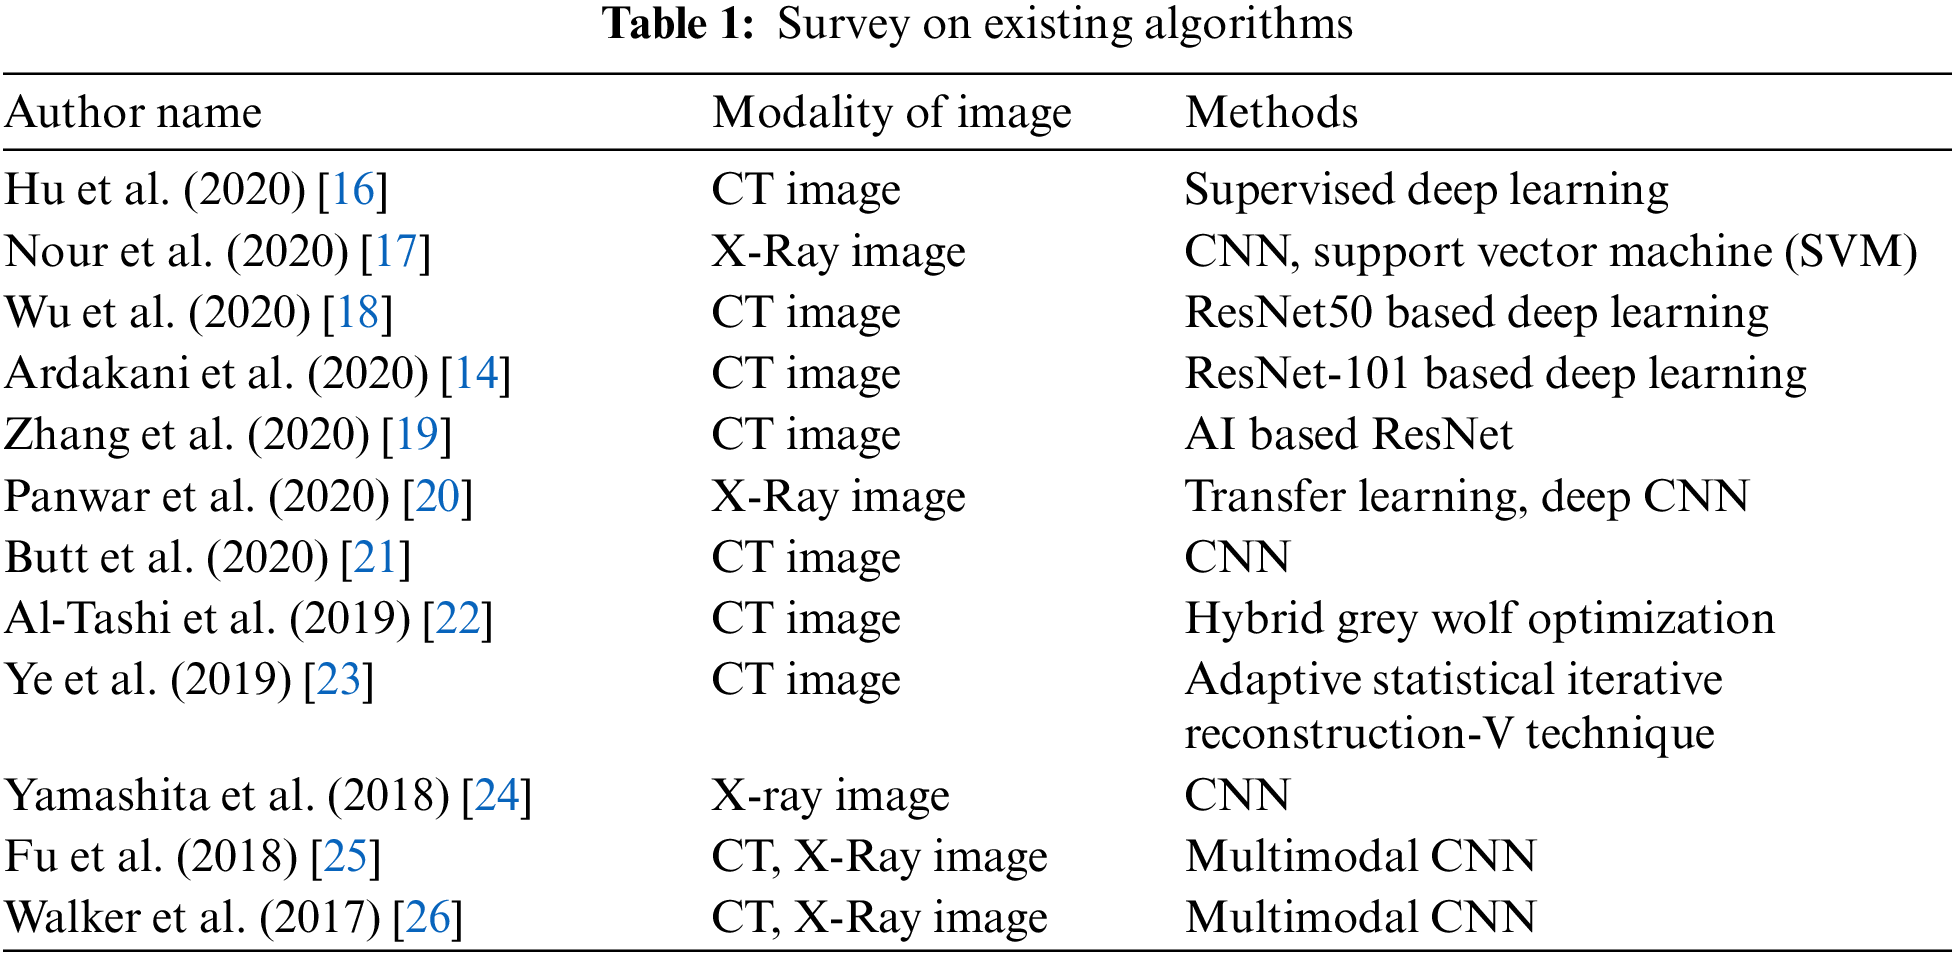
Another paper [12] proposed implementing a visual infection-based method to detect lung infection using lung CT scan. Authors in [13] implemented deep learning algorithms to identify and screen COVID-19 patients using the modality of CT images accurately. By using an artificial intelligence (AI) technique for diagnosis, COVID-19 patients are identified based on convolutional neural network (CNN) using CT slices images, helping accurately classify COVID-19 from non-COVID-19 groups [14]. The machine learning algorithm fractional multichannel exponent moments method is used to extract features from the chest X-ray image and used to classify COVID-19 or non-COVID-19 patients [15]. Tab. 1 shows a summary of recent research work in COVID-19.
3 Enhanced Whale with Salp Swarm Optimization Methodology
This work introduces the concept of classification of affected lung disease and its severity. This proposed work has four stages. First, a median filter is used for pre-processing. Second, PCA is used for texture feature extraction. Third, A MWOA is used for selecting features. Fourth, the proposed MWOA-SSA is used for classification and identifying the severity. The architecture of our proposed method is given in Fig. 1. CT scan images are collected and preprocessed using a median filter. PCA is used to remove unwanted textures in the images. Then, the images are processed using MWOA-SSA to classify the affected image.
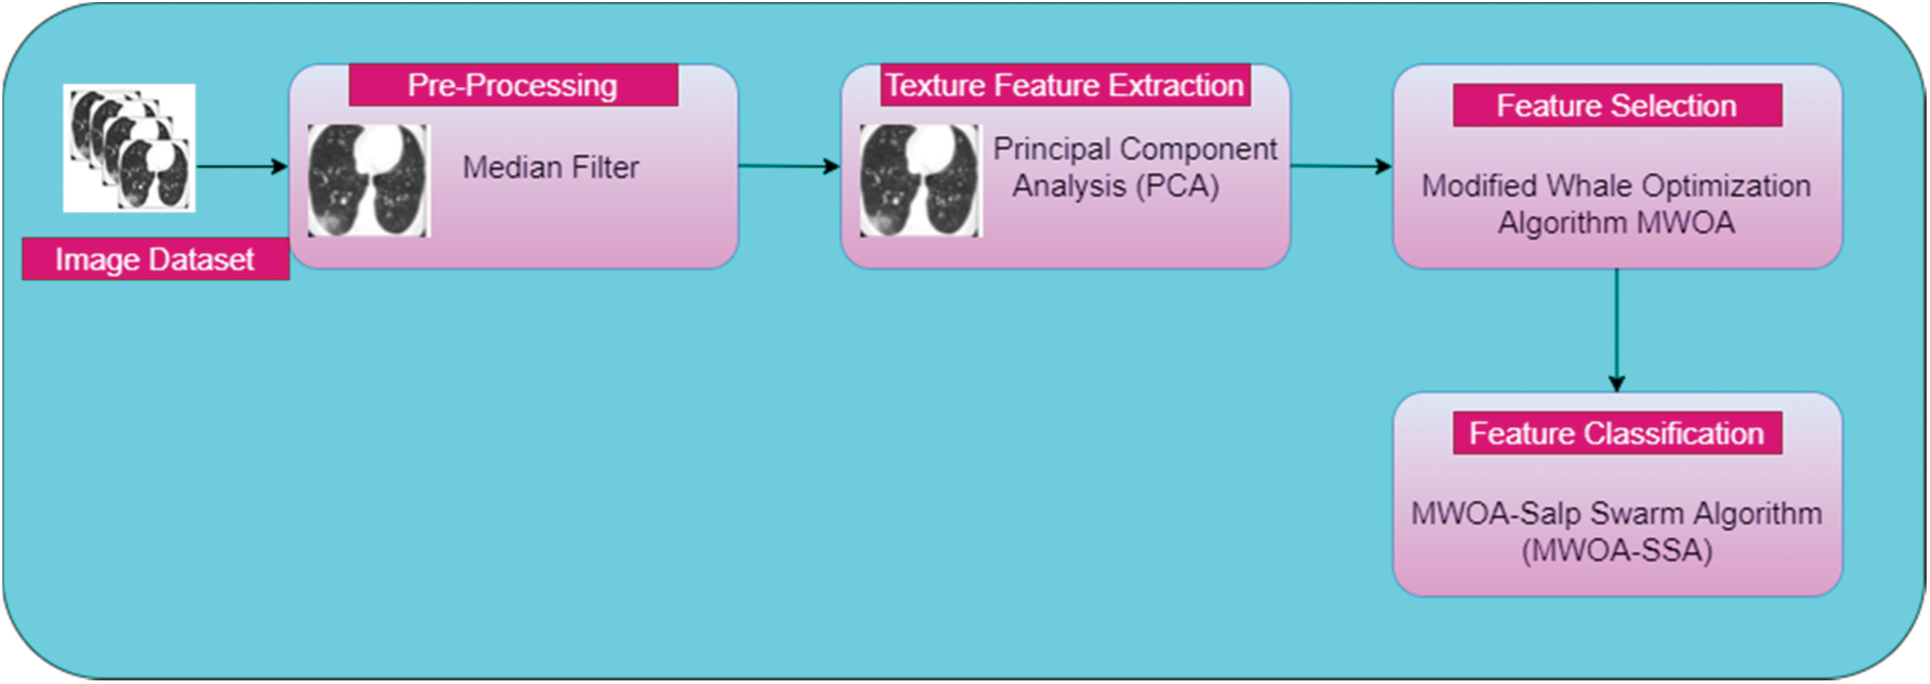
Figure 1: Architecture of proposed work
This proposed work consists of four phases:
Phase 1: Pre-processing using a median filter.
Phase 2: Feature extraction using PCA.
Phase 3: Feature selection using MWOA.
Phase 4: Proposed work on classification of infected lung images from a large dataset using MWOA-SSA.
The aim of pre-processing is to improve the high quality of the CT scan chest image. We need to denoise the image by applying a median filter. This median filter scans the entire image using an
where y is the neighborhood pixel value represented by the user and
3.2 Texture Feature Extraction Using PCA
The idea behind PCA is to map m-dimensional features to n dimensions that have a set of orthogonal feature values. Feature extraction using PCA meets the variance of sample pixel values after reduction of dimensionality and minimizes the error rate. The steps needed for texture feature extraction using PCA are given below, and Fig. 2. Provides an overview of PCA operation.
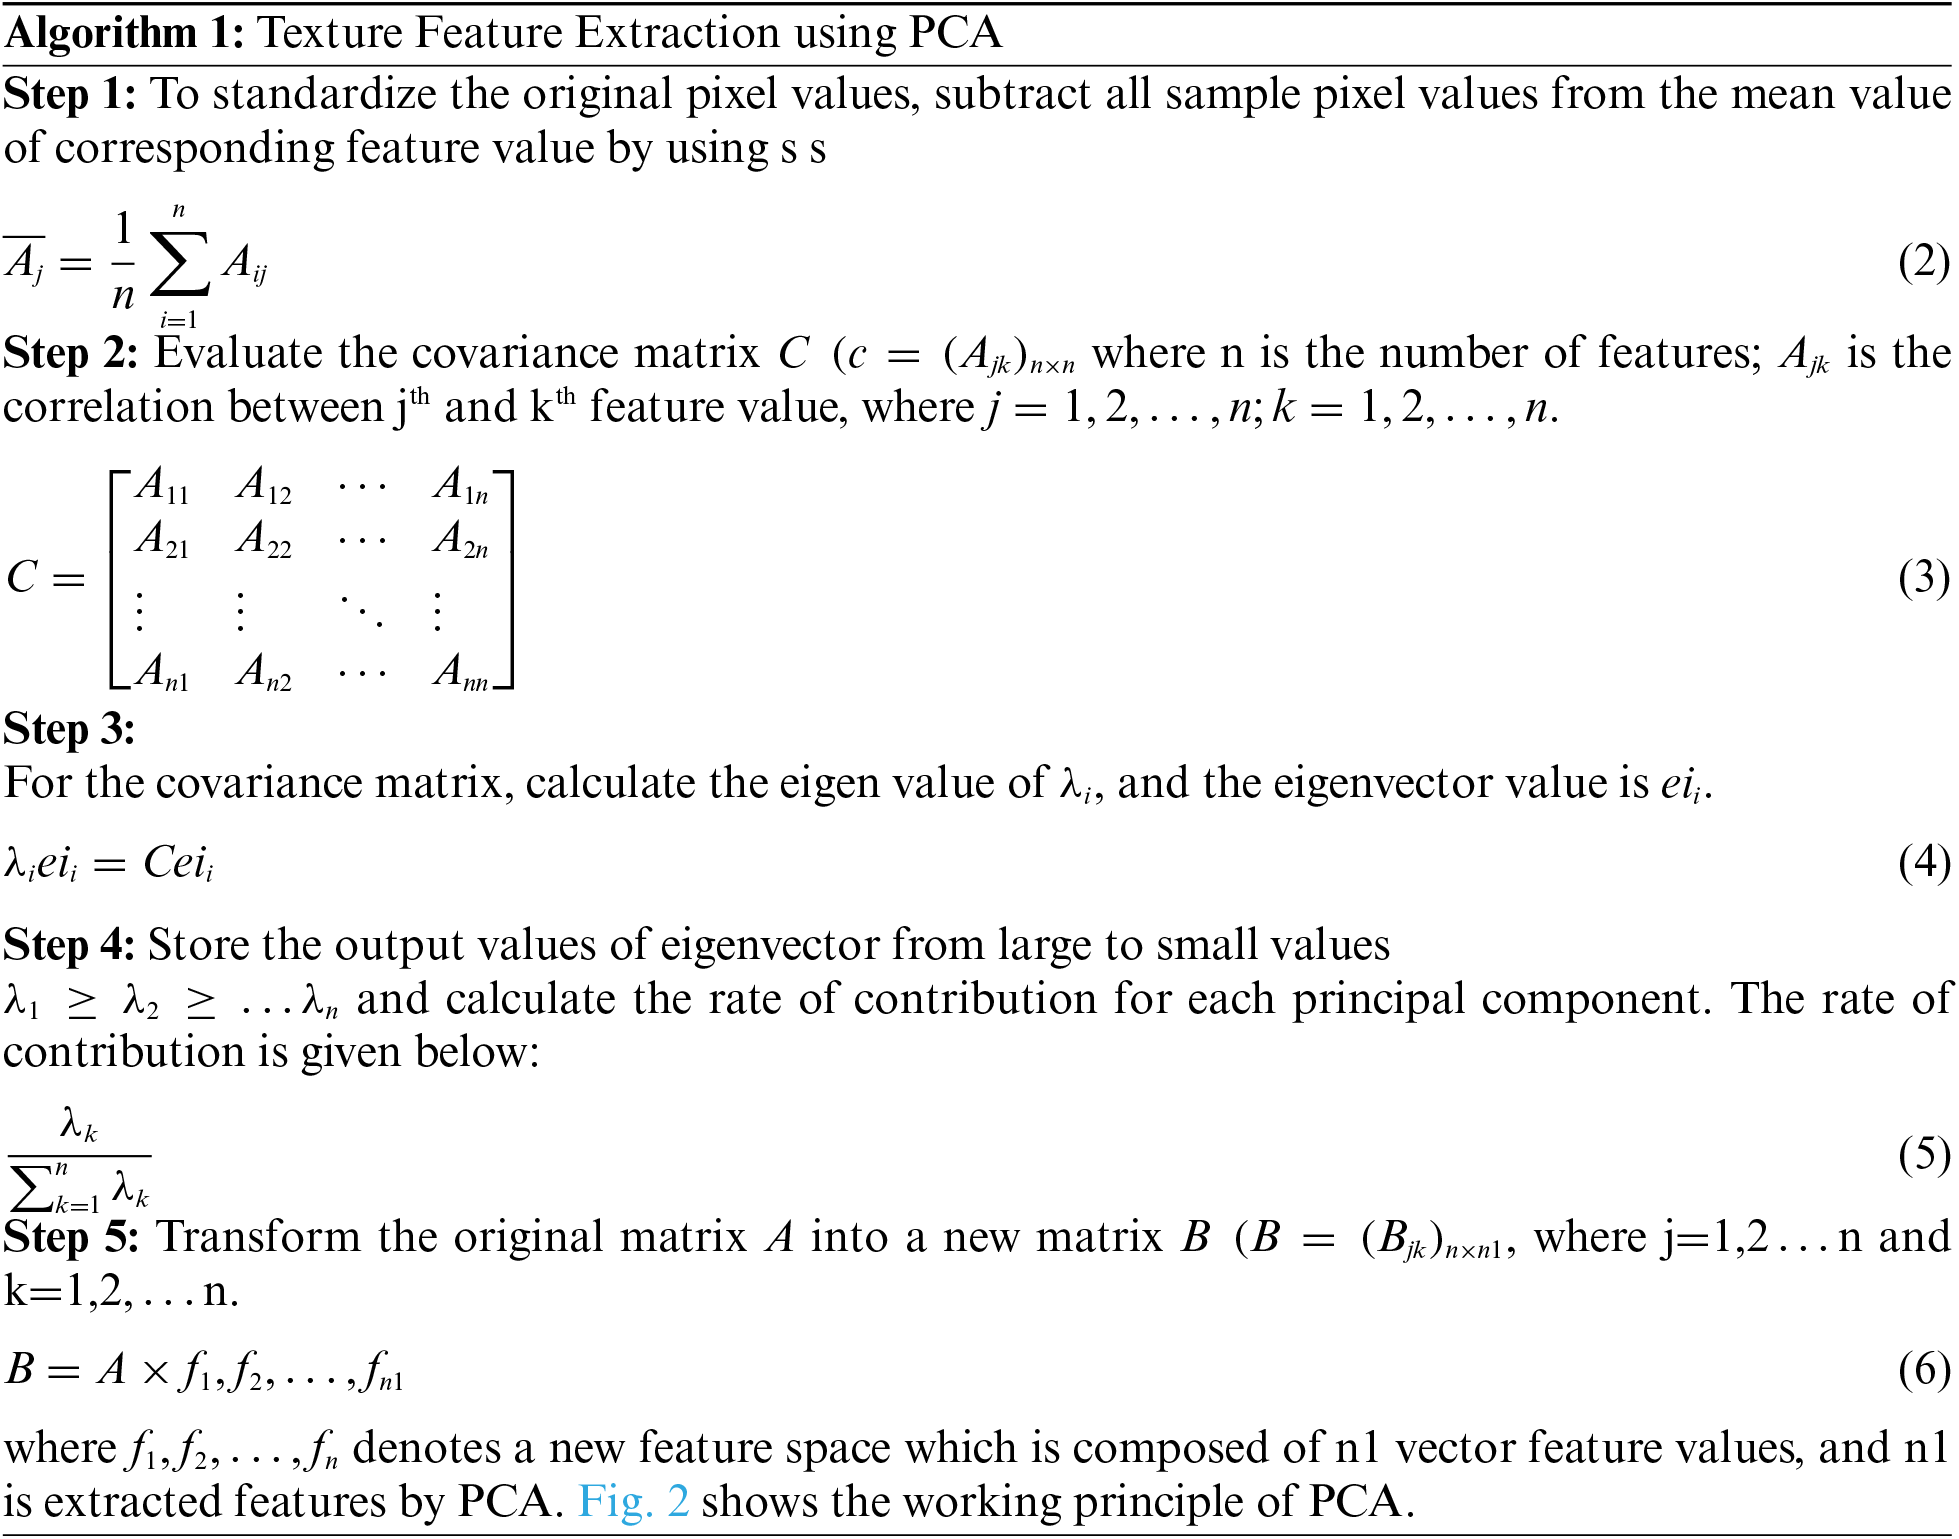
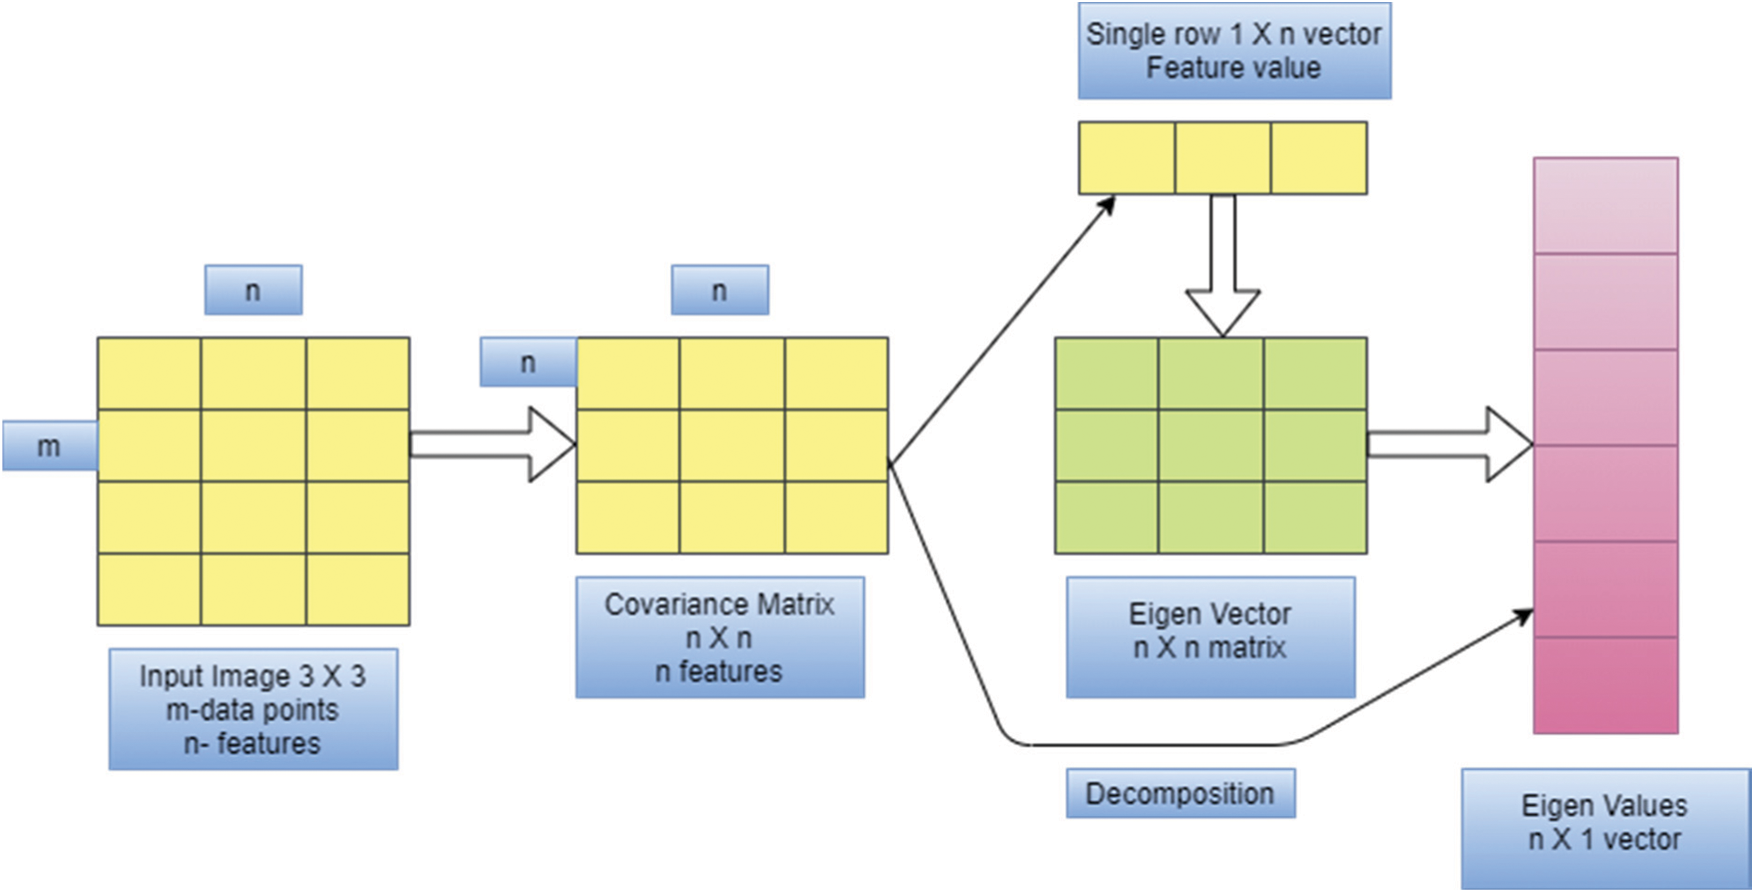
Figure 2: Overview of PCA
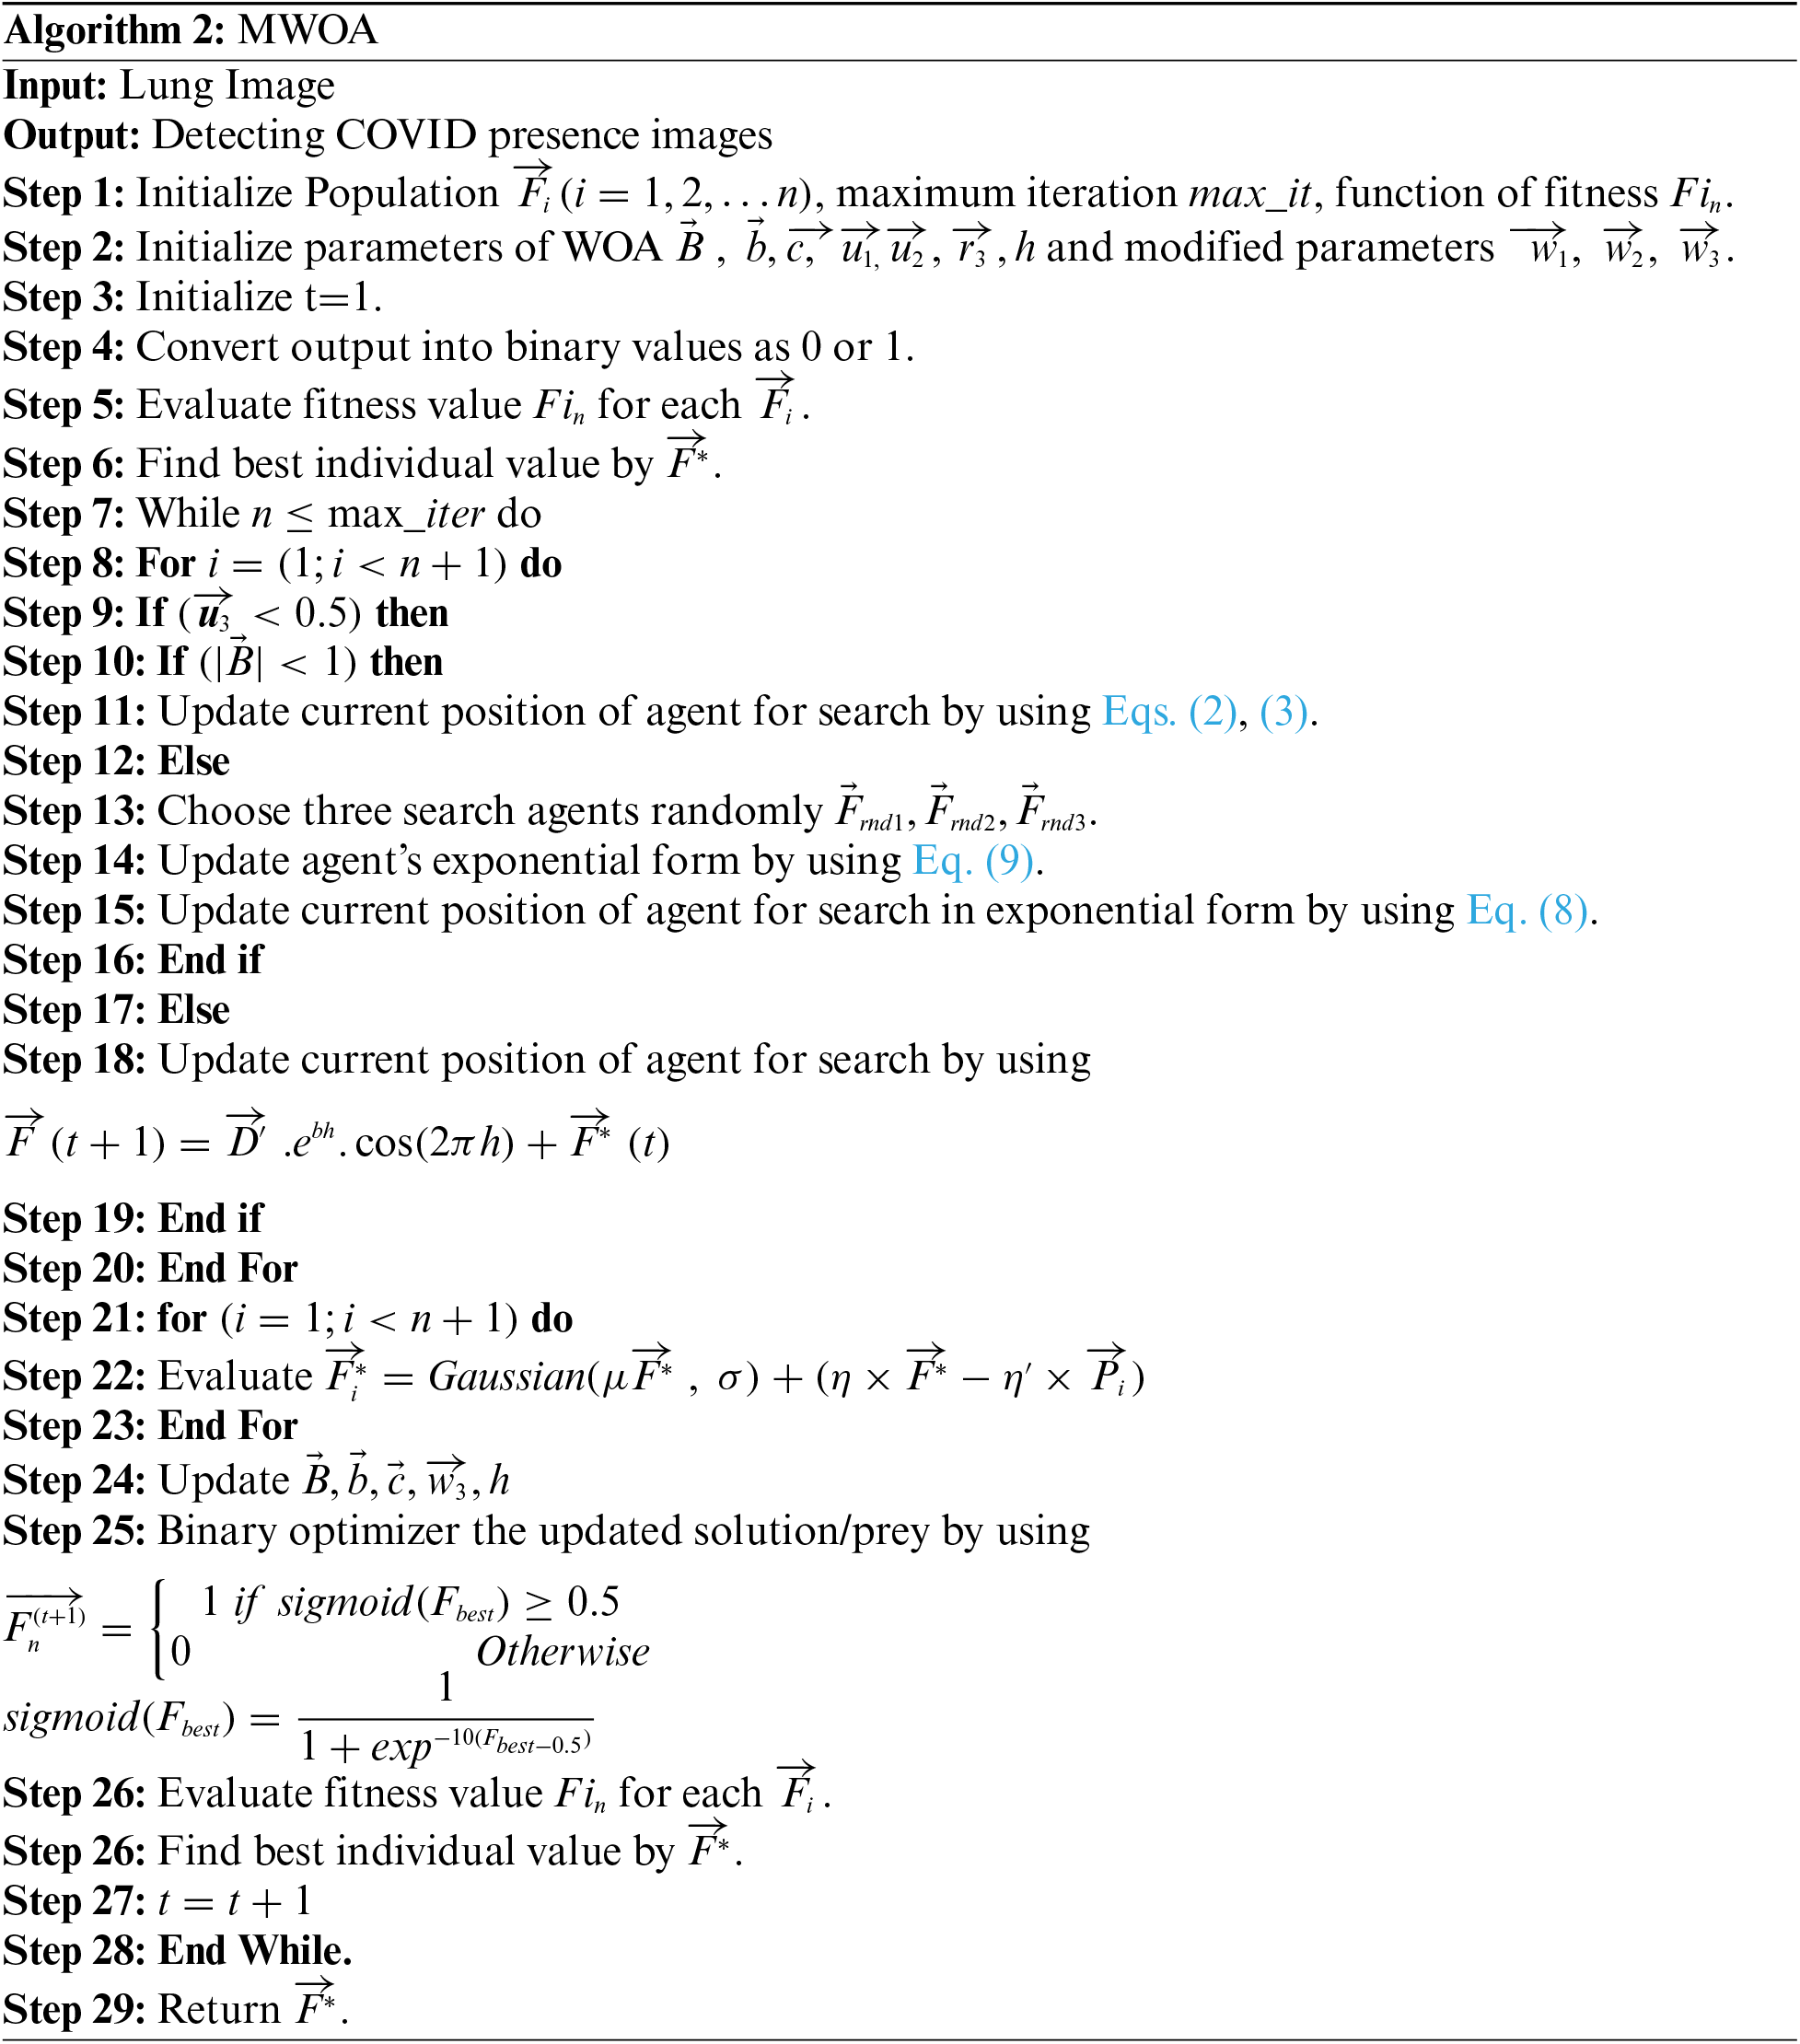
3.3 Feature Selection Using MWOA
Feature selection of brain image using MWOA, which is based on the behavior of whales, in which for trapping the prey bubbles are involved for searching in a spiral-shaped [27,28]. The whale is randomly selected, and it can be updated by the best whale value that gives the optimal solution.
To improve this result, the performance of three whales are randomly chosen, and it cannot be affected by the leader's position. Eq. (6) is modified as follows:
where,
where t represents iteration number, and
The algorithm is given as follows:
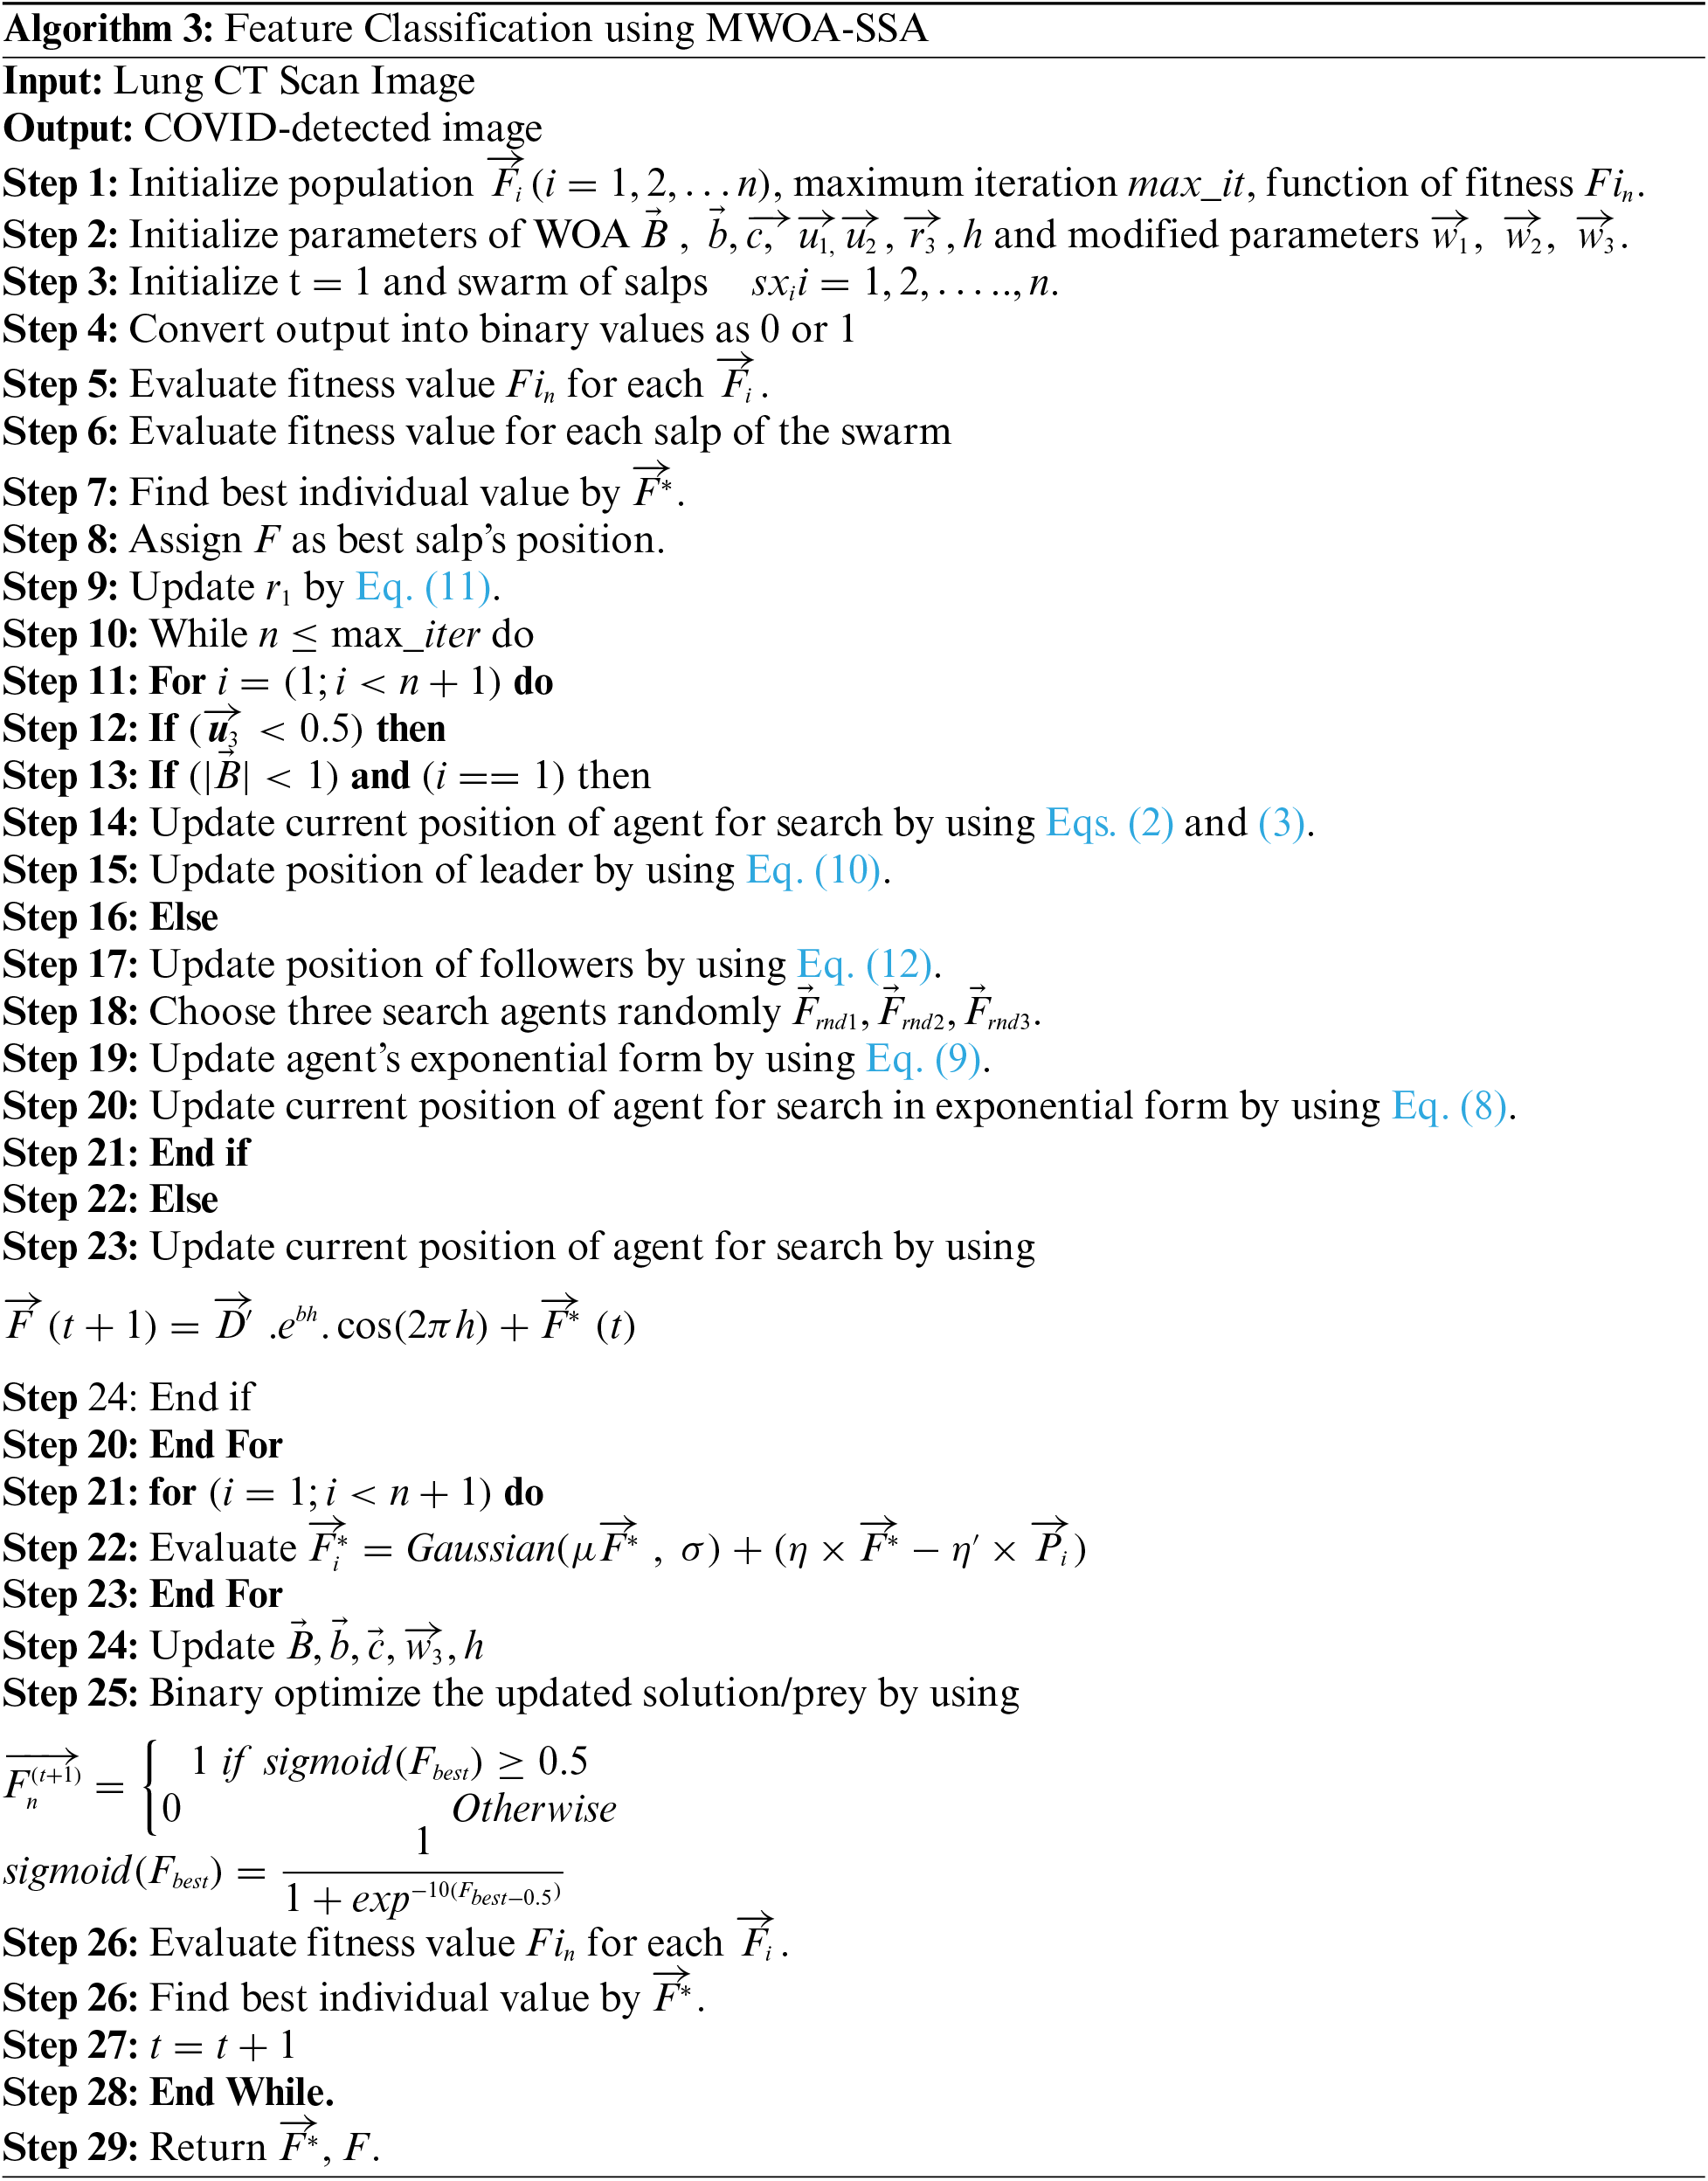
3.4 Proposed Feature Classification Using MWOA-SSA
In this phase, classification of infected lung images from a large dataset is done using MWOA-SSA. To improve the accuracy and optimal solution, the SSA) is used with MWOA. This SSA randomly initializes the swarm of N salps. The swarm is represented by the 2-D matrix
where i is swarm's dimension position, and it is updated.
where
The procedure for SSA is given as follows.
For the experimental result, data are collected from the Kaggle dataset [29], which has 1,500 CT images of COVID-19 and non-COVID 19. MWOA-SSA is compared with the existing algorithms MWOA [30] and SSA [31] by using performance metric measures of sensitivity, specificity, accuracy, precision (PPV), F-score, and negative predictive value (NPV).
These metric measures are defined by using:
Sensitivity
It is also called true positive rate or recall.
Specificity
It is called true negative rate (TNR).
Accuracy
Precision
It is called positive predictive value (PPV).
Negative Predictive Value
It evaluates true negatives for all negative values by using
F-Score
It is used to measure sensitivity and mean of harmonic by using
Tab. 2 shows the performance metric measures of feature extraction.
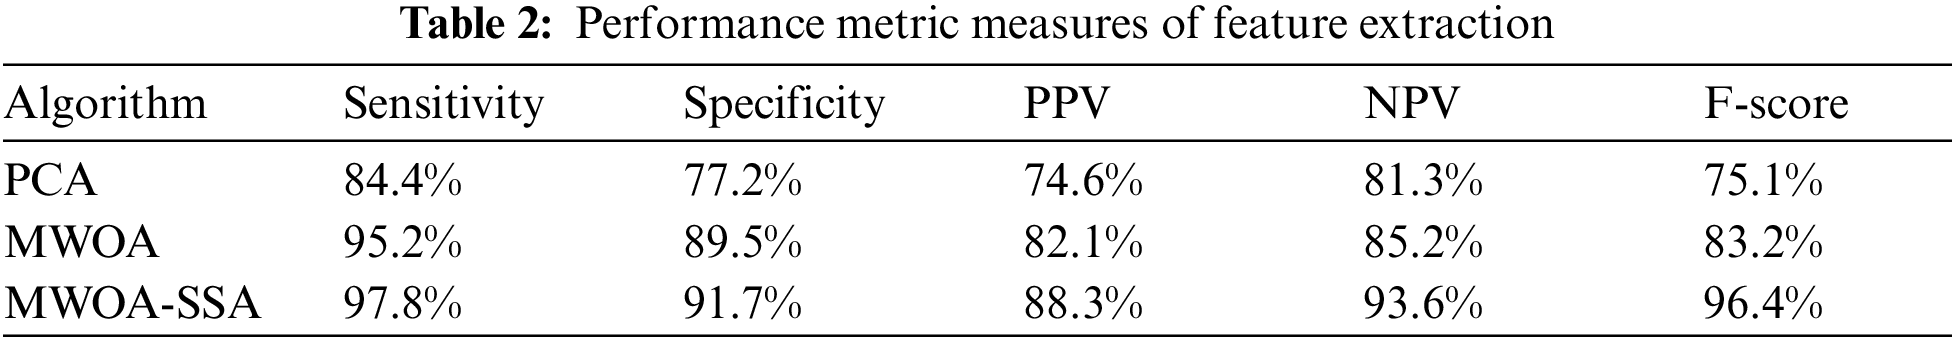
Tab. 2 shows that for the sensitivity rate, MWOA-SSA is better than PCA (84.4%) and MWOA (95.2%). MWOA-SSA outperforms other algorithms with a specificity of 97.8%. For PPV, MWOA-SSA has a percentage of 88.3%. For NPV, MWOA-SSA has 93.6%. MWOA-SAA outperforms other algorithms with an F-score of 96.4%.
MWOA-SSA is used for feature selection, and it is compared with existing algorithms of PCA and MWOA in terms of average fitness, average error, best fitness, mean, standard deviation, and worst fitness. The parameter values for the fitness function are 0.97 and 0.03.
Average Error
It shows the classifier's accuracy for the feature selection for the COVID-19 dataset, and it is calculated by using
where
Mean
Standard Deviation
where mean is obtained from Eq. (17)
Best Fitness
It calculates the minimum function of fitness, and it is calculated as
Average Fitness
The average size of features in the COVID-19 dataset is calculated as
Worst Fitness
The worst solution of fitness is calculated as
Tab. 3 shows the performance of the proposed algorithm in feature selection
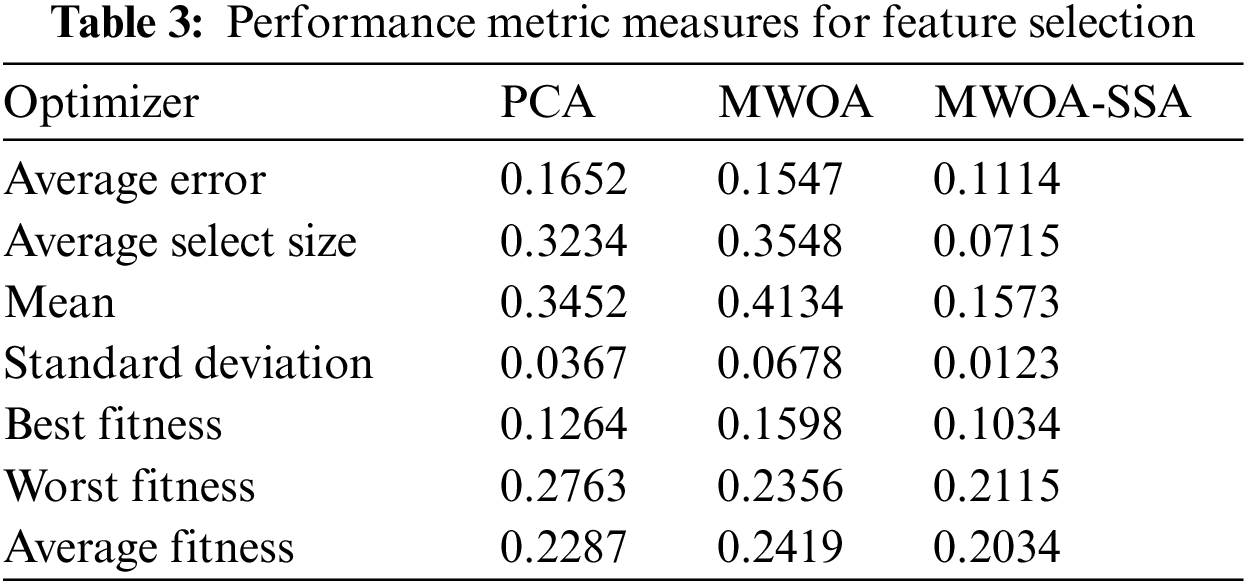
The results of the proposed MWOA-SSA algorithm in Tab. 3 show the lower error and select features from the COVID-19 dataset. The MWOA-SSA algorithm achieved the minimum average error of 0.1114 in selecting the features of infected lung images. The minimum errors for PCA, MWOA, and MWOA-SSA are used to select the features from best fitness to worst fitness. The proposed algorithm MWOA-SSA outperforms other existing algorithms, and the best fitness value is 0.1034, the worst fitness value is 0.2115, and the average fitness value is 0.2034.
4.2 Detection and Severity Classification of COVID-19
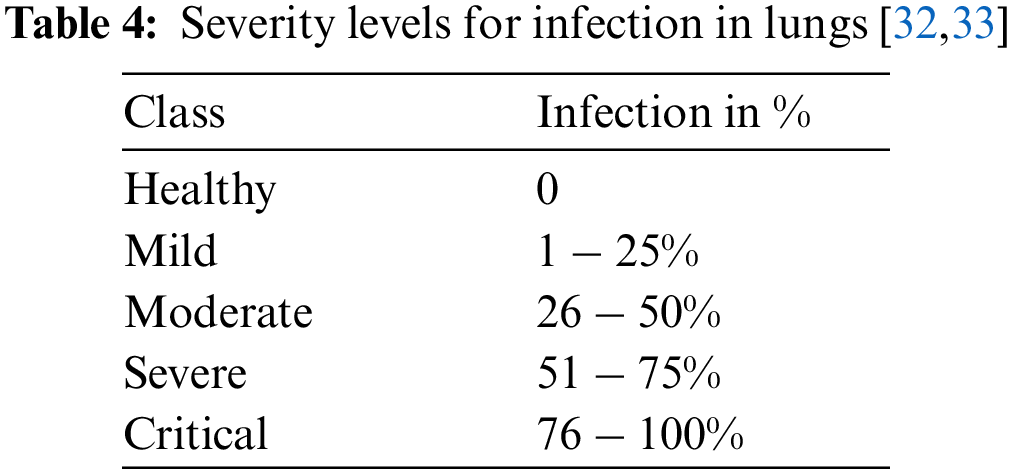
To detect the infection severity, lung images have been examined by using ground truths of CT0–CT4 as given below. Tab. 4 presents the severity levels in the lungs.
In this work, we collected data on 500 patients with COVID-19 infection. Infection was confirmed by a nasopharyngeal swab using a U-TOP COVID-19 Detection Kit. Age, gender, d-dimer, ferritin levels, C-reactive protein test (CRP), and O2 were collected. Patient's age was classified into <20, 21–40, 41–49, 50–60, 61–70, and >70 years. The correlation
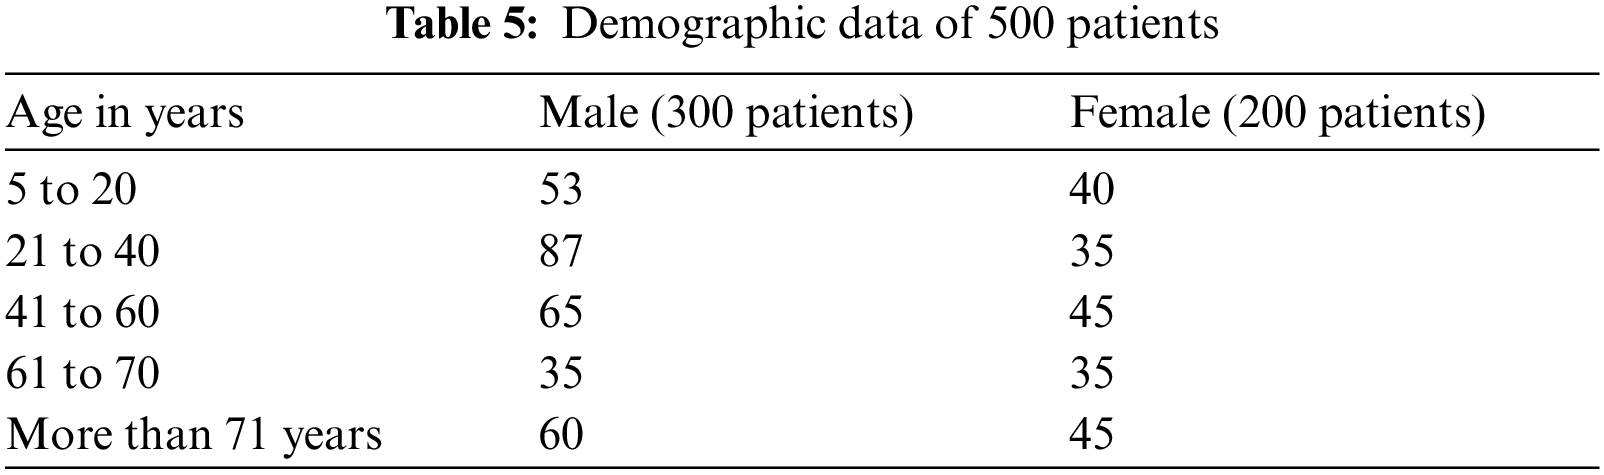
Fig. 3 shows that negative disease was mainly seen in the age group of 21 to 40 (30%), mild lung mainly infection was seen in the 41 to 60 age group (60%). Moderate lung infection was mainly seen in the 61 to 70 age group (68%), and severe lung infection was mainly seen in the age group of 41 to 60 (70%). This is the highest risk factor for COVID-19 affected patients [34–37]. Fig. 4. shows the time taken for the classification of COVID-19 affected cases and non-COVID-19 cases from the large dataset.
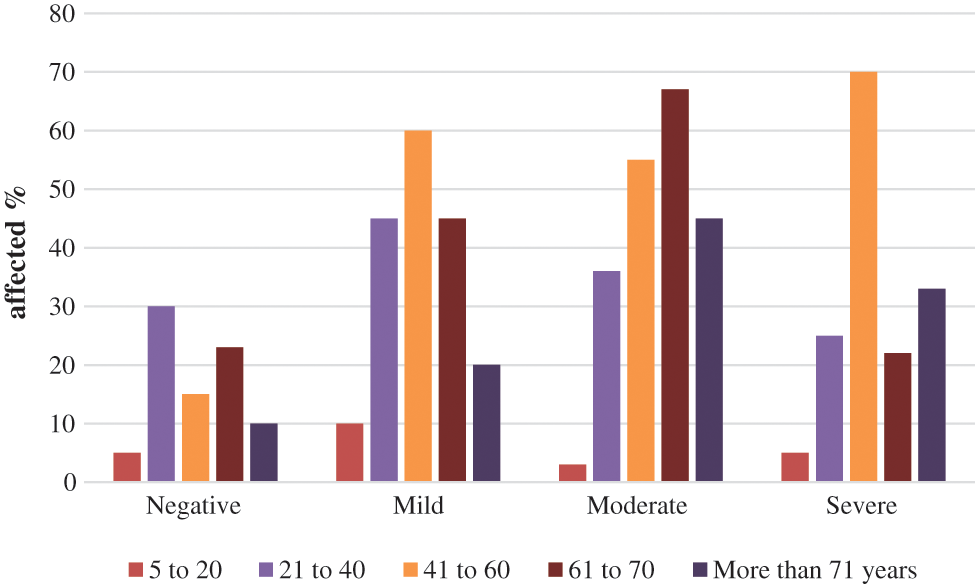
Figure 3: CT-COVID severity score
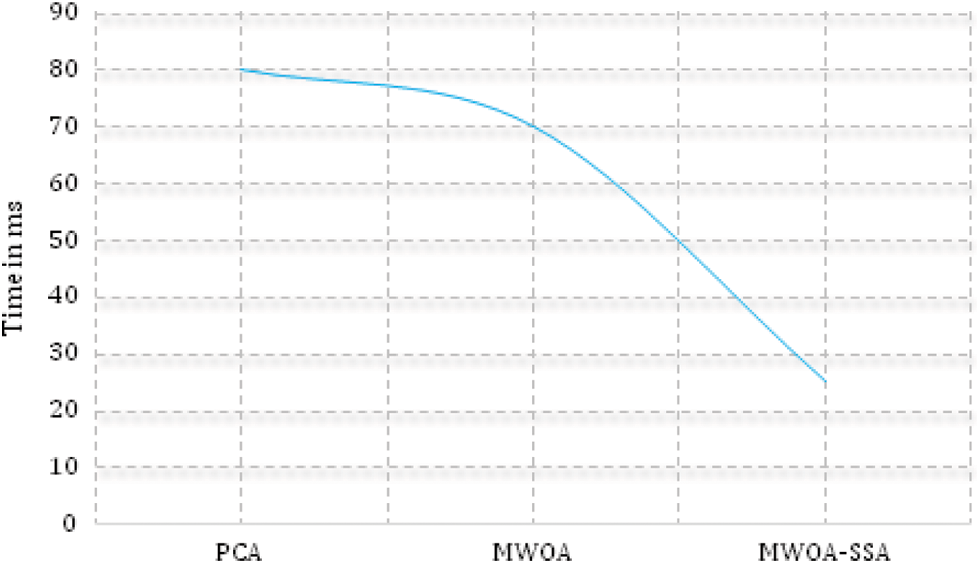
Figure 4: Execution time (proposed method executes faster than PCA and MWOA)
MWOA-SSA is used for the classification of COVID-19 cases in four phases. In the first phase, to classify accurate COVID-19 and non-COVID-19 images from a large dataset, pre-processing work has been done using a median filter. Features are extracted for the training CT images by PCA. For the feature selection of CT lung images, MWOA is implemented. For the selected features of the CT image, MWOA-SSA is implemented to classify the COVID-19 and non-COVID-19 images from the large dataset. This paper also proposes detecting and identifying the severity of lung infection by using different severity levels of COVID-19 cases. The main advantage of MWOA-SSA is that it efficiently and quickly classifies COVID-19 and non-COVID-19 cases and detects severity of lung infection using severity levels. MWOA-SSA has an accuracy of 97%, whereas PCA and MWOA have accuracies of 81% and 86%. In future work, we suggest the use of various deep learning algorithms and various modalities of images and clinical reports.
Funding Statement: The authors received no specific funding for this study.
Conflicts of Interest: The authors declare that they have no conflicts of interest to report regarding the present study.
1. Q. V. Pham, D. C. Nguyen, T. Huynh, W. J. Hwang and P. N. Pathirana, “Artificial Intelligence (AI) and big data for coronavirus (COVID-19) pandemic: A survey on the state-of-the-arts,” IEEE Access, vol. 8, pp. 130820–130839, 2020. [Google Scholar]
2. X. H. yuen Frank Wong, H. Yin Sonia Lam, A. Ho Tung Fong, S. Leung, T. Wing Yan Chin et al., “Frequency and distribution of chest radiographic findings in patients positive for COVID-19,” Radiology, vol. 296, no. 2, pp. E72–E78, 2020. [Google Scholar]
3. C. Sanghoon, L. Sunho, K. Changhwan, W. Sunhee, K. Taejin et al., “Enhancement of soft-tissue contrast in cone-beam CT using an anti-scatter grid with a sparse sampling approach,” Physics in Medicine and Biology, vol. 7, pp. 1–9, 2020. [Google Scholar]
4. B. J. Walker, J. Radtke, G. H. Chen, K. W. Eliceiri and T. R. Mackie, “A beam optics study of a modular multi-source X-ray tube for novel computed tomography applications,” Nuclear Instruments and Methods in Physics Research Section A: Accelerators, Spectrometers, Detectors and Associated Equipment, vol. 868, pp. 1–9, 2017. [Google Scholar]
5. L. T. Campos, F. M. Jesus, E. A. De Souza Gonçalves and L. A. G. Magalhães, “Computed tomography x-ray characterization: A monte carlo study,” Radiation Physics and Chemistry, vol. 167, Article ID 108359, 2020. [Google Scholar]
6. M. K. Honkanen, H. Matikka, J. T. Honkanen, A. Bhattarai, A. Grinstaff et al., “Imaging of proteoglycan and water contents in human articular cartilage with fullbody CT using dual contrast technique,” Journal of Orthopaedic Research, vol. 37, no. 5, pp. 1059–1070, 2019. [Google Scholar]
7. E. Montagnon, M. Cerny, A. Cadrin chánevert, V. Hamilton, T. Derennes et al., “Deep learning workflow in radiology: A primer,” Insights into Imaging, vol. 11, no. 1, Article Number 22, 2020. [Google Scholar]
8. A. Ibrahim, S. Mohammed, H. A. Ali and S. E. Hussein, “Breast cancer segmentation from thermal images based on chaotic salp swarm algorithm,” IEEE Access, vol. 8, no. 1, pp. 122121–122134, 2020. [Google Scholar]
9. M. A. A. Qaness, A. A. Ewees, H. Fan and M. Abd, “Optimization method for forecasting confirmed cases of COVID-19 in China,” Journal of Clinical Medicine, vol. 9, no. 3, Article Number 674, 2020. [Google Scholar]
10. K. Li, Y. Fang, W. Li, C. Pan, P. Qin et al., “CT image visual quantitative evaluation and clinical classification of coronavirus disease (COVID-19),” European Radiology, vol. 30, no. 8, pp. 4407–4416, 2020. [Google Scholar]
11. M. Chung, A. Bernheim, X. Mei, N. Zhang, M. Huang et al., “CT imaging features of 2019 novel coronavirus (2019-nCoV),”Radiology, vol. 295, no. 1, pp. 202–207, 2020. [Google Scholar]
12. R. Yang, X. Li, H. Liu, Y. Zhen, X. Zhang et al., “Chest CT severity score: An imaging tool for assessing severe COVID-19,” Radiology Cardiothoracic Imaging, vol. 2, no. 2, pp. e200047, 2020. [Google Scholar]
13. X. Wu, H. Hui, M. Niu, L. Li, L. Wang et al., “Deep learning-based multi-view fusion model for screening 2019 novel coronavirus pneumonia: A multicentre study,” European Journal of Radiology, vol. 128, Article ID 109041, 2020. [Google Scholar]
14. A. A. Ardakani, A. R. Kanafi, U. R. Acharya, N. Khadem and A. Mohammadi, “Application of deep learning technique to manage COVID-19 in routine clinical practice using CT images: Results of 10 convolutional neural networks,” Computers in Biology and Medicine, vol. 121, Article ID 103795, 2020. [Google Scholar]
15. M. A. Elaziz, K. M. Hosny, A. Salah, M. M. Darwish, S. Lu et al., “New machine learning method for image-based diagnosisof COVID-19,” PLoS ONE, vol. 15, no. 6, p. e0235187, 2020. [Google Scholar]
16. S. Hu, Y. Gao, Z. Niu, Y. Jiang, L. Li et al., “Weakly supervised deep learning for COVID-19 infection detection and classification from CT images,” IEEE Access, vol. 8, pp. 118869–118883. 2020. [Google Scholar]
17. M. Nour, Z. Cömert and K. Polat, “A novel medical diagnosis model for COVID-19 infection detection based on deep features and Bayesian optimization,” Applied Soft Computing, vol. 97, Part A, p. 106580, 2020. [Google Scholar]
18. S. Hu, Y. Gao, Z. Niu, Y. Jiang and L. Li, “Weakly supervised deep learning for COVID-19 infection detection and classification from CT images,” IEEE Access, vol. 8, pp. 118869–118883, 2019. [Google Scholar]
19. K. Zhang, X. Liu, J. Shen, Z. Li and Y. Sang, “Clinically applicable AI system for accurate diagnosis, quantitative measurements, and prognosis of COVID-19 pneumonia using computed tomography,” Cell, vol. 181, no. 6, pp. 1423–1433, 2020. [Google Scholar]
20. H. Panwar, P. K. Gupta, M. K. Siddiqui, R. Morales Menendez and V. Singh, “Application of deep learning for fast detection of COVID-19 in X-rays using nCOVnet,” Chaos, Solitons Fractals, vol. 138, Article ID 109944, 2020. [Google Scholar]
21. X. Xu, X. Jiang, C. Ma, P. Du, X. Li et al., “A deep learning system to screen novel coronavirus disease 2019 pneumonia,” Engineering, vol. 6, no. 10, pp. 1122–1129, 2020. [Google Scholar]
22. Q. AlTashi, S. J. Abdul Kadir, H. M. Rais, S. Mirjalili and H. Alhussian, “Binary optimization using hybrid grey wolf optimization for feature selection,” IEEE Access, vol. 7, pp. 39496–39508, 2019. [Google Scholar]
23. K. Ye, Q. Zhu, M. Li, Y. Lu and H. Yuan, “A feasibility study of pulmonary nodule detection by ultralow-dose CT with adaptive statisticaliterative reconstructionV technique,” European Journal of Radiology, vol. 119, Article ID 108652, 2019. [Google Scholar]
24. R. Yamashita, M. Nishio, R. K. G. Do and K. Togashi, “Convolutional neural networks: An overview and application in radiology,” Insights into Image Processing, vol. 9, no. 4, pp. 611–629, 2018. [Google Scholar]
25. J. Fu, J. Wang, W. Guo and P. Peng, “Multi-mounted X-Ray beam computed tomography,” Nuclear Instruments and Methods in Physics Research, vol. 888, pp. 119–125, 2018. [Google Scholar]
26. B. J. Walker, J. Radtke, G. H. Chen, K. W. Eliceiri and T. R. Mackie, “A beam optics study of a modular multi-source X-ray tube for novel computed tomography applications,” Nuclear Instruments and Methods in Physics Research, vol. 868, pp. 1–9, 2017. [Google Scholar]
27. S. Mirjalili and A. Lewis, “The whale optimization algorithm,” Advances in Engineering Software, vol. 95, pp. 51–67, 2016. [Google Scholar]
28. S. Mirjalili, S. M. Mirjalili, S. Saremi and S. Mirjalili, “Whale optim. algorithm: Theory, literature review, and application in designing photonic crystal filters,” Studies in Computational Intelligence, vol. 811, Springer, pp. 219–238, 2020. [Google Scholar]
29. E. S. E. Kenawy, M. Ibrahim, A. Mirjalili, S. Eid and M. M. Hussein, “Novel feature selection and voting classifier algorithms for COVID-19 classification in CT images,” IEEE Access, vol. 8, pp. 179317–179335,2020. [Google Scholar]
30. Z. M. Yaseen, H. Faris and N. Al-Ansari, “Hybridized extreme learning machine model with salp swarm algorithm: A novel predictive model for hydrological application,” Complexity, vol. 2020, Article ID 8206245, 2020. [Google Scholar]
31. G. A. Saeed, W. Gaba, A. Shah, A. Al Helali, E. Raidullah et al., “Correlation between chest CT severity scores and the clinical parameters of adult patients with COVID-19 pneumonia,” Radiology Research and Practice, vol. 2021, Article ID 6697677, 2020. [Google Scholar]
32. Y. Qiblawey, A. Tahir, M. E. Chowdhury, A. Khandakar and S. Kiranyaz, “Detection and severity classification of COVID-19 in CT images using deep learning,” Diagnostics, vol. 11, no. 5, Article Number 893, 2021. [Google Scholar]
33. J. Zhao, Y. Zhang, X. He and P. Xie, “COVID-CT-dataset: A CT scan dataset about COVID-19,” arXiv preprint arXiv: 2003.13865, vol. 490, 2020. [Google Scholar]
34. S. Kukan, S. Gokul, S.S. Vishnu Priyan, S. Barathi Kanna and E. Prabhu, “COVID-19: Smart shop surveillance system,” in the Intelligent Sustainable Systems, 1st ed., vol. 1. Henderson, Singapore: Springer. 2022. [Google Scholar]
35. S. Aruul Mozhi Varman, A. R. Baskaran, S. Aravindh and E. Prabhu, “Deep learning and IoT for smart agriculture using WSN,” in Proc. ICCIC, Coimbatore, India, pp. 1–6, 2017. [Google Scholar]
36. S. Kanakaprabha and D. Radha, “Analysis of COVID-19 and pneumonia detection in chest X-ray images using deep learning,” in Proc. ICCISC, Idukki, India, pp. 1–6, 2021. [Google Scholar]
37. H. Sathyan and J. V. Panicker, “Lung nodule classification using deep convnets on CT images,” in Proc. ICCCNT, Bengaluru, India, pp. 1–5, 2018. [Google Scholar]
 | This work is licensed under a Creative Commons Attribution 4.0 International License, which permits unrestricted use, distribution, and reproduction in any medium, provided the original work is properly cited. |