DOI:10.32604/cmc.2022.023861
| Computers, Materials & Continua DOI:10.32604/cmc.2022.023861 | |
| Article |
Real Time Monitoring of Muscle Fatigue with IoT and Wearable Devices
1School of Electronics & Electrical Engineering, Lovely Professional University, Punjab, 144411, India
2Department of Electronics & Communication Engineering, University of Petroleum and Energy Studies, Dehradun, 248001, India
3Faculty of Computing and Information Technology, King Abdulaziz University, Jeddah, 37848, Saudi Arabia
4Higher Polytechnic School, Universidad Europea del Atlántico, C/Isabel Torres 21, 39011 Santander, Spain
5Universidad Internacional Iberoamericana, Campeche, Mexico
*Corresponding Author: Aman Singh. Emails: amansingh.x@gmail.com, aman.singh@uneatlantico.es
Received: 24 September 2021; Accepted: 27 December 2021
Abstract: Wearable monitoring devices are in demand in recent times for monitoring daily activities including exercise. Moreover, it is widely utilizing for preventing injuries of athletes during a practice session and in few cases, it leads to muscle fatigue. At present, emerging technology like the internet of things (IoT) and sensors is empowering to monitor and visualize the physical data from any remote location through internet connectivity. In this study, an IoT-enabled wearable device is proposing for monitoring and identifying the muscle fatigue condition using a surface electromyogram (sEMG) sensor. Normally, the EMG signal is utilized to display muscle activity. Arduino controller, Wi-Fi module, and EMG sensor are utilized in developing the wearable device. The Time-frequency domain spectrum technique is employed for classifying the three muscle fatigue conditions including mean RMS, mean frequency, etc. A real-time experiment is realized on six different individuals with developed wearable devices and the average RMS value assists to determine the average threshold of recorded data. The threshold level is analyzed by calculating the mean RMS value and concluded three fatigue conditions as >2 V: Extensive); 1–2 V: Moderate, and <1 V: relaxed. The warning alarm system was designed in LabVIEW with three color LEDs to indicate the different states of muscle fatigue. Moreover, the device is interfaced with the cloud through the internet provided with a Wi-Fi module embedded in wearable devices. The data available in the cloud server can be utilized for forecasting the frequency of an individual to muscle fatigue.
Keywords: LabVIEW; muscle fatigue; sEMG; wearable sensor; IoT; cloud server
Currently, people are utilizing wearable devices to monitor the physical condition of their bodies during exercise and normal times. Generally, these wearable devices assist to track the number of steps, heart rate, and sleep pattern with advanced analyzing features. Isokinetic training with the appropriate equipment is generally utilized extensively for functional therapy and evaluation [1]. During isokinetic training, the leg muscles of an individual undergo frequent dynamic contractions, in these cases if an individual exercise excessively, their muscles may get stressed or injured [2]. As a result, learning to exercise effectively is crucial for both healthy and sick people. Muscle fatigue is frequently assessed as a fall inside the muscle's extreme power or strength [3]. It is shown that certain tasks are not restricted to main muscle exhaustion. Muscle physiologists frequently label muscle fatigue as a severe workout tempted decline in muscles force [4]. Fatigue is also usually mentioned as a reduced capability for maximal performance and the best relevant method to estimate fatigue would be straight using the highest test of presentation in the competitive occurrence of the athlete [5].
The following are few studies that address the fatigue monitoring with distinct traditional methods like Traditional system to monitor muscle fatigue is calculated from the median frequency of the sEMG power spectrum and the power spectrum is calculated for the signals using fast Fourier transform algorithm with the help of MATLAB [6]. After that, the median frequency for the recorded data is calculated and plotted beside time. The drop in the mean value of median frequency indicates the onset of fatigue. The median frequency calculation of the EMG signal is considered as the preeminent and traditional indicator of the muscle fatigue status during the intended contraction of muscles [7]. Spatiotemporal EMG signal analysis is also used to monitor the muscle status and plays a very important role in rehabilitation platforms [8,9]. A simple and easy method to measure this fatigue in rugby players is to the muscle by integrating Mechanomyogram (MMG) sensor for measuring the muscle fatigue of rugby players during performance [10]. Fatigue progression measure (FPM) is a measure to monitor muscle by calculating the electrical activity and median frequency per cycle of round [11]. Multiple time window (MTB) is a technique used to monitor the surface electromyography signals under muscle fatigue conditions and non-muscle fatigue conditions. Strain elastography and shear-wave elastography are two different ultrasound elastography technologies that are useful study muscle stiffness [12]. RMS regression slopes offered a noteworthy decrease after training biceps brachii muscles [13]. Power spectral density calculation of sEMG is also used to analyze muscle function [14]. However, all these studies utilize non-wearable and portable devices for monitoring stress. Here the wearable monitoring system for muscle contraction not only provides notification to the user on the onset of fatigue but also needs to get information regarding relaxed muscle for minimizing the chance of getting injured. The contribution of the study is as follows:
• Proposed architecture for implementing IoT-based wearable device with EMG sensor to monitor muscle fatigue.
• A LabVIEW-based data logger is implemented as an acquisition system for visualizing muscle activity.
• The rectified amplitude value of the raw EMG signal is analyzed with the time-domain feature extraction technique.
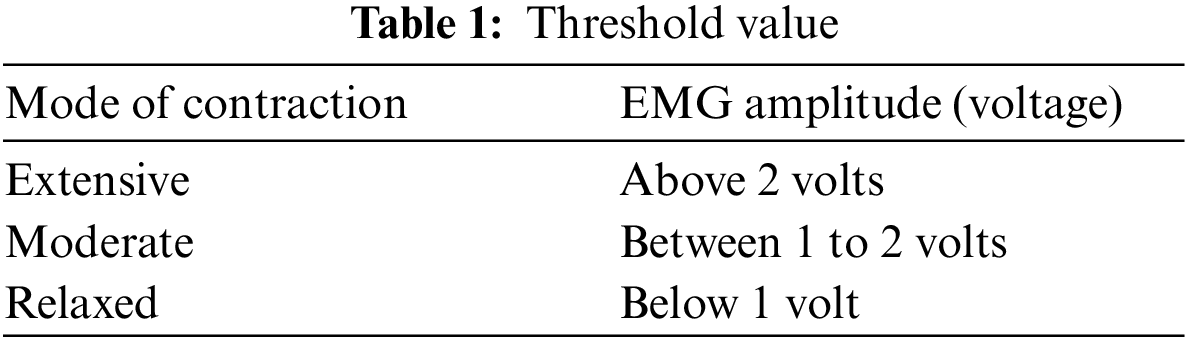
• The threshold level is analyzed by calculating the mean RMS value and concluded three fatigue conditions as >2 V: Extensive); 1–2 V: Moderate, and <1 V: relaxed.
• A real experiment is implemented on six different individuals with IoT enabled devices and analyzed in MATLAB
The organization of the study is as follows, Section 2 covers the literature review, Section 3 covers proposed architecture; Section 4 covers hardware interfacing; Section 5 covers the methodology regarding data acquisition and classification; Section 6 covers the results and current consumption analysis.
This section gives an overview of the research methodologies done so far for monitoring or observing muscle activity.
2.1 Electromyogram (EMG) Method
An electromyogram (EMG) is an electrical signal produced by muscles during contraction. However, it demonstrates an interference pattern of action potentials generated by muscle fibers underneath the measurement location [15]. EMG measurements can be taken by attaching conductive components or electrodes to the skin's surface or invasively into the muscle. Surface EMG is the most often used method of testing since it is non-invasive and may be performed by personnel other than medics or paramedics with low danger to the patient [16]. The characteristics of the electrodes and their contact with the skin, amplifier design, and the conversion and subsequent storage of the EMG signal from analog to digital form (A/D conversion) all play a role in measuring and properly capturing the sEMG signal. The signal to noise ratio (SNR), which is the ratio between the recorded EMG signal and undesired noise contributions from the environment, is frequently used to describe the quality of the measured EMG. The objective is to increase signal amplitude while reducing noise, providing that the amplifier design and A/D conversion method exceeds acceptable requirements. However, extensive research has been carried out to overcome the noises generated by EMG signals. The research analyzes two important areas; On the one hand, there is the pre-correction method to eliminate probable noises by taking adequate precautions when recording muscle activity, and on the other hand, a brief description of the different approaches to process EMG signals [17].
2.2 Mechanomyogram (EMG) Method
A mechanomyogram, on the other hand, has been offered as another method for studying muscle mechanical activity. The term mechanomyography (MMG) refers to a method that detects muscle mechanical activity by employing specialized transducers to capture muscle surface vibrations caused by motor unit mechanical activity. MMG signals may be detected with a variety of transducers, including piezoelectric contact sensors (PIZ) and microphones. MMG has certain distinct benefits over sEMG [18]. First, because MMG sensors propagate via muscle tissue, their location does not need to be accurate or particular. Second, because MMG is a mechanical signal, it is unaffected by changes in skin impedance caused by perspiration. MMG can also be utilized in combination with sEMG to investigate neuromuscular function. However, with the assistance of MMG, numerous researchers have continued to investigate its application features. A mechanomyogram (MMG) sensor frame is constructed in this study for the control of muscle conditions. The MMG banner indicates the mean power recurrence (MPF) of the sensor yield, which is determined by the muscle ending rate of activity, and the variation of the sensor yield that is determined by the activity of fast filaments and finished inscription [19].
2.3 Autonomic Nervous System (ANS)
Several investigations have shown that the dynamics of the autonomic nervous system (ANS) are directly engaged involuntary muscle contractions. In particular, during such contractions, both the sympathetic and parasympathetic branches of the ANS are engaged by brainstem activity, as well as via chemo-, mechano-, and baroreceptor afferents [20,21]. When referring to cardiovascular dynamics, the influence of ANS regulation during exhaustion is obvious, as pulse, breathing rate, and blood pressure considerably alter during intensive exercise. Specifically, prolonged exercise was associated with increased heart rate (HR), oxygen consumption, and EMG activity. Heart rate variability (HRV) series, which are influenced by sympathetic and parasympathetic interaction, were also studied in this context, with the idea of a sympathetic retreat or vagal tone restoration happening after maximum exercise. amid the exhausting work [22]. Other indicators of ANS dynamics, such as electrodermal activity (EDA) have not been studied in the context of muscular exhaustion produced by physical exercise, to the best of our knowledge. EDA is a commonly utilized physiological marker that is influenced by cognitive processes such as attention, emotion, and motivation. EDA is a biomarker of emotional reactivity, stress, and mental weariness that is directly regulated by the sympathetic branch of the ANS. An alternative non-invasive method is implemented for the detection of muscle fatigue through two ANS correlates, i.e., the EDA and HRV series.
2.4 Machine Learning Technique
Many techniques for data-driven real-time forecasting of time series using machine learning are available in the subject of ‘online learning,’ also known as ‘incremental learning’ or adaptive signal processing (ASP) [23]. The concept of ASP is to update the model's parameters over time as data is streamed so that the model organically adapts to the most recent observations. There are two types of models in this class: shallow learning and deep learning. Deep learning can be used to get around this problem. Convolutional neural networks (CNN) built on a stack of causal dilated convolutional layers, such as the WaveNet, have been demonstrated to give a state-of-the-art performance in a variety of tasks, including glucose time-series prediction and audio synthesis [24]. Real-time forecasting is especially useful for applications such as detecting the start of muscular exhaustion (between no tiredness and fatigue) [25]. when the user has to be informed before entering the fatigue state to avoid harm. Some research has been done to predict exhaustion in the biceps muscle by adding a novel condition called transition to fatigue. Unfortunately, because the characteristics are not explicitly represented, this technique cannot be used in other application areas that employ the same (or comparable) features. A study is proposed for predicting the sEMG feature of trunk muscles using adaptive algorithms with dShallow models and a deep convolutional neural network (CNN) in real-time [26,27].
Wearable devices have been gaining attention in the health care field and a large number of people are using a wearable device to monitor their physical health. Advances in sensor and communication technology have widely promoted the development of IoT-enabled wearable devices for monitoring muscle health. The implementation of muscle fatigue monitoring using the Internet of Things and the EMG sensor is suggested in Fig. 1. The proposed architecture is the integration of three different functions, such as data acquisition, data processing, and visualization of sensor data. By collecting data, the EMG sensor records the electrical activity of the muscles. The EMG sensor is connected as an input to the microcontroller, where it receives the electrical activity of the muscles in analog form. In data processing, the Wi-Fi transmits the received sensory data to the cloud server for identifying the muscle fatigue of an individual.
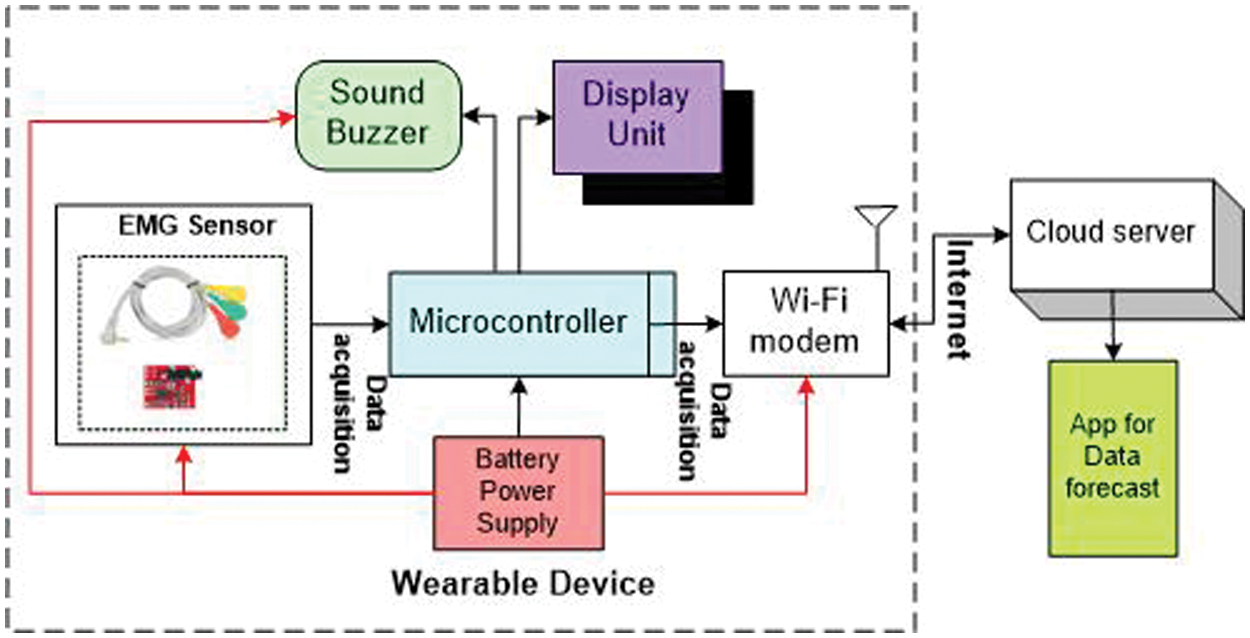
Figure 1: Proposed architecture
Except for the cloud server and app for data forecast, the remaining components of the architecture are utilized to build the wearable device. The wearable device with an EMG sensor is interfaced to the individual to identify muscle fatigue in real-time. Here, in the cloud server, the preset conditions are set based on the sensory data. Depending on the sensory data and threshold conditions, the cloud server sent an alert regarding muscle fatigue to the wearable device through internet connectivity. The muscle fatigue conditions are visualized on the display unit and additionally the buzzer embedded in the wearable device generates an alarm in case of severe muscle fatigue condition. Furthermore, the user can predict the rate of muscle fatigue suffering of an individual by applying analytical techniques on the cloud server.
The interfacing is presented here with three different components namely: Connecting the electrodes, interface to the Arduino, and interface to the power supply as shown in Fig. 2. On defining the target muscle (e.g., bicep, calf, forearm), clean the skin properly using some cotton. Abode one electrode in the center of the muscle body, interface this electrode to the snap connector of the red cable. Abode the next electrode at one end of muscle part, interface this electrode to snap connector of the blue cable. Place the next electrode on the non-muscular area of the body near to targeted muscle, interface this electrode to the snap connector of the black Cable. Interface to the Arduino: Interface SIG pin on the sensor to an analog pin on A0 of Arduino. Interface the GND pin on the sensor to a GND pin on Arduino. Fig. 2 presents the sensor interfacing with the microcontroller and to the human arm. The ground of the muscle sensor is connected to the ground of the two 9 V batteries. +Vs of the muscle sensor are connected to the +9 V battery and –Vs is connected to the −9 V battery. The output signal pin of the sensor is connected to the A0 pin of the Arduino.
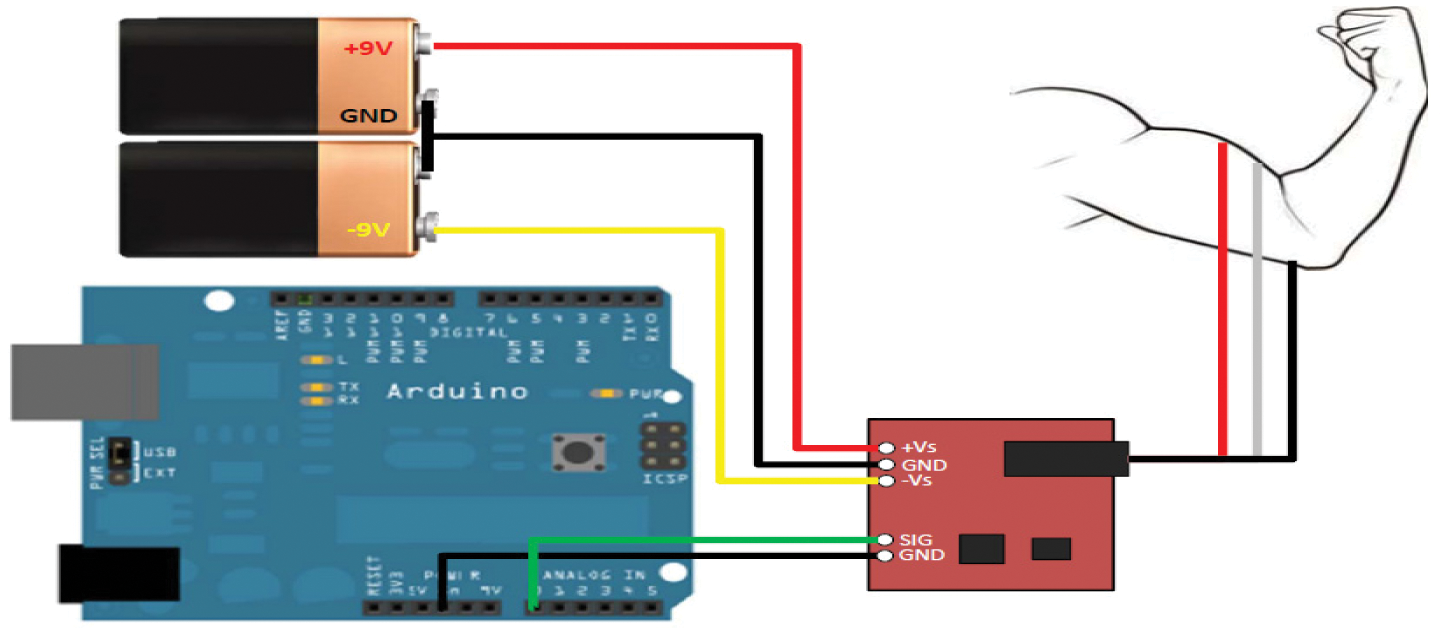
Figure 2: Interfacing of EMG sensor with Controller and human arm
A cable port is available on the sensor through which connectors are interfaced with the surface electrodes. The microcontroller (Arduino) is connected to the PC by a USB cable also the Arduino is powered through this cable. A proteus simulation is performed after interfacing the EMG sensor with the microcontroller and human arm.
This research work aims to provide a portable and compact device to monitor muscle fatigue and to make them aware of the onset of fatigue. The following three stages are for building the portable device for monitoring muscle fatigue and they are data acquisition, signal processing, and classification and application design. Data acquisition includes designing the EMG acquisition system which can display muscle activity. Signal processing and classification include processing the signal through LabVIEW and designing a recording panel for the system.
To acquire the EMG signals from the body disposable Ag/AgCl electrodes which are pre-gelled are used since the amplitude of EMG signal range in millivolts, they are highly susceptible to different noise sources as shown in Fig. 3. To surpass these RF noises and electromagnetic differences, shielded wire comes into existence for connection to Ag/AgCl electrodes and also for data acquisition systems. Protection from electrical shocks is the foremost concern for any biomedical system, this is why most of the circuits run only by using two 9 V batteries.
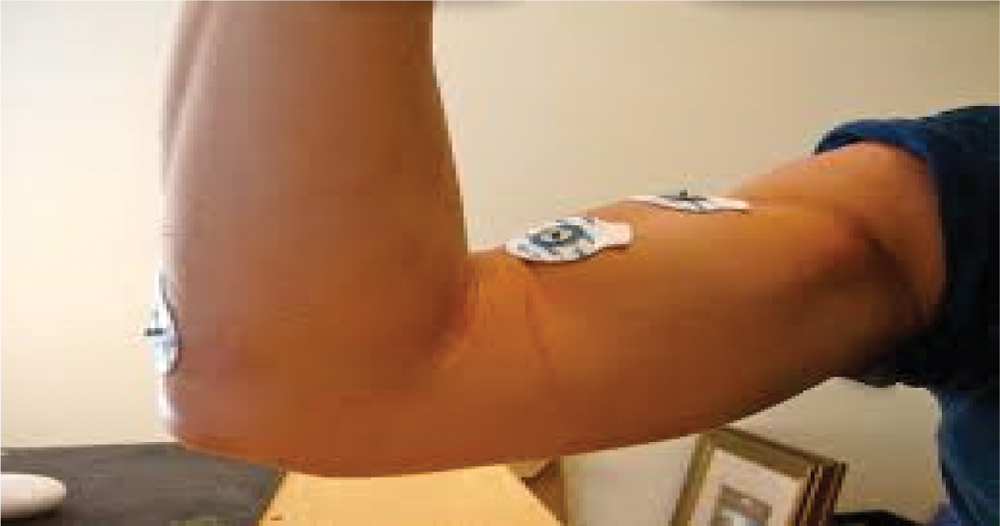
Figure 3: Surface electrodeposition
Separately from this, Arduino based Data acquisition system shown in Fig. 4 is motorized by resources of the USB terminal of the laptop, which was made to run in the battery-powered mode so that the electrical safety of the subjects can be properly maintained. The Arduino Firmware is used to interface the Arduino IDE and LabVIEW. The data acquisition panel provides all the basic information regarding the monitoring status like a graph of amplitude vs. several samples, com port used by the microcontroller, baud rate, and table displaying EMG values recorded.
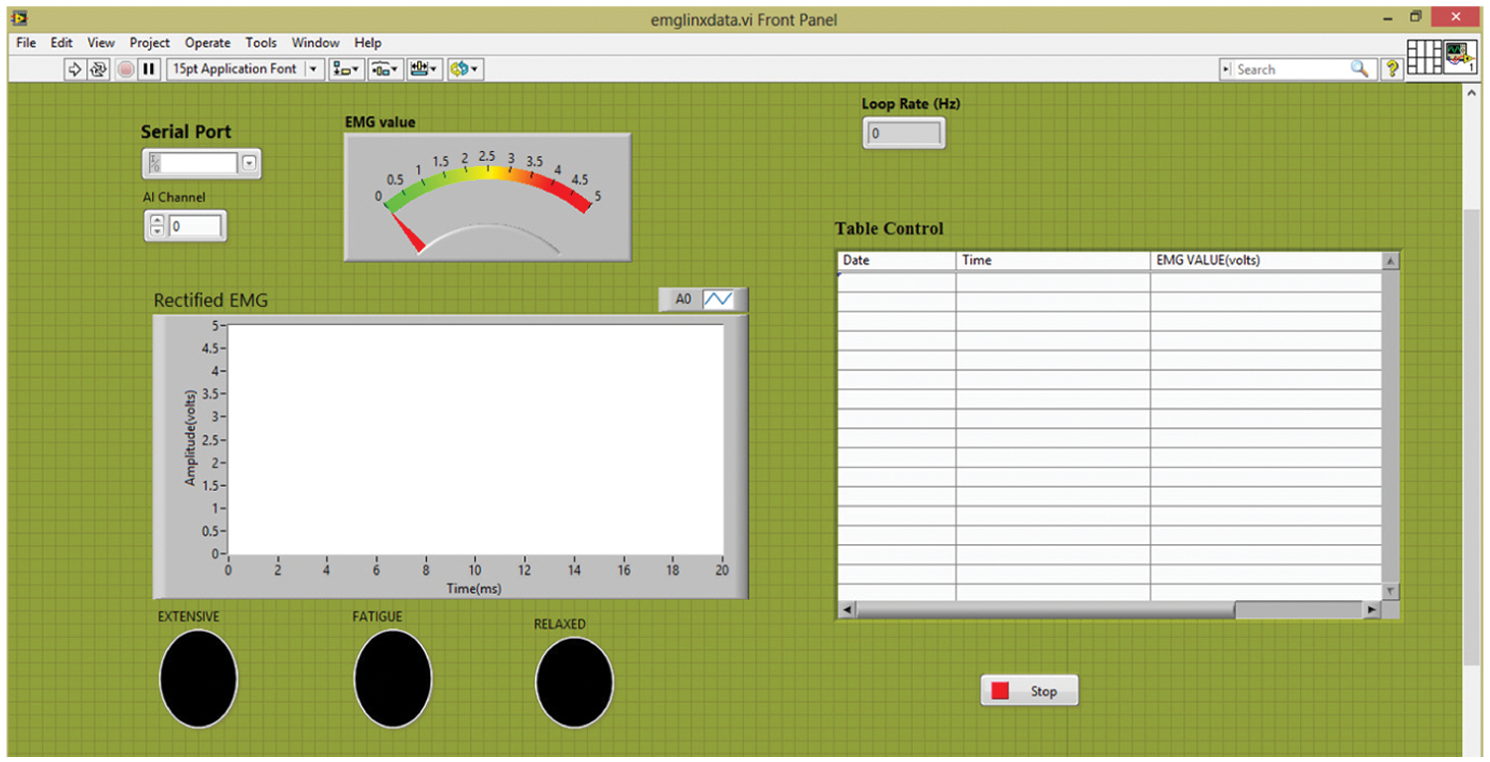
Figure 4: Data logger in LabVIEW
The Arduino firmware is used to interface the Arduino IDE and the LabVIEW. The data acquisition system created displays the necessary information while recording the muscle status. It presents the serial port to which the microcontroller is connected such as COM4, COM3, etc. Tab. 1 consists of the EMG data in volts with the date and time of recording the muscle data. Three highlighted ovals depict the three conditions of the muscles which are Extensive, Fatigue (moderate), and relaxed. Depending on the contracting capability of the muscles for a particular person, the specific oval will be highlighted showing that particular condition of muscles. The data acquisition system acquires the signal which is retrieved from the EMG sensor and this signal output is nursed into the LabVIEW using Arduino Uno. The program used for the notification and monitoring of muscle fatigue is designed such that depending on the threshold amplitude setting, the respective LED glows on LabVIEW.
4.2 Classification of EMG Signal
Feature extraction techniques of bio-signals used are classified as: Feature extraction time-domain spectrum, feature extraction in frequency domain spectrum, time-frequency domain spectrum. Mean, standard deviation, EMG-integrated, averaging, correction are the approaches that are employed in the time domain. A spectrum of power, the density of power of spectrum, Power spectrum density are some frequency domain techniques and short time transformations are time-frequency domain approaches. Calculation in time domain analysis is straightforward and efficient. The EMG amplitude is corrected and enveloped before extracting the feature in the time domain. Amplitude estimation is performed on the time domain analysis, using several additional parameters such as mean RMS, mean frequency, etc. The threshold level is split into three categories: large, moderate, and relaxed, based upon the amplification of the interseal muscle.
4.3 Pre-processing of EMG Signal
In previous studies to produce an accurate and real EMG signal, several signal-processing approaches are used on raw EMG. However, the wavelet transform (WT) is an effective mathematical technique for the local analysis of nonstationary and rapid transient signals [28]. One of the most important features of the wavelet transform is that it may be done using a discrete-time filter bank.
5 Experimental Setup and Results
In this section, we discuss the implementation of the proposed system in a real-time environment. Initially, the system is implemented with MATLAB for visualizing the EMG signal in graphical format. Later on, the visualization of the three muscle fatigue conditions using LabVIEW Finally, the power consumption analysis of the system is also included in this section.
The device developed here will notify the user of his muscular ailment. For designing this system firstly, the EMG data were recorded with six male subjects while exercising and the model of the prototype is shown in Fig. 5. The recorded data was then analyzed in MATLAB to set a threshold.
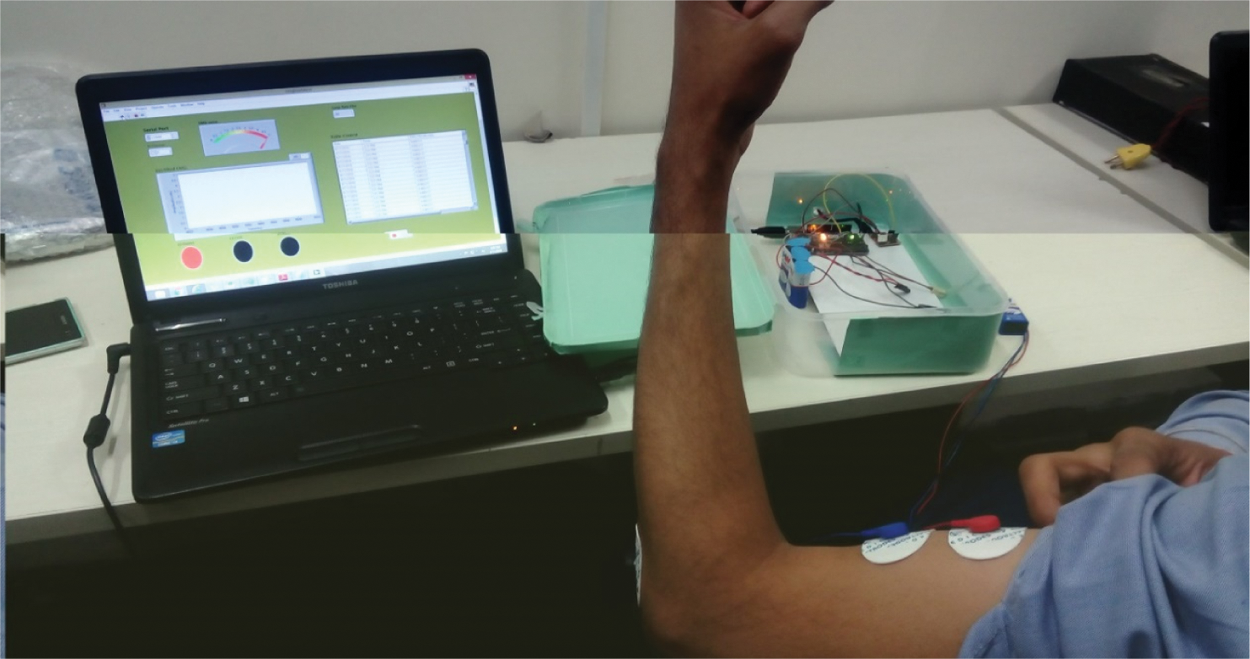
Figure 5: Model of muscle fatigue monitoring
Research says that threshold values should be used to detect the muscle activity timing in EMG signal analysis. However, for an accurate system, the threshold value should be different for various muscles of the body because functions of all the muscles are different so the threshold point indicating fatigue should also be different. In this study, fatigue of biceps brachii is monitored. So, to decide the threshold, the mean RMS value was calculated on the recorded data. After getting the mean RMS value the average threshold was evaluated this was then used to categorize the different fatigue conditions to set the average threshold for the device mean RMS value was calculated for the recorded EMG data using Eq. (1). The root-mean-square level of a vector, X¬RMS is defined as the equation:
where N = length of the total sample of individual signal (10000) and Xn = EMG average signal length (6500), Mean RMS is calculated as 2.1896 ≈ 2.2 volts (experimental) and Maximum output strength of the signal = 5 volts (experimental).
Average threshold = 40% of max output = (5 * 40)/100 = 2 volts (theoretical) which is near to the experimental value.
Based on the time domain feature extraction technique in which rectified amplitude value of raw EMG signal is analyzed after which threshold level is estimated by calculating the mean RMS value. To detect three fatigue conditions i.e., extensive, moderate, and relaxed a system is designed which can monitor as well as notify the condition of the subject. The fatigues conditions are detected by a sensor concerning voltage presented in Tab. 1. The threshold level is defined to glow the respective LED based on the muscle contraction, and here the threshold value of the device is set according to the sample data collected.
Fig. 6 presents the muscle fatigue condition based on obtained sensor value. As defined the threshold conditions are in Tab. 1, if the obtained sensor value is above the 2 V then it is concluded as extensive muscle fatigue and red color LED blinks. In case, if the obtained sensor value is <1 V then the condition of muscle fatigue is denoted as relax and green color LED blinks. In case, if they obtained sensor values>1 & <2 V, then the muscle fatigue condition is moderate, and yellow light blinks.
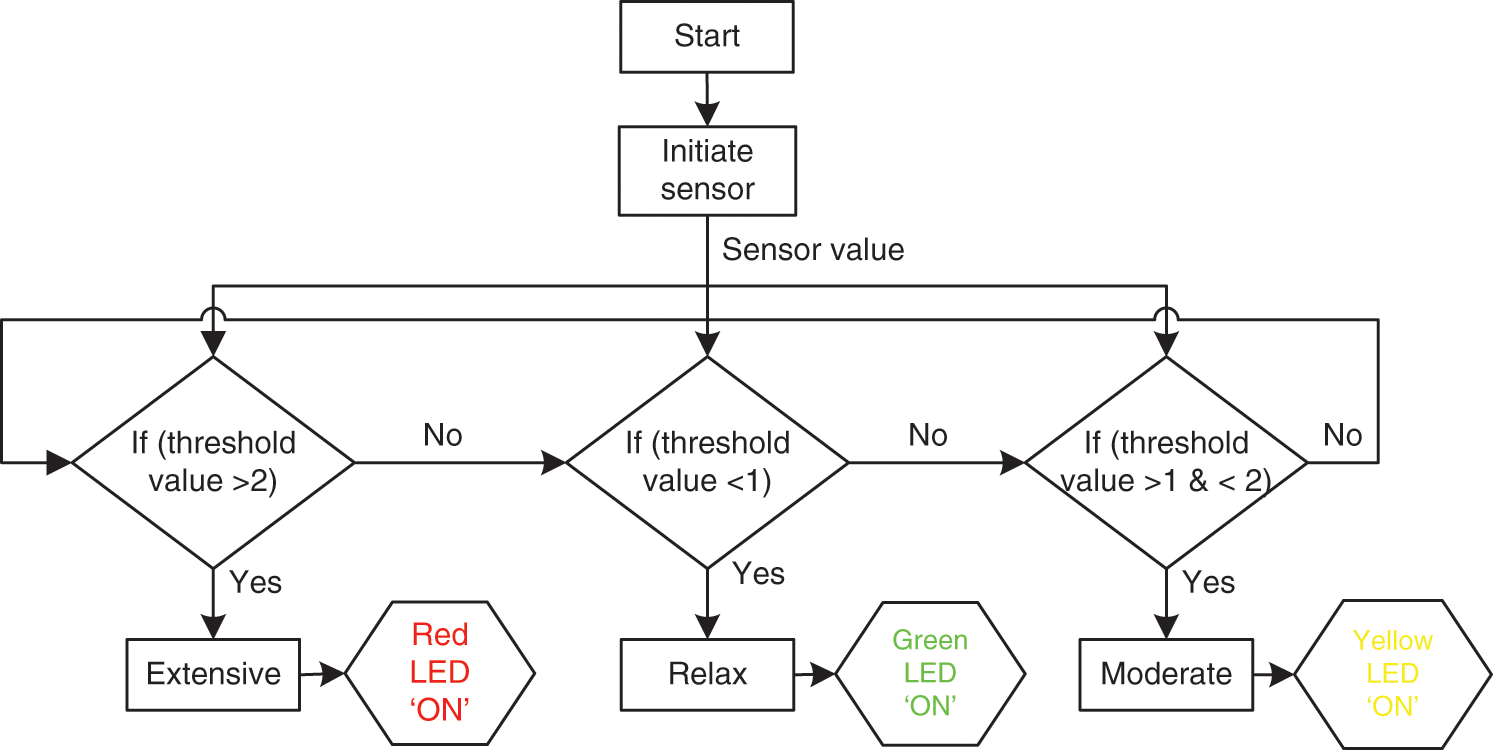
Figure 6: Flow diagram of Muscle fatigue condition based on sensor value
Now when the subject starts exercising by placing the two electrodes on the biceps branchii and one on the elbow and recording the muscle activity, the data acquisition panel keeps on recording the data, and depending on the muscle potential, a particular LED depicting muscle condition will glow.
Fig. 7a presents that at a sample point 5824 on the Y-axis and amplitude value 1.89 volts, the graph presents the steep decrease which indicates that subject's muscle has started to approach fatigue and is getting relaxed their after. Here a small portion of recorded data is displayed which contains useful information about fatigue. As it is clear from Fig. 7a that the amplitude slope is approaching the axis ground which refers to the fatigue symptoms. The number of samples on the x-axis depends on the subject's capability to contract the muscles. Some subjects cannot perform a task for more duration while some can extend it to long-duration so it's all on the muscle capability. The only useful information collected here is that after a particular time the amplitude is approaching ‘zero’ which means the subject is sensing fatigue. The sample at which steep decrease commenced in subject 2 is 5700 and amplitude at this point is 0.6152 V and which is shown in Fig. 7b. This presents that after this particular point the subject's performance starts degrading. The number of samples in this subject's graph presents that, he was approaching fatigue very soon. The samples at which steep decrease commenced in subject 3 is 9806 and amplitude at this point is 1.719 V.
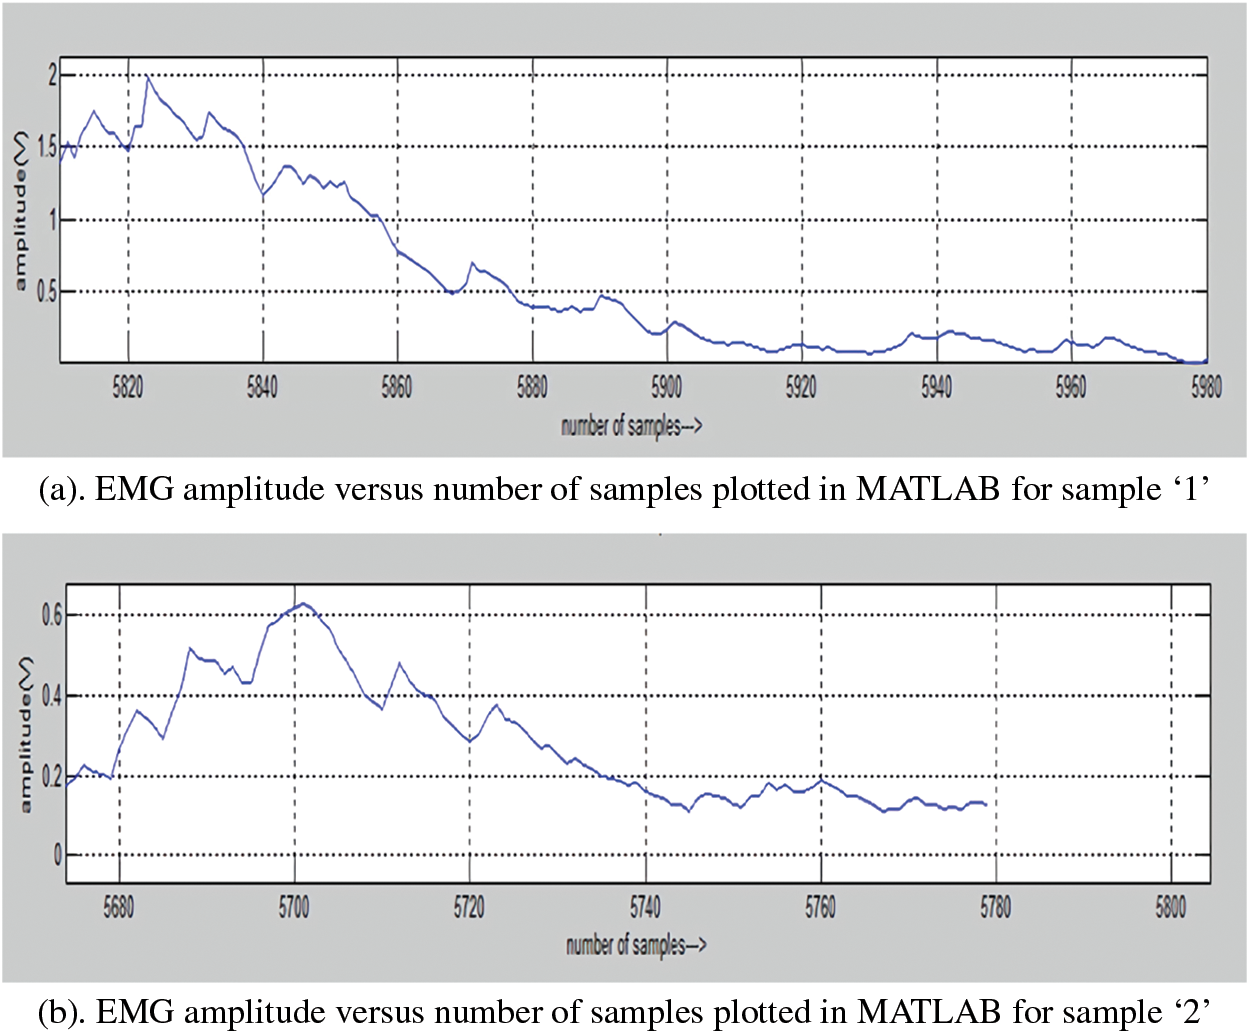
Figure 7: EMG amplitude vs. the number of samples plotted in MATLAB for sample ‘1’ and sample ‘2’
As we can see from the waveform, the maximum amplitude of the muscle contraction recorded is 5 V and the minimum amplitude is recorded between 0 and 1 V. This data presents us that the 5 V is the maximum contraction the subject has witnessed, and it presents us that 5 V is the condition, when the subject feels the onset of fatigue and the waveform dropping below 1 V, depicts that the subject has relaxed and is now in a relaxed position. When the EMG value is between 1 to 4 V, it means that the subject is applying moderate force in contracting its muscle and is ideally on right movement.
Fig. 8a presents that the number of samples on the y axis is very high which means that subject was able to carry the exercise for a longer duration and was approached to fatigue after exercising longer. In the end, the slope is getting high which depicts that the subject is trying to regain muscle strength after a short relaxation period. A short relaxing break can also help the muscles to restore their original strength so that they can function normally. The sample at which steep decrease commenced in subject 4 is 4176 and amplitude at this point is 1.523 V. Fig. 8b presents that the subject was not able to withstand the exercise for a longer duration because the number of samples crossed by the subject is not very high. The fluctuation before the steep decrease means that the subject forced its muscle to perform exercise but because of muscle fatigue the muscles could not restore it and after that, the steep decrease is followed which means that subject has relaxed. The sample at which steep decrease commenced in subject 5 is 5255 and amplitude at this point is 2.432 V.
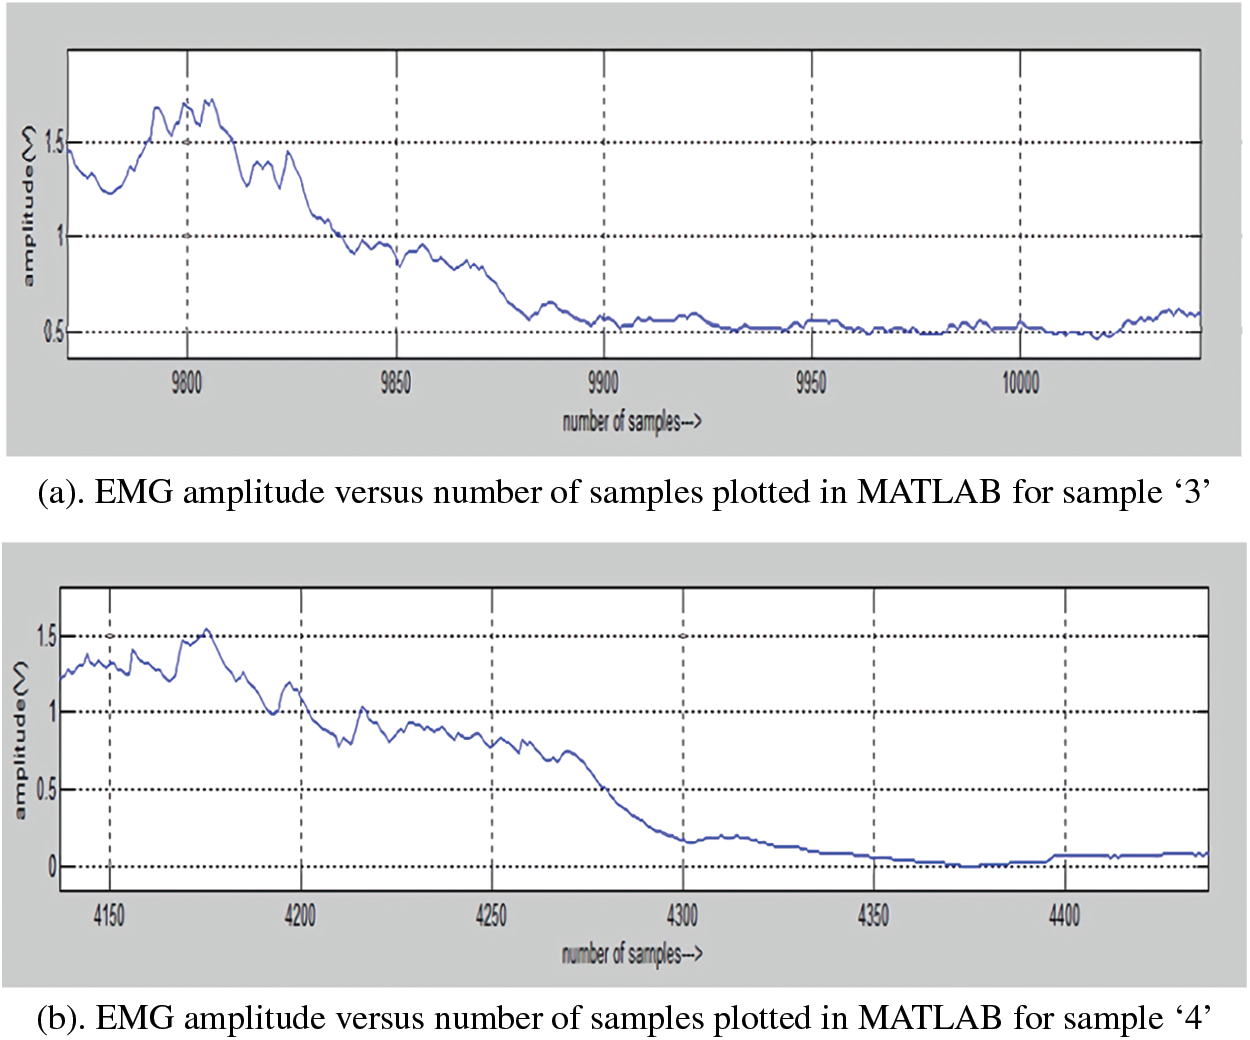
Figure 8: EMG amplitude vs. a number of samples plotted in MATLAB for sample 3 and sample 4
Fig. 9a presents that the muscles were forced to exert force for a quite long duration, but muscles could not withstand it and performance started to degrade. It also presents that the subject did not take any break for the muscle to restore and directly stopped the workout. The sample at which steep decrease commenced in subject 6 is 6860 and amplitude at this point is 2.271 volt. Fig. 9b presents that after forcing the muscle for a workout the muscles started degrading and a steep decrease is followed thereafter. The sampling rate of 1000 samples per second is recorded for the six distinct individuals. The average RMS is 2.18V with the equation to determine the RMS value. Based on this finding, the threshold value of EMG was established at about 40 percent, which is equivalent to the mean RMS discovered by the study, at 25 percent, 35, and 45 percent, respectively. Therefore, we obtain 2 and 1 V accordingly when selecting the threshold for the maximum and minimum of 40% and 20%. To exclude motion objects and white signals, the minimum threshold value is 20 percent. It may be concluded that when the amplitude of the EMG crosses the maximum level, the excessive exercise represents a relaxed condition and that, when it is low or low, it is relaxed, meaning that the value or safe method of exercise is moderated at 40 to 20 percent between the maximum and the lowest.
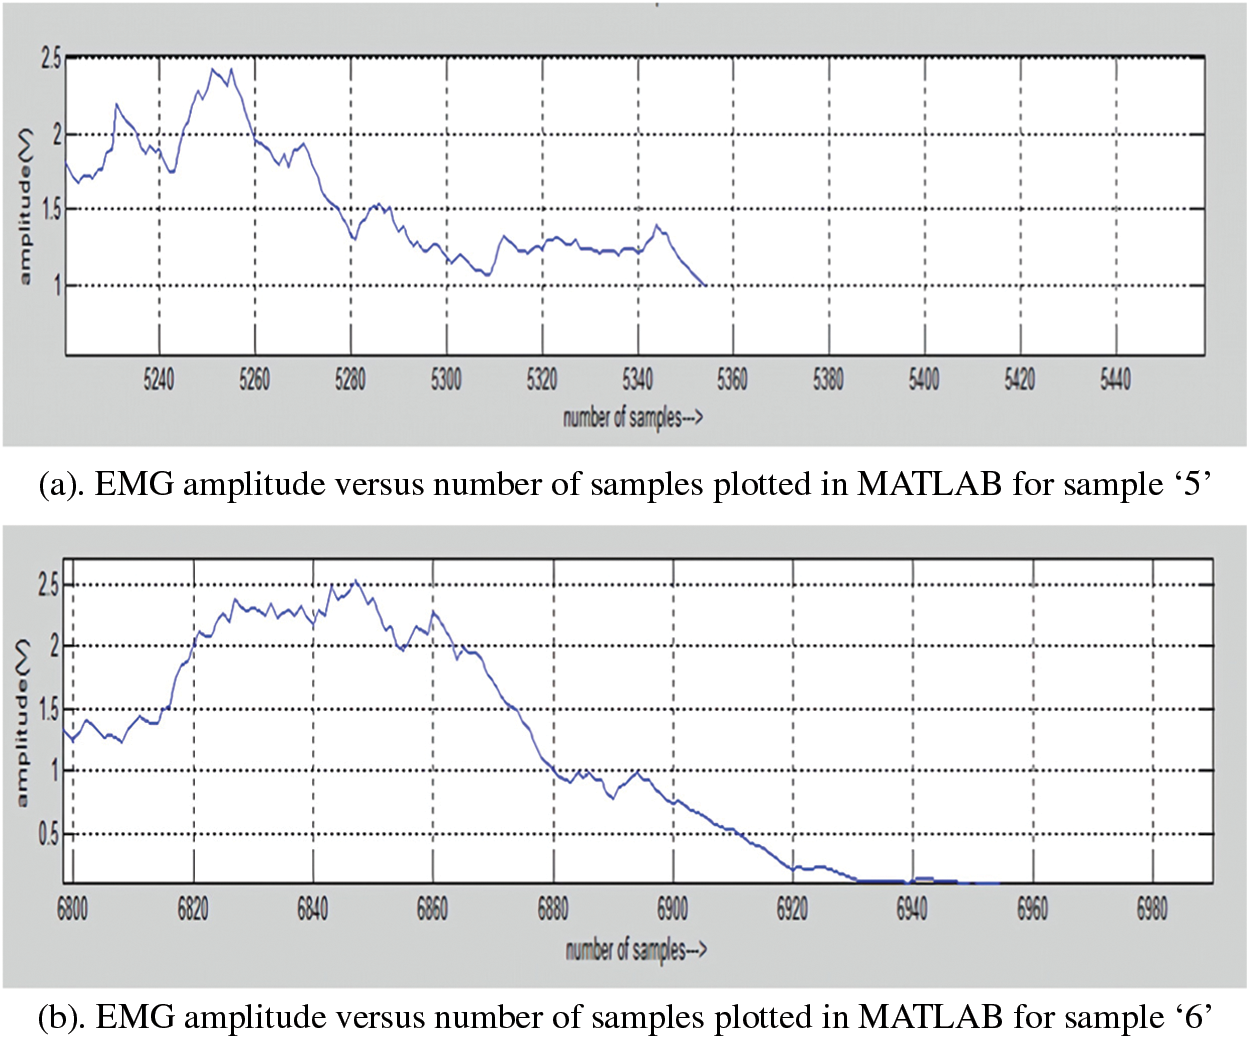
Figure 9: EMG amplitude vs. the number of samples plotted in MATLAB for sample 5 and sample 6
The real-time monitoring and notification of all the three conditions are shown below with their pictorial diagram of EMG value. The graph in Fig. 10 presents the data logger designed in LabVIEW indicating the user of the relaxed condition of muscles.
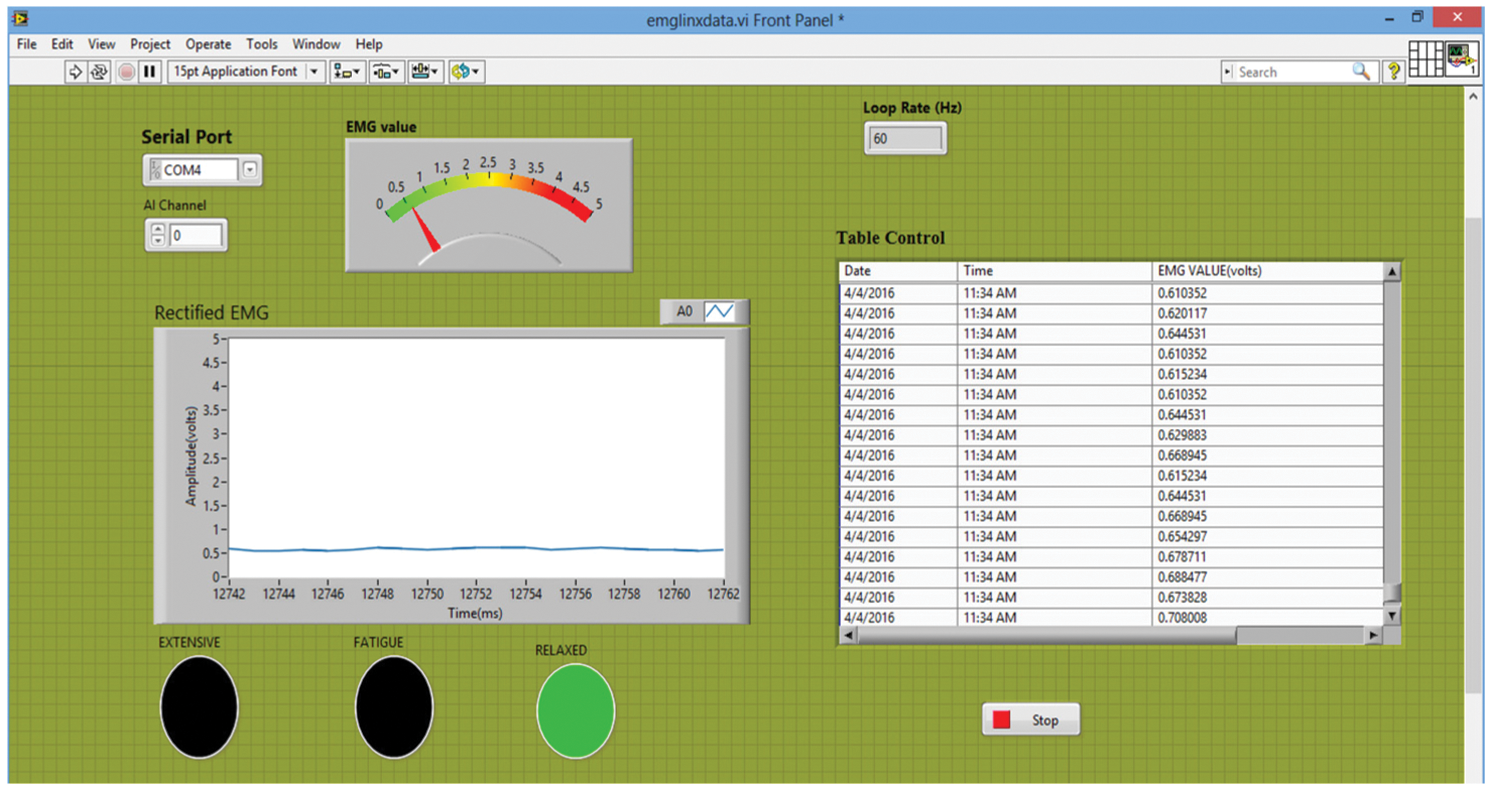
Figure 10: Relax condition of muscles in LabVIEW
The panel presents the current recorded EMG with the date and time of monitoring muscle fatigue. As seen in the table and graph, the EMG value recorded is below the threshold of relaxed muscles which falls in the relaxed condition of the muscles. The graph in Fig. 11 presents the Datalogger designed in LabVIEW indicating the moderate condition. As can be seen from Fig. 11 the EMG value is between 1 and 2, which falls under the moderate conditions of the muscles.
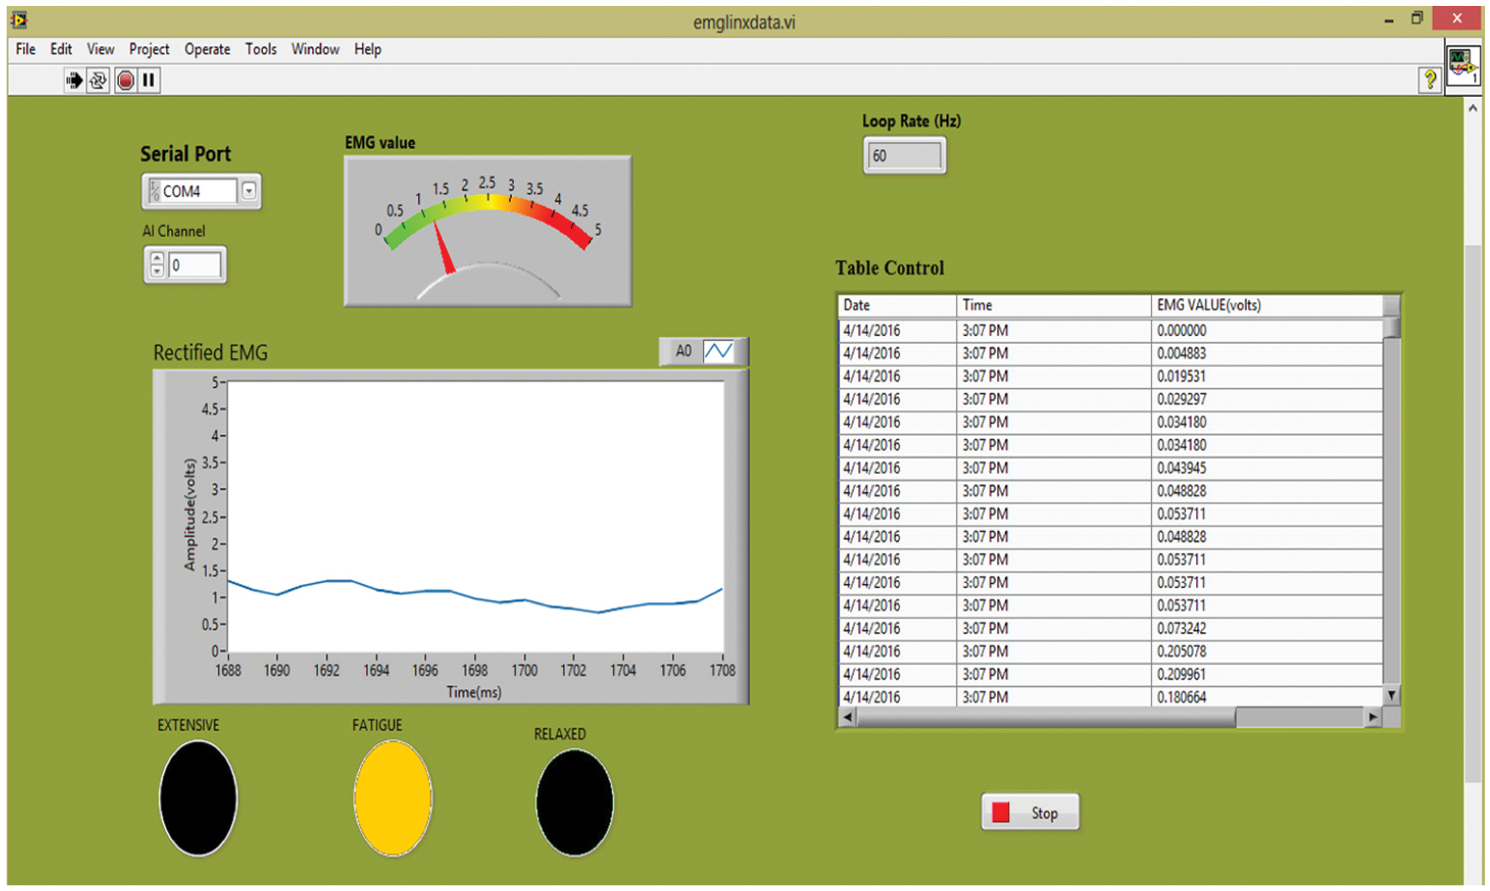
Figure 11: Moderate condition of muscles in LabVIEW
The graph in Fig. 12 presents a screenshot image of Datalogger designed in lab VIEW indicating the user of his relaxed condition. As we can see from Fig. 12 that the EMG value is >2, which was earlier defined as the threshold condition for extensive contracted muscle.
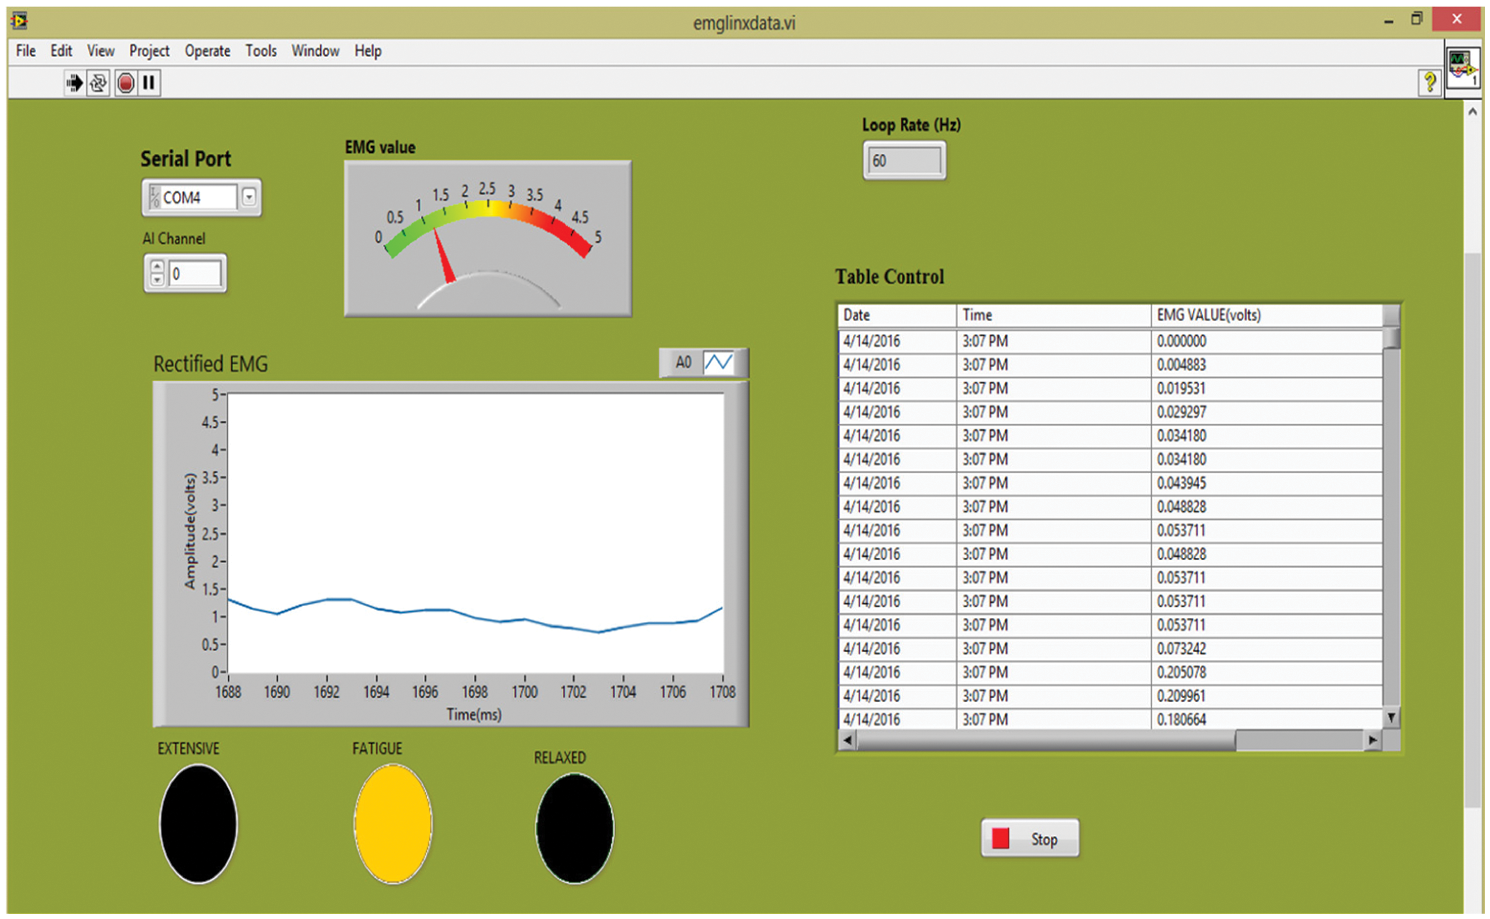
Figure 12: Intense condition of muscles in LabVIEW
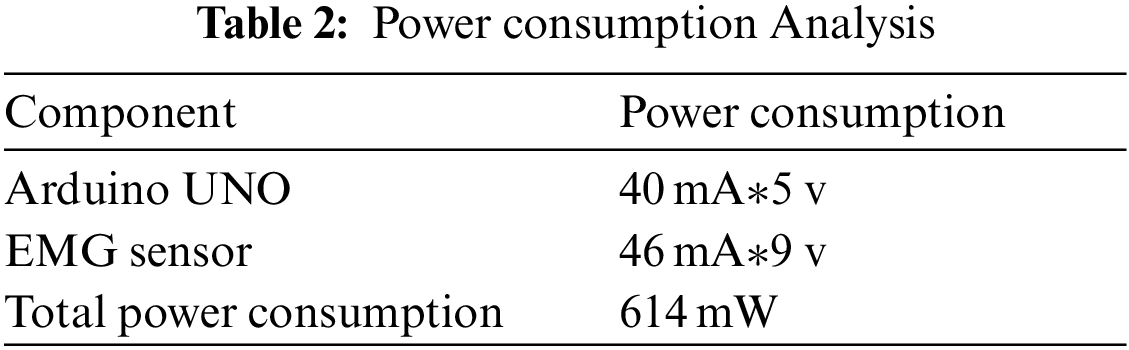
5.3 Power Consumption Analysis
Here we discuss the power consumption analysis of the system. To calculate the power consumption, initially, we need to calculate the power consumption of individual components namely Arduino Uno and EMG sensor as shown in Tab. 2. Here the Arduino Uno consumes 200 mW and the EMG sensor consumes 414 mW, so the total power consumption of the system is 614 mW.
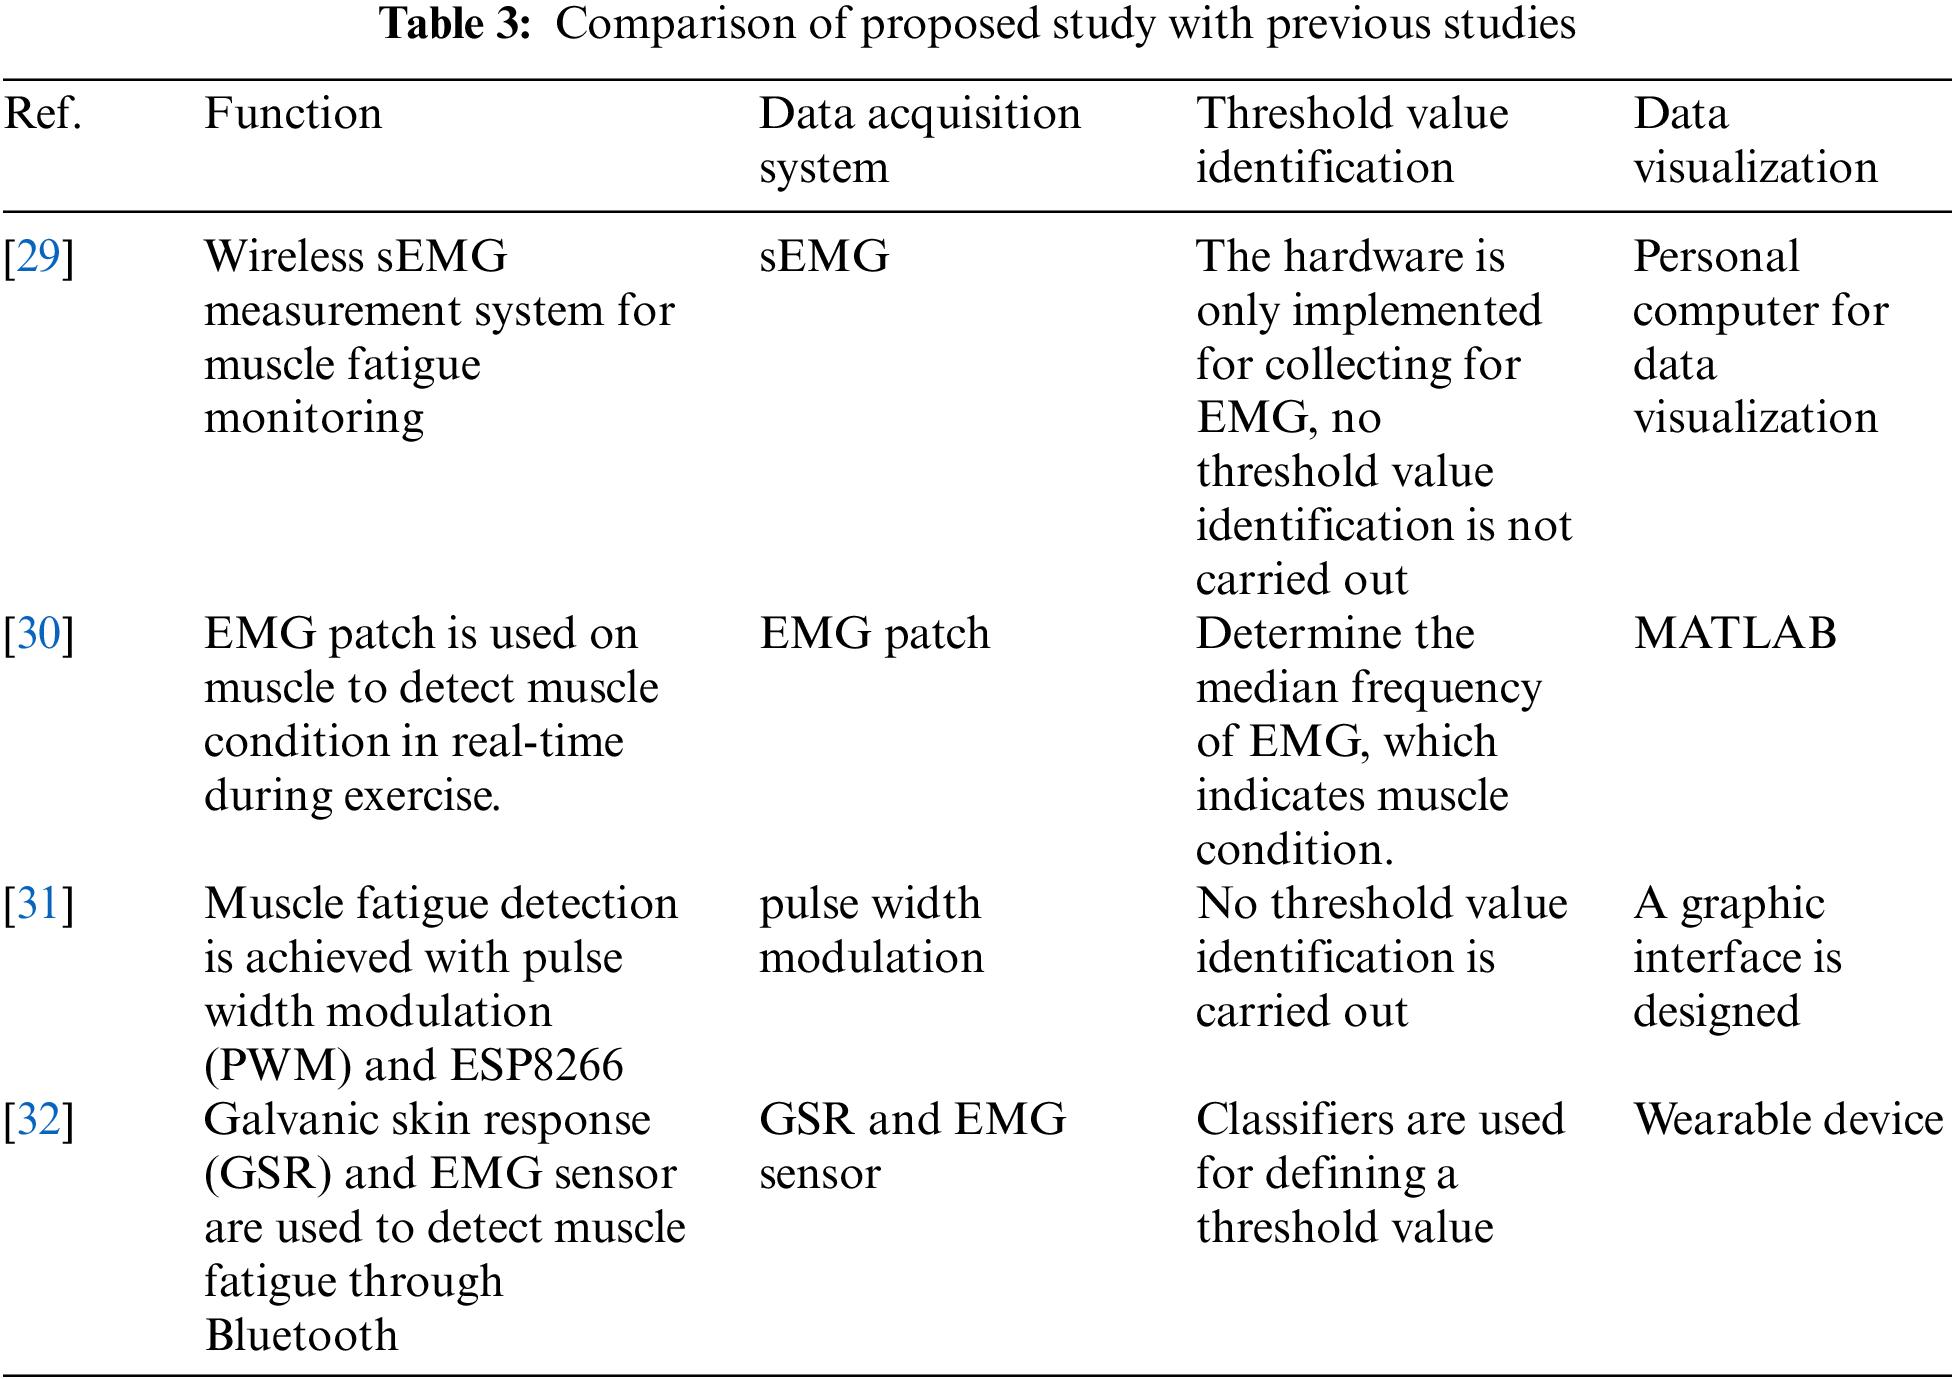
Tab. 3 presents the comparative analysis to address the advancement of the proposed study over previous studies for muscle fatigue detection. In the previous studies, the primary focus is on implementing the device for muscle fatigue detection. Limited studies have identified threshold values to define the different states of muscle fatigue conditions with the wireless hardware-enabled device. The proposed studies implemented IoT enabled muscle fatigue detection with Bluetooth and Wi-Fi. A customized hardware implementation is carried out for identifying the threshold value. In this study, the threshold is identified by the mean RMS value of the recorded data. Once the mean RMS was determined, the mean threshold was scored to categorize the various fatigue states to establish the mean threshold for the mean RMS of the device. Moreover, the proposed system logs the sensor data over the cloud server through Wi-Fi.
Muscle fatigue is a sign that your muscles’ ability to perform is weakening over time. This generally occurs during vigorous exercise. However, at present, wearable devices are widely implemented by everyone for monitoring their physical activities. Based on this an IoT-enabled wearable device with Arduino controller, EMG sensor, and Wi-Fi module is proposed and implemented for monitoring muscle fatigue in real-time. To classify and conclude the threshold value for the three muscle fatigue conditions, the time-frequency domain spectrum technique is implemented along mean RMS and mean frequency. The threshold value for three muscle fatigue conditions is determined by mean RMS value as >2 V: Extensive); 1–2 V: Moderate, and <1 V: relaxed. The warning alarm system was designed in LabVIEW with three color LEDs to indicate the different states of muscle fatigue.
Acknowledgement: This project was funded by the Deanship of Scientific Research (DSR), King Abdulaziz University, Jeddah, under Grant No. (D-15-611-1443). The authors, therefore, gratefully acknowledge DSR technical and financial support.
Funding Statement: This project was funded by the Deanship of Scientific Research (DSR), King Abdulaziz University, Jeddah, under Grant No. (D-15-611-1443). The authors, therefore, gratefully acknowledge DSR technical and financial support.
Conflicts of Interest: The authors declare that they have no conflicts of interest to report regarding the present study.
1. G. J. Davies, B. Riemann and T. Ellenbecker, “Role of isokinetic testing and training after ACL injury and reconstruction,” in Proc. ACL Injuries in the Female Athlete, Springer, Berlin, Heidelberg, pp. 567–588, 2018. [Google Scholar]
2. S. Gaudet, J. Tremblay and F. Dal Maso, “Evolution of muscular fatigue in periscapular and rotator cuff muscles during isokinetic shoulder rotations,” Journal of Sports Sciences, vol. 36, no. 18, pp. 2121–2128, 2018. [Google Scholar]
3. S. L. Morris and G. T. Allison, “Effects of abdominal muscle fatigue on anticipatory postural adjustments associated with arm raising,” Gait & Posture, vol. 24, no. 3, pp. 342–348, 2006. [Google Scholar]
4. F. Billaut and D. Bishop, “Muscle fatigue in males and females during multiple-sprint exercise,” Sport Medicine, vol. 39, no. 4, pp. 257–278, 2009. [Google Scholar]
5. P. A. Karthick and S. Ramakrishnan, “Muscle fatigue analysis in isometric contractions using geometric features of surface electromyography signals,” Biomedical Signal Processing and Control, vol. 68, pp. 102603, 2021. [Google Scholar]
6. A. Barsotti, K. Khalaf and D. Gan, “Muscle fatigue evaluation with EMG and acceleration data: A case study,” in Proc. of the 2020 42nd Annual Int. Conf. of the IEEE Engineering in Medicine & Biology Society (EMBC), Montreal, QC, Canada, pp. 3138–3141, 2020H. [Google Scholar]
7. H. Kim, J. Lee and J. Kim, “Electromyography-signal-based muscle fatigue assessment for knee rehabilitation monitoring systems,” Biomedical Engineering Letters, vol. 8, no. 4, pp. 345–353, 2018. [Google Scholar]
8. C. Roldán Jiménez, P. Bennett, A. Ortiz Garcia and A. I. Cuesta Vargas, “Fatigue detection during sit-to-stand test based on surface electromyography and acceleration: A case study,” Sensors, vol. 19, pp. 4202, 2019. [Google Scholar]
9. G. Emayavaramban, A. Amudha, T. Rajendran, M. Sivaramkumar, K. Balachandar et al., “Identifying user suitability in sEMG based hand prosthesis using neural networks,” Current Signal Transduction Therapy, vol. 14, no. 2, pp. 158–164, 2019. [Google Scholar]
10. H. Jebelli and S. Lee, “Feasibility of wearable electromyography (EMG) to assess construction workers’ muscle fatigue,” in Advances in Informatics and Computing in Civil and Construction Engineering, Switzerland, Springer, Chapter No. 22, pp. 181–187, 2019. [Google Scholar]
11. D. A. Gabriel, A. Christie, J. G. Inglis and G. Kamen, “Experimental and modelling investigation of surface EMG spike analysis,” Medical Engineering Physics, vol. 33, no. 4, pp. 427–437, 2011. [Google Scholar]
12. R. M. Enoka and J. Duchateau, “Muscle fatigue: What, why and how it influences muscle function,” the Journal of Physiology, vol. 586, no. 1, pp. 11–23, 2008. [Google Scholar]
13. S. W. Chen, J. W. Liaw, H. L. Chan, Y. J. Chang and C. H. Ku, “A Real-time fatigue monitoring and analysis system for lower extremity muscles with cycling movement,” Sensors, vol. 14, no. 7, pp. 12410–12424, 2014. [Google Scholar]
14. A. D. S. C. Oliveira and M. Gonçalves, “EMG amplitude and frequency parameters of muscular activity: Effect of resistance training based on electromyographic fatigue threshold,” Journal of Electromyography and Kinesiology, vol. 19, no. 2, pp. 295–303, 2009. [Google Scholar]
15. G. Venugopal and S. Ramakrishnan, “Analysis of progressive changes associated with muscle fatigue in dynamic contraction of biceps brachii muscle using surface EMG signals and bispectrum features,” Biomedical Engineering Letters, vol. 4, no. 3, pp. 269–276, 2014. [Google Scholar]
16. R. G. Mello, L. F. Oliveira and J. Nadal, “Digital Butterworth filter for subtracting noise from low magnitude surface electromyogram,” Computer Methods and Programs in Biomedicine, vol. 87, no. 1, pp. 28–35, 2007. [Google Scholar]
17. B. Karagözoğlu, W. H. Sindi and A. A. Al-Omari, “Design and development of a practical muscle fatigue monitor,” in 2009 5th IEEE GCC Conference & Exhibition, Kuwait, pp. 1–7, 2009. [Google Scholar]
18. S. Akram, N. Javaid, A. Tauqir, A. Rao and S. N. Mohammad, “The-fame: Threshold based energy-efficient fatigue measurement for wireless body area sensor networks using multiple sinks,” in 2013 Eighth Int. Conf. on Broadband and Wireless Computing, Communication and Applications, Compiegne, France, pp. 214–220, 2013. [Google Scholar]
19. M. Tanaka, T. Okuyama and K. Saito, “Study on evaluation of muscle conditions using a mechanomyogram sensor,” in 2011 IEEE Int. Conf. on Systems, Man, and Cybernetics, Anchorage, AK, USA, pp. 741–745, 2011. [Google Scholar]
20. F. Iellamo, D. Lucini, M. Volterrani, M. Casasco, A. Salvati et al., “Autonomic nervous system responses to strength training in top-level weight lifters,” Physiological Reports, vol. 7, no. 20, pp. 14233, 2019. [Google Scholar]
21. E. Cvejic, C. X. Sandler, A. Keech, B. K. Barry, A. R. Lloyd et al., “Autonomic nervous system function, activity patterns, and sleep after physical or cognitive challenge in people with chronic fatigue syndrome,” Journal of Psychosomatic Research, vol. 103, pp. 91–94, 2017. [Google Scholar]
22. T. Askaripoor, M. Motamedzadeh, R. Golmohammadi, M. Farhadian, M. Babamiri et al., “Non-image forming effects of light on brainwaves, autonomic nervous activity, fatigue, and performance,” Journal of Circadian Rhythms, vol. 16, pp. 1–13, 2018. [Google Scholar]
23. J. Hu, J. D. Browne, J. T. Baum, A. Robinson, M. T. Arnold et al., “Lower limb graduated compression garments modulate autonomic nervous system and improve post-training recovery measured via heart rate variability,” International Journal of Exercise Science, vol. 13, no. 7, pp. 1794, 2020. [Google Scholar]
24. A. Phinyomark and E. Scheme, “EMG pattern recognition in the era of big data and deep learning,” Big Data and Cognitive Computing, vol. 2, no. 3, pp. 21, 2018. [Google Scholar]
25. J. Wang, Y. Sun and S. Sun, “Recognition of muscle fatigue status based on improved wavelet threshold and CNN-SVM,” IEEE Access, vol. 8, pp. 207914–207922, 2020. [Google Scholar]
26. K. M. Chang, S. -H. Liu and X. -H. Wu, “A wireless sEMG recording system and its application to muscle fatigue detection,” Sensors, vol. 12, no. 1, pp. 489–499, 2012. [Google Scholar]
27. A. Moniri, D. Terracina, J. Rodriguez-Manzano, P. H. Strutton and P. Georgiou, “Real-time forecasting of sEMG features for trunk muscle fatigue using machine learning,” IEEE Transactions on Biomedical Engineering, vol. 68, no. 2, pp. 718–727, 2021. [Google Scholar]
28. X. Zhang, Y. Wang and R. P. S. Han, “Wavelet transform theory and its application in EMG signal processing,” in Proc. of 2010 Seventh Int. Conf. on Fuzzy Systems and Knowledge Discovery, Yantai, China, pp. 2234–2238, 2010. [Google Scholar]
29. K. T. Özgünen, U. Çelik and S. S. Kurdak, “Determination of an optimal threshold value for muscle activity detection in EMG analysis,” Journal of Sports Science & Medicine, vol. 9, no. 4, pp. 620, 2010. [Google Scholar]
30. S. H. Liu, J. Huang, Y. F. Huang, T. H. Tan and T. S. Huang, “A wearable device for monitoring muscle condition during exercise,” in Asian Conference on Intelligent Information and Database Systems, Singapore, pp. 402–410, 2020. [Google Scholar]
31. B. Ma, C. Li, Z. Wu, Y. Huang, A. C. van der Zijp-Tan et al., “Muscle fatigue detection and treatment system driven by internet of things,” BMC Medical Informatics and Decision Making, vol. 19, no. 7, pp. 1–9, 2019. [Google Scholar]
32. L. Boon-Leng, L. Dae-Seok and L. Boon-Giin, “Mobile-based wearable-type of driver fatigue detection by GSR and EMG,” in TENCON 2015–2015 IEEE Region 10 Conference, Osaka, Japan, pp. 1–4, 2015. [Google Scholar]
 | This work is licensed under a Creative Commons Attribution 4.0 International License, which permits unrestricted use, distribution, and reproduction in any medium, provided the original work is properly cited. |