DOI:10.32604/cmc.2022.024065
| Computers, Materials & Continua DOI:10.32604/cmc.2022.024065 | |
| Article |
Detection and Classification of Diabetic Retinopathy Using DCNN and BSN Models
Department of ECE, SRC, SASTRA Deemed University, Kumbakonam, India
*Corresponding Author: S. Sudha. Email: mcvsudha@src.sastra.edu
Received: 02 October 2021; Accepted: 21 December 2021
Abstract: Diabetes is associated with many complications that could lead to death. Diabetic retinopathy, a complication of diabetes, is difficult to diagnose and may lead to vision loss. Visual identification of micro features in fundus images for the diagnosis of DR is a complex and challenging task for clinicians. Because clinical testing involves complex procedures and is time-consuming, an automated system would help ophthalmologists to detect DR and administer treatment in a timely manner so that blindness can be avoided. Previous research works have focused on image processing algorithms, or neural networks, or signal processing techniques alone to detect diabetic retinopathy. Therefore, we aimed to develop a novel integrated approach to increase the accuracy of detection. This approach utilized both convolutional neural networks and signal processing techniques. In this proposed method, the biological electro retinogram (ERG) sensor network (BSN) and deep convolution neural network (DCNN) were developed to detect and classify DR. In the BSN system, electrodes were used to record ERG signal, which was pre-processed to be noise-free. Processing was performed in the frequency domain by the application of fast Fourier transform (FFT) and mel frequency cepstral coefficients (MFCCs) were extracted. Artificial neural network (ANN) classifier was used to classify the signals of eyes with DR and normal eye. Additionally, fundus images were captured using a fundus camera, and these were used as the input for DCNN-based analysis. The DCNN consisted of many layers to facilitate the extraction of features and classification of fundus images into normal images, non-proliferative DR (NPDR) or early-stage DR images, and proliferative DR (PDR) or advanced-stage DR images. Furthermore, it classified NPDR according to microaneurysms, hemorrhages, cotton wool spots, and exudates, and the presence of new blood vessels indicated PDR. The accuracy, sensitivity, and specificity of the ANN classifier were found to be 94%, 95%, and 93%, respectively. Both the accuracy rate and sensitivity rate of the DCNN classifier was 96.5% for the images acquired from various hospitals as well as databases. A comparison between the accuracy rates of BSN and DCNN approaches showed that DCNN with fundus images decreased the error rate to 4%.
Keywords: Deep convolution neural network; artificial neural network; non-proliferative diabetic retinopathy; biological ERG sensor network
Diabetes is caused by an insulin deficiency, which affects the body's ability to metabolize glucose. The risk of developing diabetes is gradually increasing. Therefore, it is necessary to provide machine learning-based solutions, to save time for frequent medical check-ups. Diabetes affects most of the organs in our body, and the damage it causes to the eye is called diabetic retinopathy (DR). Firstly, the disease symptoms are difficult to identify, causing delayed diagnosis; consequently, vision loss or blindness may occur. In an early stage (non-proliferative DR [NPDR]), lesions that appear in fundus images are as follows: microaneurysms, which appear as tiny blood clots in the retina; hemorrhages, blood leakage sometimes shows flame-shaped appearance; exudates, yellowish deposits in the retina; and cotton wool spots, fluffy white structures. In the advanced stage (proliferative DR [PDR]), thin and fragile, new blood vessels grow in the retina. Over time, blood leakage in the retina causes total blindness.
Deep convolution neural network (DCNN) involves pre-processing and feature extraction, and biological electroretinogram signal (ERG) sensor network (BSN) involves filtering and mel frequency cepstral coefficient (MFCC) feature extraction. After the features are extracted, classifiers such as DCNN and artificial neural network (ANN) would be trained. Subsequently, patient fundus images and biological ERG signals will be tested to determine whether an eye has DR or is normal.
Accuracy of image processing may be unsatisfactory, and therefore, DCNN and BSN were introduced. In DCNN, thirteen layers (convolutional) are used for feature extraction, and the last three layers are fully connected. It is followed by connecting output from the last fully connected layer to a five-way softmax layer, which computes probability distribution and presents a class label output. Output can be any one of the five class labels: class 1, normal fundus image; class 2, mild DR; class 3, moderate DR; class 4, severe DR; and class 5, PDR with new fragile blood vessels. Generally, increasing the number of convolutional layers in the DCNN can reduce the number of features. This image classification task achieves the best result with 13 convolutional layers. Adding more convolutional layers increases the depth of the network.
Only the proposed system focuses on all early and late signs of DR (novelty). It increases the accuracy rate, despite the direct application of non-dilated raw input images and biological ERG sensor signals. The error rate of the proposed algorithm was reduced to 4%. This system enhances the idea of detecting DR both from fundus images and ERG signals.
The application of convolutional neural networks (CNNs) for the detection of DR has been explained briefly in a previous report [1]. Public image datasets were reviewed, and different stages and the various performance measures for DR detection were analyzed. The author proposed a deep neural network (DNN) model [2] for the identification of lesions. It operates on image patches, and under-sampling of images reduces the complexity and computation time. Sensitivity was calculated as 94%. Deep learning is discussed [3] with regard to handwritten text recognition. Lexicon based architectures and recurrent neural networks were used for this process. Input to the algorithm is handwritten text, and output is symbol streams. Pre-processing eliminates the requirement of symbol alignment in the algorithm. This algorithm is outstanding for both lexicon-based and arbitrary symbol-based recognition. The proposed DNN model can detect 110 symbols, and there is no constraint that output words should be in a predefined lexicon. The first trial of hierarchical CNNs [4] was proposed to classify apparel categories. It has not been recommended previously for image classification, and this is a knowledge-based embedded classifier whose output is hierarchical information. VGGnet H-CNN is implemented with the fashion MNIST dataset, and this shows that the loss is lower and the accuracy and performance are better than those of the preliminary basic model. Traditional max pooling is avoided by fractional max-pooling [5]. DCNN with artificial neural network classifier layers is trained to extract features. For the classification of DR into five categories, 34,124 images from the Kaggle database were used for training, and 1000 and 53572 images were used for validation and testing, respectively. The observed highest recognition rate was 86.17%. A deep retina application was developed that operates with a cloud computing platform. It helps users upload fundus images of themselves into the server and to obtain the result. It is suitable for self-exams at home as well as for remote care.
A spatial analysis-based DCNN was proposed [6], and it achieved a high accuracy rate of 94%–96%. Unlike conventional techniques, the algorithm uses a simple pre-processing technique, and DCNN was tested with images from public databases like STARE, DRIVE, and Kaggle. DR is a serious complication of diabetes [7], and manual diagnosis of this complication is difficult because it is time-consuming. The author introduced automated CNNs for detecting DR. All CNNs, including VGGNet and Alexnet, were used for testing DR, and the performances were compared among the models. The highest classification accuracy of 95.68% was obtained through the hyperparameter tuning and transfer learning approach. Kaggle datasets are used for training the DCNN. In a previous study [8], three large fine art datasets were obtained, and the fine-tuning experiments were carried out to perform the task of related art image classification. Five classifications were performed using CNNs. In particular cases, where there were only a small number of images/class but there were many classes, a pre-trained model initialization could be preferred. A previous study compared [9] various image processing algorithms, neural network approaches, and fuzzy logic-based detection and classification of DR and its stages.
Early diagnosis using DCNNs for the classification of retinal images can facilitate [10] timely initial clinical treatment and recovery from vision loss. The diagnostic accuracy was noted to be 94.5%, which is superior to that of the classical approach. To outperform the detection and rating of DR, a fully connected CNN with the dropout layer was trained, and it can be applied for any image classification task. The number of training images was 35,000, and with a drop out layer, classification accuracy had been improved. It can be used as a mobile app for easy detection and timesaving. A hybrid method using [11] both image processing and DCNN was proposed. Image processing algorithms include histogram equalization and CLAHE (contrast-limited adaptive histogram equalization). Classification was carried out using DCNN with 400 retinal images from the MESSIDOR database, and the parameters evaluated were accuracy (97%), sensitivity (94%), and specificity (98%). A detailed review of DR is presented elsewhere [12].
In a previous study [13], a CNN model with data augmentation was proposed for extracting complicated and detailed features and classifying DR and its severity. It classifies DR images into microaneurysms, exudates, and hemorrhages. Training of the network was performed using a high-end graphics processing unit (GPU) with a Kaggle dataset containing 80,000 images, and validation was performed using 5000 images. This system achieved 95% sensitivity and 75% accuracy. Because most of the works are related to manual extraction of features, some investigators [14] suggested that automatic diagnosis and disease classification into stages be performed using a GPU-driven DCNN. The accuracy rate of the single model was 0.386, and a combination of three models (ensembling) showed an improved accuracy of 0.3996. A previous study carefully analyzed [15] the various image processing algorithms based on the detection of DR and deep convolutional network-based classification of DR stages. In another study, a detailed summary [16] of wearable sensors and their advancement towards continuous monitoring without hospitalization was described, and various issues and challenges were focused on.
Previously, a review [17] analyzed body sensor networks and their architecture in detail, with focus on their usage in areas such as medicine and sports. Design consideration [18] factors, the part played by sensors, and advantages and drawbacks of sensors were analyzed. Additionally, some investigated research problems, along with solutions, were also elaborately discussed.
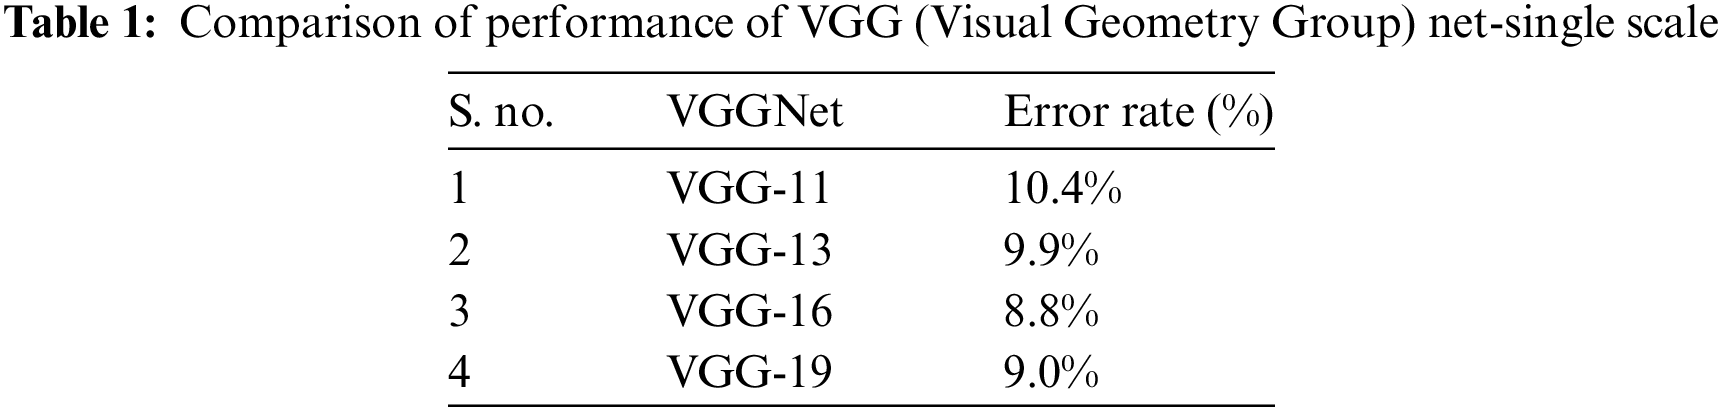
The block diagram of the proposed method is shown in Fig. 1. Inputs were fundus images and biological ERG sensor signals. The DCNN processed the fundus images, and the ANN classifier processed the biological ERG signals. Unlike AlexNet, VGGNet 16 uses 3 × 3 filters over the entire path of the network, and these small-sized filters can trace the entire data sample rapidly. Using two 3 × 3 filters required 18 weight parameters, and using a 5 × 5 filter required 25 unique weight parameters. Therefore, the number of weights to be used and updated was reduced, which further reduced computation. A comparative table for a family of VGGNets and the corresponding performance levels is shown (Tab. 1). From the experimental results, it is clear that VGGNet 16 reduced the false detection and achieved an 8.8% error rate, which is lesser than that of other VGGNets. VGGNet 16 improves the accuracy of detection. An object in the image that must be detected may appear with a different scale, and training the network with the same scale may sometimes cause failure to hit and lead to poor classification accuracy. Therefore, multiscale training and multiscale testing were preferred in this proposed method. A biological ERG sensor signal was pre-processed, and MFCCs were extracted to train and test an ANN classifier. Finally, a comparison was made between the accuracies of the two approaches.
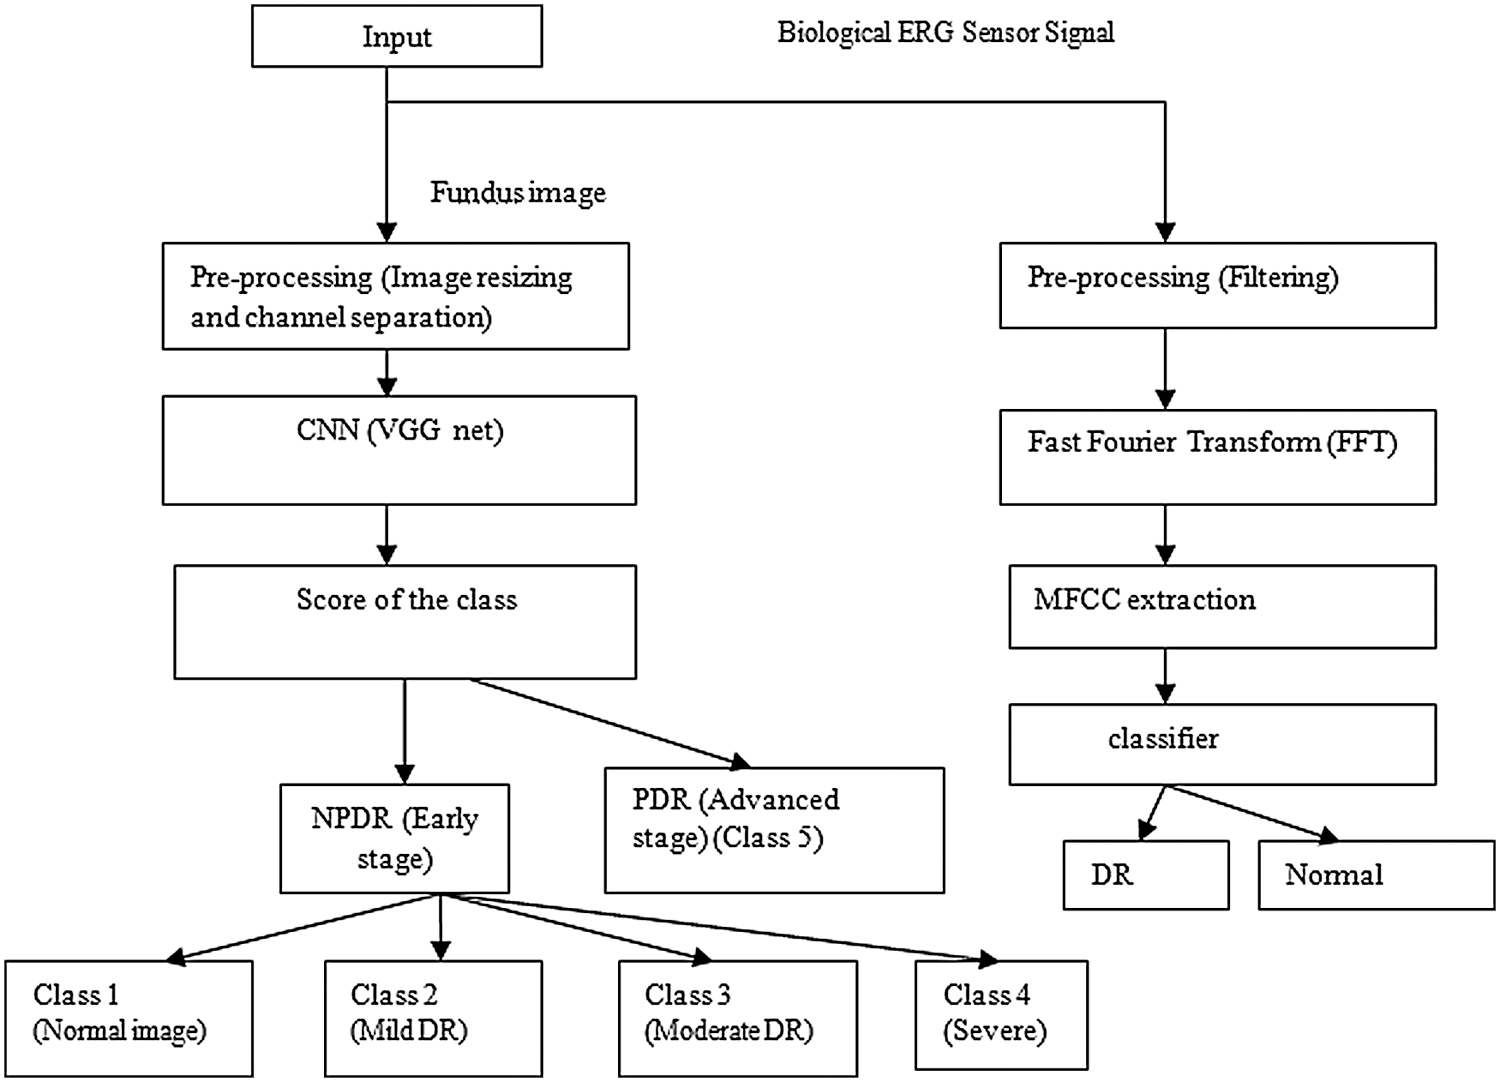
Figure 1: Block diagram of the proposed method
Fundus images larger than 3000 × 2000 were captured and surrounded by black borders, but Convnet requires square images (3000 × 3000); therefore, insertion of additional black borders helped resize the images to 120 × 120 × 3. The workflow consisted of eight stages, as shown in Fig. 2. Regarding VGG architecture, an RGB input image of size 120 × 120 × 3 was applied to a set of convolutional small-size filters (3 × 3). The 5 max-pooling layers (2 × 2) helped achieve spatial pooling, followed by 3 fully connected layers and one softmax layer. DCNN architecture is shown in Fig. 2.
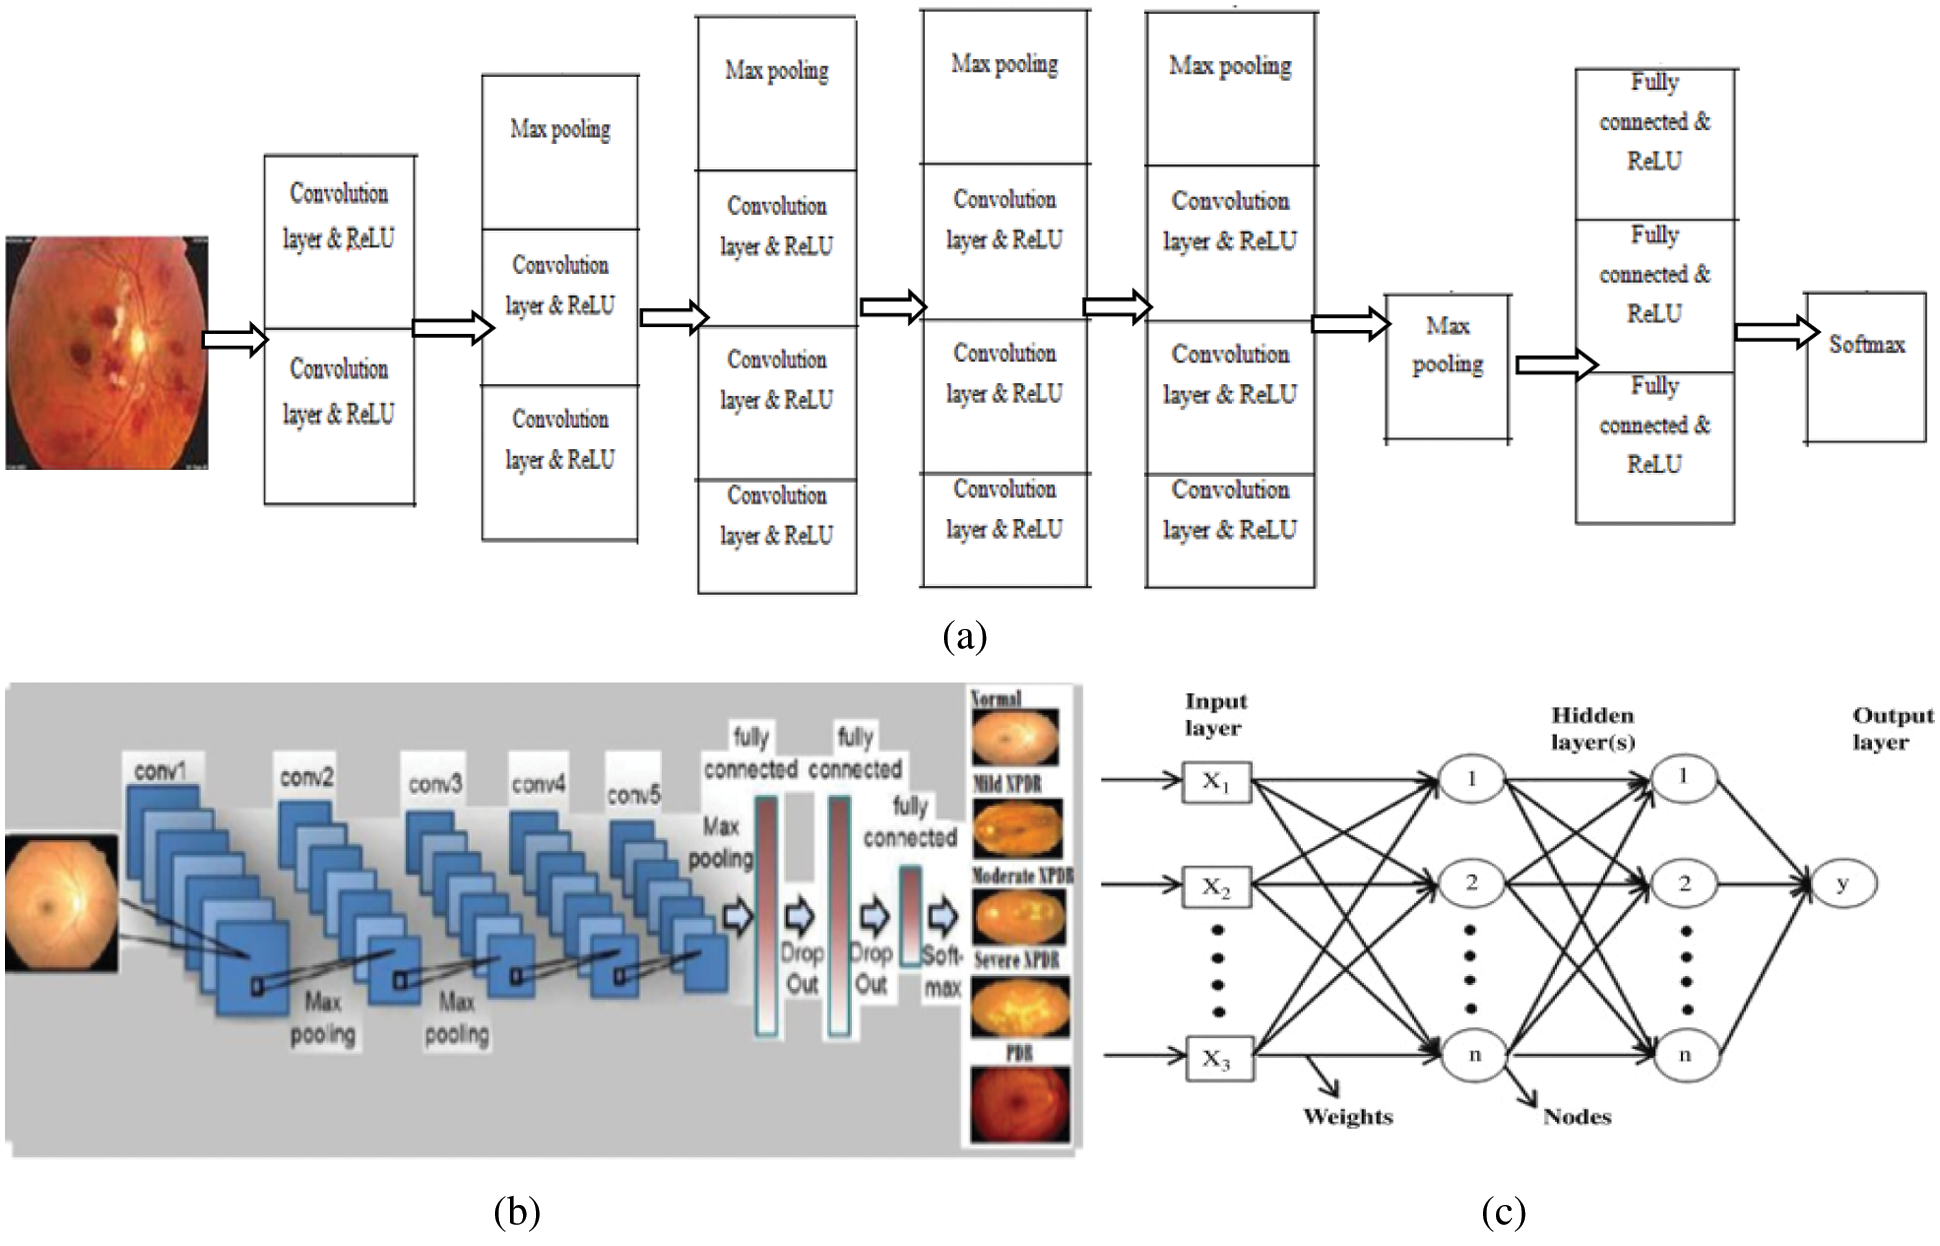
Figure 2: (a) Workflow of DCNN, (b) architecture of DCNN, and (c) architecture of ANN
The details of the layers are as follows:
Image input layer: 120 × 120 × 3 images with “zero center” normalization
Convolution layer: 20, 3 × 3 convolutions with stride [1 1] and padding [0 0]
ReLU: Rectified Linear Unit
Max pooling: 2 × 2 max pooling with stride [2 2] and padding [0 0]
Fully connected layers: 3
Classification layer: soft max
The input image and pre-processing outputs are shown in Fig. 3. The pre-processing stage includes a) image resizing and b) channel separation.
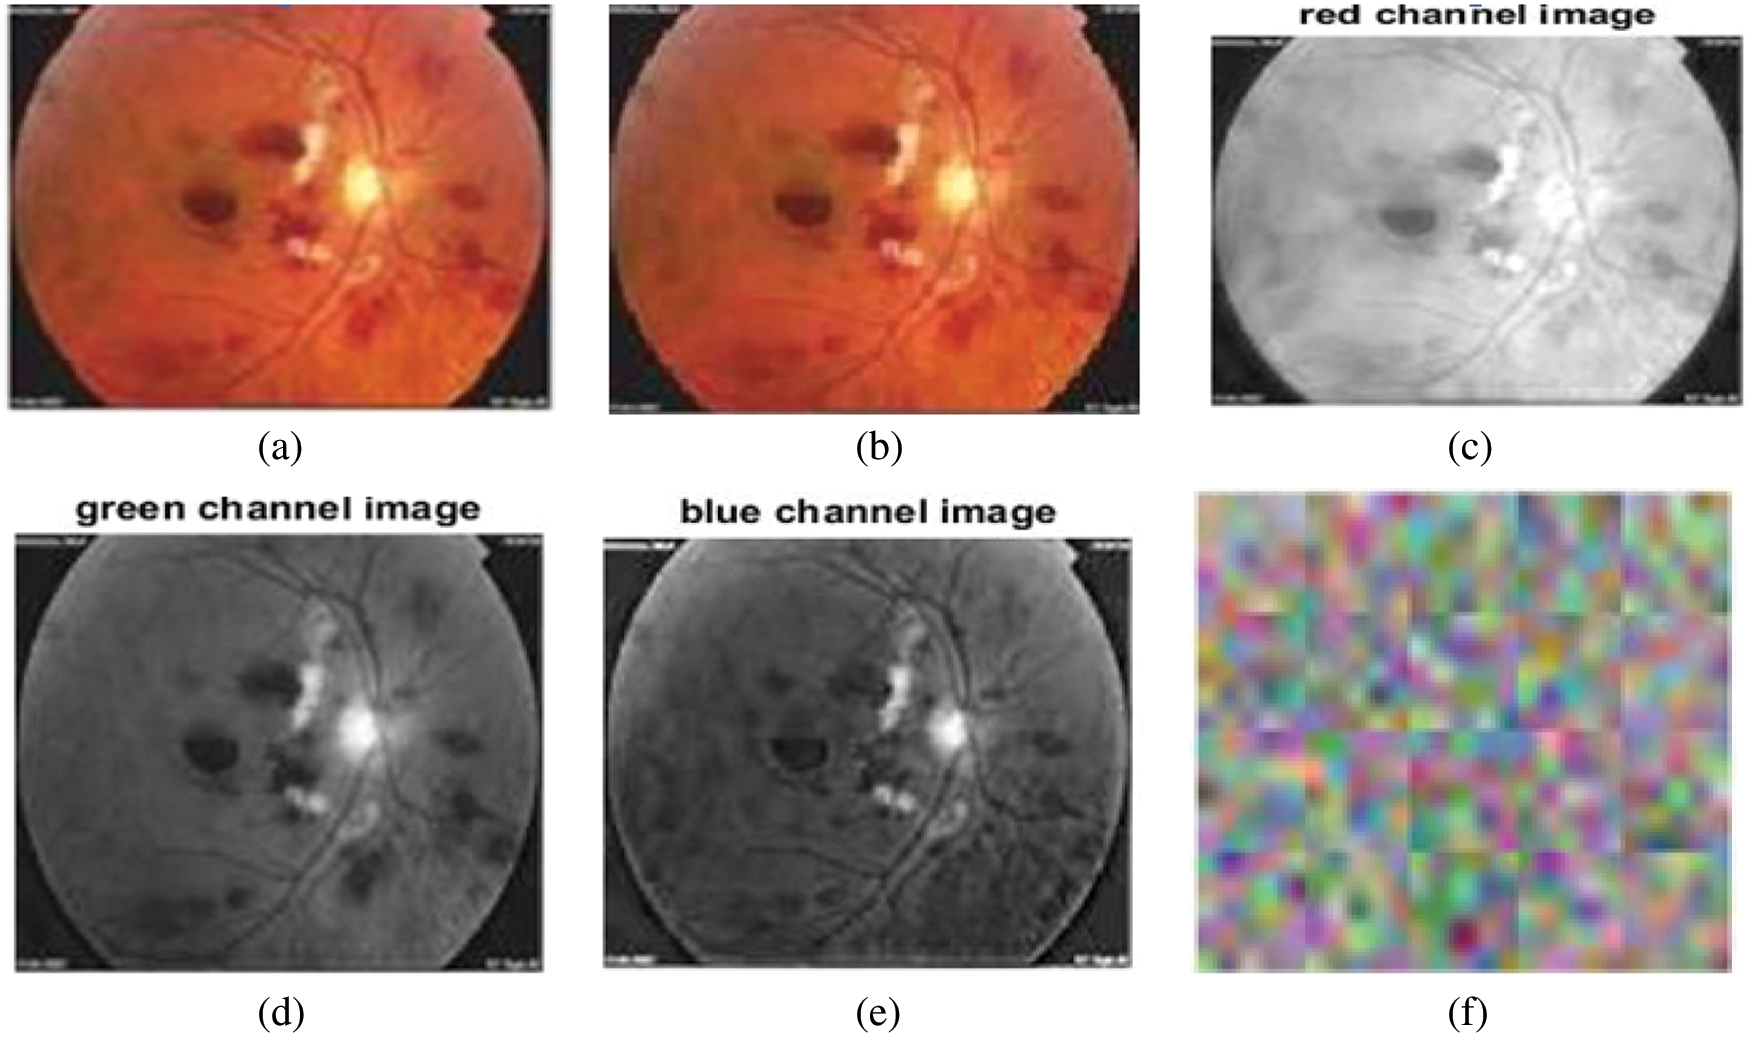
Figure 3: (a) Input image, (b) resized input image, (c) red channel image, (d) green channel image, (e) blue channel image, (f) convolutional layer weights
Feed forwarding input images through a set of convolution layers with 3 × 3 filters helped extract features from the images. Convolution between image I: (nh, nw, nc) and filter F: (k, k, nc) is expressed as
where nh, nw, and nc are the height, width, and channels of the image, respectively, and k is the size of the filter. Rectified linear input (ReLU) converted negative values to zero and preserved positive value features as
Max pooling (down sampling) reduced the dimension using a filter moving across the feature parameters and used only the maximum value; the remaining values were discarded. Output formula for max pooling is (DI − Df)/S + 1, where DI and Df are the dimensions of input and the max pooling filter, respectively, and S is the stride. Operations were carried out as indicated in Fig. 2, and each layer was responsible for identifying different features from the raw input images. Feature learning was followed by classification, and the classification layer is a fully connected layer whose outputs are N-dimensional vectors, where N is the number of classes that must be predicted. Moreover, the softmax activation exponential function reserved the probabilities that the input raw image belongs to a particular class. If softmax input is extensive, class score probability will also be high or low. The softmax activation function is presented as follows:
3.1 Biological ERG Sensor Network (BSN)
In biological ERG sensor signal system, there are two main types of electrodes: contact lens type and non-contact lens type; the types of electrodes include jet electrodes (disposable), skin electrodes, cotton wick electrodes, Burian-Allen electrodes, Mylar electrodes, Dawson-Trick-Litzkow electrodes, and teflon insulated thin metal-wire electrodes. The types of equipment involved in the BSN include a light source, sensors, amplifiers, filters, processor, and a display unit. During the recording of the ERG signal, noise due to head movements or eye blinking is added to the recorded signal. It may cause the recorded signal to exceed the predefined level. Therefore, pre-processing was performed. Signal averaging helped reduce high frequency noise intensities, and the signals were smoothened by convolving the signal with Gaussian filters and followed by first-order Savitzky Golay filters. The ERG signal in the time domain was converted to the frequency domain, and MFCCs were extracted. These features were used to train an ANN classifier. In the testing stage, from the features of the test ERG sensor signal, the ANN classifier classifies signals into DR and normal signals. For training the ANN classifier, 200 signals were used, and the other 100 signals were used for testing. Fig. 4 shows the input ERG signal, pre-processed filtered signal, and classifier output of the BSN system. Discrete cosine transform (DCT) computation is one of the steps involved in MFCC feature extraction. In feature extraction, DCT was computed for the logarithm of filter bank energies. It helps retain the first few important features/coefficients and compresses the higher order coefficients that are not required.
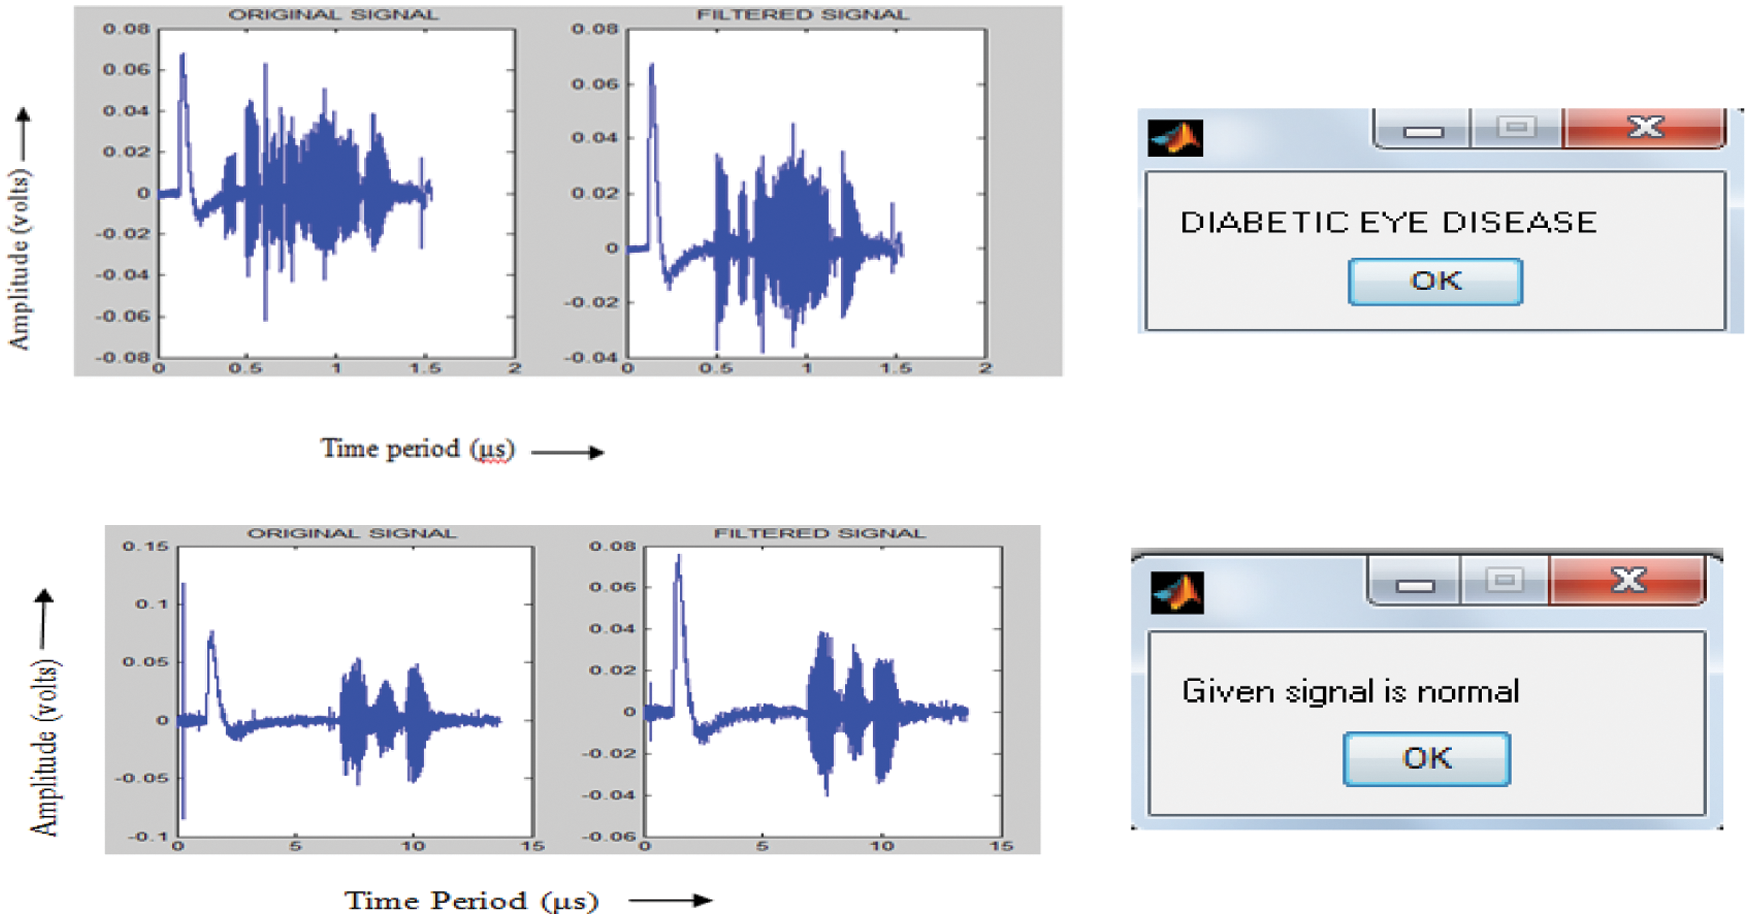
Figure 4: Input ERG signal, filtered signal, and ANN classifier output
The steps involved in MFCC feature extraction are as follows:
1) Converting the recorded signal into short frames
2) Calculating power spectrum
3) Applying mel filter banks and summing up the energy
4) Taking logarithm and DCT to filter energies
5) Extracting DCT coefficients.
The proposed system is a machine learning and deep learning-based system that can be used to detect and classify DR. It differs from the conventional method in that no segmentation process is involved, and DCNN itself extracts features, which play a vital role in classification. Large numbers of features and layers tune the accuracy rate to 96%. In DCNN, features were extracted by in-depth analysis of the image. Therefore, accuracy is comparatively better than those of image and signal processing techniques. In image processing, colored fundus images were converted into gray scale images. Mostly, a single channel was processed by image processing techniques, and the only 1D signal was processed by signal processing algorithms.
The prediction percentage and the top three predictions for an input image are shown in Fig. 5. As shown in Fig. 5, the prediction percentage and top three predictions are high for hemorrhages. Therefore, DCNN shows that the input image being tested is a hemorrhage image. The severity of the disease and stage of DR are shown in Fig. 6.
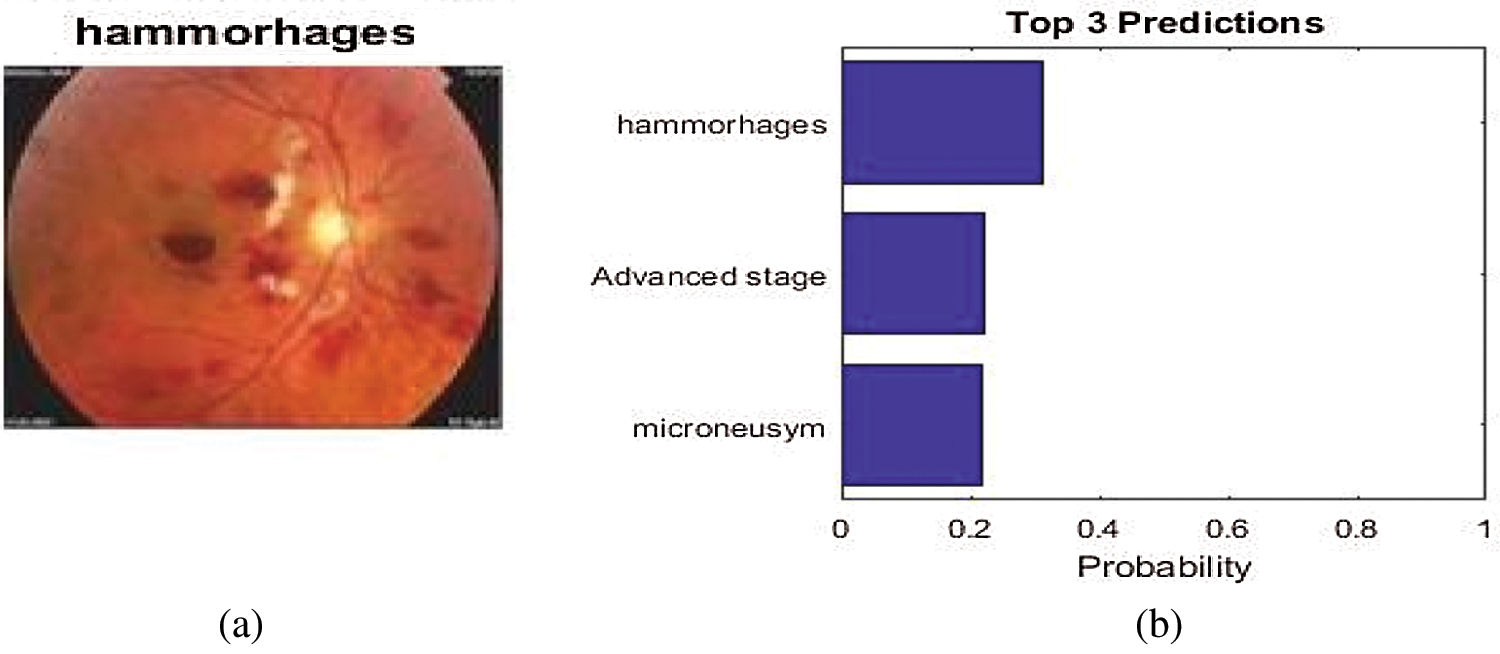
Figure 5: (a) Prediction percentage and (b) top three predictions
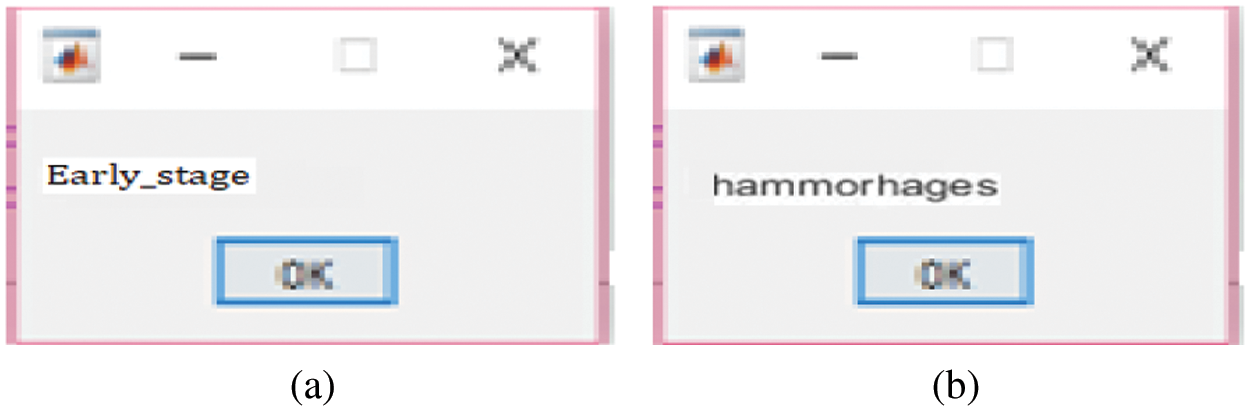
Figure 6: (a) Severity of the disease and (b) DCNN output
The sample inputs and outputs from DCNN are shown in Fig. 7.
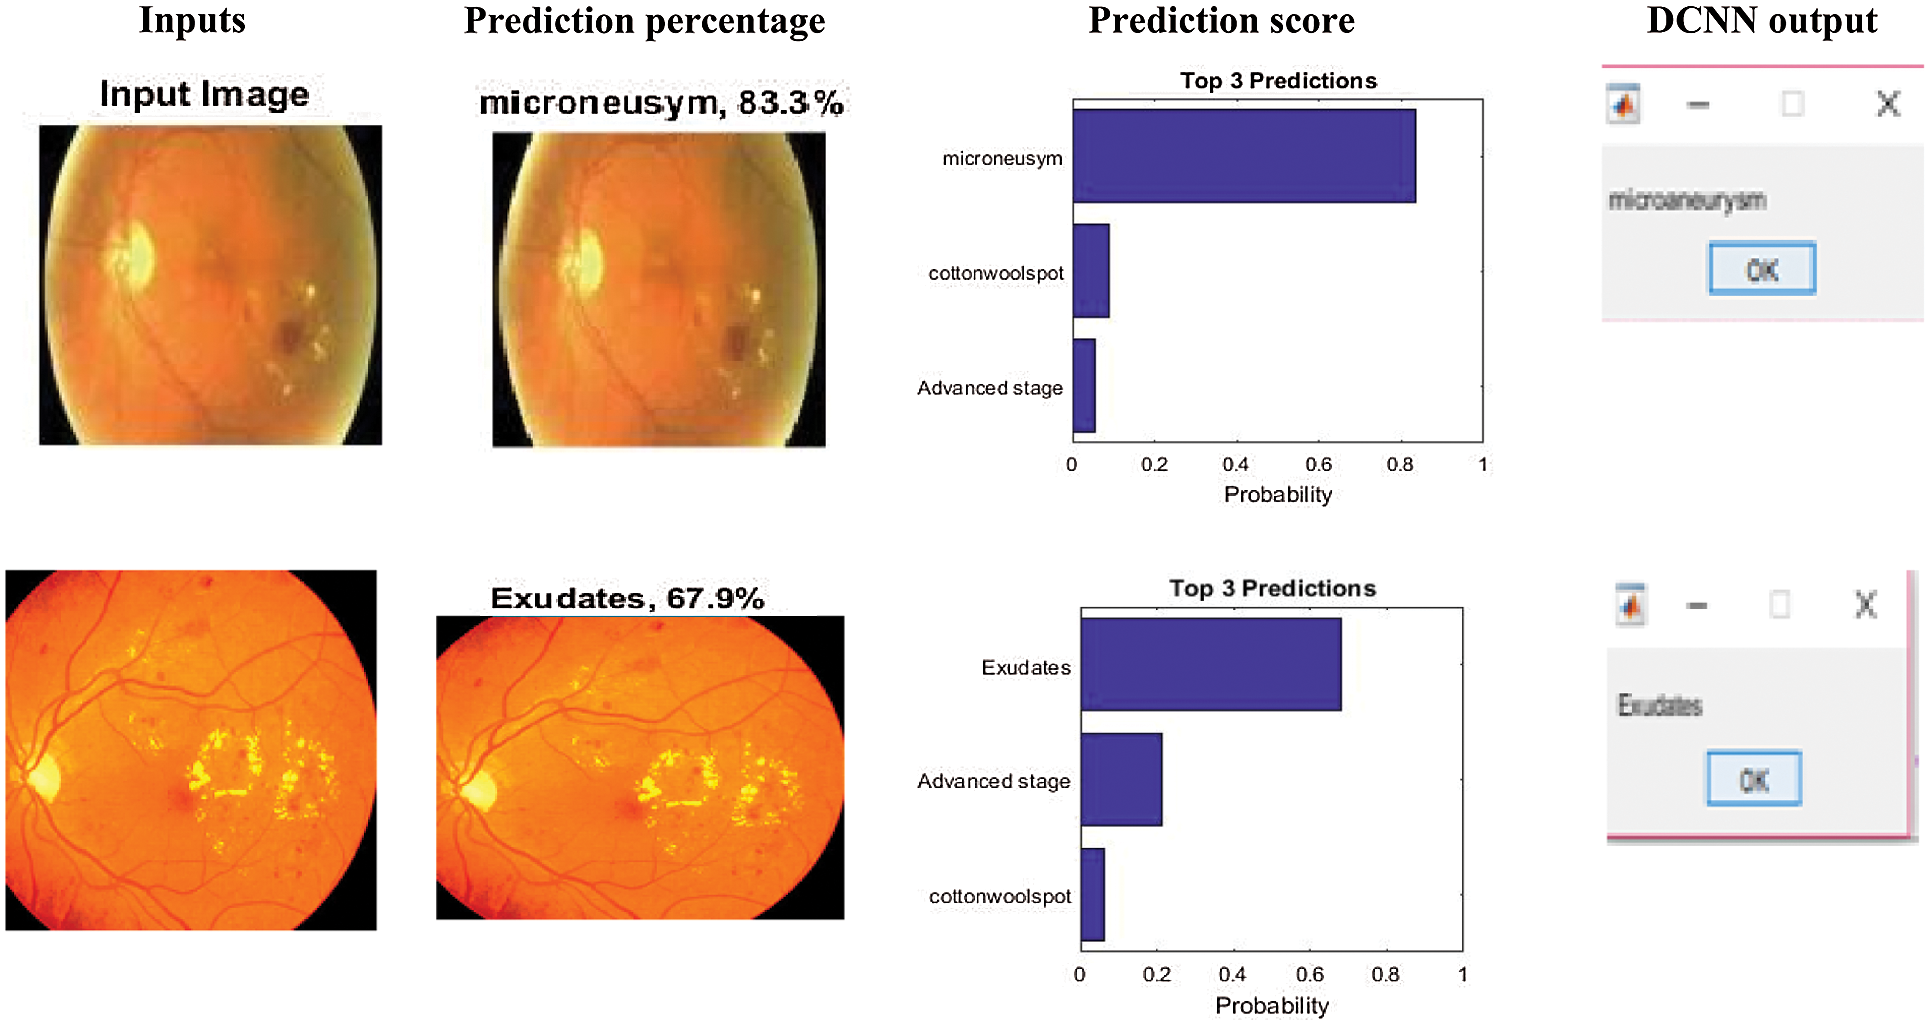
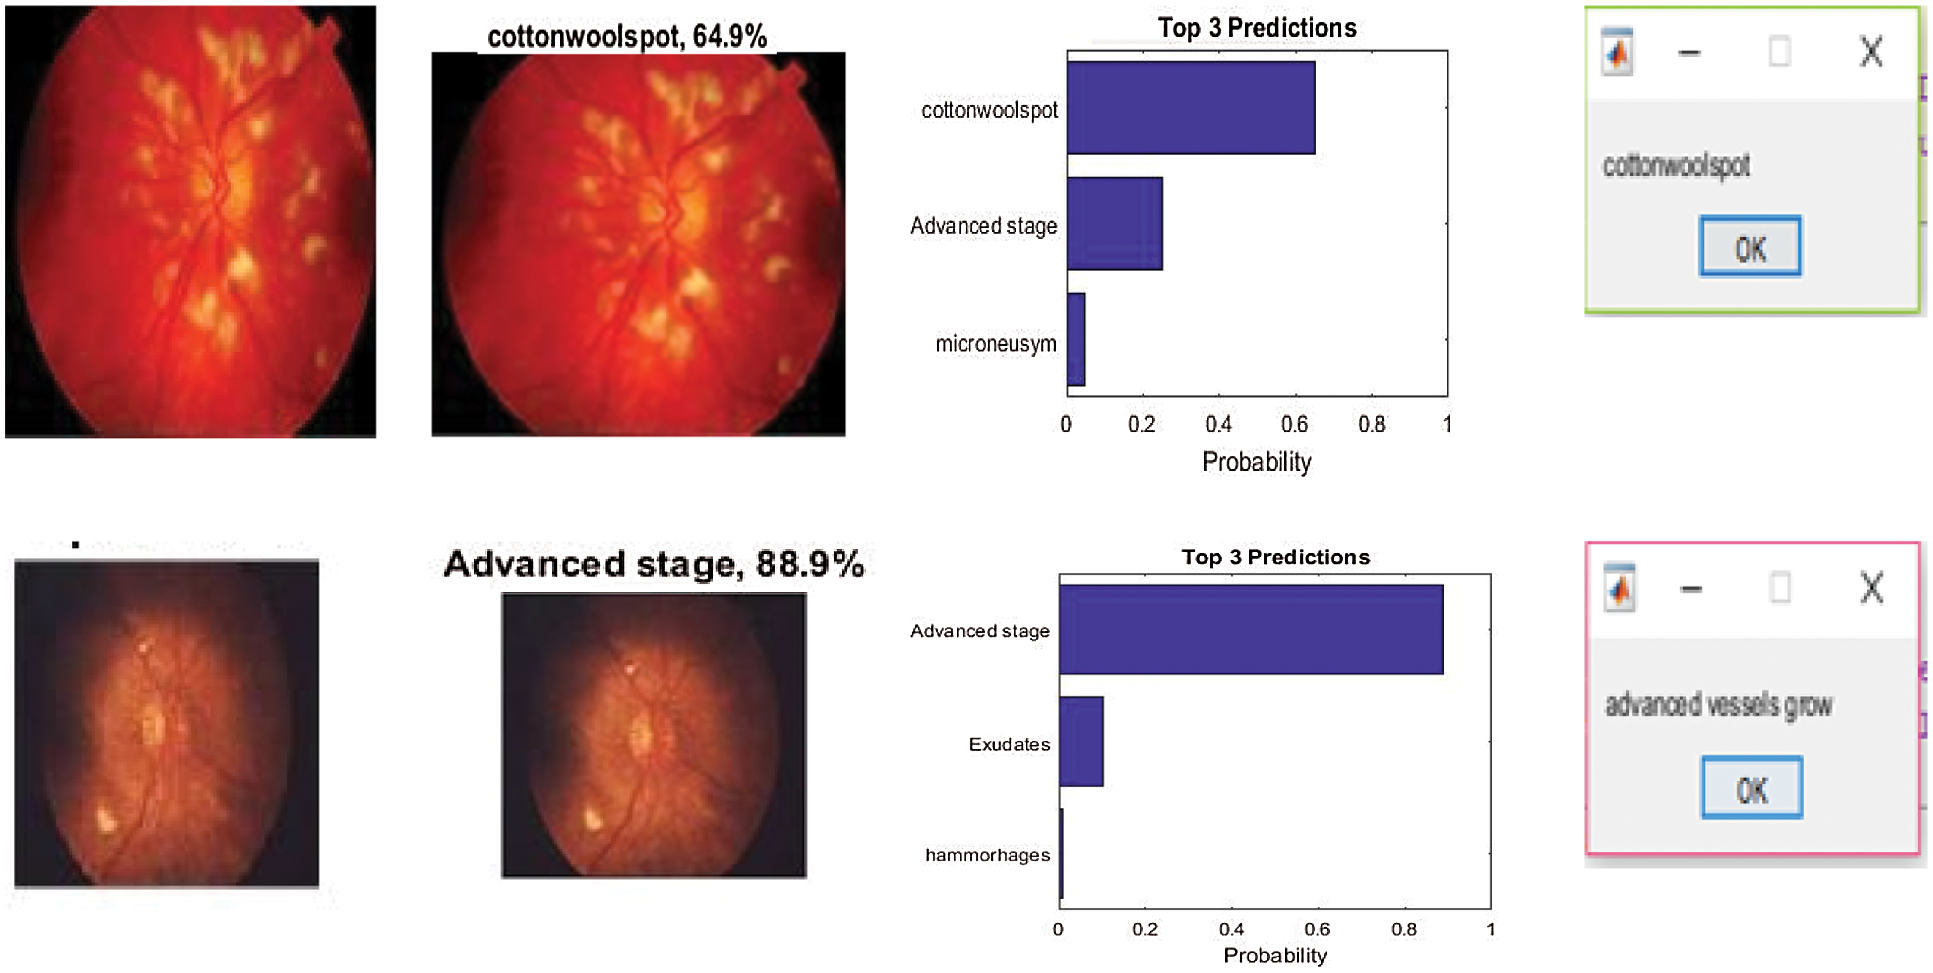
Figure 7: Sample inputs and outputs from DCNN
The performance measures of DCNN and ANN classifiers used in this study were sensitivity, specificity, and accuracy, as displayed in (Tab. 2), and the values were determined using the following equations,
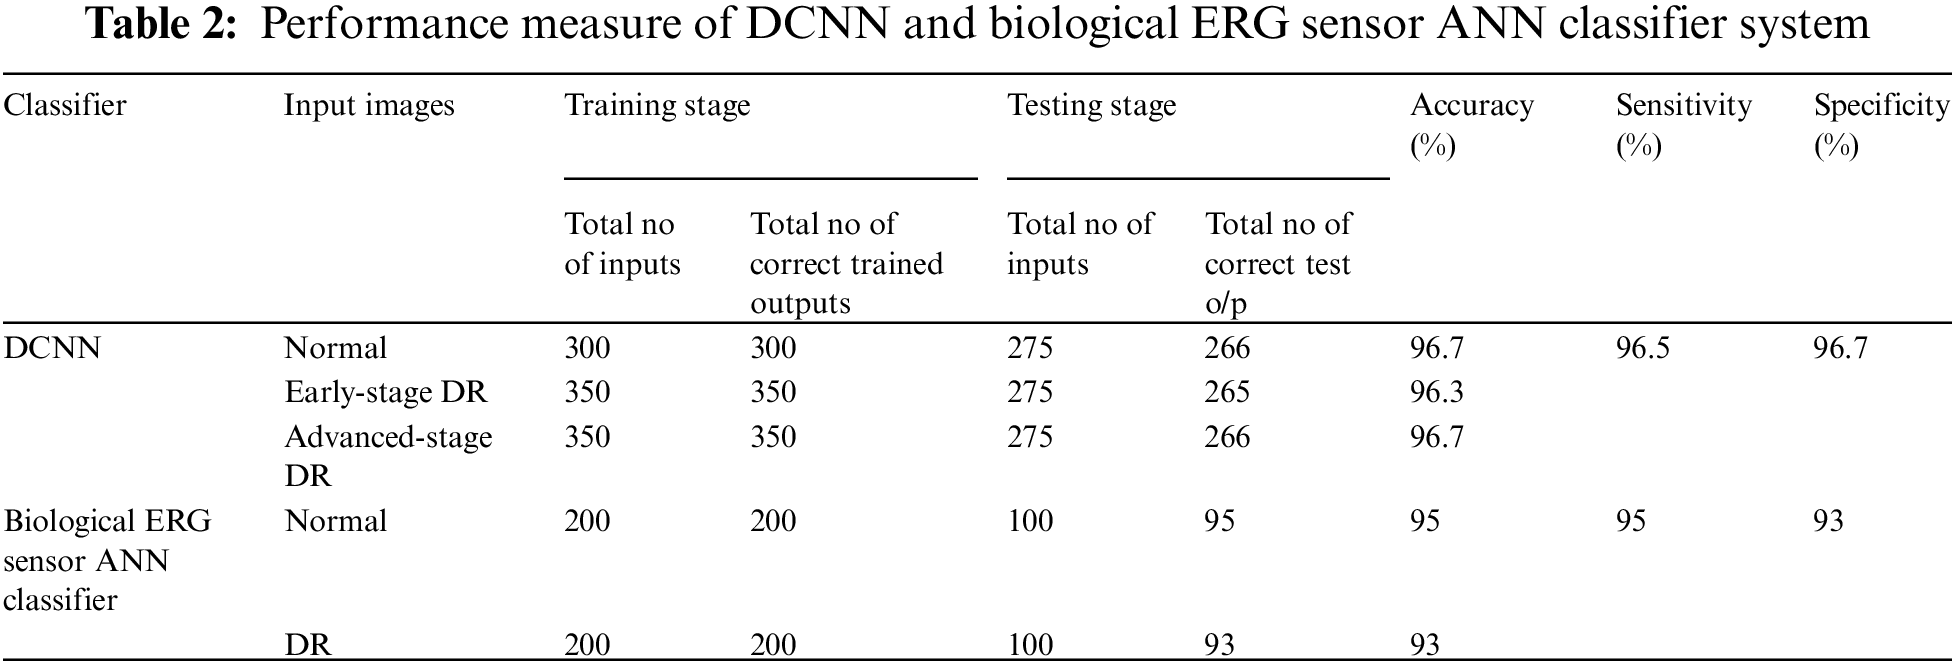
The accuracy rate was defined as,
The accuracy, sensitivity, and specificity of DCNN classification were assessed to be 96.5%, 96.5%, and 96.7%, respectively (Fig. 8).
The accuracy, sensitivity, and specificity of the biological ERG sensor ANN classifier were found to be 94%, 95%, and 93%, respectively.
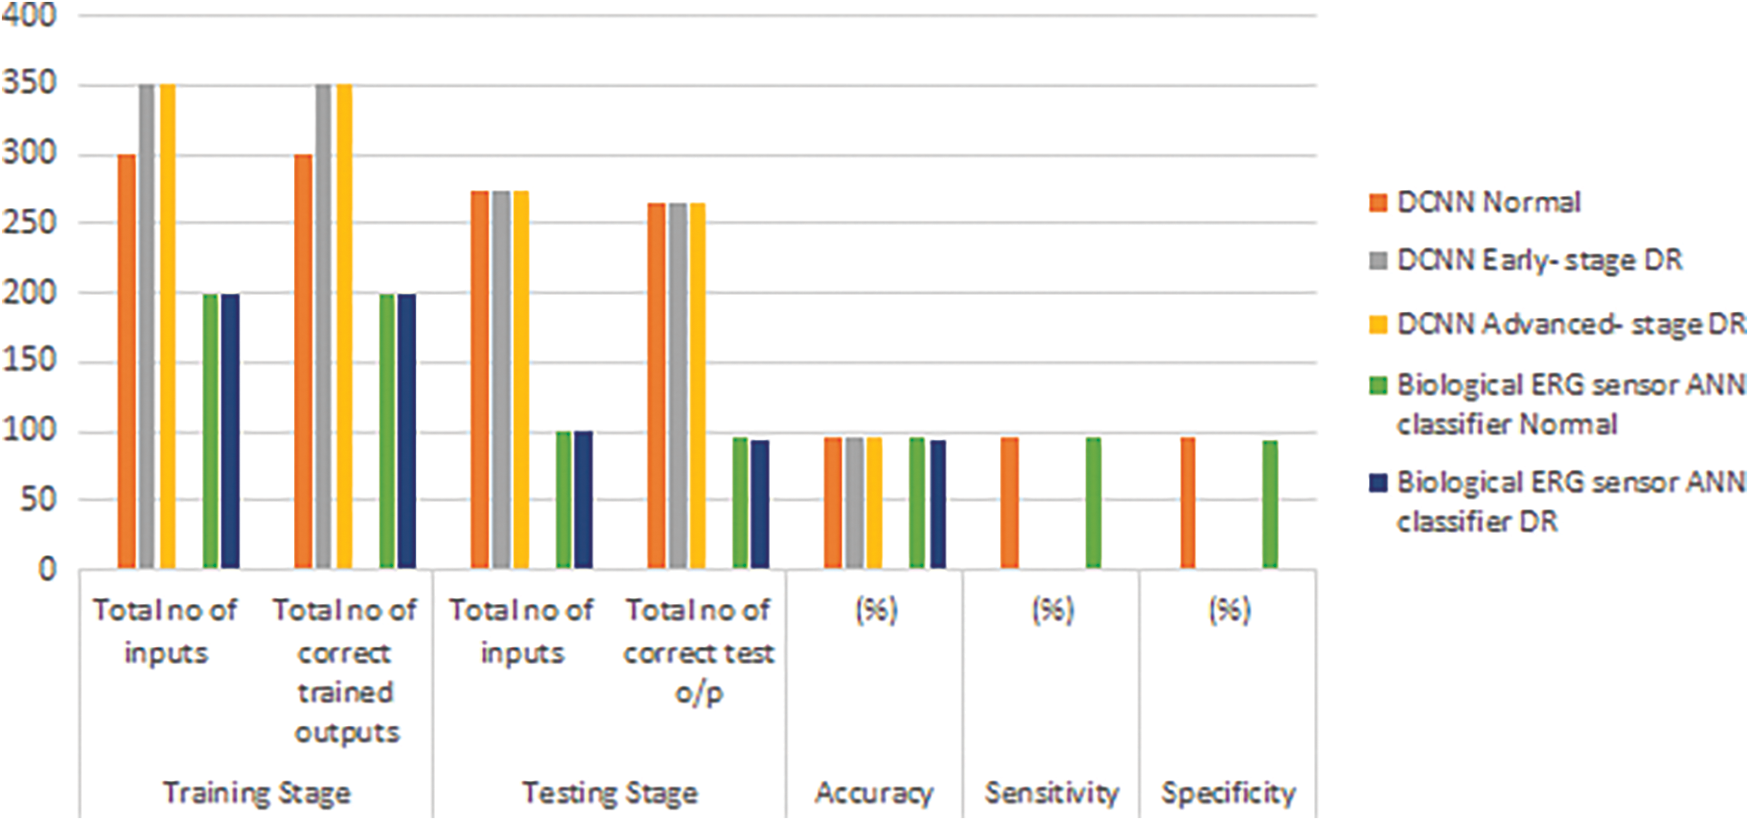
Figure 8: Performance measure of DCNN and ANN classifier
5 Conclusions and Future Enhancements
The proposed system extracts features from raw fundus input images and biological ERG sensor signals. Subsequently, it classifies them into normal, early-stage DR or NPDR, and advanced-stage DR or PDR signals. This is the only system that focuses on all early-and late-stage signs of DR (novelty). It increases the accuracy rate, despite the direct application of non-dilated raw input images and biological ERG sensor signals. The error rate of the proposed algorithm was reduced to 4%. This system enhances the idea of detecting DR using both fundus images and ERG signals. The computation time for the proposed work was 9300 s for DCNN and 3200 s for BSN. Smart phone-based retinal imaging systems and handheld or portable retina cameras are now available in the market, for people that have no time to visit hospitals for dilation and eye testing. With the help of cameras and machine learning techniques, patients can undergo self medical screening and maintain the diabetic level under control. Nowadays cloud-based services also enhance self-screening. Patients have to upload retinal imaging into the cloud service platform. This automated system can be improvised in the future to decrease system complexity and computation time.
Acknowledgement: We would like to thank M/s. Sudarshan Eye Clinic, Sankara Nethralaya, Chennai; M/s. IntuVision Labs Pvt Ltd.; and M/s. Akbar eye hospital, Ananthapur, for their kind support in terms of providing clinical images and diagnostic datasets.
Funding Statement: The authors received no specific funding for this study.
Conflicts of Interest: The authors declare that they have no conflicts of interest to report regarding the present study.
1. W. L. Alyoubi, W. M. Shalash, and M. F. Abulkhair, “Diabetic retinopathy detection through deep learning techniques: A review,” Informatics in Medicine Unlocked, vol. 20, pp. 1–11, 2020. [Google Scholar]
2. G. T. Zago, R. V. Andreao, B. Dorizzi and E. O. Teatini Salles, “Diabetic retinopathy detection using red lesion localization and convolutional neural networks,” Computers in Biology and Medicine, vol. 116, pp. 1–12, 2020. [Google Scholar]
3. R. Ptucha, F. P. Such, S. Pillai, F. Brockler, V. Singh et al., “Intelligent character recognition using fully convolutional neural networks,” Pattern Recognition, vol. 88, pp. 604–613, 2019. [Google Scholar]
4. Y. Seo and K. S. Shin, “Hierarchical convolutional neural networks for fashion image classification,” Expert Systems with Applications, vol. 116, pp. 328–339, 2019. [Google Scholar]
5. Y. H. Li, N. N. Yeh, S. J. Chen and Y. C. Chung, “Computer-assisted diagnosis for diabetic retinopathy based on fundus images using deep convolutional neural network,” Mobile Information Systems, vol. 2019, pp. 1–14, 2019. [Google Scholar]
6. D. J. Hemanth, O. Deperlioglu and U. Kose, “An enhanced diabetic retinopathy detection and classification approach using deep convolutional neural network,” Neural Computing and Applications, vol. 32, pp. 707–72, 2020. [Google Scholar]
7. S. Wan, Y. Liang and Y. Zhang, “Deep convolutional neural networks for diabetic retinopathy detection by image classification,” Computers and Electrical Engineering, vol. 72, pp. 274–282, 2018. [Google Scholar]
8. E. Cetinic, T. Lipic and S. Grgic, “Fine-tuning convolutional neural networks for fine art classification,” Expert Systems with Applications, vol. 114, pp. 107–118, 2018. [Google Scholar]
9. A. Kesar, N. kaur and P. singh, “Eye diabetic retinopathy by using deep learning,” International Research Journal of Engineering and Technology, vol. 5, no. 3, pp. 2504–2508, 2018. [Google Scholar]
10. K. Xu, D. Feng and H. Mi, “Deep convolutional neural network-based early automated detection of diabetic retinopathy using fundus image,” Molecules, vol. 22, no. 12, pp. 1–7, 2017. [Google Scholar]
11. V. Chandore and S. Asati, “Automatic detection of diabetic retinopathy using deep convolutional neural network,” International Journal of Advance Research, Ideas & Innovation in Technology, vol. 3, no. 3, pp. 633–641, 2017. [Google Scholar]
12. S. Sudha and A. Srinivasan, “Unravelling diabetic retinopathy through image processing, neural networks, and fuzzy logic: A review,” Asian Journal of Pharmaceutical and Clinical Research, vol. 10, no. 4, pp. 32–37, 2017. [Google Scholar]
13. H. Pratt, F. Coenen, D. M. Broadbent, S. P. Harding and Y. Zheng, “Convolutional neural networks for diabetic retinopathy,” Procedia Computer Science, vol. 90, pp. 200–205, 2016. [Google Scholar]
14. D. Doshi, A. Shenoye, D. Sidhpura and P. Gharpure, “Diabetic retinopathy detection using deep convolutional neutral networks,” International Conference on Computing, Analytics and Security Trends (CAST), India: College of Engineering Pune, pp. 261–266, 2016. [Google Scholar]
15. T. Chandrakumar and R. Kathirvel, “Classifying diabetic retinopathy using deep learning architecture,” International Journal of Engineering Research & Technology, vol. 5, pp. 19–24, 2016. [Google Scholar]
16. S. C. Mukhopadhyay, “Wearable sensors for human activity monitoring: A review,” IEEE Sensors Journal, vol. 15, no. 3, pp. 1321–1329, 2015. [Google Scholar]
17. X. Lai, Q. Liu, X. Wei, W. Wang, G. Zhou et al., “A survey of body sensor networks,” Sensors, vol. 13, no. 5, pp. 5406–5447, 2013. [Google Scholar]
18. D. Ashraf and A. E. Hassanien, “Wearable and implantable wireless sensor network solutions for healthcare monitoring,” Sensors, vol. 11, no. 6, pp. 5561–5595, 2011. [Google Scholar]
 | This work is licensed under a Creative Commons Attribution 4.0 International License, which permits unrestricted use, distribution, and reproduction in any medium, provided the original work is properly cited. |