DOI:10.32604/cmc.2022.024096
| Computers, Materials & Continua DOI:10.32604/cmc.2022.024096 | |
| Article |
Dynamic Data Optimization in IoT-Assisted Sensor Networks on Cloud Platform
1Faculty of Information Technology, Ho Chi Minh City University of Foreign Languages-Information Technology, Ho Chi Minh City, 70000, Vietnam
2Department of Information Technology, Vels Institute of Science, Technology & Advanced Studies, Chennai, 600117, India
3Department of Computer Science and Engineering, Sister Nivedita University, Kolkata, 700156, India
4Department of Computer Science and Engineering, JIS College of Engineering, Nadia, 741235, India
5Institute of Research and Development, Duy Tan University, Danang, 550000, Vietnam
6School of Computer Science, Duy Tan University, Danang, 550000, Vietnam
*Corresponding Author: Dac-Nhuong Le. Email: ledacnhuong@duytan.edu.vn
Received: 04 October 2021; Accepted: 10 January 2022
Abstract: This article presents a new scheme for dynamic data optimization in IoT (Internet of Things)-assisted sensor networks. The various components of IoT assisted cloud platform are discussed. In addition, a new architecture for IoT assisted sensor networks is presented. Further, a model for data optimization in IoT assisted sensor networks is proposed. A novel Membership inducing Dynamic Data Optimization Membership inducing Dynamic Data Optimization (MIDDO) algorithm for IoT assisted sensor network is proposed in this research. The proposed algorithm considers every node data and utilized membership function for the optimized data allocation. The proposed framework is compared with two stage optimization, dynamic stochastic optimization and sparsity inducing optimization and evaluated in terms of reliability ratio, coverage ratio and sensing error. Data optimization was performed based on the availability of cloud resource, sensor energy, data flow volume and the centroid of each state. It was inferred that the proposed MIDDO algorithm achieves an average performance ratio of 76.55%, reliability ratio of 94.74%, coverage ratio of 85.75% and sensing error of 0.154.
Keywords: Data optimization; IoT; sensor network; reliability; membership; sensor energy
With the recent revolution in the field of internet technology, big data analysis has become a trending research area. The main limitation of this domain is the excessive storage requirements due to the bulk of data involved in IoT systems [1]. The IoT sensors collect huge amount of raw data and transfer them to the cloud using a transport layer. The data in the cloud is analyzed by the cloud servers for further processing [2]. The processed data is transferred back to the cloud. This process creates severe delay due to the high volume of the data. Hence data optimization is an essential task [3]. Quantum computing is a popularly used technique for data optimization. This involves two systems namely tangible and intangible. Tangible systems include manufacturing defects and intangible systems include sensor defects [4]. IoT systems are powered using wireless technologies. In these systems the main aim of data optimization is to decrease the age of information [5]. The main advantage of data optimization is the reduction in the energy consumption. To support this non-orthogonal multiple access systems are popularly being employed [6]. The life of the IoT devices is enhanced by the employment of wireless power transfer technology. This technology aids in the transfer of energy in specific time slots to maximize the efficiency [7]. Another advantage of data optimization is the efficient data acquisition. This is because of two improvements namely in the domain of data redundancy and in the domain of energy consumption [8]. Compressive sensing is used for compressing the acquired data so that the bulk of data transfer can be reduced. In addition, the compressed data can be recovered back using suitable recovery systems [9]. Thus, data optimization helps to achieve energy efficient, reliable transfer of IoT data with minimal delay. Further, the overall cost requirements are also minimized with these schemes [10].
The large number of wireless devices, such as smart phones and the Internet of Things (IoT), has resulted in the wireless network business producing and collecting an unprecedented amount of data in recent years, owing to the exponential development in mobile traffic seen in recent years. The above discussion shows the importance of data optimization in IoT sensor networks. Hence, in this research, we present a new model for data optimization based on membership inducing technology.
Based on the idea of data optimization gained from the detailed literature survey, a new scheme called Membership inducing Dynamic Data Optimization (MIDDO) algorithm for IoT assisted sensor network is proposed in this research.
The main objective of the proposed research is to present a scheme for data optimization in IoT assisted sensor networks. The system is to be designed such that the data is optimized along with minimal energy loss and maximum reliability.
The contributions of this paper are as follows:
■ The various components of IoT assisted cloud platform are discussed.
■ Architecture of IoT assisted sensor networks is discussed.
■ Data optimization in IoT assisted sensor networks is presented.
■ A novel Membership inducing Dynamic Data Optimization (MIDDO) algorithm for IoT assisted sensor network is proposed.
■ Proposed framework is evaluated in terms of performance ratio, reliability ratio, coverage ratio and sensing error.
In Section 2, we have discussed the background study data optimization and analytics in Cloud-IoT Systems. In Section 3, we have discussed modeling on IoT Assisted Cloud Platform, the system design and data optimization of IoT Assisted Cloud Platform, Membership Inducing Dynamic Data Optimization (MIDDO) algorithm. Section 4 illustrates the Numerical Analysis, results, and discussion part. Section 5 concludes the work.
This section deals with the background study for IoT supported sensor networks. Data optimization techniques can be made understood through a thorough literature review. The main goal is to develop a data optimization technique for IoT supported sensor networks. The system must be built to optimize data while minimizing energy loss and ensuring optimal reliability. Yang et al. [11] has proposed a system in which the real time data optimization was done based on clustering model. Here, dynamic transportation technique was used for optimal allocation of resources. The input database of IoT systems was optimized and various parameters like performance and economic cost were evaluated. Vimal et al. [12] has presented a scheme for energy enhancement based on ant colony optimization technique. Clustering was performed based on data aggregation to support optimization. This clustering technique was done such that the energy constrained devices support enhanced data utilization. Li et al. [13] has designed a scheme for optimization of IoT devices based on block chain. This system utilized edge computing technique for the joint optimization. Security aspects of block chain were enhanced in this system along with the reduction in energy requirements. Thus, delay tolerant data was achieved in this system. Irshad et al. [14] has proposed a framework for the optimization of performance of biological systems using IoT network. Here, deep learning was utilized for achieving optimization. The huge bulk of biological data collected using IoT sensors were optimized to prevent the loss or damage of sensitive data. Chen et al. [15] has designed a technique for the minimization of lost energy in unmanned aerial vehicle systems. Further, the loss of transmitted data is also minimized by the effective optimization of IoT devices. Swarm optimization technique was employed here to achieve dynamic optimization. Al Shorman et al. [16] has presented a scheme in which support vector machine was utilized to achieve optimization of IoT data. This system was designed to protect the IoT data from the distributed denial of service attack.
Further, evolutionary optimization technique was proposed to effectively allocate the IoT resources. Iwendi et al. [17] has presented a framework for the optimization of energy using a meta-heuristic approach. The amount of energy consumed by the IoT sensors are minimized using this technique based on cluster head selection technique. The main advantage was the increase in the life time of the IoT sensors. Hossain et al. [18] has presented a technique for simultaneous optimization and compression of IoT data. This technique is designed for implementation by smart decision systems. Fog and edge computing techniques were evaluated for the data optimization to achieve sensor efficiency. Côrte-Real et al. [19] has proposed a model for the big data analytics. Here, the IoT data generated based on European and American firms were collected and used for analysis. Partial least square technique was used for the data optimization. Azar et al. has designed a scheme for data compression to achieve energy efficient system in IoT data transfer. Edge machine learning algorithm was used for the compression of data. Moreover, time saving and improved privacy was achieved by this system. The transmitted data was constructed over the edge node in this framework to achieve optimization of data [20–25].
3.1 Components of IoT Assisted Cloud Platform
The main components of the IoT assisted cloud platform are the data monitoring, data analysis, data optimization and data prediction.
Fig. 1 illustrates the components of the IoT assisted cloud platform. The first main component is the data monitoring. The parameters of the IoT sensors are monitored in real-time by the IoT assisted cloud platform. This is a crucial component especially in case of medical IoT sensors related to healthcare. It is also used in other platforms like industrial platform, agricultural sector etc. The next main component is the data analysis. The analysis of IoT data is done for classification. Classification is essential so that the system can be improved based on machine learning algorithms. The third main component is the data optimization. Since the data generated by the IoT systems are huge, it is called as big data. The two main challenges of the big data are the data storage and data processing. To address these two issues, data optimization is a must. The last component is the data prediction. Prediction helps to predict the future variables that can be useful to make various decisions. The various layers in the architecture of IoT assisted sensor network is discussed in the following section.
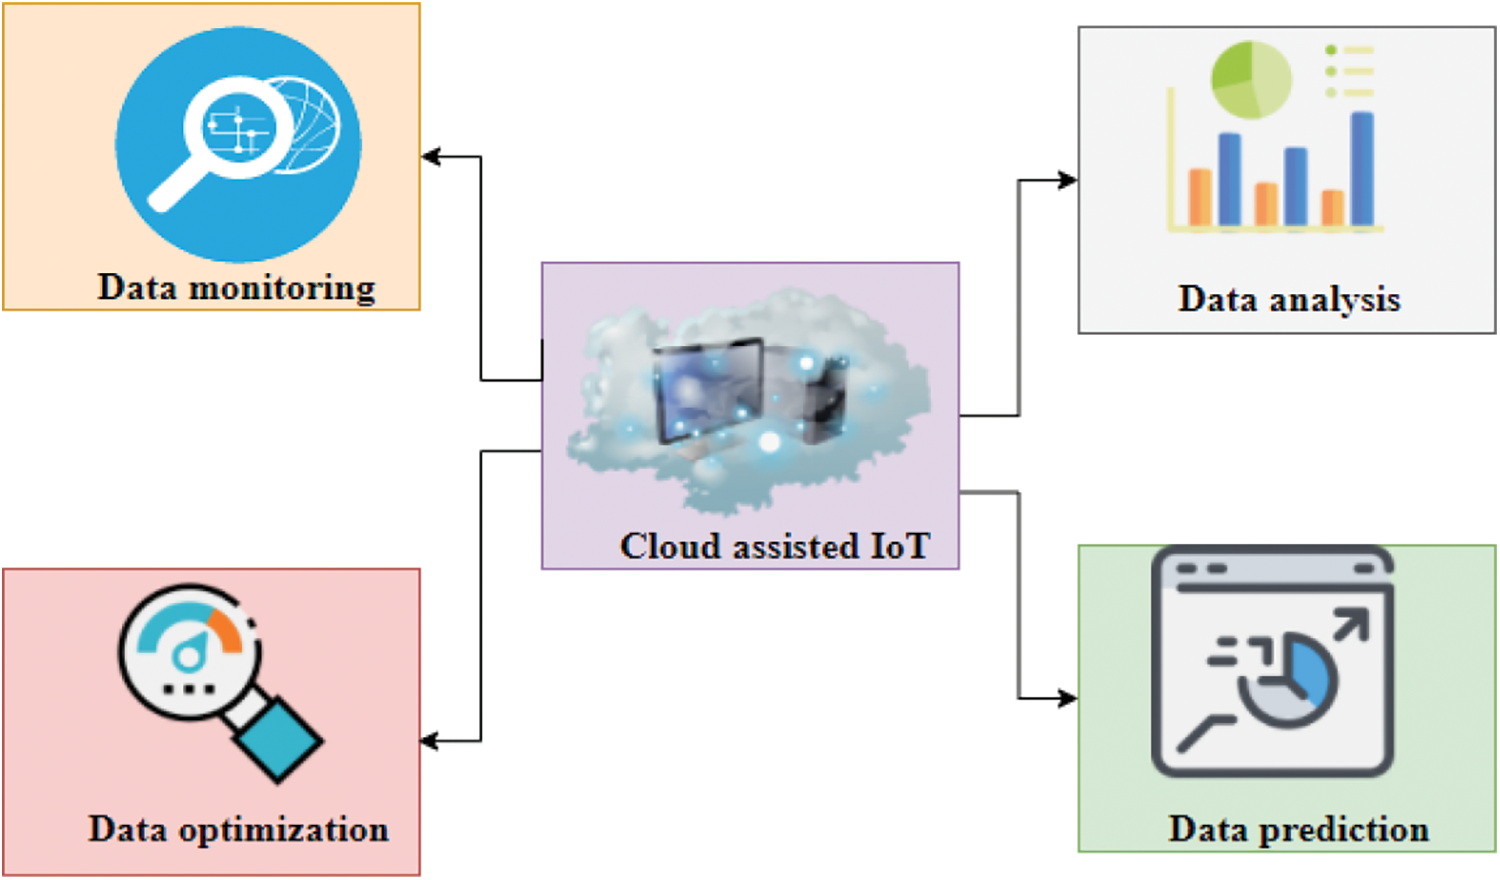
Figure 1: Components of IoT assisted cloud platform
3.2 Architecture of IoT Assisted Sensor Networks
The architecture of IoT assisted sensor networks comprises of three main layers that include the sensing layer, transport layer and the application layer.
Fig. 2 illustrates the architecture of IoT assisted sensor networks. The bottom most layer is the sensing layer. This layer includes all the IoT sensor nodes. These nodes include physical devices that collect various real time data and transmit those using wireless technologies like RFID (Radio Frequency Identification), Wi-Fi etc. The second layer is termed as the transport layer. This layer is used for transferring the data acquired by the sensing layer to the cloud. The final layer is the application layer that includes cloud, servers, processors and users. This layer is responsible for providing application-based services to all the users of the network. Important component of this layer is data optimization. This is discussed in the next section.
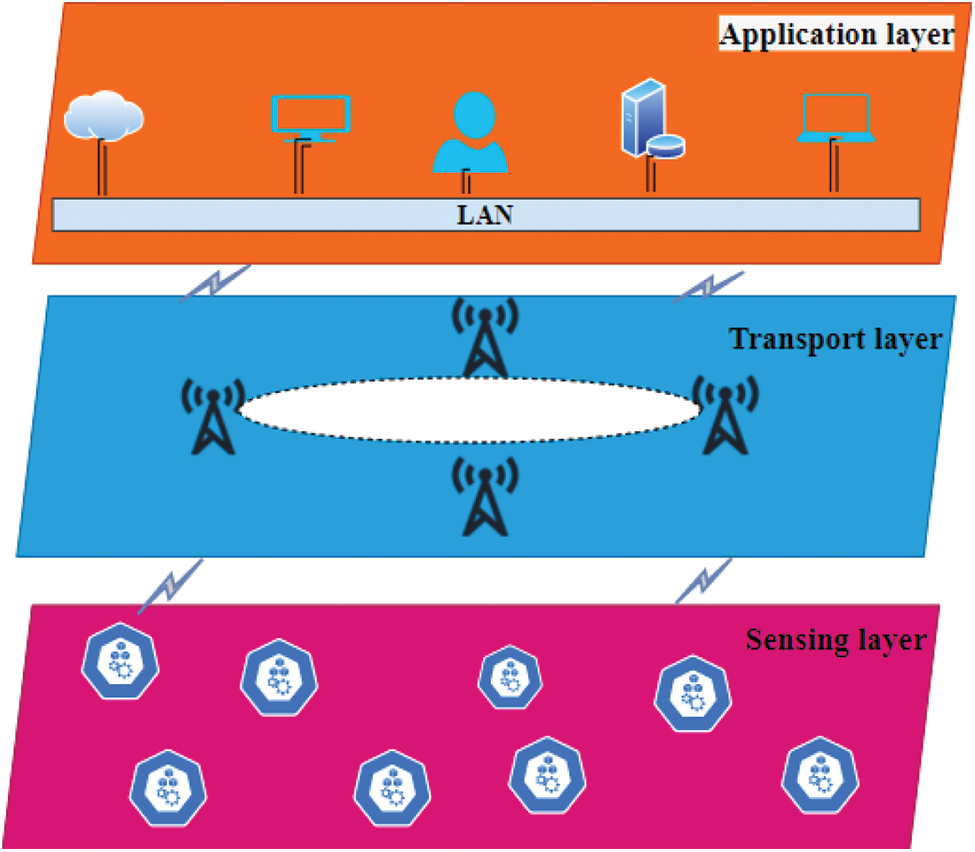
Figure 2: Architecture of IoT assisted sensor networks
3.3 Data Optimization in IoT Assisted Sensor Networks
Data optimization is essential for optimizing the resource allocation to various components of the cloud system.
Fig. 3 depict the data optimization scheme in the IoT assisted sensor networks. In these systems, the first group of devices are the IoT based smart devices. These devices continuously collect real time data through different equipment. With the development of internet technology various devices are equipped and connected to the IoT framework. The collected data are huge. This data is transferred to the IoT cloud. From the IoT cloud, the sensor data is transferred to the storage devices. Again, from the storage device the data is transferred to the processing unit. The processing unit performs the task of data optimization.
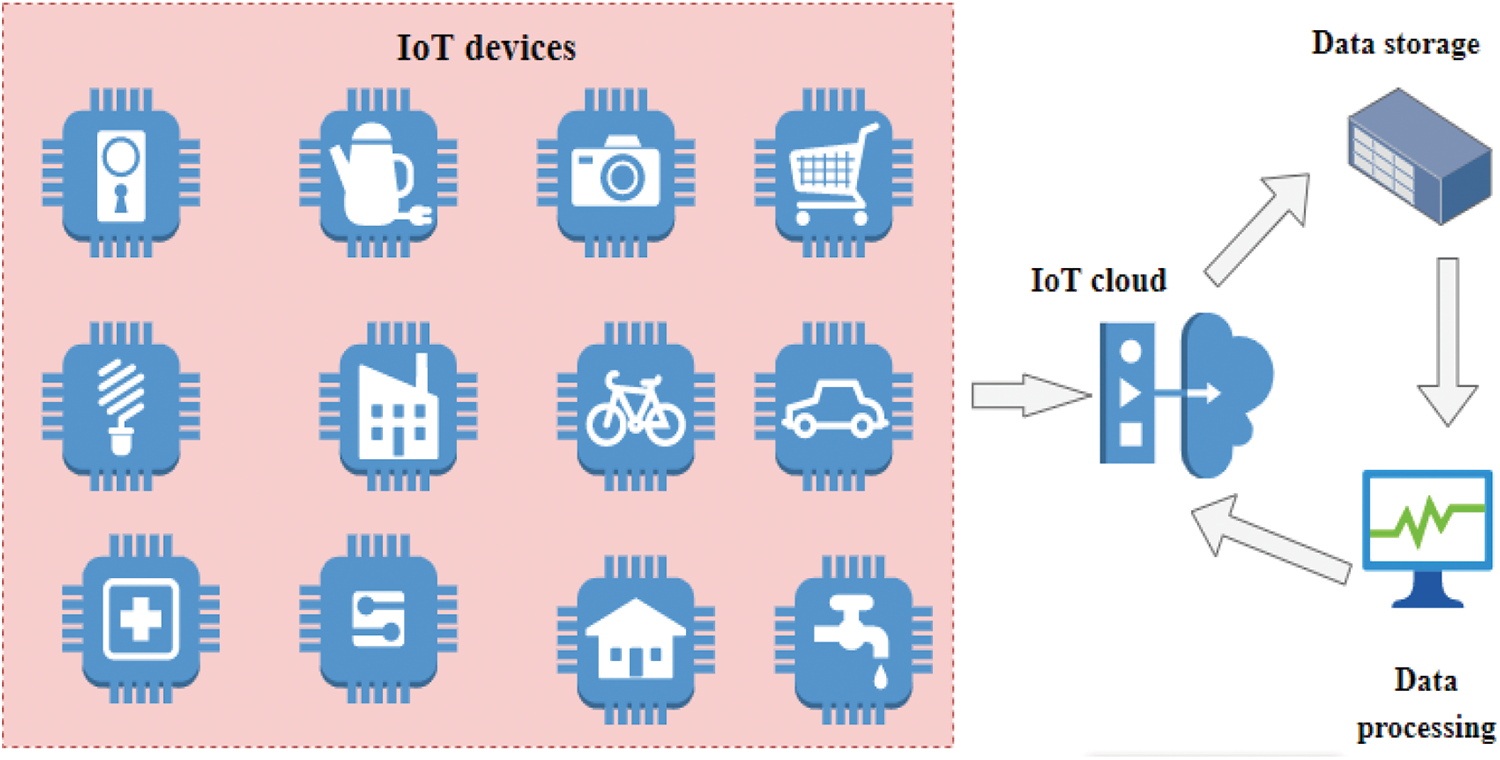
Figure 3: Data optimization in IoT assisted sensor networks
Fig. 4 indicates the proposed membership inducing dynamic data optimization (MIDDO) model. The bottom layer of the model has the IoT sensor network. It includes smart houses, smart cameras, smart phones, smart surveillance systems, smart mills, smart irrigation, smart transportation etc. This data is then optimized using the proposed MIDDO model. The optimized data is then transferred to the cloud. The optimized data has better data rate, better reliability and minimal storage requirements.
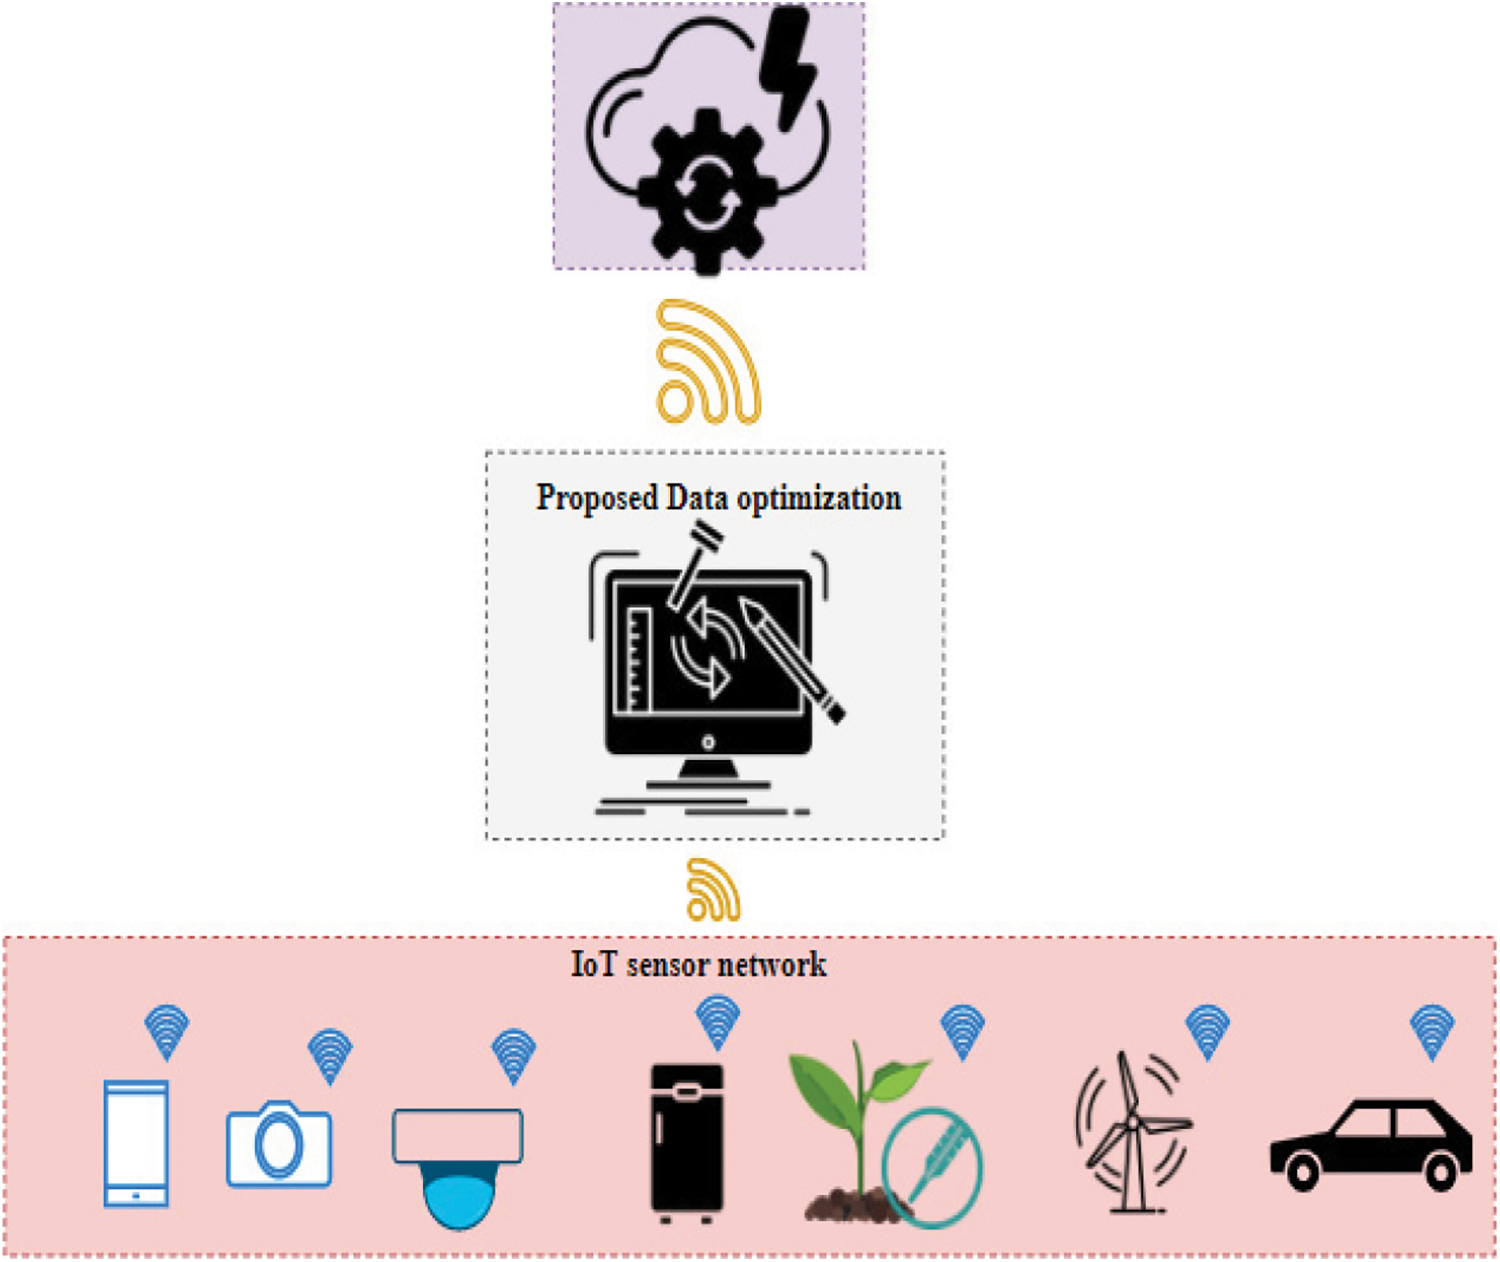
Figure 4: Proposed membership inducing dynamic data optimization model
3.4 Proposed Membership Inducing Dynamic Data Optimization (MIDDO) Algorithm for IoT Assisted Sensor Network
The proposed Membership inducing Dynamic Data Optimization (MIDDO) algorithm for IoT assisted sensor network is given below.
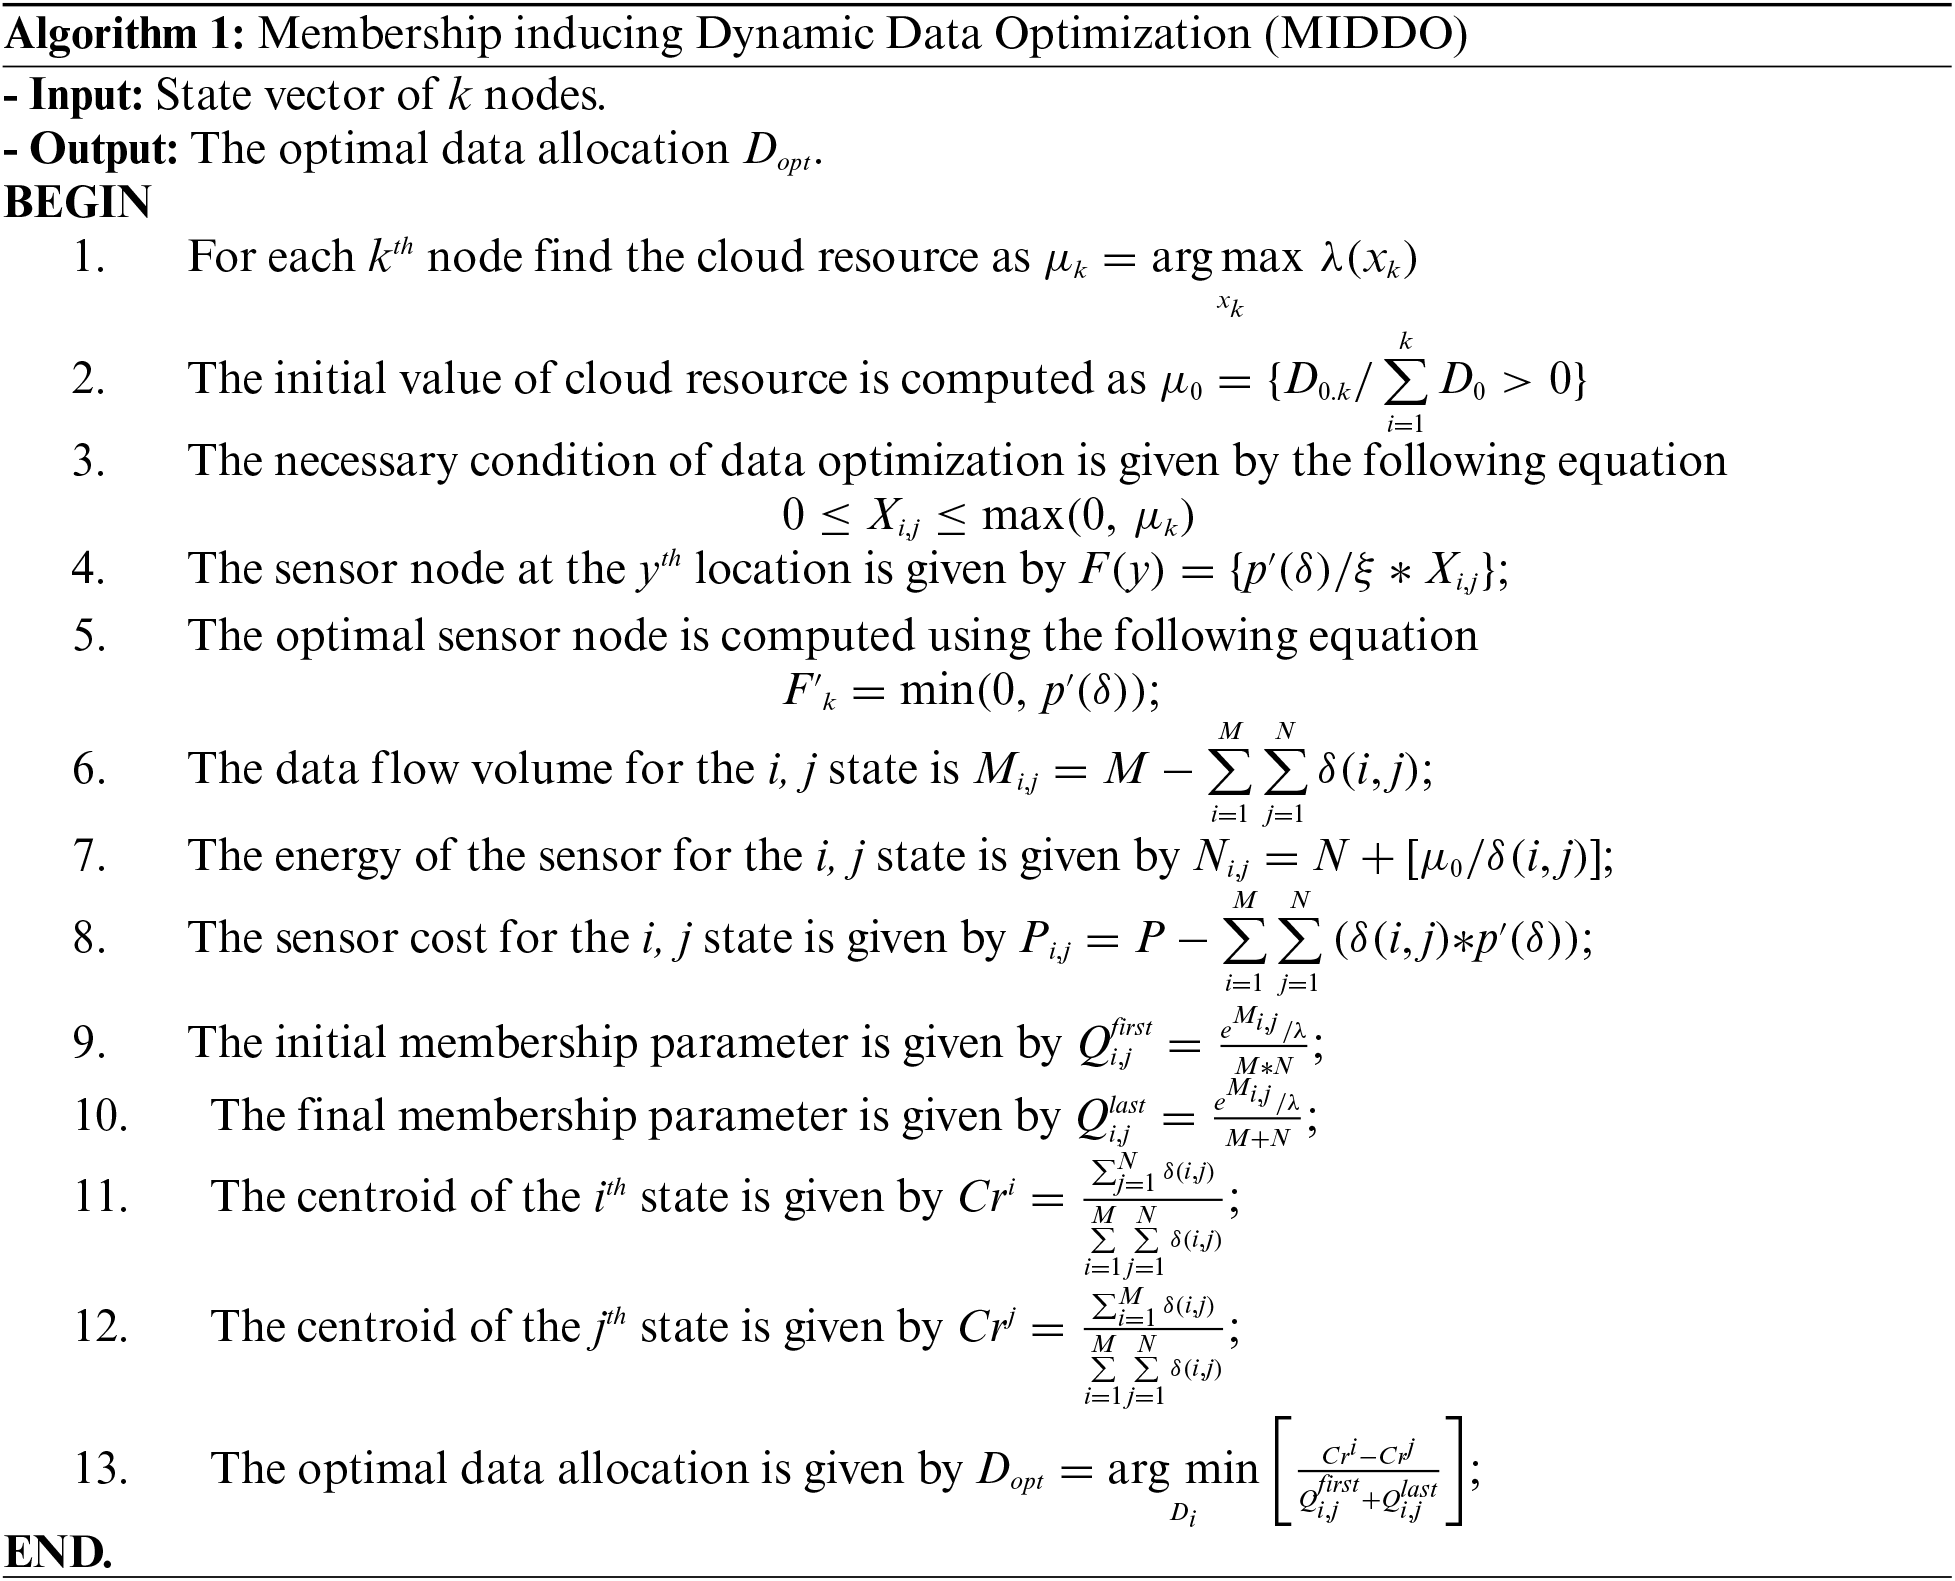
The explanation of the proposed algorithm is given below.
For each kth node find the cloud resource as
where,
where
This condition denotes that the non-repeatable data for the i, j state must be in between zero and
where
where
Here,
where
Here,
where
where
where
where
where,
3.5 Challenges of Proposed MIDDO Model
The main challenge of the proposed MIDDO model is the vulnerability to security attacks. The optimization algorithms can be compromised by the attackers to create threats to the entire IoT framework.
3.6 Benefits of Proposed MIDDO Model
The main advantage of this MIDDO model is the increase in reliability of the system. In addition, the overall sensing error is reduced with the proposed framework. Further, another main advantage is the increase in coverage ratio and performance ratio.
The proposed methodology analyses various parameters like performance ratio, reliability ratio, coverage ratio and sensing error. These are discussed in this section. Comparison is done with other data optimization techniques like two stage optimization (TSO), dynamic stochastic optimization (DSO) and sparsity inducing optimization (SIO).
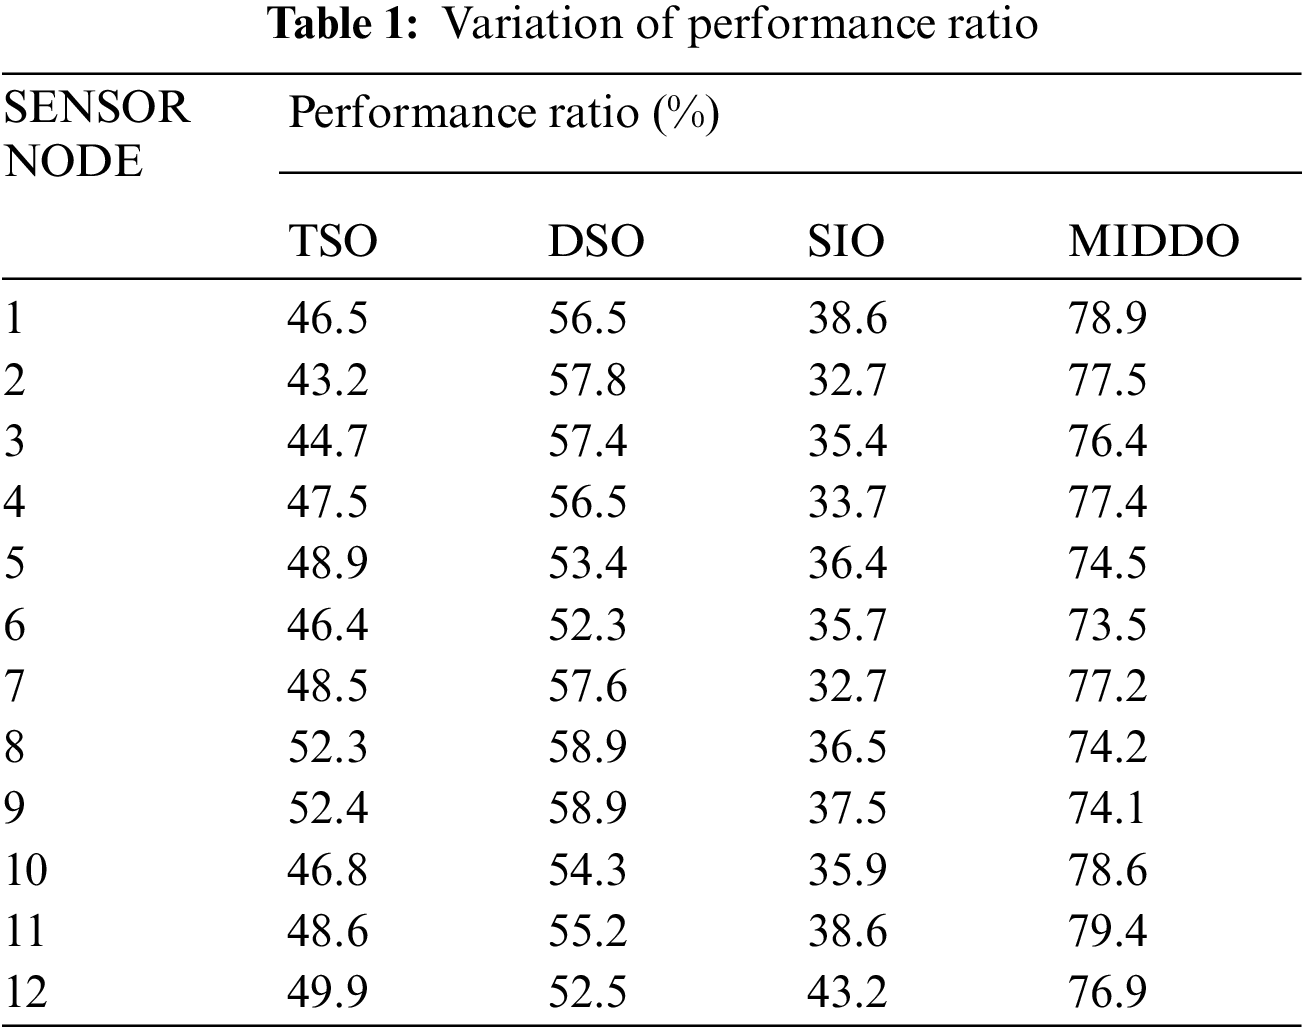
Tab. 1 shows the variation of performance ratio for 12 different sensor nodes using two stage optimization, dynamic stochastic optimization, sparsity inducing optimization and the proposed MIDDO algorithm. It is clear from Tab. 1 that the mean value of performance ratio achieved by two stage optimizations is 47.97%. Dynamic stochastic optimization achieved a mean value of 55.94% and sparsity inducing optimization produces a mean performance ratio of 36.41%. However, the proposed MIDDO algorithm achieves a mean performance ratio of 76.55% for the 12 sensor nodes. Thus, we find that the proposed system produces best results. This is due to the fact that the proposed system employs cloud resource allocation as a main criterion.
Tab. 2 shows the variation of reliability ratio for 12 different sensor nodes using two stage optimization, dynamic stochastic optimization, sparsity inducing optimization and the proposed MIDDO algorithm.
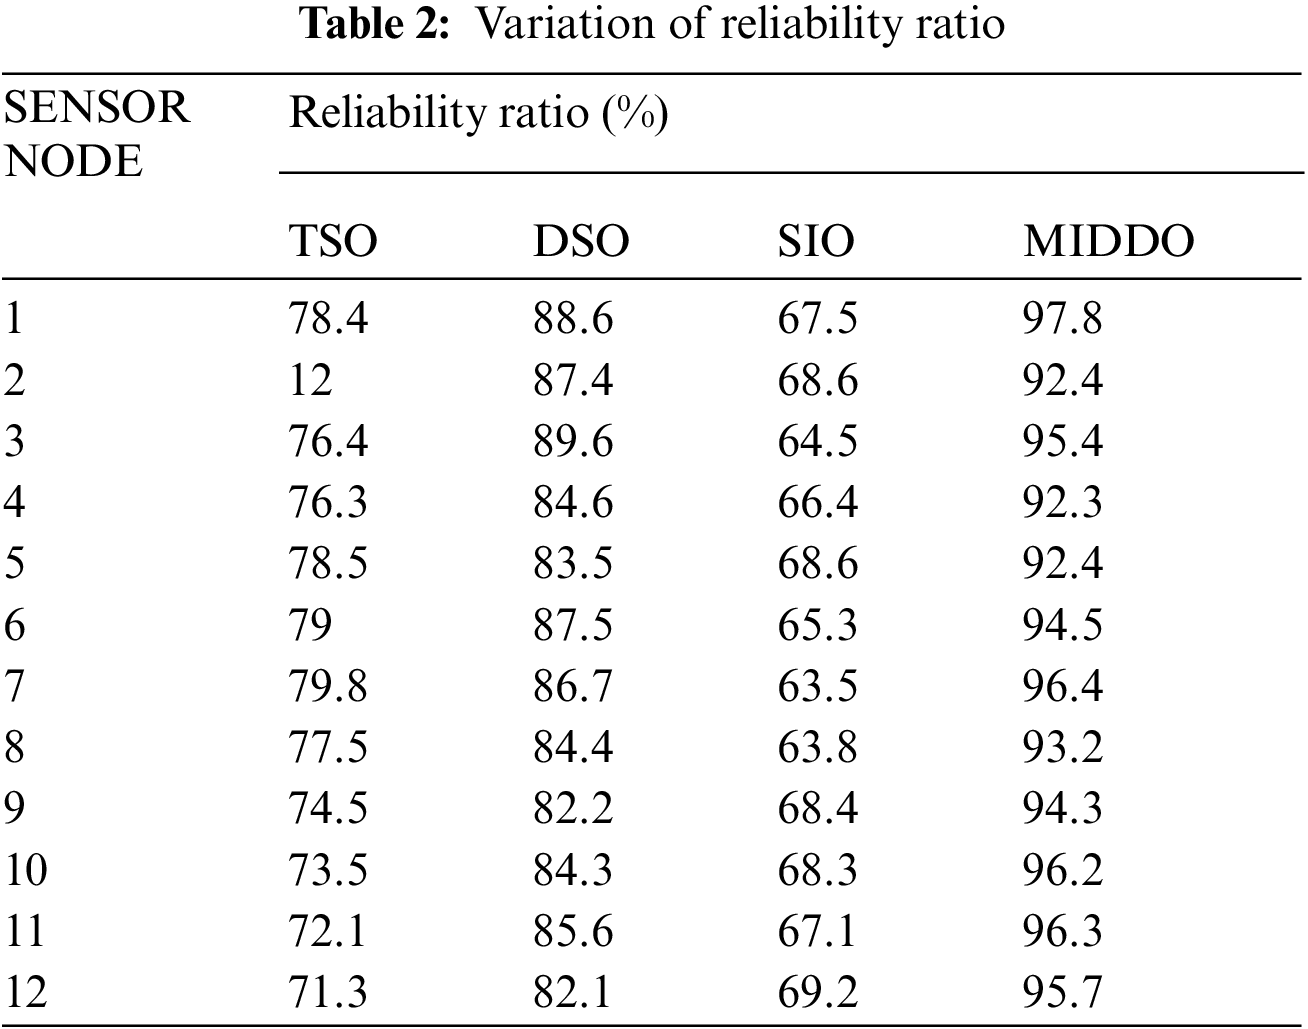
It is clear from Tab. 2 that the mean value of reliability ratio achieved by two stage optimizations is 70.77%. Dynamic stochastic optimization achieved a mean value of 85.54% and sparsity inducing optimization produces a mean reliability ratio of 66.76%. However, the proposed MIDDO algorithm achieves a mean reliability ratio of 94.74% for the 12 sensor nodes. Thus, we find that the proposed system produces best results in terms of reliability. This high value of reliability ratio is due to the contribution of membership functions in the computation of data optimization.
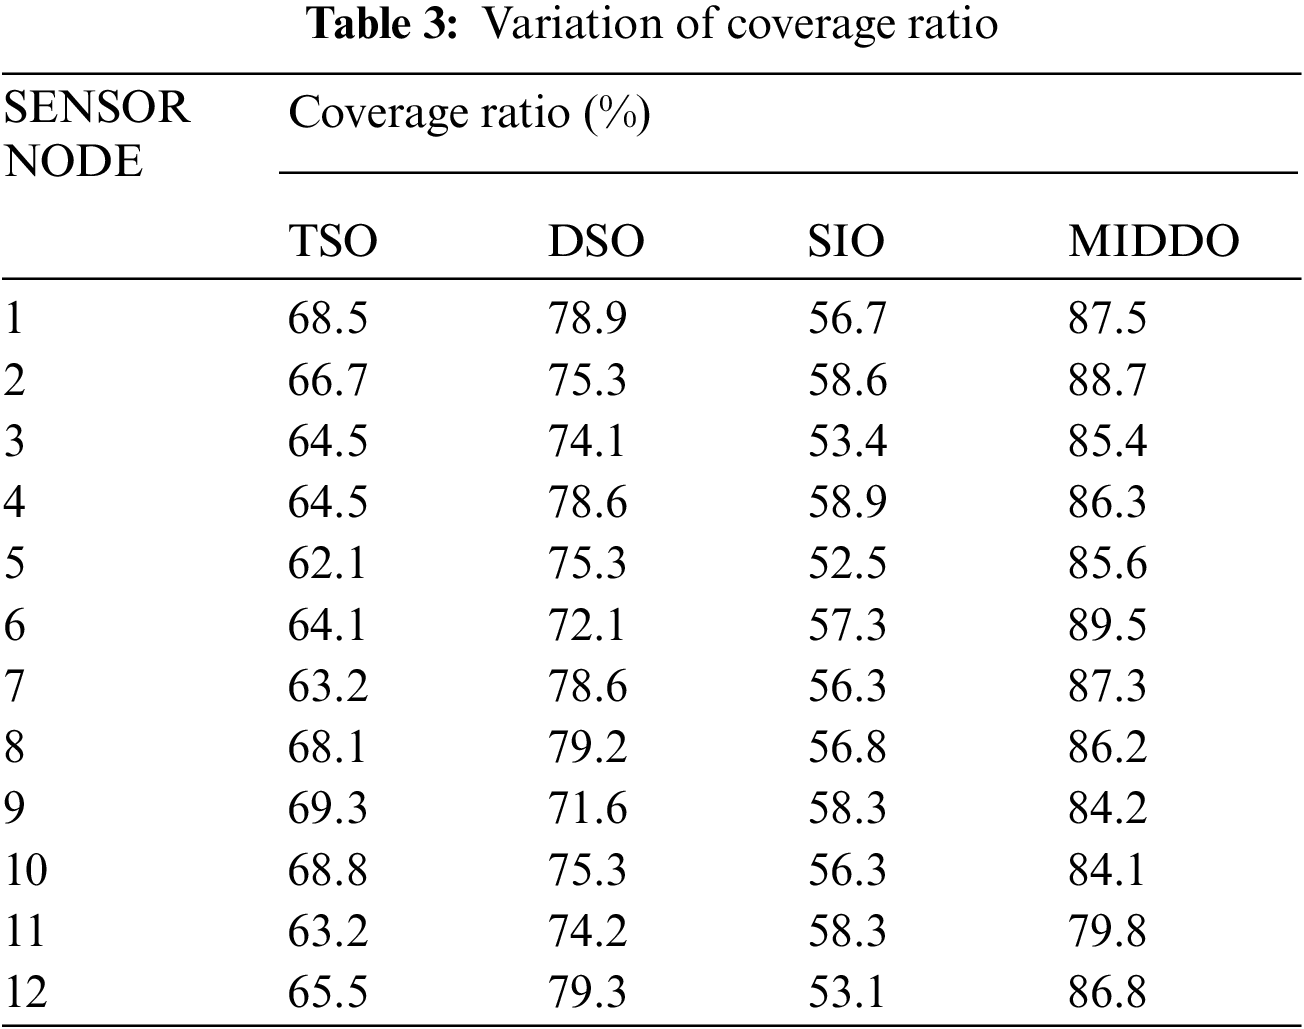
Tab. 3 shows the variation of coverage ratio for 12 different sensor nodes using two stage optimization, dynamic stochastic optimization, sparsity inducing optimization and the proposed MIDDO algorithm. It is clear from Tab. 3 that the mean value of coverage ratio achieved by two stage optimizations is 65.70%. Dynamic stochastic optimization achieved a mean value of 76.04% and sparsity inducing optimization produces a mean coverage ratio of 56.37%. However, the proposed MIDDO algorithm achieves a mean coverage ratio of 85.75% for the 12 sensor nodes. Thus, we find that the proposed system produces best results in terms of coverage. This is because the proposed data optimization is directly proportional to data flow volume value.
Tab. 4 shows the variation of sensing error for 12 different sensor nodes using two stage optimization, dynamic stochastic optimization, sparsity inducing optimization and the proposed MIDDO algorithm. It is clear from Tab. 4 that the mean value of sensing error achieved by two stage optimizations is 0.524. Dynamic stochastic optimization achieved a mean value of 0.353 and sparsity inducing optimization produces a mean sensing error of 0.633. However, the proposed MIDDO algorithm achieves a mean sensing error of 0.154 for the 12 sensor nodes. Thus, we find that the proposed system produces best results in terms of sensing error. The least value of sensing error is due to the fact that the proposed system ensures the location of the optimized data to be placed at the center of the ith and jth centroid.
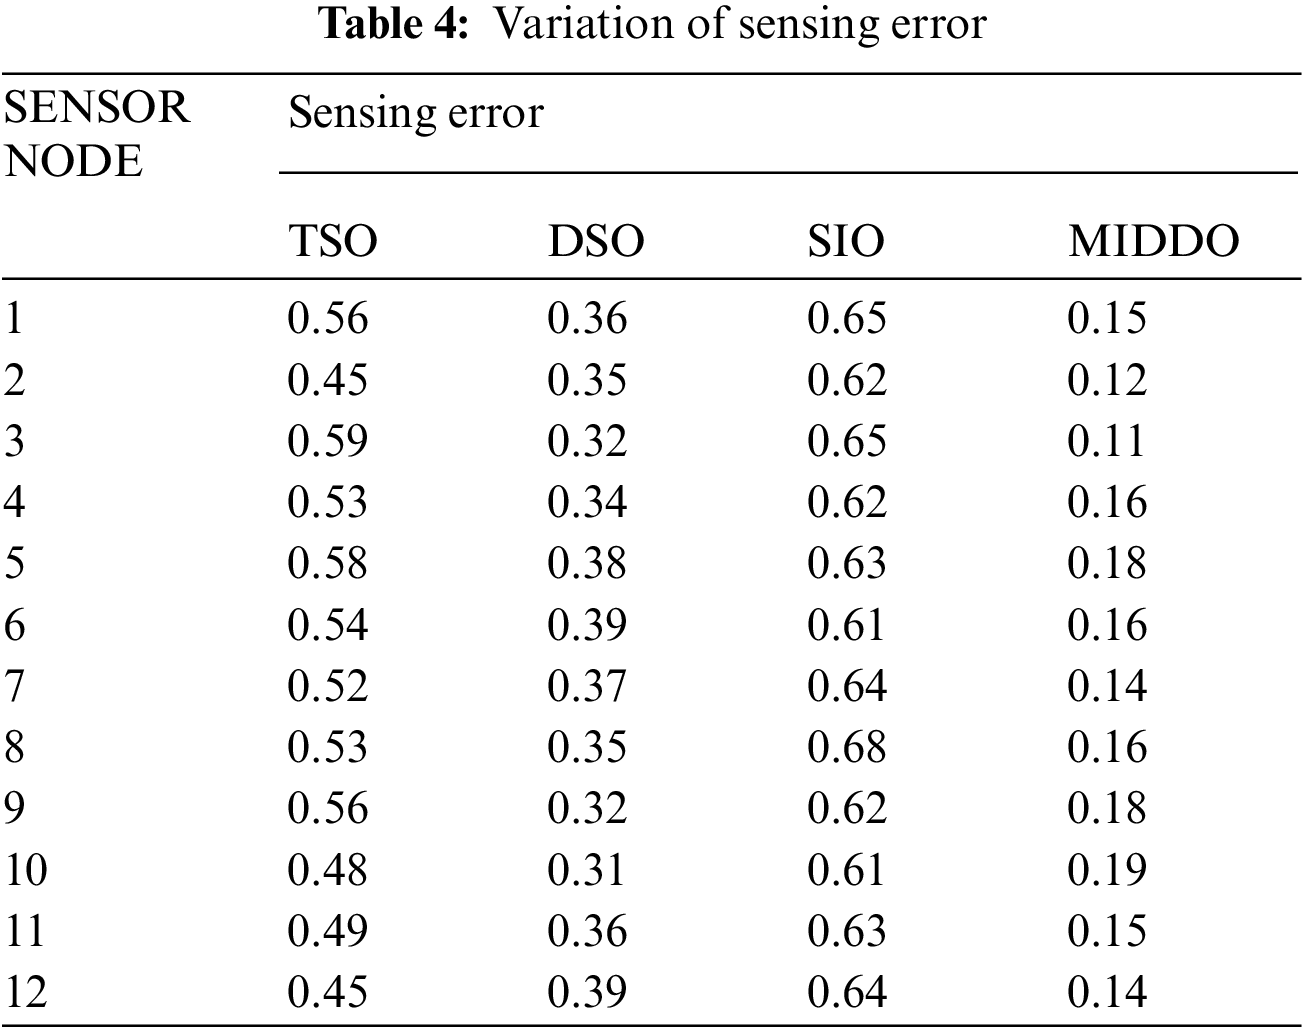
Fig. 5 shows the variation of data flow volume for 12 different sensor nodes using two stage optimization, dynamic stochastic optimization, sparsity inducing optimization and the proposed MIDDO algorithm. It is evident from Fig. 5 that the mean value of data flow volume achieved by two stage optimizations is 833.58. Dynamic stochastic optimization achieved a mean value of 889.91 and sparsity inducing optimization produces a mean data flow volume of 672.16. However, the proposed MIDDO algorithm achieves a mean data flow volume of 1158.83 for the 12 sensor nodes. Thus, we find that the proposed system produces best results in terms of data flow volume. The highest value of data flow volume is because of the inclusion of coverage ratio
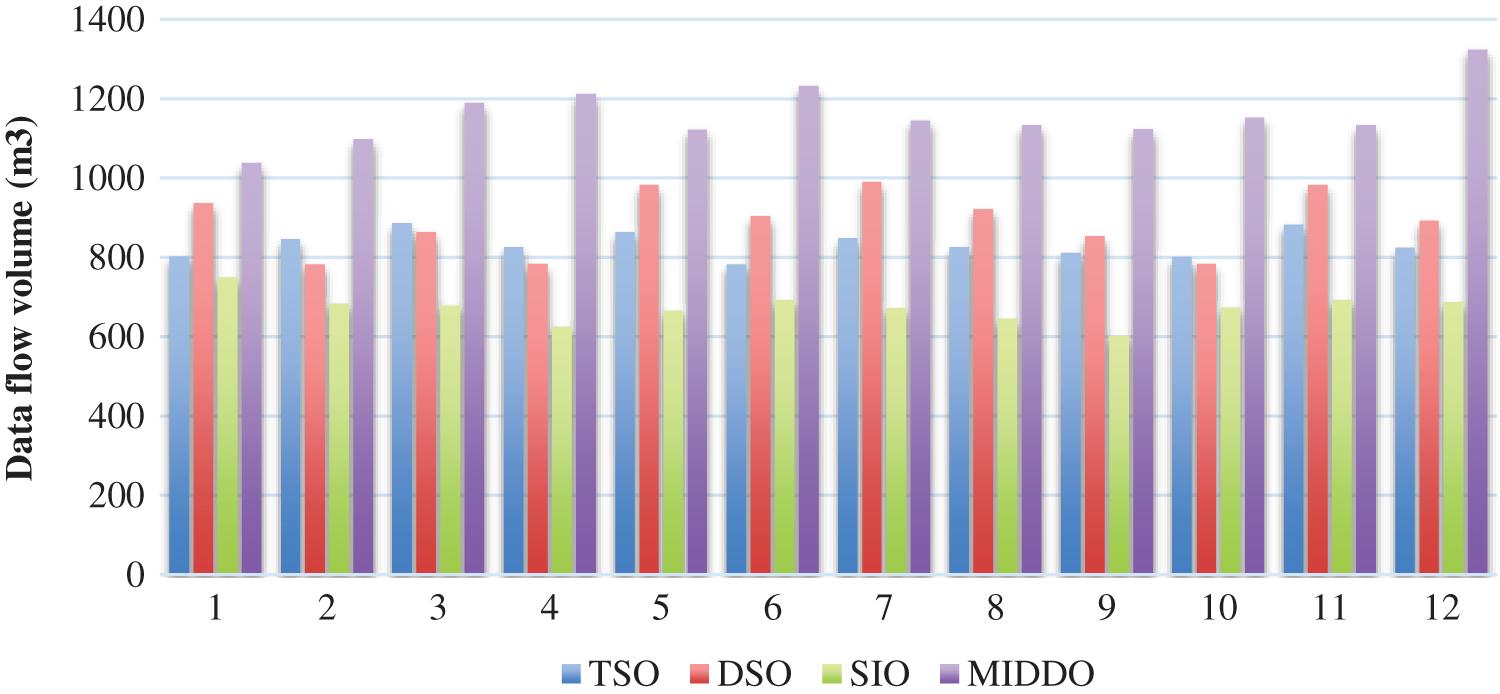
Figure 5: Variation of data flow volume
Fig. 6 shows the variation of sensor energy for 12 different sensor nodes using two stage optimization, dynamic stochastic optimization, sparsity inducing optimization and the proposed MIDDO algorithm. It is evident from Fig. 6 that the mean value of sensor energy achieved by two stage optimizations is 55.33%. Dynamic stochastic optimization achieved a mean value of 64.66% and sparsity inducing optimization produces a mean sensor energy of 53.25%. However, the proposed MIDDO algorithm achieves a mean sensor energy of 36.33% for the 12 sensor nodes. Thus, we find that the proposed system produces best results in terms of sensor energy. The highest value of sensor energy is because the optimized data directly depends on the incidence ratio
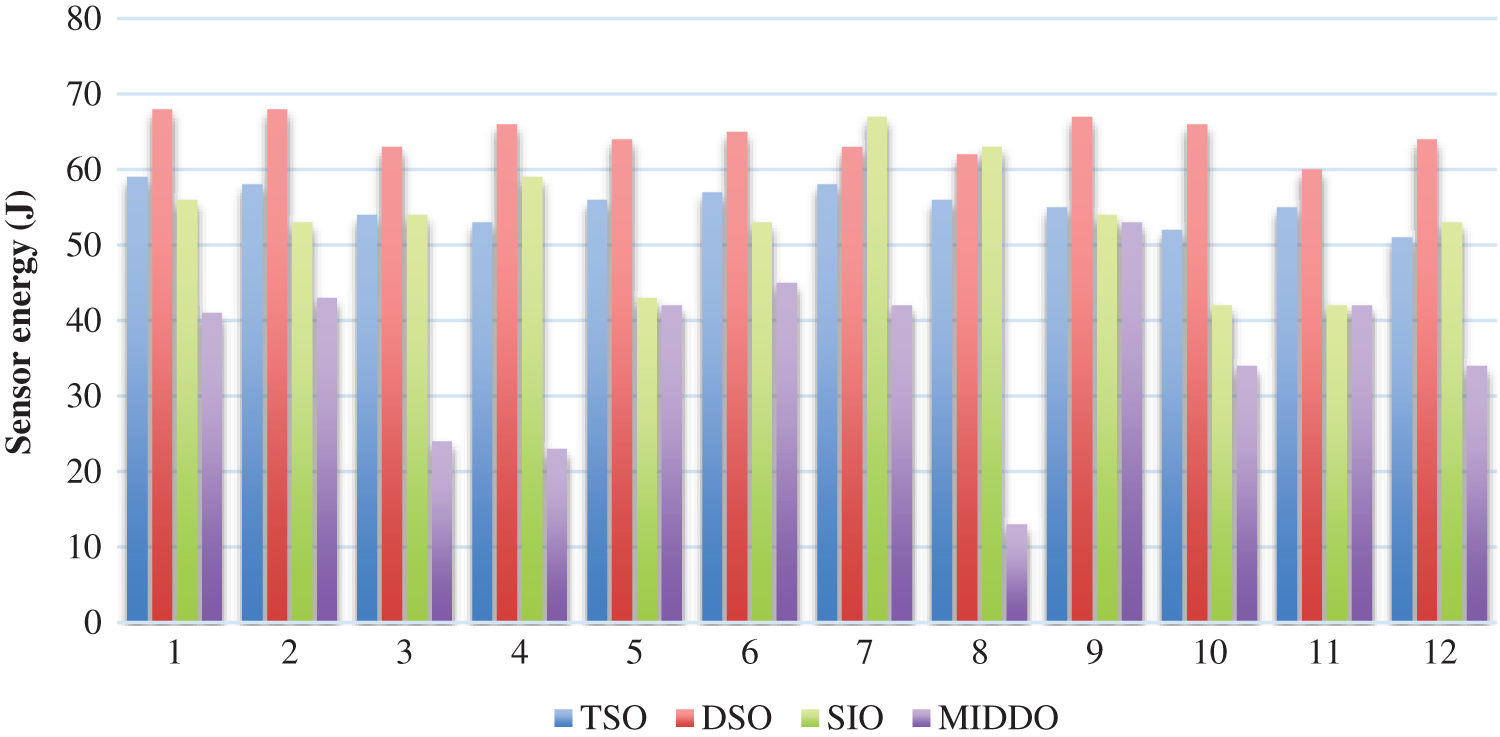
Figure 6: Variation of sensor energy
Fig. 7 shows the variation of initial membership for 12 different sensor nodes using two stage optimization, dynamic stochastic optimization, sparsity inducing optimization and the proposed MIDDO algorithm. It is evident from Fig. 7 that the mean value of initial membership achieved by two stage optimizations is 45.66%. Dynamic stochastic optimization achieved a mean value of 50.91% and sparsity inducing optimization produces an initial membership of 34.91%. However, the proposed MIDDO algorithm achieves initial membership of 84.16% for the 12 sensor nodes. Thus, we find that the proposed system produces best results in terms of initial membership. The highest value of initial membership is because of the proposed system considers the first membership value for resource allocation.
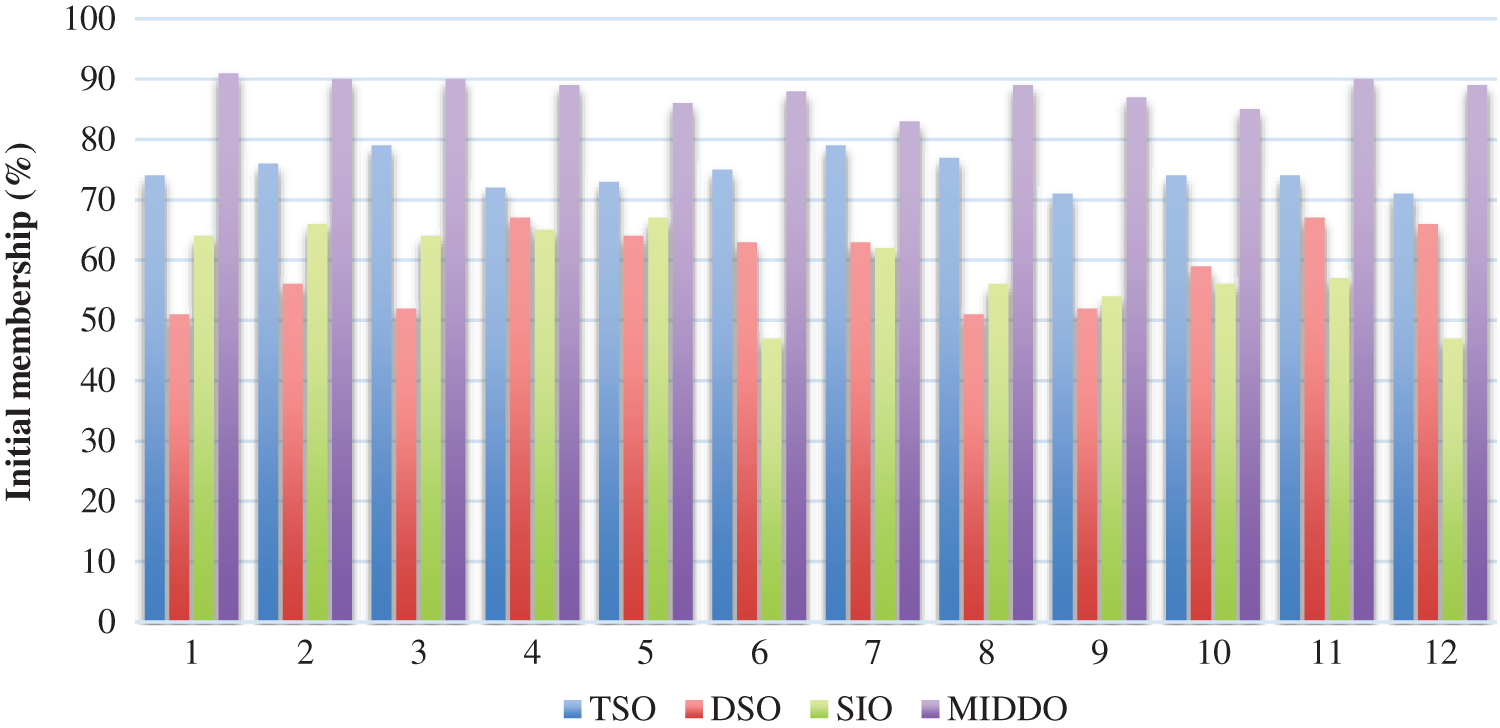
Figure 7: Variation of initial membership
Fig. 8 shows the variation of final membership for 12 different sensor nodes using two stage optimization, dynamic stochastic optimization, sparsity inducing optimization and the proposed MIDDO algorithm. It is evident from Fig. 8 that the mean value of final membershipachieved by two stage optimizations is 45.16%. Dynamic stochastic optimization achieved a mean value of 54.2% and sparsity inducing optimization produces a final membership of 31.91%. However, the proposed MIDDO algorithm achieves a mean final membership of 56.91% for the 12 sensor nodes. Thus, we find that the proposed system produces best results in terms of final membership. The highest value of finalmembership is because the proposed MIDDO algorithm considers last membership value along with initial value for resource allocation.
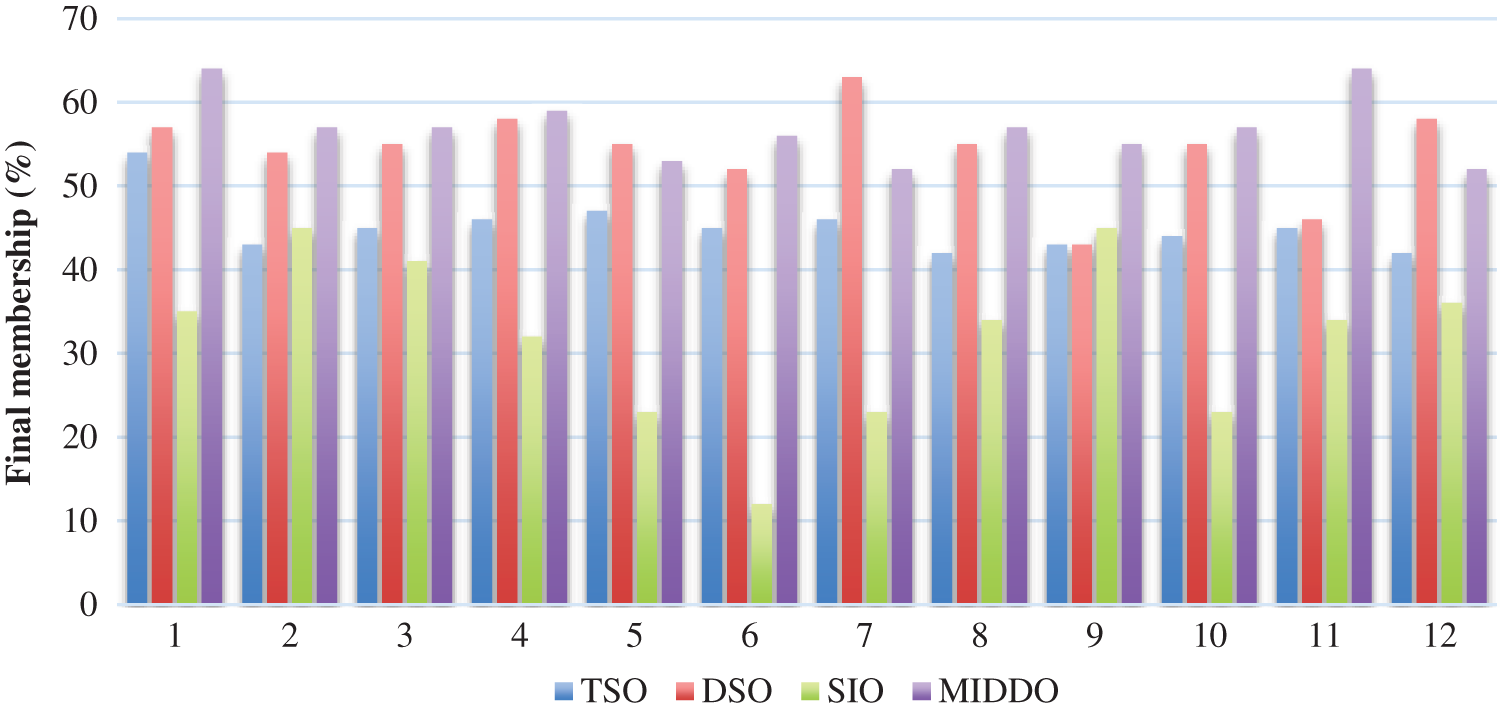
Figure 8: Variation of final membership
Fig. 9 shows the variation of optimal data allocation for 12 different sensor nodes using two stage optimization, dynamic stochastic optimization, sparsity inducing optimization and the proposed MIDDO algorithm. It is evident from Fig. 9 that the mean value of optimal data allocation achieved by two stage optimizations is 45.66%. Dynamic stochastic optimization achieved a mean value of 50.91% and sparsity inducing optimization produces a mean optimal data allocation of 34.91%. However, the proposed MIDDO algorithm achieves a mean optimal data allocation of 85.16% for the 12 sensor nodes. Thus, we find that the proposed system produces best results in terms of optimal data allocation. The highest value of optimal data allocation is achieved because of the effective allocation of the available resources with minimal loss.
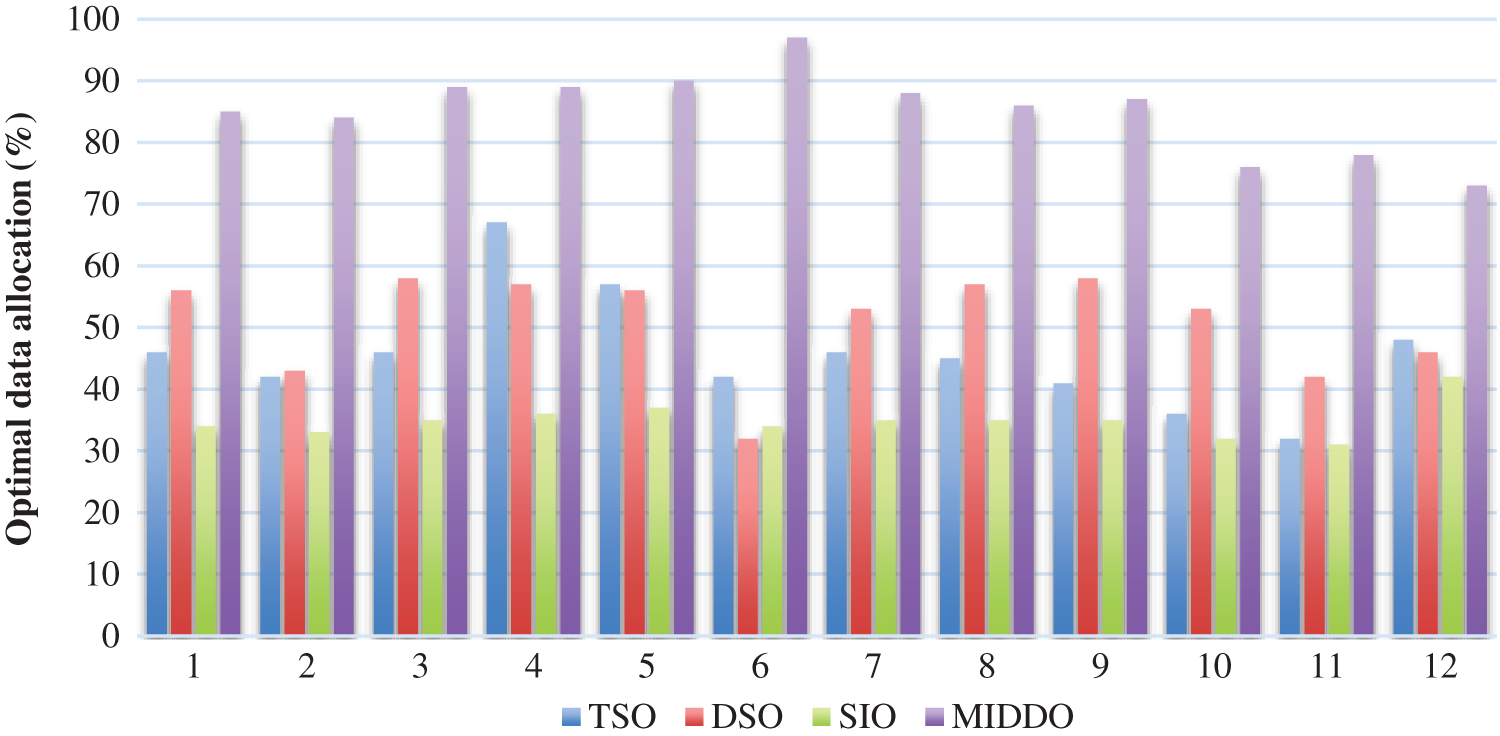
Figure 9: Variation of optimal data allocation
This paper presented a new algorithm called Membership inducing Dynamic Data Optimization (MIDDO) algorithm for the IoT data optimization. Here, the data optimization was performed based on the availability of cloud resource, sensor energy, data flow volume and the centroid of each state. The optimized data can be used for reducing the storage requirements and data rate of the IoT system. The advantages and limitations of the proposed MIDDO model were also discussed.
Further, the proposed system was compared with two stage optimization, dynamic stochastic optimization and sparsity inducing optimization in terms of data flow volume, sensor energy, initial membership, final membership and optimal data allocation. It was deduced that the proposed model achieved a mean data flow volume of 1158.83, mean sensor energy of 53.25%, initial membership of 84.16%, meanfinal membership of 56.91% and mean optimal data allocation of 85.16% for 12 sensor nodes.
In future, we have planned to implement the proposed system in IoT nodes and evaluate the energy saved and efficiency achieved based on real-time IoT data. Different IoT-based sensing parameters are required to be significant accumulations for engineers and organizations. In this context, energy-efficient algorithms can be future study of this manuscript.
Funding Statement: The authors received no specific funding for this study.
Conflicts of Interest: The authors declare that they have no conflicts of interest to report regarding the present study.
1. N. Gupta, M. Khosravy, N. Patel, N. Dey, S. Gupta et al., “Economic data analytic AI technique on IoT edge devices for health monitoring of agriculture machines,” Applied Intelligence, vol. 50, no. 11, pp. 3990–4016, 2020. [Google Scholar]
2. H. Liu, S. Wang, X. Zhao, S. Gong, N. Zhao et al., “Analog-digital hybrid transceiver optimization for data aggregation in IoT networks,” IEEE Internet of Things Journal, vol. 7, no. 11, pp. 11262–11275, 2020. [Google Scholar]
3. K. Kaur, S. Garg, G. Kaddoum, E. Bou-Harb and K. K. R. Choo, “A big data-enabled consolidated framework for energy efficient software defined data centers in IoT setups,” IEEE Transactions on Industrial Informatics, vol. 16, no. 4, pp. 2687–2697, 2020. [Google Scholar]
4. M. Bhatia and S. K. Sood, “Quantum computing-inspired network optimization for IoT applications,” IEEE Internet Things Journal, vol. 7, no. 6, pp. 5590–5598, 2020. [Google Scholar]
5. H. Hu, K. Xiong, G. Qu, Q. Ni, P. Fan et al., “AoI-minimal trajectory planning and data collection in UAV-assisted wireless powered IoT networks,” IEEE Internet Things Journal, vol. 8, no. 2, pp. 1211–1223, 2020. [Google Scholar]
6. X. Li, C. Luo, H. Ji, Y. Zhuang, H. Zhang et al., “Energy consumption optimization for self-powered IoT networks with non-orthogonal multiple access,” International Journal of Communication Systems, vol. 33, no. 1, pp. 1–15, 2020. [Google Scholar]
7. X. Wang, A. Ashikhmin and X. Wang, “Wirelessly powered cell-free IoT: Analysis and optimization,” IEEE Internet Things Journal, vol. 7, no. 9, pp. 8384–8396, 2020. [Google Scholar]
8. X. Liu, Y. Liu, N. Zhang, W. Wu and A. Liu, “Optimizing trajectory of unmanned aerial vehicles for efficient data acquisition: A matrix completion approach,” IEEE Internet Things Journal, vol. 6, no. 2, pp. 1829–1840, 2019. [Google Scholar]
9. A. Aziz, K. Singh, W. Osamy and A. M. Khedr, “Effective algorithm for optimizing compressive sensing in IoT and periodic monitoring applications,” Journal of Network and Computer Applications, vol. 126, pp. 12–28, 2019. [Google Scholar]
10. X. Xiang, W. Liu, T. Wang, M. Xie, X. Li et al., “Delay and energy-efficient data collection scheme-based matrix filling theory for dynamic traffic IoT,” EURASIP Journal on Wireless Communications and Networking, vol. 2019, no. 1, pp. 1–25, 2019. [Google Scholar]
11. J. Yang, Y. Han, Y. Wang, B. Jiang, Z. Lv et al., “Optimization of real-time traffic network assignment based on IoT data using DBN and clustering model in smart city,” Future Generation Computer Systems, vol. 108, pp. 976–986, 2020. [Google Scholar]
12. S. Vimal, M. Khari, R. G. Crespo, L. Kalaivani, N. Dey et al., “Energy enhancement using multiobjective ant colony optimization with double q learning algorithm for IoT based cognitive radio networks,” Computer Communications, vol. 154, pp. 481–490, 2020. [Google Scholar]
13. M. Li, F. R. Yu, P. Si, W. Wu and Y. Zhang, “Resource optimization for delay-tolerant data in blockchain-enabled iot with edge computing: A deep reinforcement learning approach,” IEEE Internet Things Journal, vol. 7, no. 10, pp. 9399–9412, 2020. [Google Scholar]
14. O. Irshad, M. U. G. Khan, R. Iqbal, S. Basheer and A. K. Bashir, “Performance optimization of IoT based biological systems using deep learning,” Computer Communications, vol. 155, pp. 24–31, 2020. [Google Scholar]
15. E. Chen, J. Chen, A. W. Mohamed, B. Wang, Z. Wang et al., “Swarm intelligence application to uav aided iot data acquisition deployment optimization,” IEEE Access, vol. 8, pp. 175660–175668, 2020. [Google Scholar]
16. A. Al Shorman, H. Faris and I. Aljarah, “Unsupervised intelligent system based on one class support vector machine and grey wolf optimization for IoT botnet detection,” Journal of Ambient Intelligence and Humanized Computing, vol. 11, no. 7, pp. 2809–2825, 2020. [Google Scholar]
17. C. Iwendi, P. K. R. Maddikunta, T. R. Gadekallu, K. Lakshmanna, A. K. Bashir et al., “A metaheuristic optimization approach for energy efficiency in the IoT networks,” Software: Practice and Experience, vol. 51, no. 12, pp. 2558–2571, 2021. [Google Scholar]
18. K. Hossain, M. Rahman and S. Roy, “IoT data compression and optimization techniques in cloud storage,” International Journal of Cloud Applications and Computing (IJCAC), vol. 9, no. 2, pp. 43–59, 2019. [Google Scholar]
19. N. Côrte-Real, P. Ruivo and T. Oliveira, “Leveraging internet of things and big data analytics initiatives in European and American firms: Is data quality a way to extract business value?,” Information & Management, vol. 57, no. 1, pp. 103141, 2020. [Google Scholar]
20. Z. Sabir, K. Nisar, M. A. Z. Raja, M. R. Haque, M. Umar et al., “IoT technology enabled heuristic model with morlet wavelet neural network for numerical treatment of heterogeneous mosquito release ecosystem,” IEEE Access, vol. 9, pp. 132897–132913, 2021. [Google Scholar]
21. D. N. Le, V. S. Parvathy, D. Gupta, A. Khanna, J. J. Rodrigues et al., “IoT enabled depthwise separable convolution neural network with deep support vector machine for COVID-19 diagnosis and classification,” International Journal of Machine Learning and Cybernetics, vol. 12, pp. 3235–3248, 2021. [Google Scholar]
22. J. Azar, A. Makhoul, M. Barhamgi and R. Couturier, “An energy efficient IoT data compression approach for edge machine learning,” Future Generation Computer Systems, vol. 96, pp. 168–175, 2019. [Google Scholar]
23. D. N. Le, C. Bhatt and M. Madhukar, “Security Designs for the Cloud, IoT, and Social Networking,” USA, John Wiley & Sons, 2019. [Google Scholar]
24. S. Doss, J. Paranthaman, S. Gopalakrishnan, A. Duraisamy, S. Pal et al., “Memetic optimization with cryptographic encryption for secure medical data transmission in iot-based distributed systems,” Computers, Materials & Continua, vol. 66, no. 2, pp. 1577–1594, 2021. [Google Scholar]
25. Z. Sabir, K. Nisar, M. A. Z. Raja, M. R. Haque, M. Umar et al., “IoT technology enabled heuristic model with morlet wavelet neural network for numerical treatment of heterogeneous mosquito release ecosystem,” IEEE Access, vol. 9, pp. 132897–132913, 2021. [Google Scholar]
 | This work is licensed under a Creative Commons Attribution 4.0 International License, which permits unrestricted use, distribution, and reproduction in any medium, provided the original work is properly cited. |