DOI:10.32604/cmc.2022.024240
| Computers, Materials & Continua DOI:10.32604/cmc.2022.024240 | |
| Article |
Machine Learning Enabled e-Learner Non-Verbal Behavior Detection in IoT Environment
1Department of Information Systems, College of Science and Arts, King Khalid University, Mahayil Asir, Saudi Arabia
2Department of Computer Science, College of Science & Art at Mahayil, King Khalid University, Saudi Arabia
3Faculty of Computer and IT, Sana'a University, Sana'a, Yemen
4Department of Natural and Applied Sciences, College of Community-Aflaj, Prince Sattam bin Abdulaziz University, Saudi Arabia
5Department of Information Systems, College of Science and Arts-Girls Section, King Khalid University, Mahayil Asir, Saudi Arabia
6Department of Computer and Self Development, Preparatory Year Deanship, Prince Sattam bin Abdulaziz University, AlKharj, Saudi Arabia
7Department of Information Systems, College of Computer and Information Sciences, Princess Nourah bint Abdulrahman University, Saudi Arabia & Department of Mathematics, Faculty of Science, Cairo University, Giza, 12613, Egypt
*Corresponding Author: Manar Ahmed Hamza. Email: ma.hamza@psau.edu.sa
Received: 10 October 2021; Accepted: 22 November 2021
Abstract: Internet of Things (IoT) with e-learning is widely employed to collect data from various smart devices and share it with other ones for efficient e-learning applications. At the same time, machine learning (ML) and data mining approaches are presented for accomplishing prediction and classification processes. With this motivation, this study focuses on the design of intelligent machine learning enabled e-learner non-verbal behaviour detection (IML-ELNVBD) in IoT environment. The proposed IML-ELNVBD technique allows the IoT devices such as audio sensors, cameras, etc. which are then connected to the cloud server for further processing. In addition, the modelling and extraction of behaviour take place. Moreover, extreme learning machine sparse autoencoder (ELM-SAE) model is employed for the detection and classification of non-verbal behaviour. Finally, the Ant Colony Optimization (ACO) algorithm is utilized to properly tune the weight and bias parameters involved in the ELM-SAE model. In order to ensure the improved performance of the IML-ELNVBD model, a comprehensive simulation analysis is carried out and the results highlighted the betterment compared to the recent models.
Keywords: Internet of things; e-learning; machine learning; non-verbal behavior; extreme learning machine; classification; parameter tuning
Over the past decades, e-learning has shown significant growth and gained considerable interest. Current web-based courses make use of internet abilities to improve and support the efficient methods of conventional education and simultaneously provide great innovative possibilities [1]. Besides, supporting individual learners to obtain knowledge in an effective way, without any obstacles of being present in a classroom, this novel way of education also advantages institutions which currently have the possibility to offer more students with their educational services, at the same time reducing their expenditure [2]. Also, this kind of e-learning course has received considerable amount of adult learners who search for combining technical level training and higher-level education with challenging work responsibilities [3].
Internet of things (IoT) using e-learning is aimed to assist in gathering information from the device and share it with another device for an efficient e-learning application from Smart Campus [4]. Hence, this study presents a comprehensive review to design these systems with IoT. The IoT envisions a near future, where the object of day to day lives would be armed with microcontroller, transceiver for digital transmission, and appropriate protocol stacks would enable us to interact with the user [5], it becomes an essential part of the Internet” [6]. In this aspect, communication access and with the distinct kinds of devices and gadgets such as audio recorder, camera, Google Glass, smartwatches, sensors, Digital board displays, and so on, the IoT would increase the growth of learning circumstances which utilize the data created using this object to offer dynamic service to the learners, content developers and teachers in an innovative campus [7].
Data Analytics (DA) and Machine Learning (ML) were introduced for performing this task. ML technique aims to ‘‘teach’’ computers for completing a certain task without being explicitly trained with the gathered information [8]. Also, this technique is crucial in several areas as such algorithms and techniques have many applications involving spam filtering, autonomous driving, and house pricing prediction [9]. Conversely, DA's aim is to draw and analyze decisions from the raw gathered information can make better decisions. Also, this technique is important as they are employed in distinct areas like marketing, education, and business [10]. Therefore, DA and ML techniques could be an effective tool for the researcher to address the problems discovered in the e-learning fields.
This study presents an intelligent machine learning enabled e-learner non-verbal behaviour detection (IML-ELNVBD) in IoT environment. The proposed IML-ELNVBD technique allows the IoT devices such as audio sensors, cameras, etc. which are then connected to the cloud server for further processing. Furthermore, the modelling and extraction of behaviour take place. Followed by, extreme learning machine sparse autoencoder (ELM-SAE) model is employed for the detection and classification of non-verbal behaviour. Finally, the Ant Colony Optimization (ACO) algorithm is utilized to properly tune the weight and bias parameters involved in the ELM-SAE model. For examining the enhanced outcomes of the proposed model, a comprehensive simulation analysis is carried out.
In [11], the authors focuses on classifying questions according to the topics and subject categories. The aim of this work is to discover the appropriate mechanism in constructing ML methods in categorizing questions based on subtopics and topic categories quickly and accurately. Hence, the question in e-learning could be named back as required manually. Anantharaman et al. [12] developed an extensive approach according to the DL method by allowing the usage of RF and LSTM classifications, thus offering a very much customized e-learning method. The adaptive learning scheme will utilize bi-directed graph data model that will comprise of different phases and levels. The traversal and structure of the graph are defined by suitable ML and DL methods. The CNN and DL methods like LSTM assists in the recognition of the learner's design based on the FSLSM model.
In [13], the automated approach of satisfaction measurement has been proposed in order to process the information resulting from the communication of the learners with the scheme. In this manner, classification methods are utilized. This study is performed within this structure and comprises of introducing an automated system of satisfaction measurement for evaluating the efficacy of adoptive E Learning schemes. The presented method is depending on the analyses of the learner tracks, i.e., the duration related to the distinct learning contents and the amount of visits of this content performed with the learners. Holmes et al. [14] proposed research where forty-four scholars have replied on-screen to multiple questions regarding computer programming. Utilizing a front facing USB web camera the activities of the learners are noted in appraisal and reading of on-screen data. The resulting datasets of question-answer scores and non-verbal behavior were utilized for training ANN method to categorize non-comprehension and comprehension states in near present.
In [15], a relation among Extravert and Introvert characters and way of their learning is established. At first, altered VARK questionnaires are employed as a Chatbot for classifying persons as Extraverts/Introverts. Afterward, the classification with the Chatbot, 2 min of visual content and auditory content are provided to Extraverts and Introverts and learners Beta brain wave is noted and a database is generated at an interval of 1 s. The database is authenticated by ML approaches such as Canopy, NB, and N48. In [16], proposed an approach called Augmented Education (AugmentED). Especially, the understanding of the feature leads to poor/excellent performances, metrics measure the nonlinear and linear behavioural variations (for example stability and regularity) of campus lives are projected; moreover, feature demonstrating dynamic variations in temporal lifestyle pattern is extracted with LSTM model. Next, ML based classifications were introduced for predicting educational performances.
Xie et al. [17] gather video-viewing information from a largescale e-learning technique and utilize Cox proportional hazard function for modelling the leaving time. The methods primarily consist of the communications among parameters, age segmentation non- and -linearity assumption. In [18], forecasting recent highlight of partly highlighted electronic learning document is analyzed. Du et al. [19] proposed an incorporated architecture (LVAEPre) depending on LVAE using DNN method for alleviating the imbalanced allocation of learning databases as well as offer earlier alerts of at-risk learners.
3 The Proposed Non-Verbal Behavior Detection Model
In this study, a novel IML-ELNVBD technique is presented for the detection and classification of non-verbal behavior of the e-learner in the IoT environment. The proposed IML-ELNVBD technique involves different sub-processes namely data collection, behaviour modelling, behaviour extraction, ELM-SAE based classification, and ACO based parameter optimization. Fig. 1 illustrates the overall block diagram of proposed IML-ELNVBD model. The detailed working of every process is offered in the following sections.
Primarily, the IoT devices are used to collect data related to the e-learners which are then transmitted to the cloud platform for subsequent processes. A collection of recordings are carried out exhibiting the reading onscreen data (questions, diagram, maths, and coding) prior to answering the MCQ. The resulting dataset of behaviourally descriptive image data and objective ground truth MCQ answers are utilized for training and testing the ELM-SAE model.
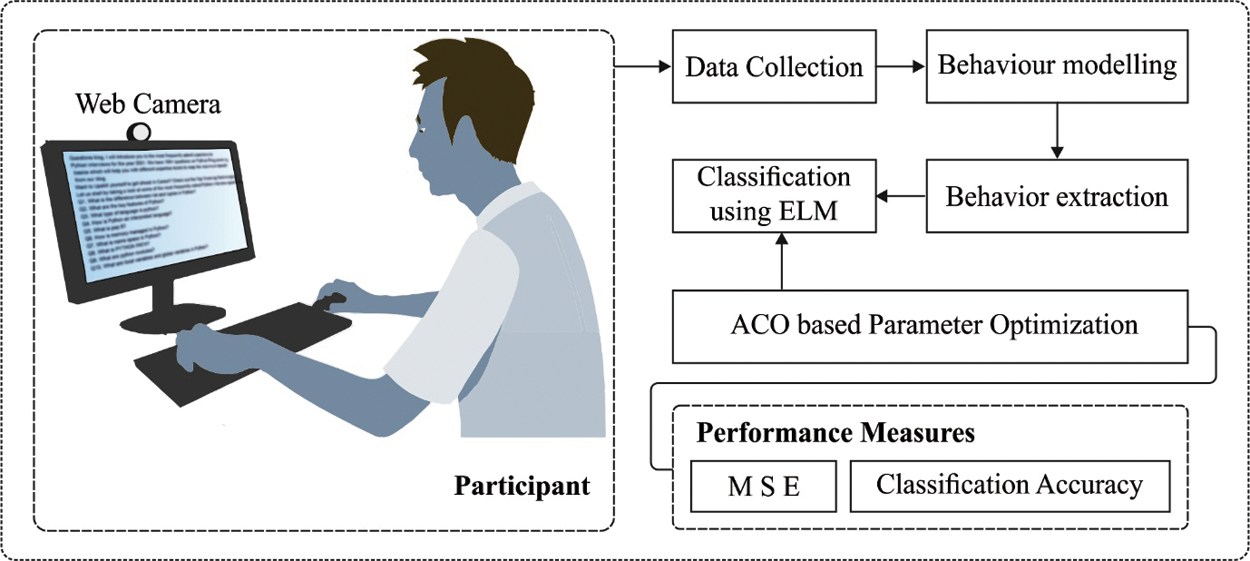
Figure 1: Overall block diagram of IML-ELNVBD model
3.2 Stage II: Behavior Modeling
A new data model was developed for capturing a wide spectrum of non-verbal behaviour channels. This method is populated by analyzing the state of certain behavioural channels within all images of the web camera image streaming and integrating this with metadata regarding the learners. A behavioural channel is an individual observed behaviour, like ‘head rotated left’ or ‘left eye gaze right’. All the behavioural channels are a false/true question, i.e., denoted as + 1.0 or −1.0. When a complete behavioural feature set could not be extracted for the time period then the process ends and wait for the following time window.
3.3 Stage III: Behavior Extraction
To decrease the processing overhead, image is decreased to 360 × 240px and grey scaled before being decomposed to a region of interest (ROI) having features (E.g., left eye and right eye) with Haar cascade. The scale invariant property of Haar cascade allows for efficient feature position while the location of the learner relating to the camera isn't closely monitored. Then, The ROI pixel information is additionally decreased by an LDA, before being categorized into a certain behavioural channel classifier Variable for geometries, state change, and pixel data are extracted from all the images. LDA has been presented by Fisher firstly. The fundamental idea is for selecting the vector
where
The Fisher condition function relates the amongst-class and within-class dispersion of instances skillfully and gives the perfect condition to define the optimum prediction way.
The extraction method is repetitive for every image in the provided time window, generating a matrix of feature vector i.e., the summarized to a Cumulative Behavioural Feature Vector (CBFV). The + 1/−1 class distribution for CBFV is closer to that of the source, indicates reliable behaviour extraction over comprehension classes. The CBFV generated for every second would be the input vector for comprehension classifier testing and training.
3.4 Stage IV: ELM-SAE Based Classification
After the extraction of behavioural features, they are passed into the ELM-SAE model for classification purposes [20].
The common approximation ability of ELM has been exploited to the strategy of autoencoder (AE), and also, sparse restriction has been expanded the AE optimized, and so, it can term it as ELM sparse AE. It could be understood that unlike the AEs (for instance, BP-based NN) utilized from the classic DL techniques, the input weight of presented ELM sparse AE has been introduced as exploring the path back in an arbitrary space. Fig. 2 depicts the framework of ELM model. The ELM system is outperformed that the trained of ELM with arbitrary mapped input weight has been effectual sufficient to estimate some input data. Specifically, when it can be training the AE succeeding the model of ELM, once the AE has been initialized, the fine-tuned is not needed. Besides, for generating further sparse and compact features of inputs,
where X implies the input data, H refers the arbitrary mapping output, and
where
The fast iterative shrinkage-thresholding algorithm (FISTA) has been implemented for solving the issue in (13). The FISTA minimization a smooth convex function with difficulty of
1) Compute the Lipschitz constant
2) Create the iteration by taking
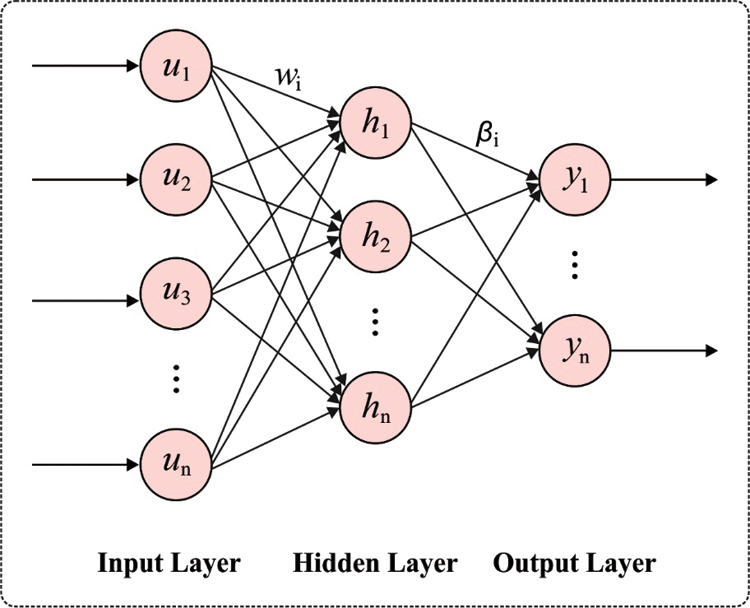
Figure 2: ELM structure
By calculating the iterative steps above, it could accomplish perfectly recovering the information under the corrupted ones. Utilizing the resulting bases
3.5 Stage V: ACO Based Parameter Optimization
At the final stage, the ACO algorithm is employed to properly adjust the weight and bias values involved in the ELM-SAE model. ACO is a population based Metaheuristic method i.e., utilized for finding relevant solutions for a complex optimization problem [21]. In ACO, a collection of software agents named artificial ant search for better solutions to a provided optimization problems. In order to employ ACO, the optimization problems are converted to the problems of discovering the optimal route on a weight graph. The artificial ant (henceforth ant) gradually creates solution by shifting on the graph. The solutions building procedure is biased and stochastic with a pheromone method, i.e., a collection of parameters related to graph modules (edges nodes or) that value is altered at running time with the ant. The applications of ACO model in the parameter tuning method include Generation of rules, Structural schema, pruning of rules, Heuristic functions, Using determined rules, and Pheromone upgrade.
The structural schema of the proposed classification method is given as follows. The artificial ant begins the traverse from initial nodes on the top i.e., consider as a virtual nest. The low-level node represents distinct characteristics and all features hold a quantity of values. A feature is determined as fm and Vmn represents the discrete values that belong to the features, whereas
As above mentioned, the ant begins from the artificial nest and chooses values for all the features for making rules. This process can be executed by a likelihood function as given in Eq. (7). It offers probability (Pmn) which Vij is selected as values of fm (fm = Vmn) whereas fm represents mth features and Vij denotes nth values.
In which
In order to discover the classifier rule, a successive covering methodology is utilized. Firstly, the identified amount of rules is maintained as NULL and the training sets hold the recognized rule. On the finding of rules at all the iterations, the determined rules would be moved to the classification rules lists and eliminated from the trained sets. The rules detection procedure would be performed once the subsequent condition is fulfilled.
i. The amount of cases must be smaller when compared to the certain values that could be located to the rules, called a minimal case for all the rules.
ii. Afterward, the exploitation of each feature, the rule making tasks gets ended. The ant employs a likelihood function (Pmn) to select feature values for making rules.
For every termmn, ACO method calculate the heuristic function
In which W represents the class features, k denotes the amount of classes and
It is a generally used method to eliminate unnecessary terms that appear in the rules. It drastically manages the categorizing capability of the rules and improves to solve the problems of overfitting the trained information. When the rule generation procedure has ended, the rule pruning process would start on. It removes the useless rules generated by ant in all the steps that enhance the rule quality. The values of rule quality (Q) exist in
whereas TN-True Negative, TP-True Positive, FP-False Positive, and FN-False Negative.
The pheromone upgrading method suggests the unpredictability of ant's pheromone in the real-world. Due to the positive feedbacking process, the error in the heuristic measures can be altered and solutions to improved classification performances. The ant employs this method for determining improved classification rules. Firstly, each trail is given to equivalent volume of pheromone as shown in Eq. (10).
In which ai represents amount of features and bm represents the possible value of am. The amount of pheromone on the node was used to the present rules get upgraded because of the pheromone deposition with the ant in the procedure of route finding. Later, the pheromone evaporation is required to be determined. Therefore, the iteration process is executed by Eq. (11).
Whereas
Eq. (12) determines the amount of pheromone of unexplored nodes get reduced by an increase in time.
In order to categorize novel instances, the recognized rule is employed since they are found, as they were kept in an arranged list. The main rules that conceal the novel instances represent that the cases are allotted through the class discovered by the resultant rule. Once the novel instances don't get any of the rules in the lists, the novel instances undergo classifier with a default rule which recognizes the significant classes in the set of found trained cases.
Then scheming the ELM-SAE, it can utilize a novel metric that permits us for comparing effectually the outcomes given as ELM-SAE created with presented technique. The MSE demonstrates the error amongst the ELM-SAE outcome and desire pattern. During this case, an optimum individual has one that creates the minimal MSE:
where yi refers the output of ELM-SAE.
This section investigates the results analysis of the IML-ELNVBD technique on the applied training and testing MSE.
The performance validation of the IML-ELNVBD technique takes place interms of training and testing MSE in Tab. 1.

Fig. 3 investigates the training MSE analysis with all classes of the IML-ELNVBD technique on the applied dataset. The results have shown that the IML-ELNVBD technique has been validated with the low training and testing MSE. For instance, with fold-0, the IML-ELNVBD technique has attained training and testing MSE of 0.68 and 0.88 respectively. In addition, with fold-1, the IML-ELNVBD technique has attained training and testing MSE of 0.71 and 0.87 respectively. Moreover, with fold-2, the IML-ELNVBD technique has obtained training and testing MSE of 0.77 and 0.90 respectively. Furthermore, with fold-3, the IML-ELNVBD technique has obtained training and testing MSE of 0.60 and 1.00 respectively. Lastly, with fold-4, the IML-ELNVBD technique has obtained training and testing MSE of 0.71 and 0.93 respectively. Similarly, Fig. 4 shows the results analysis of the IML-ELNVBD technique with existing techniques under five classes respectively.
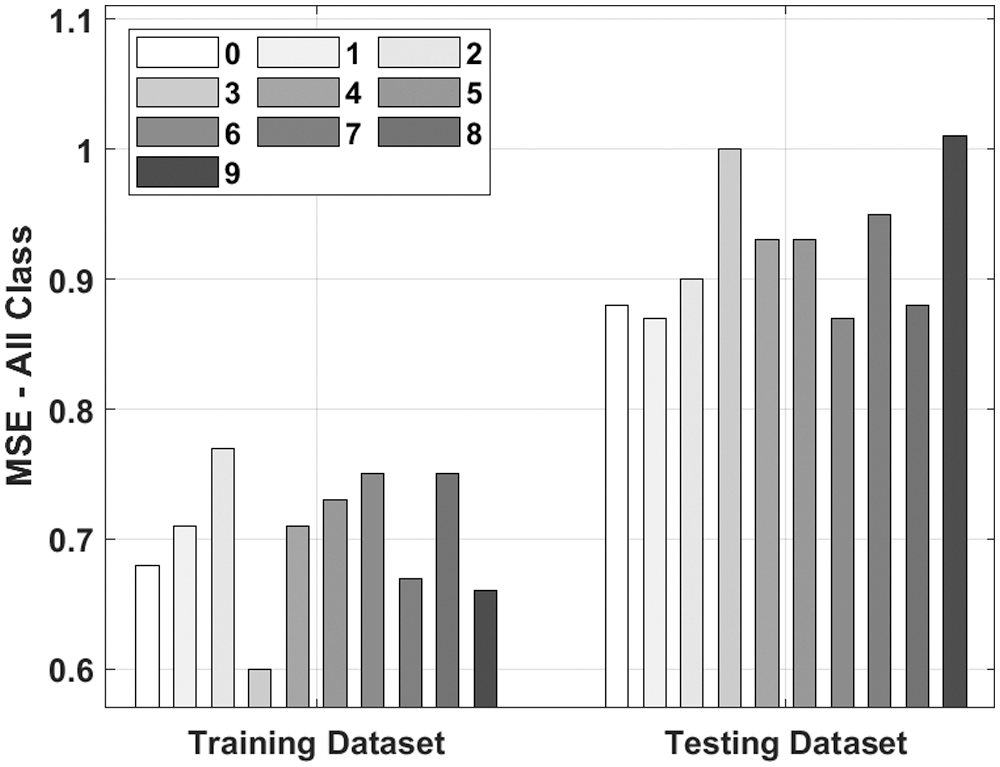
Figure 3: MSE analysis of IML-ELNVBD model with all class

Figure 4: MSE analysis of IML-ELNVBD model with five classes
A brief comparative study of the IML-ELNVBD technique takes place with existing techniques interms of MSE in Tab. 2 and Fig. 5. The figure has shown that the existing CC-ANN techniques have obtained higher MSE values on the training and testing data. At the same time, the proposed IML-ELNVBD technique has obtained lower MSE values on the applied dataset.

Figure 5: MSE analysis of IML-ELNVBD model existing techniques

Tab. 3 offers the classification results analysis of the IML-ELNVBD technique under varying aspects such as training-All Class (Tr-AC), training-five class (Tr-FC), testing-all class (Te-AC), and testing-five class (Te-FC).
Fig. 6 shows the results analysis of the IML-ELNVBD technique on Tr-AC dataset. The figure has shown that the IML-ELNVBD technique has gained effective outcomes under every fold. For instance, with fold-1, the IML-ELNVBD technique has obtained TP, TN, and accuracy of 93.70%, 90.70%, and 92.20%. Similarly, with fold-3, the IML-ELNVBD technique has attained TP, TN, and accuracy of 91.90%, 94.50%, and 93.20%. Likewise, with fold-5, the IML-ELNVBD technique has depicted d TP, TN, and accuracy of 93.70%, 90.80%, and 92.25%. Similarly, the figure revealed that the IML-ELNVBD technique has attained improved results outcome under every fold on Tr-FC dataset. For instance, with fold-1, the IML-ELNVBD technique has resulted in TP, TN, and accuracy of 83.40%, 80.80%, and 82.10%. Followed by, fold-3, the IML-ELNVBD technique has provided TP, TN, and accuracy of 84.90%, 82.50%, and 83.70%. Moreover, with fold-5, the IML-ELNVBD technique has resulted in TP, N, and accuracy of 80.20%, 82.80%, and 81.50%.


Figure 6: Result analysis of IML-ELNVBD model on Tr-AC dataset
Fig. 7 provides a comprehensive results analysis of the IML-ELNVBD technique on Te-AC dataset. The figure has shown that the IML-ELNVBD technique has accomplished better results under every fold. For instance, with fold-1, the IML-ELNVBD technique has resulted in TP, TN, and accuracy of 90.30%, 93.30%, and 91.80%. Concurrently, with fold-3, the IML-ELNVBD technique has provided TP, TN, and accuracy of 90.70%, 92.90%, and 91.80%. Simultaneously, with fold-5, the IML-ELNVBD technique has accomplished TP, N, and accuracy of 92.50%, 92.10%, and 92.30%. The results reported that the IML-ELNVBD technique has accomplished enhanced outcomes under every fold on Te-FC dataset. For instance, with fold-1, the IML-ELNVBD technique has resulted in TP, TN, and accuracy of 81.80%, 80.90%, and 81.35%. Meanwhile, with fold-3, the IML-ELNVBD technique has provided TP, TN, and accuracy of 82.10%, 82.40%, and 82.25%. Eventually, with fold-5, the IML-ELNVBD technique has resulted in TP, N, and accuracy of 80.70%, 84.40%, and 83.55%.

Figure 7: Result analysis of IML-ELNVBD model on Te-AC dataset
Finally, a classification accuracy analysis of the IML-ELNVBD technique takes place with recent techniques in Tab. 4 and Fig. 8. The results demonstrated that the CC-ANN(Te-AC) and CC-ANN(Te-FC) techniques have obtained the least accuracy of 73.23% and 72.93% respectively. At the same time, the IML-ELNVBD(Tr-FC) and IML-ELNVBD(Te-FC) techniques have resulted in moderate accuracy of 82.32% and 82.87% respectively. Followed by, the CC-ANN(Tr-AC) and CC-ANN(Tr-FC) techniques have obtained a competitive accuracy of 85.53% and 86.97% respectively. However, the IML-ELNVBD(Tr-AC) and IML-ELNBBD(Te-AC) approaches have resulted in a maximum accuracy of 92.79% and 92.23% respectively. By looking into the above mentioned tables and figures, it is demonstrated that the IML-ELNVBD technique has accomplished improved outcomes over the recent techniques.
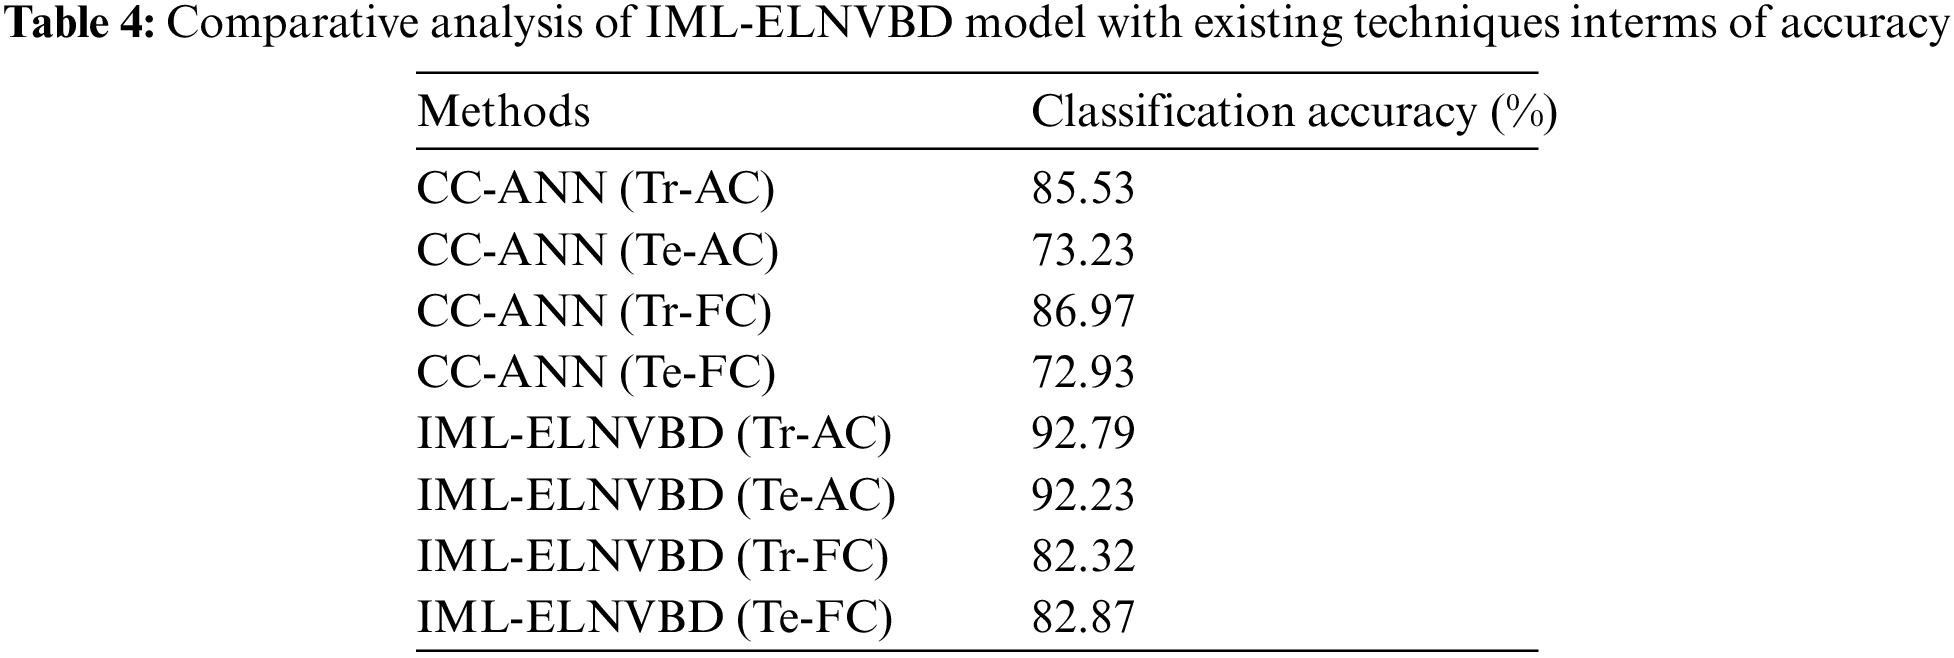

Figure 8: Accuracy analysis of IML-ELNVBD model with existing approaches
In this study, a novel IML-ELNVBD technique is presented for the detection and classification of non-verbal behaviour of the e-learner in the IoT environment. The proposed IML-ELNVBD technique allows the IoT devices such as audio sensors, cameras, etc. which are then connected to the cloud server for further processing. The proposed IML-ELNVBD technique involves different sub-processes namely data collection, behaviour modelling, behaviour extraction, ELM-SAE based classification, and ACO based parameter optimization. For examining the enhanced outcomes of the proposed model, a comprehensive simulation analysis is carried out. The experimental results highlighted the betterment of the IML-ELNVBD technique compared to the recent models. As a part of future extension, the classification performance can be boosted by the inclusion of advanced deep learning models.
Funding Statement: The authors extend their appreciation to the Deanship of Scientific Research at King Khalid University for funding this work under Grant Number (RGP.1/127/42). https://www.kku.edu.sa.
Conflicts of Interest: The authors declare that they have no conflicts of interest to report regarding the present study.
1. S. M. Aslam, A. K. Jilani, J. Sultana and L. Almutairi, “Feature evaluation of emerging E-learning systems using machine learning: An extensive survey,” IEEE Access, vol. 9, pp. 69573–69587, 2021. [Google Scholar]
2. A. Akram, C. Fu, Y. Li, M. Y. Javed, R. Lin et al., “Predicting students’ academic procrastination in blended learning course using homework submission data,” IEEE Access, vol. 7, pp. 102487–102498, 2019. [Google Scholar]
3. M. Brown, J. Dehoney and N. Millichap, “The next generation digital learning environment,” A Report on Research. ELI Paper. Louisville, CO: Educause April, 2015. [Google Scholar]
4. K. Vassallo, L. Garg, V. Prakash and K. Ramesh, “Contemporary technologies and methods for cross-platform application development,” Journal of Computational and Theoretical Nanoscience, vol. 16, no. 9, pp. 3854–3859, 2019. [Google Scholar]
5. J. M. Dodero, E. J. G. Conejero, G. G. Herrera, S. Peinado, J. T. Tocino et al., “Trade-off between interoperability and data collection performance when designing an architecture for learning analytics,” Future Generation Computer Systems, vol. 68, pp. 31–37, 2017. [Google Scholar]
6. S. K. Shankar, L. P. Prieto, M. J. R. Triana and A. Ruiz-Calleja, “A review of multimodal learning analytics architectures,” in 2018 IEEE 18th Int. Conf. on Advanced Learning Technologies (ICALT), Mumbai, India, pp. 212–214, 2018. [Google Scholar]
7. P. Blikstein and M. Worsley, “Multimodal learning analytics and education data mining: Using computational technologies to measure complex learning tasks,” Journal of Learning Analytics, vol. 3, no. 2, pp. 220–238, 2016. [Google Scholar]
8. C. Romero, M. I. Lopez, J. M. Luna and S. Ventura, “Predicting students’ final performance from participation in on-line discussion forums,” Computers & Education, vol. 68, pp. 458–472, 2013. [Google Scholar]
9. Z. Tanes, K. E. Arnold, A. S. King and M. A. Remnet, “Using signals for appropriate feedback: Perceptions and practices,” Computers and Education, vol. 57, no. 4, pp. 2414–2422, 2011. [Google Scholar]
10. L. F. Valentín, M. P. Sanagustín, D. H. Leo, A. Pardo, J. Blat et al., “Technological support for the enactment of collaborative scripted learning activities across multiple spatial locations,” Future Generation Computer Systems, vol. 31, pp. 223–237, 2014. [Google Scholar]
11. O. N. Pratiwi and Y. Syukriyah, “Question classification for e-learning using machine learning approach,” in 2019 Int. Conf. on ICT for Smart Society (ICISS), Bandung, Indonesia, pp. 1–4, 2019. [Google Scholar]
12. H. Anantharaman, A. Mubarak and B. T. Shobana, “Modelling an adaptive e-learning system using lstm and random forest classification,” in 2018 IEEE Conf. on e-Learning, e-Management and e-Services (IC3e), Langkawi Island, Malaysia, pp. 29–34, 2018. [Google Scholar]
13. I. Azzi, A. Jeghal, A. Radouane and H. Tairi, “Personalized E learning systems based on automatic approach,” in 2019 Int. Conf. on Wireless Technologies, Embedded and Intelligent Systems (WITS), Fez, Morocco, pp. 1–6, 2019. [Google Scholar]
14. M. Holmes, A. Latham, K. Crockett and J. D. O'Shea, “Near real-time comprehension classification with artificial neural networks: Decoding e-learner non-verbal behavior,” IEEE Transactions on Learning Technologies, vol. 11, no. 1, pp. 5–12, 2018. [Google Scholar]
15. R. Rajkumar and V. Ganapathy, “Bio-inspiring learning style chatbot inventory using brain computing interface to increase the efficiency of e-learning,” IEEE Access, vol. 8, pp. 67377–67395, 2020. [Google Scholar]
16. L. Zhao, K. Chen, J. Song, X. Zhu, J. Sun et al., “Academic performance prediction based on multisource, multifeature behavioral data,” IEEE Access, vol. 9, pp. 5453–5465, 2021. [Google Scholar]
17. T. Xie, Q. Zheng, W. Zhang and H. Qu, “Modeling and predicting the active video-viewing time in a large-scale e-learning system,” IEEE Access, vol. 5, pp. 11490–11504, 2017. [Google Scholar]
18. E. Baralis and L. Cagliero, “Highlighter: Automatic highlighting of electronic learning documents,” IEEE Transactions on Emerging Topics in Computing, vol. 6, no. 1, pp. 7–19, 2018. [Google Scholar]
19. X. Du, J. Yang and J. Hung, “An integrated framework based on latent variational autoencoder for providing early warning of at-risk students,” IEEE Access, vol. 8, pp. 10110–10122, 2020. [Google Scholar]
20. J. Tang, C. Deng and G. B. Huang, “Extreme learning machine for multilayer perceptron,” IEEE Transactions on Neural Networks and Learning Systems, vol. 27, no. 4, pp. 809–821, 2016. [Google Scholar]
21. M. Elhoseny, K. Shankar and J. Uthayakumar, “Intelligent diagnostic prediction and classification system for chronic kidney disease,” Scientific Reports, vol. 9, no. 1, pp. 9583, 2019. [Google Scholar]
 | This work is licensed under a Creative Commons Attribution 4.0 International License, which permits unrestricted use, distribution, and reproduction in any medium, provided the original work is properly cited. |