DOI:10.32604/cmc.2022.024488
| Computers, Materials & Continua DOI:10.32604/cmc.2022.024488 | |
| Article |
Optimal Deep Learning-based Cyberattack Detection and Classification Technique on Social Networks
1Department of Computer Sciences, College of Computer and Information Sciences, Princess Nourah bint Abdulrahman University, Riyadh, 11671, Saudi Arabia
2Department of Computer Science, College of Science and Arts, King Khalid University, Mahayil Asir, Saudi Arabia
3Department of Information Systems, College of Computer and Information Sciences, Prince Sultan University, Saudi Arabia
4Faculty of Computer and IT, Sana'a University, Sana'a, Yemen
5Department of Computer and Self-Development, Preparatory Year Deanship, Prince Sattam bin Abdulaziz University, AlKharj, Saudi Arabia
6Department of Natural and Applied Sciences, College of Community-Aflaj, Prince Sattam bin Abdulaziz University, Saudi Arabia
*Corresponding Author: Anwer Mustafa Hilal. Email: a.hilal@psau.edu.sa
Received: 19 October 2021; Accepted: 29 December 2021
Abstract: Cyberbullying (CB) is a distressing online behavior that disturbs mental health significantly. Earlier studies have employed statistical and Machine Learning (ML) techniques for CB detection. With this motivation, the current paper presents an Optimal Deep Learning-based Cyberbullying Detection and Classification (ODL-CDC) technique for CB detection in social networks. The proposed ODL-CDC technique involves different processes such as pre-processing, prediction, and hyperparameter optimization. In addition, GloVe approach is employed in the generation of word embedding. Besides, the pre-processed data is fed into Bidirectional Gated Recurrent Neural Network (BiGRNN) model for prediction. Moreover, hyperparameter tuning of BiGRNN model is carried out with the help of Search and Rescue Optimization (SRO) algorithm. In order to validate the improved classification performance of ODL-CDC technique, a comprehensive experimental analysis was carried out upon benchmark dataset and the results were inspected under varying aspects. A detailed comparative study portrayed the superiority of the proposed ODL-CDC technique over recent techniques, in terms of performance, with the maximum accuracy of 92.45%.
Keywords: Cybersecurity; cyberbullying; social networks; parameter tuning; deep learning; metaheuristics
There has been a tremendous increase observed in online activities in the recent years among teenagers. This phenomenon is prevalently found in social media platforms that consistently expose teenagers to Cyber Bullying (CB). Bullying can be determined as an aggressive and intentional behaviour/act which is performed repeatedly by an individual or a group against victim(s) who cannot protect themselves over a period of time [1]. Cyberbullying has been documented as a national health problem and is recognized as one of the main mental health problems owing to its continuous increase in social media and other online modes of communication [2]. The negative effect of cyberbullying shares multiple similarities with conventional bullying. However, cyberbullying can be increasingly dangerous due to high propagation and frequency empowered by technology at the same time [3]. Surveys conducted earlier have related cyberbullying with negative impacts on academic performance, high risk of suicidal ideation, depression psychological and physical health [4]. So, early recognition of cyberbullying in social networking sites is paramount to reduce and mitigate its negative impacts upon the victim. Furthermore, the repetitive nature of cyberbullying makes it highly challenging to terminate and detect immediately. Cyber aggression, on one side, helps in detecting the aggressor and on the other side, assist the victim.
From the perspectives of cyber world, the applications with CB pose significant challenges in terms of lack of straightforward communications, consequences associated over others, self and victim's identity, and the ignorance of aggressors [5]. The failure in straightforward communications disrupts the nature of message and partial interpretation leads to confusion on the interaction messages. Further, the intention of the individual with exchange of messages becomes complicated. Though there are difficulties in identification, when detecting an individual's behavioral intention, the main reason behind the transition of a harasser from aggression to CB is their intent to harm oneself [6]. At present, authors have attempted to innovate technologies for resolving real-time challenges in cyberbullying. Nowadays, the social networking platforms are developed with an automatic behaviour that alerts the moderator to analyze the content [7]. But the present architecture lacks an intelligent automation process that can alter and detect the CB content quickly with precision, when compared to conventional reporting method.
In case of an alert, the moderators respond and take the required action whereas alerts are taken against the user content [8]. This study was conventionally performed on the surveyed data/accessible datasets, in which the victims/perpetrators report the impression. Highly accurate and automated recognition process is one another challenge faced in the mitigation of cyber bullying from the accessible dataset. Hence, the difficulty in recognizing activity must be improved [9]. The need for advanced tools that can incorporate the features with automatic decision method is increasing. Several studies conducted upon smart CB detection used machine learning methods as well as adapted psychological and common features. However, this smart system is limited one, confined to the comments of an individual, leaving behind their context [10]. Another research work reported about the usage of user contexts in action which includes the history of a user's comments and their characteristics to enhance CB classification or detection accuracy. Currently, the studies conducted earlier have established novel technologies for automatic recognition of CB with real-time challenges.
Ptaszynski et al. [11] proposed a new approach for automated recognition of cyberbullying entries on internet. In this model, the researchers utilized seed words from three classes to analyze a semantic orientation score and later maximized the significance of classes. The presented model outperformed benchmark settings in real world and laboratory conditions. In practice, the proposed method was tested and deployed. Bozyiğit et al. [12] developed the significance of social networking features in cyberbullying recognition. In this study, a balanced dataset was prepared that consists of 5,000 labelled contents from various social networking attributes. Next, the relationships amid cyberbullying and social networking attributes were investigated using chi-square test. For example, a user with more followers on social media are disinclined towards posting online bullying content. Consequently, ML methods were tested on two distinct kinds of the prepared dataset.
Chia et al. [13] clarified and reviewed the description of sarcasm and irony by discussing several research terms. Then, the researchers conducted early experiments by comparing different kinds of classification algorithms that involve some common classifiers for text classification process. Next, various kinds of data pre-processing models were analyzed and compared. Lastly, the relationships among cyberbullying, irony, and sarcasm were discussed. Eronen et al. [14] conducted a study using numerous datasets including common datasets like Yelp business review datasets which were utilized to train conventional SA method. Newer datasets attempted to address the problems of cyberbullying since it is a crucial social problem and a complicated problem from the perspective of linguistic representations.
Balakrishnan et al. [15] proposed an automated cyberbullying recognition method to tap the psychological characteristics of twitter users involving sentiment, emotion, and personalities. In this study, user personality has been defined by Big Five and Dark Triad methods, where ML classifiers like NB, RF, and J48 were utilized in the classification of twitters under four classes namely, normal, bully, aggressor, and spammer. This twitter dataset contained 5,453 tweets with the hashtag #Gamergate and was automatically annotated by human expertise.
The major objective of this study is to develop Optimal Deep Learning based Cyberbullying Detection and Classification (ODL-CDC) technique for effective identification and classification of different kinds of cyberbullying that exist in social networking sites.
The current research work presents an Optimal Deep Learning based Cyberbullying Detection and Classification (ODL-CDC) technique for identifying cyberbullying on social networks. The proposed ODL-CDC technique involves different processes such as pre-processing, prediction, and hyperparameter optimization. In addition, GloVe approach is also employed for the generation of word embedding. Besides, the pre-processed data is fed into Bidirectional Gated Recurrent Neural Network (BiGRNN) model for prediction process. Moreover, hyperparameter tuning of BiGRNN model is carried out with the help of Search and Rescue Optimization (SRO) algorithm. In order to validate the improved classification performance of ODL-CDC technique, a comprehensive experimental analysis was carried out on benchmark dataset and the results were inspected under varying aspects.
Rest of the sections in this paper is arranged as follows. Section 2 elaborates the proposed ODL-CDC technique while the simulation results are discussed in Section 3. Finally, the concluding remarks are identified in Section 4.
In this study, a novel ODL-CDC technique is developed to identify the presence of cyberbullying in social networking websites. The proposed ODL-CDC technique comprises of pre-processing, Glove-based word embedding, BiGRNN-based prediction, and SRO-based hyperparameter optimization. SRO algorithm is utilized for proper hyperparameter tuning of BiGRNN parameters which helps in improving the classification performance substantially. Fig. 1 illustrates the overall process of ODL-CDC model.
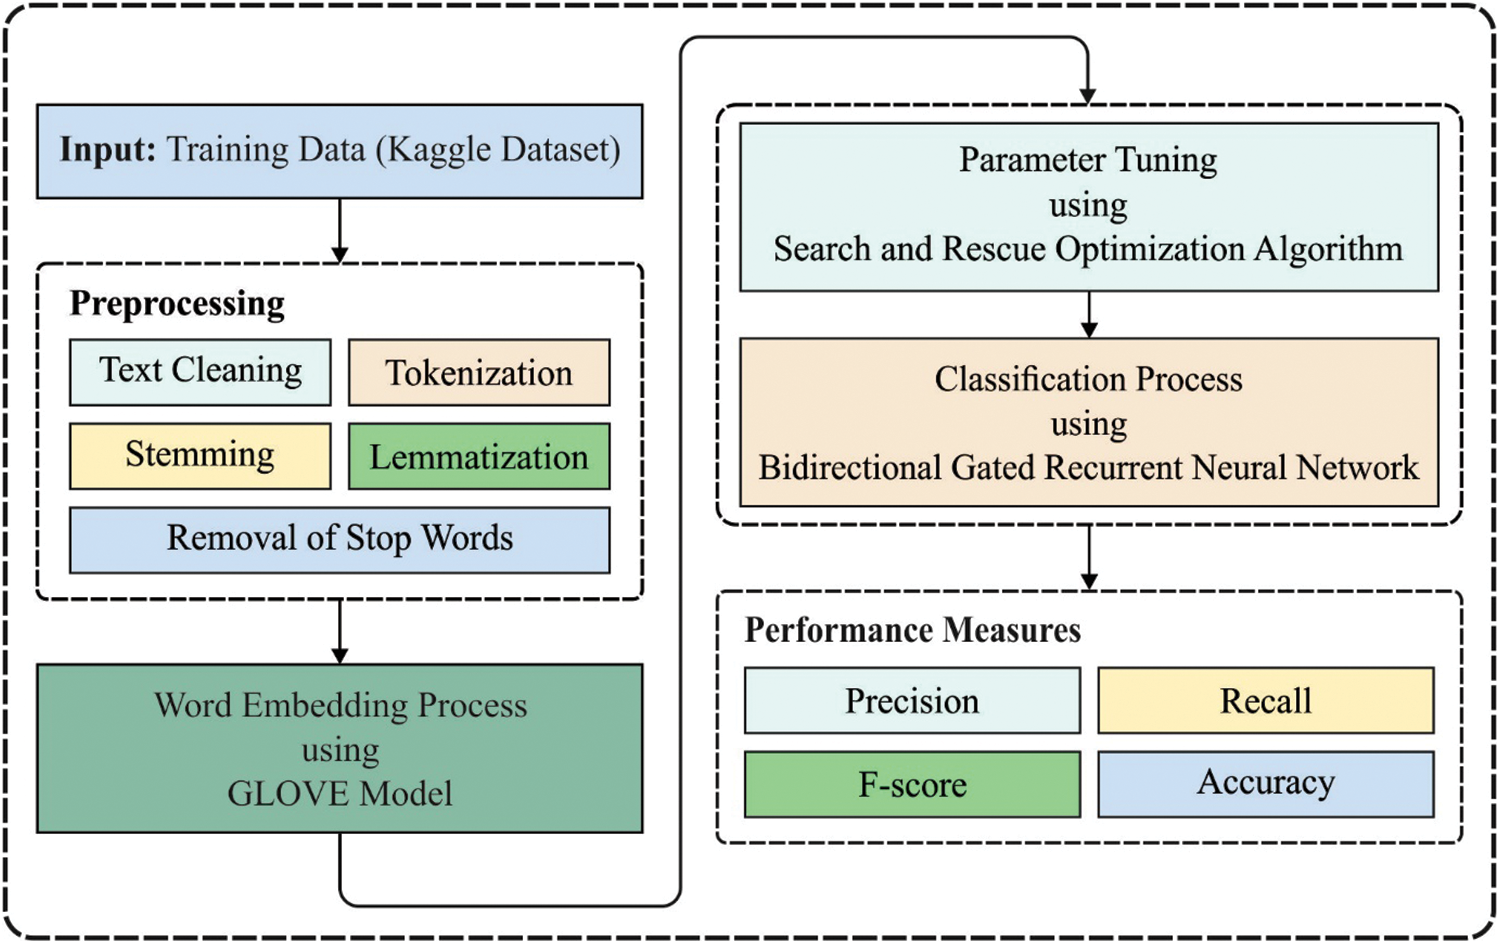
Figure 1: Overall process of ODL-CDC model
In this primary stage, social networking data is pre-processed under different stages [16] such as text cleaning, tokenization, stemming, lemmatization, and stop word removal.
2.2 Glove's Word Embedding Technique
GloVe word-embedded model is utilized in the presented technique to extract semantic features in text-on-web page. GloVe is an abbreviation of Global Vectors while GloVe embedded model has unsupervised learning technique to distributed word demonstration of the text removed in this web page. GloVe technique is easy to train the information because of its parallel execution method. It takes the semantic connections of words from vector spaces. Global co-occurrence matrix X is generated based on the words established in Wikipedia dataset to train GloVe word-embedded technique [17].
During co-occurrence matrix, X:
At this stage, the social networking data is classified into normal and insult by BiGRNN model. GRU-NN is a basic form of LSTM while the procedure mimics RNN. In contrast with LSTM, GRU has a combination of input as well as forgetting gates to upgrade gate. Its fundamental framework is demonstrated in Fig. 2.
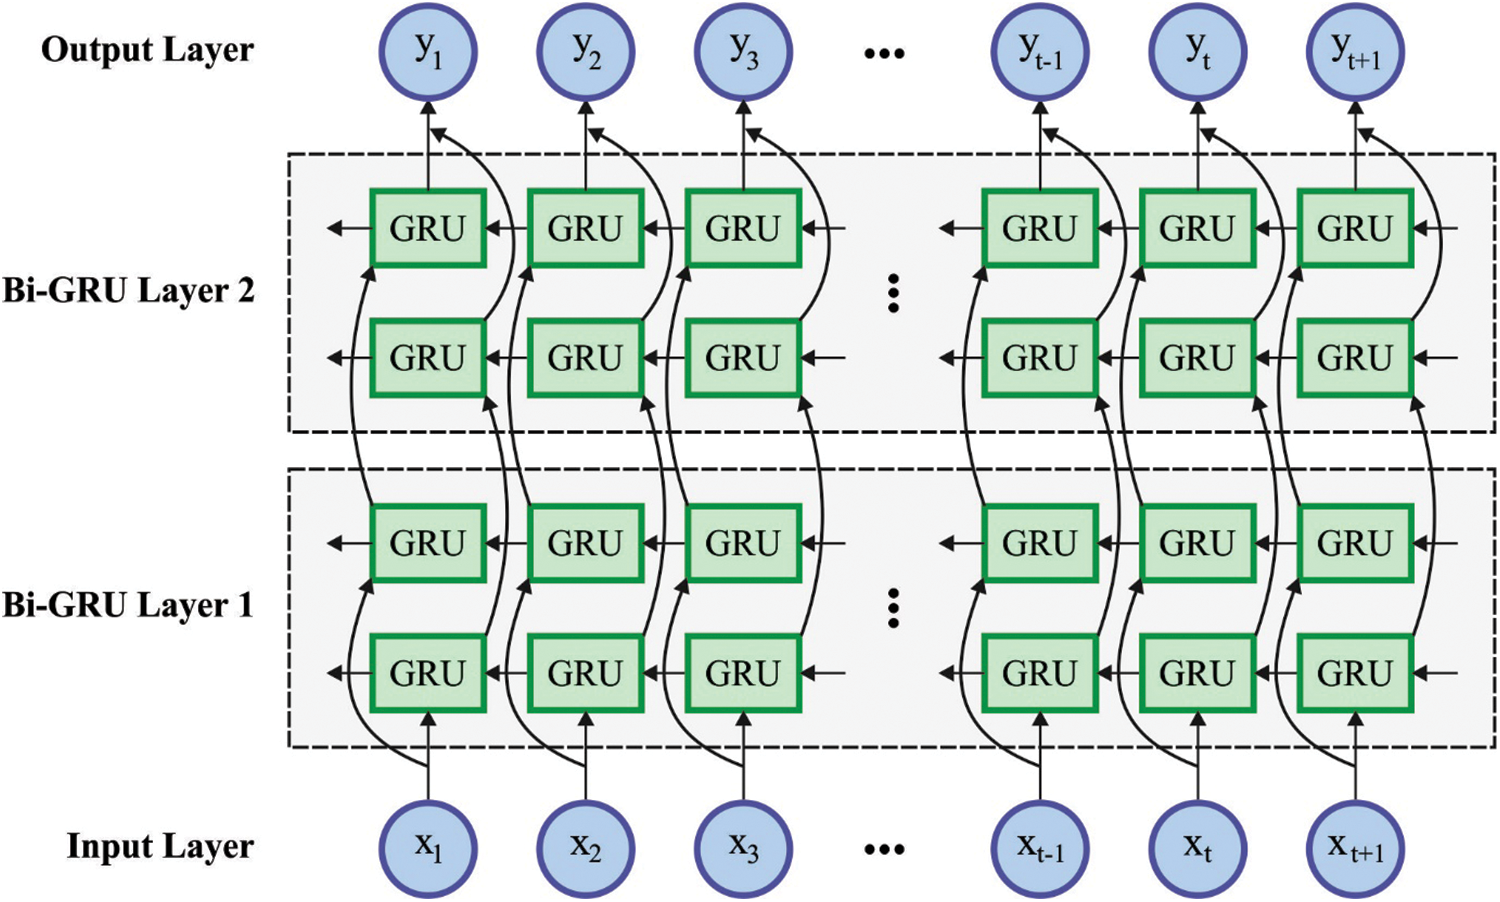
Figure 2: BiGRU structure
Considering that the amount of hidden units is h, a small-batch input with provided time step of t is
where
If water quality time series parameter is forecasted, the value of present time is nearly connected with the values of preceding time and next time. But, GRU is a one-way NN framework due to which BiGRU is utilized. BiGRU is a bidirectional NN which is a collection of collected of forward-propagating GRU and backward-propagating GRU units. The present hidden layer state
where GRU (.) function designates that GRU network is utilized for conducting non-linear alteration on input data of water quality whereas the input vector encodes to equivalent GRU hidden state;
2.4 SRO Based Hyperparameter Optimization
In order to have an appropriate fine tuning of the hyperparameters in BiGRNN model, SRO algorithm is utilized. Shabani et al. [19] presented SAR inspired from the research conducted upon humans at search and rescue processes. Search and rescue process comprises of two stages such as individual phase and social phase. The clues left at the time of search by a group member get stored in memory matrix (O) where the humans’ position are stored from position matrix (W). The clue matrix B using size
The two stages of human search are modelled as given herewith i) social stage: The search direction is represented as
Now
ii) Individual Stage: According to the present human position, their novel location is found and
Each solution must be found in the solution space, when a novel location is present on the outside of solution space as mentioned herewith.
whereas
Here,
At the time of clues’ search operation, when better clues are not found near the existing location after some searches, humans move to a novel location.
While the USN value is high than the maximal unsuccessful search number, the human gets an arbitrary location in searching space as per Eq. (17) while the values of
Here,
The performance validation of the proposed ODL-CDC technique was carried out using Kaggle dataset which contains instances under two classes namely, neutral/normal (class 0) and insult (class 1). Most of the words that exist in neural statements are ‘people’, ‘like’, ‘just’, ‘make’, ‘now’, ‘right’, ‘can’, ‘one’ and ‘think’. Similarly, the words that exist in insult statements include ‘people’, ‘shit’, ‘think’, ‘idiot’, ‘life’, ‘bitch’, ‘back’ and ‘dumb’ which are the most frequent words used in bad sentences. The results were examined without hyperparameter tuning, i.e., BiGODL-CDC technique, and with hyperparameter tuning, i.e., ODL-CDC technique under different measures.
Tab. 1 shows the results of classification obtained by BiGODL-CDC technique on test Kaggle dataset. The results portray that BiGODL-CDC technique accomplished an effective performance under all classes. For instance, under run-1 with normal class, BiGODL-CDC technique obtained
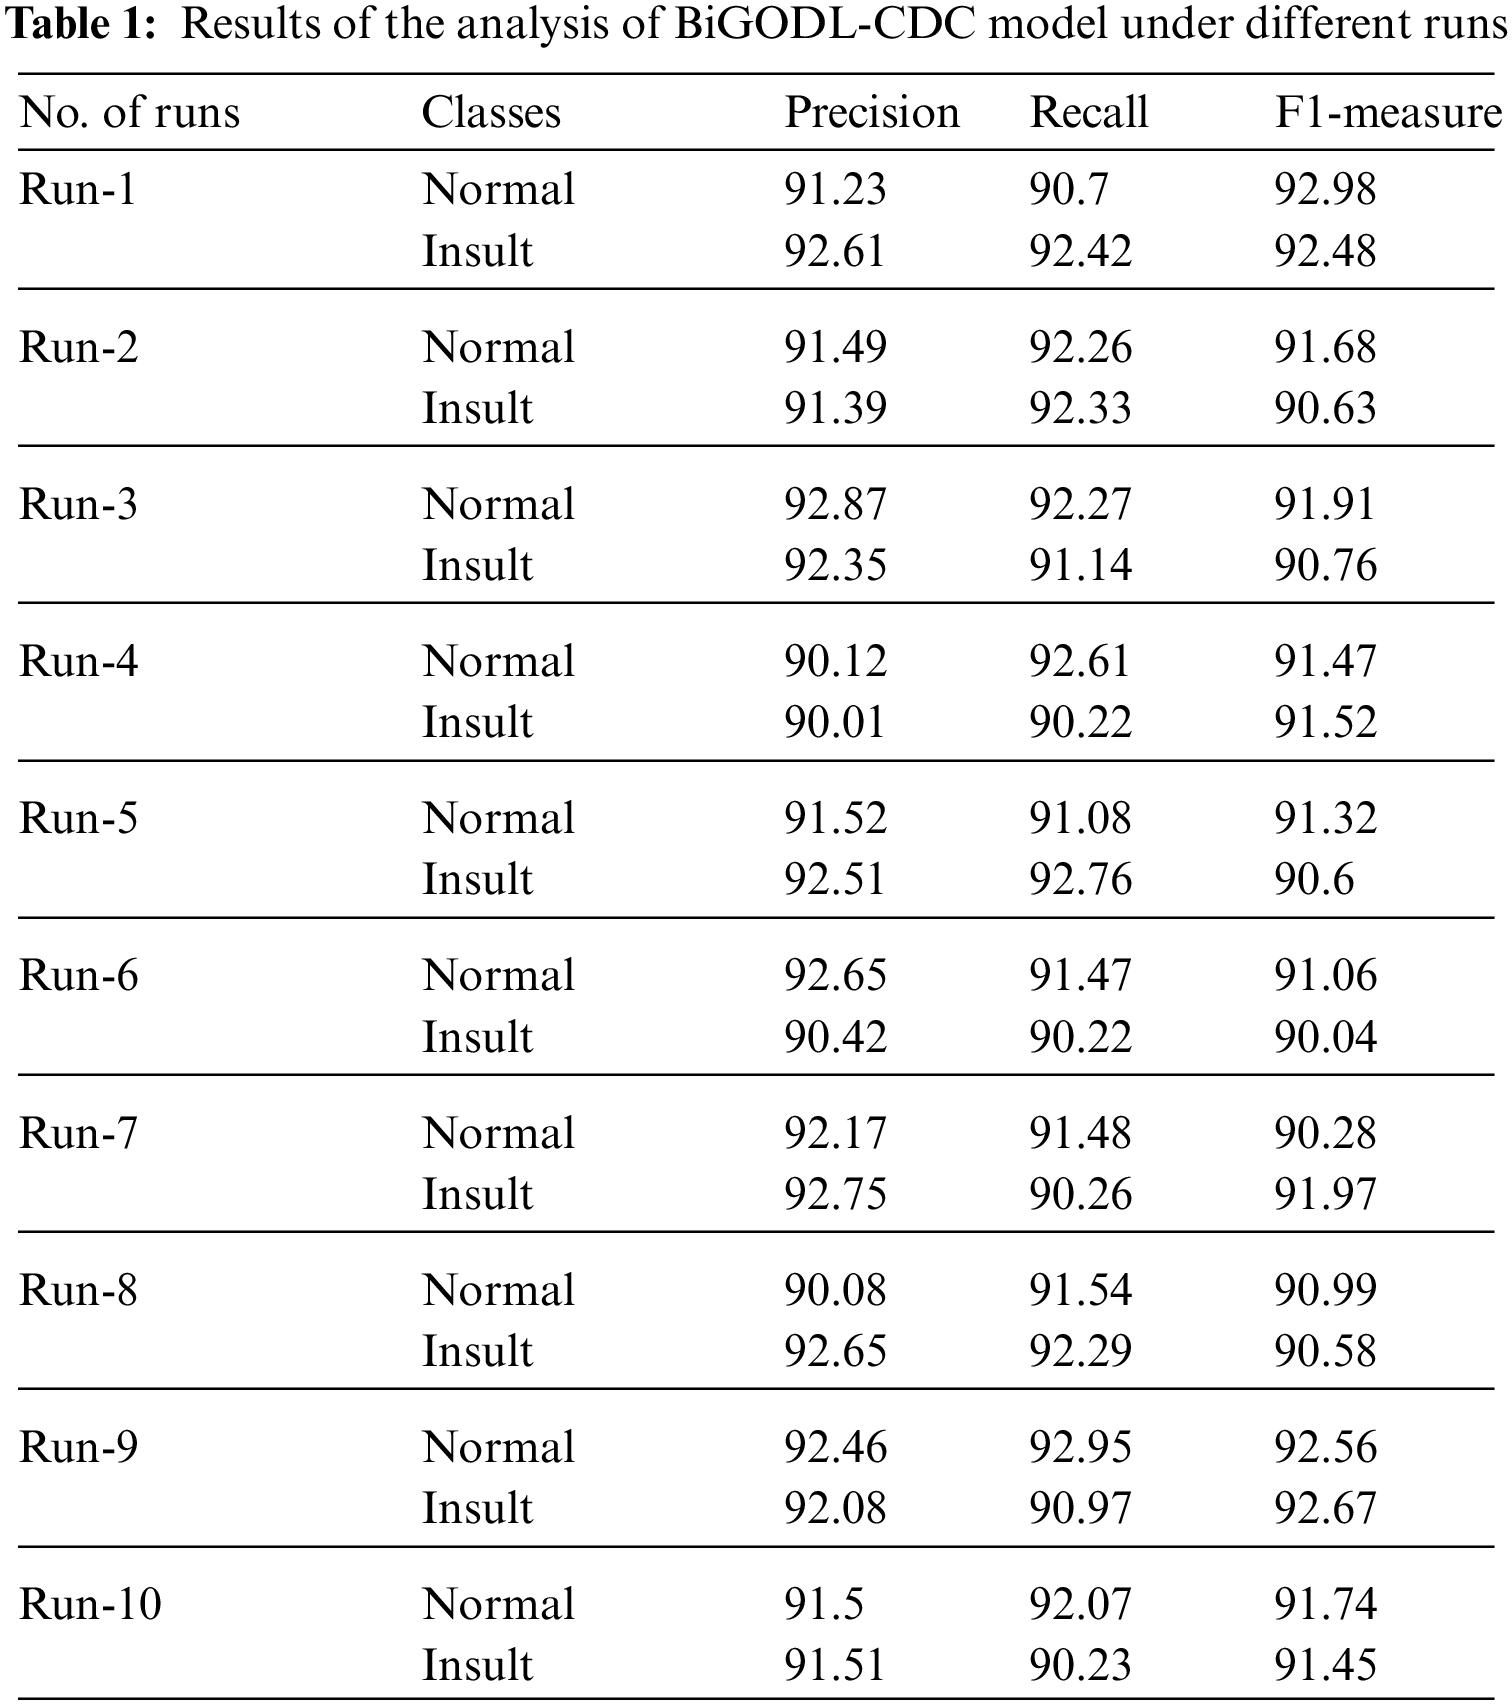
Concurrently, under run-7 with normal class, BiGODL-CDC technique obtained
Tab. 2 and Fig. 3 provide the comprehensive classification results offered by BiGODL-CDC technique under ten distinct runs. The results show that the proposed BiGODL-CDC technique accomplished maximum cyberbullying detection performance. For instance, with run-1, BIGODL-CDC technique achieved
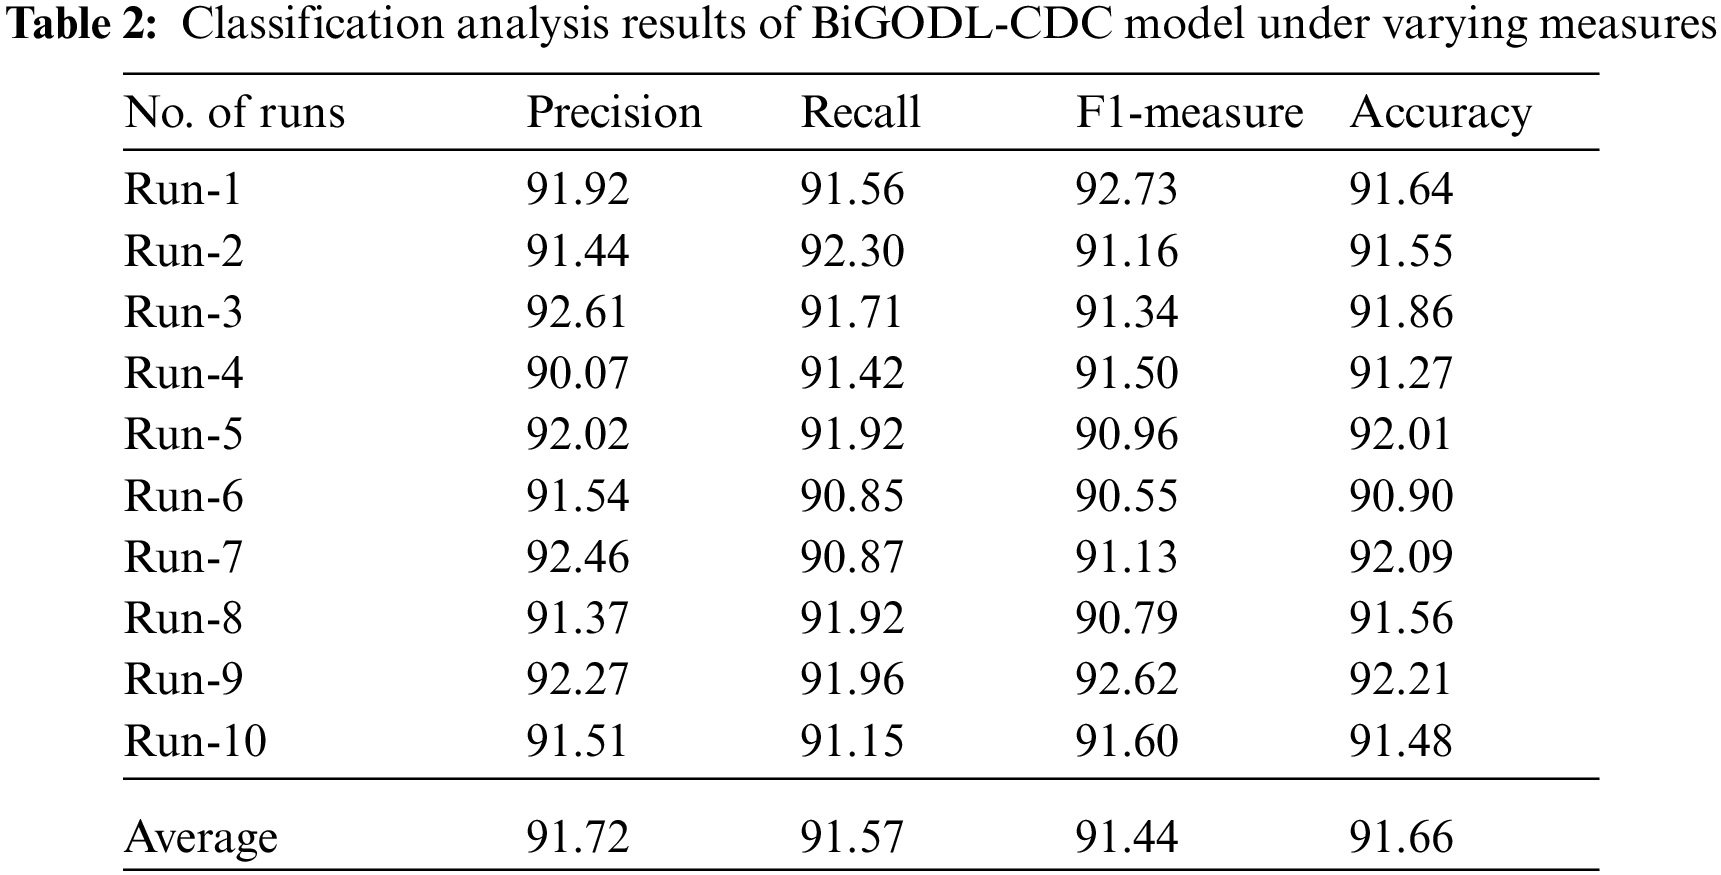
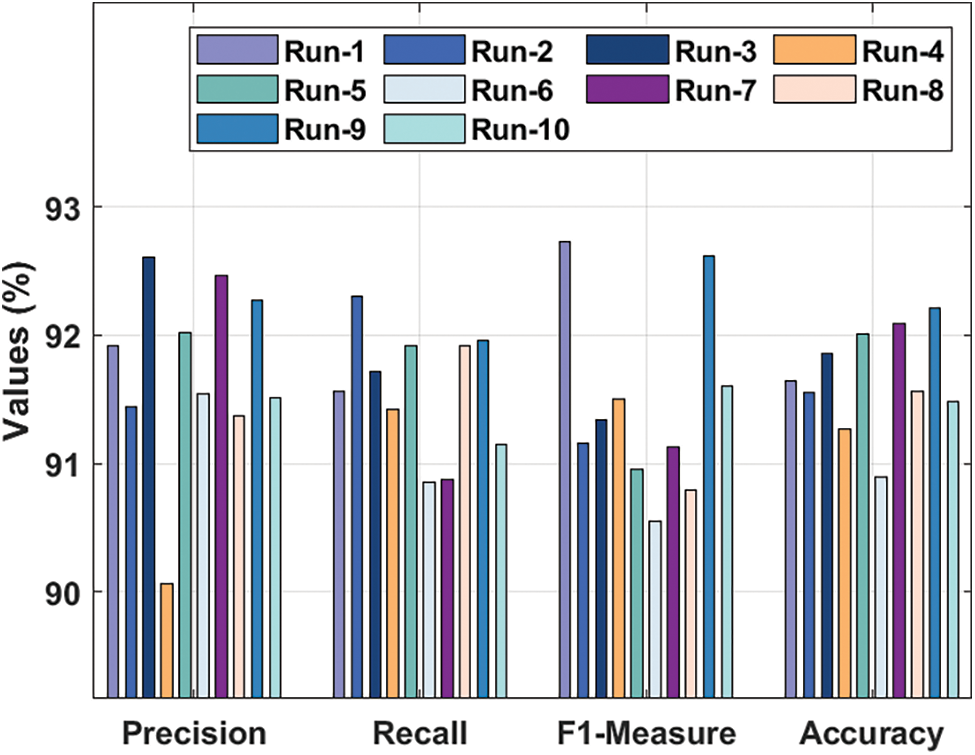
Figure 3: Classification analysis results of BiGODL-CDC model under different measures
Fig. 4 illustrates the results for accuracy analysis of BiGODL-CDC technique. The figure implies that the accuracy values increased with an increase in epoch count. It is also noted that the validation accuracy also seemed to be higher than the training accuracy.
Loss graph analysis results accomplished by BiGODL-CDC technique is illustrated in Fig. 5. The figure infers that the loss values are minimal with increasing epoch counts. It is also observed that the validation loss is considerably lower than the training loss.
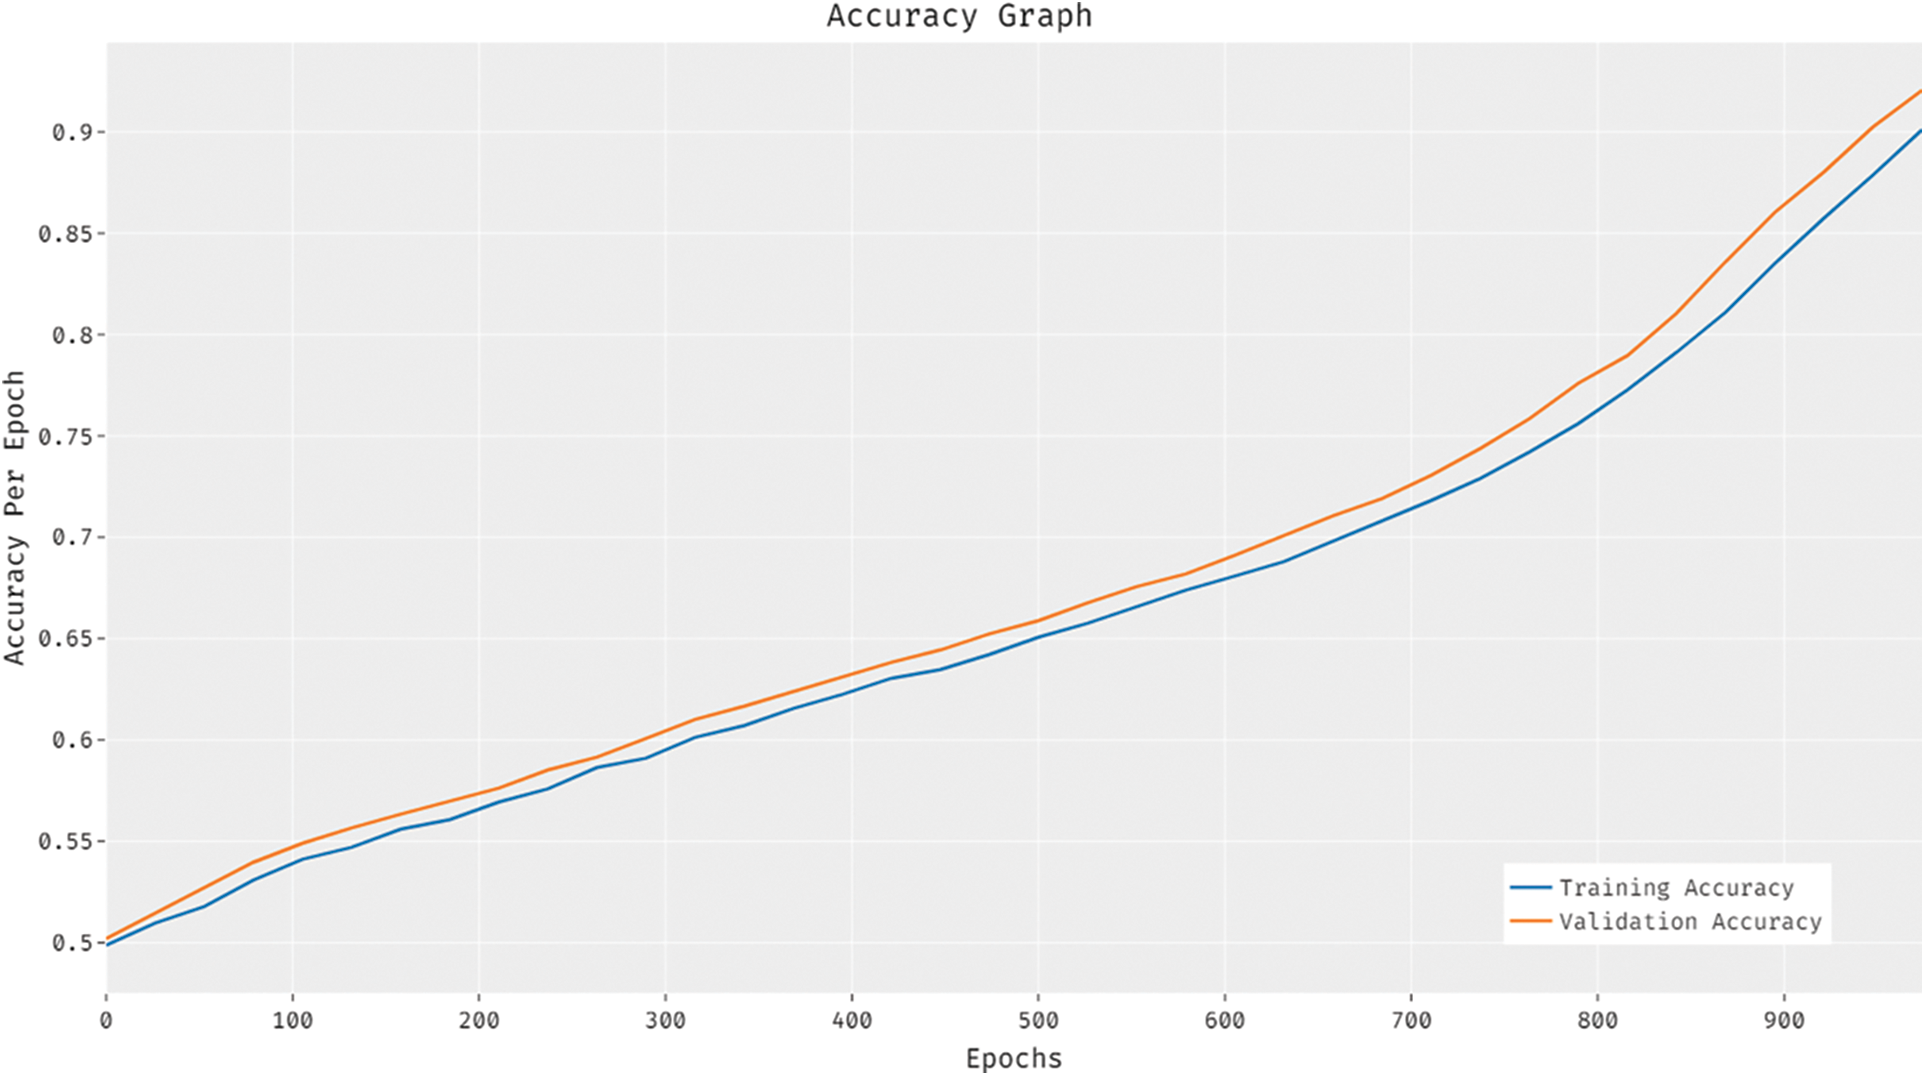
Figure 4: Accuracy analysis of BiGODL-CDC model
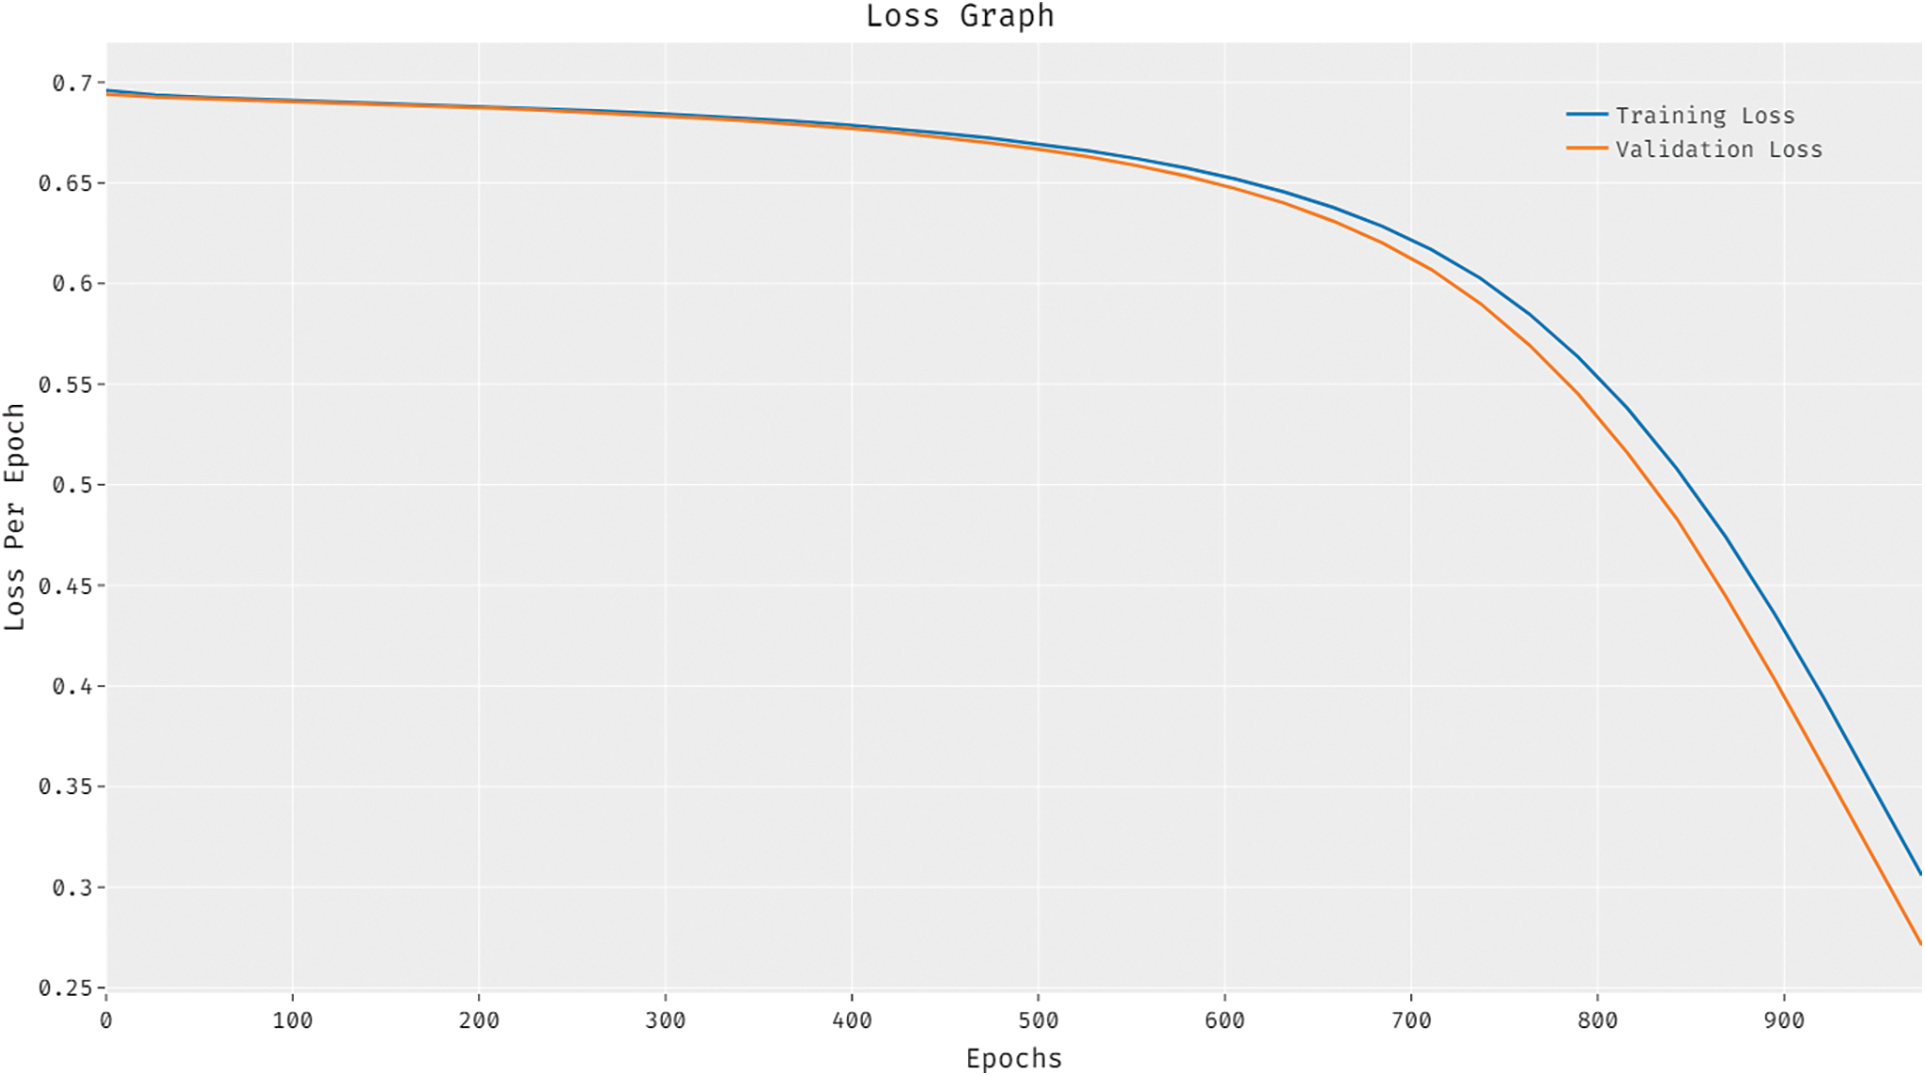
Figure 5: Loss analysis of BiGODL-CDC model
Tab. 3 shows the classification outcomes obtained by the proposed ODL-CDC system on test Kaggle dataset. The outcomes show that the proposed ODL-CDC technique outperformed all other methods and accomplished an effectual performance under all classes. For instance, under run-1 with normal class, ODL-CDC technique attained
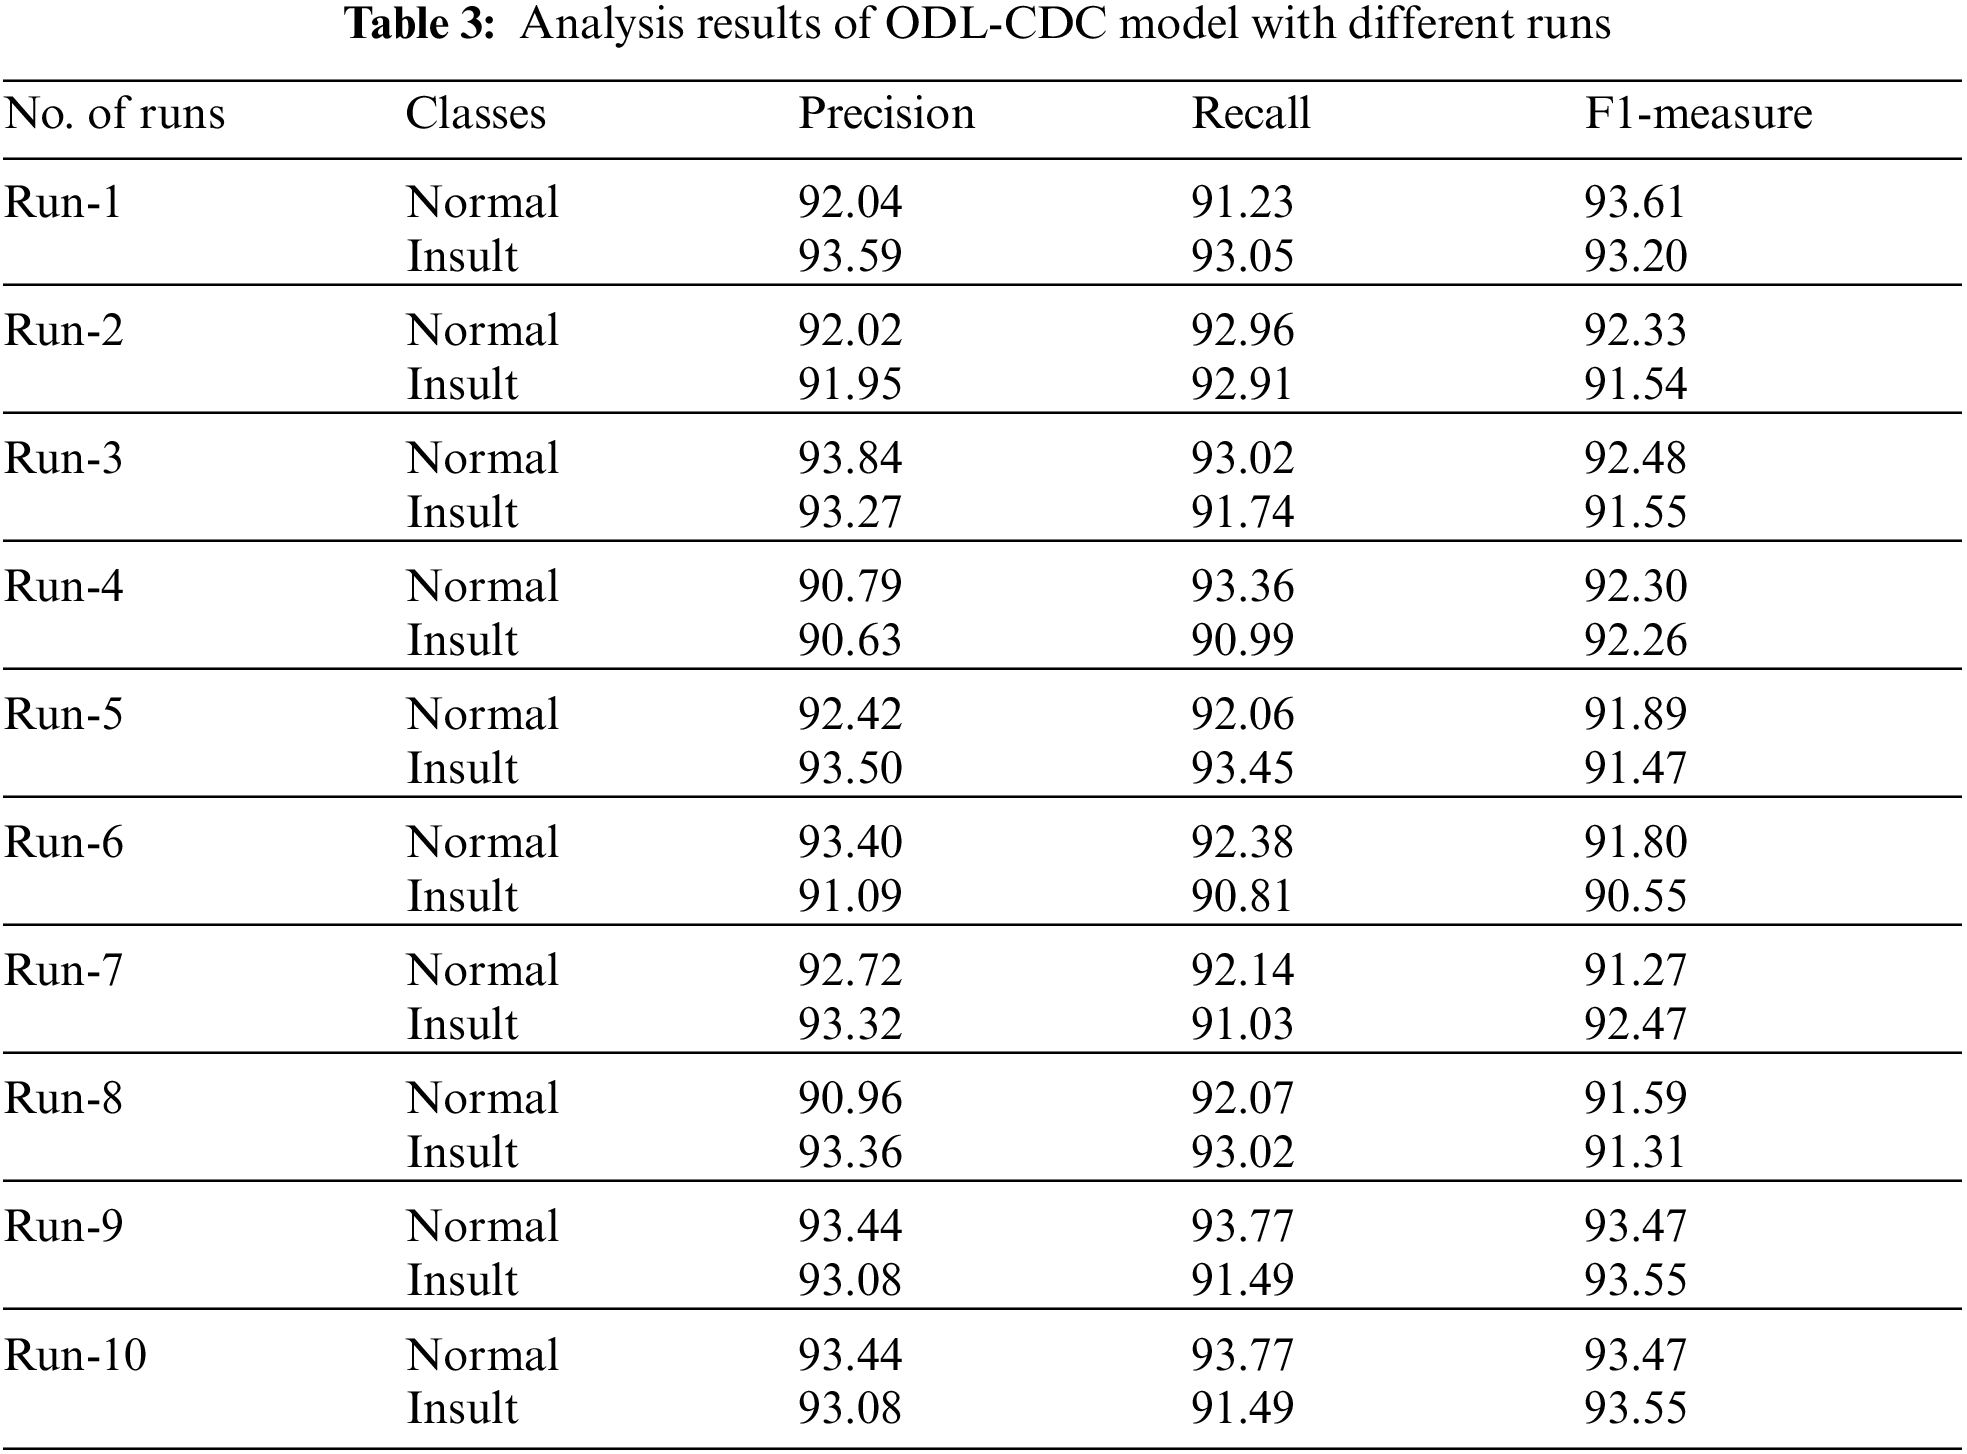
Also, under run-7 with normal class, ODL-CDC technique gained
Tab. 4 and Fig. 6 offer the results for comprehensive classification obtained by the proposed ODL-CDC manner under ten distinct runs. The outcomes showcase that the proposed ODL-CDC technique accomplished the maximal cyberbullying detection performance. For instance, with run-1, ODL-CDC approach gained
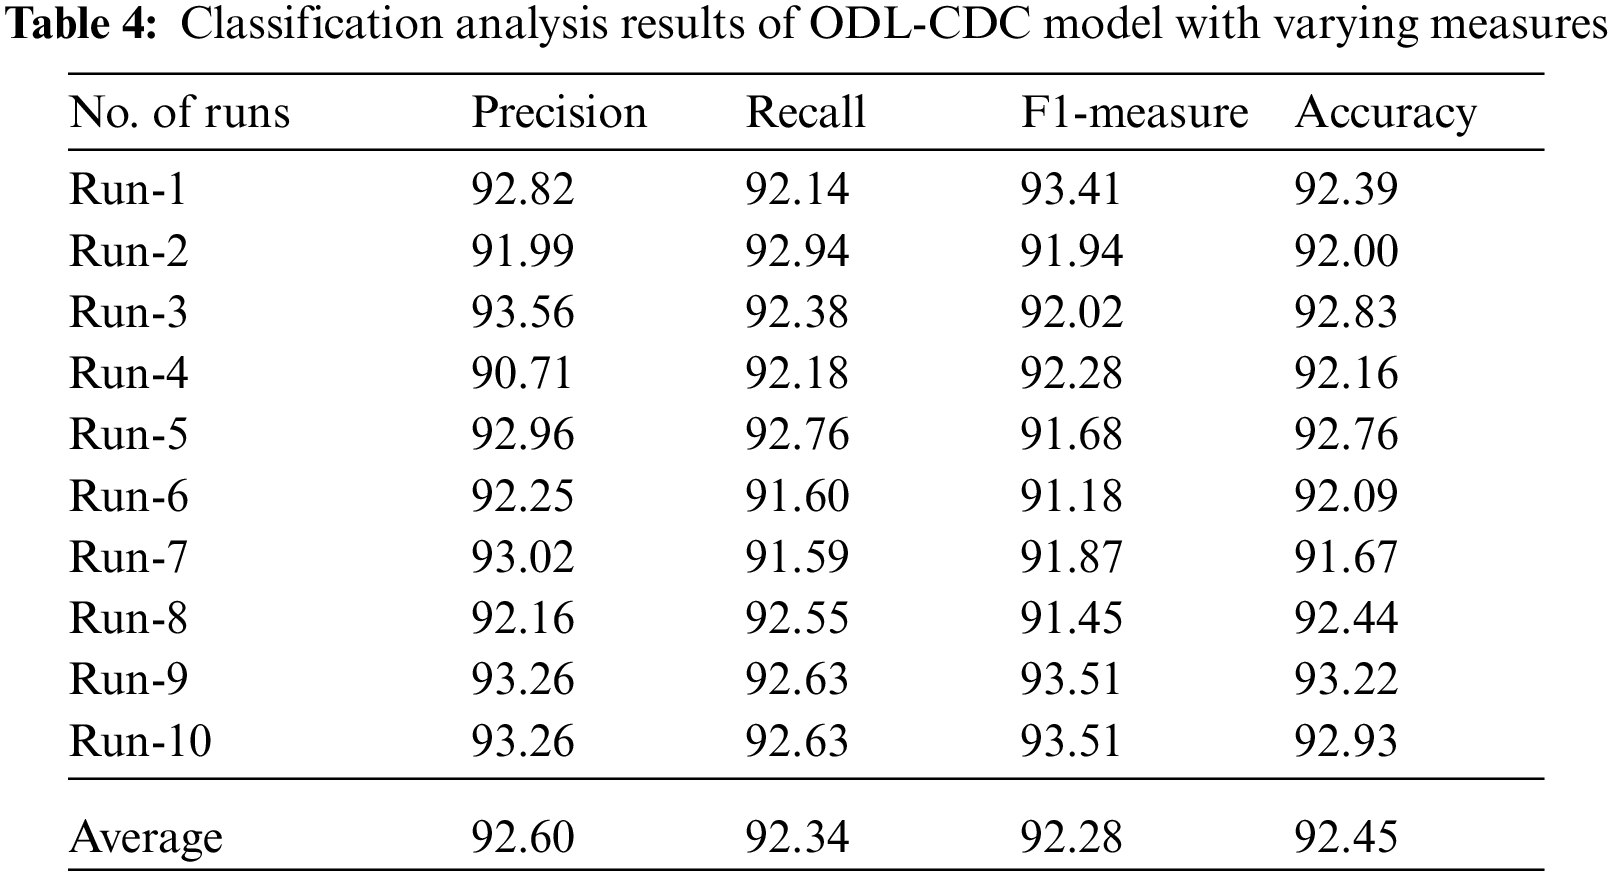
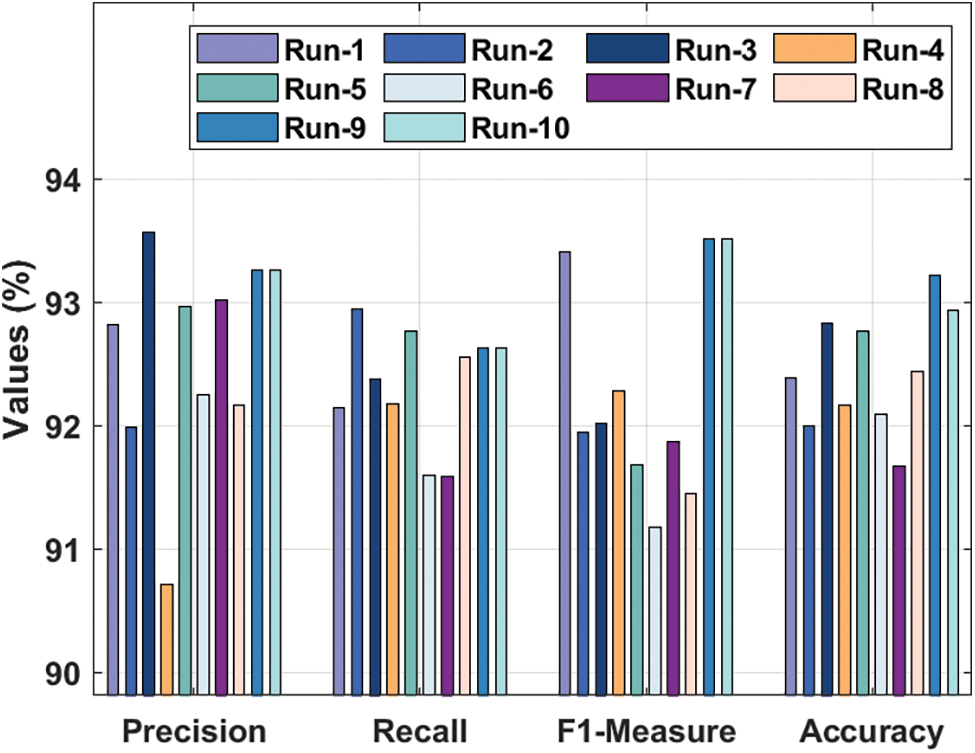
Figure 6: Classification analysis results of ODL-CDC model with different measures
The results for accuracy graph analysis obtained by ODL-CDC approach is demonstrated in Fig. 7. The figure infers that the accuracy values increased with increasing number of epoch counts. It can be also stated that the validation accuracy is superior to training accuracy.
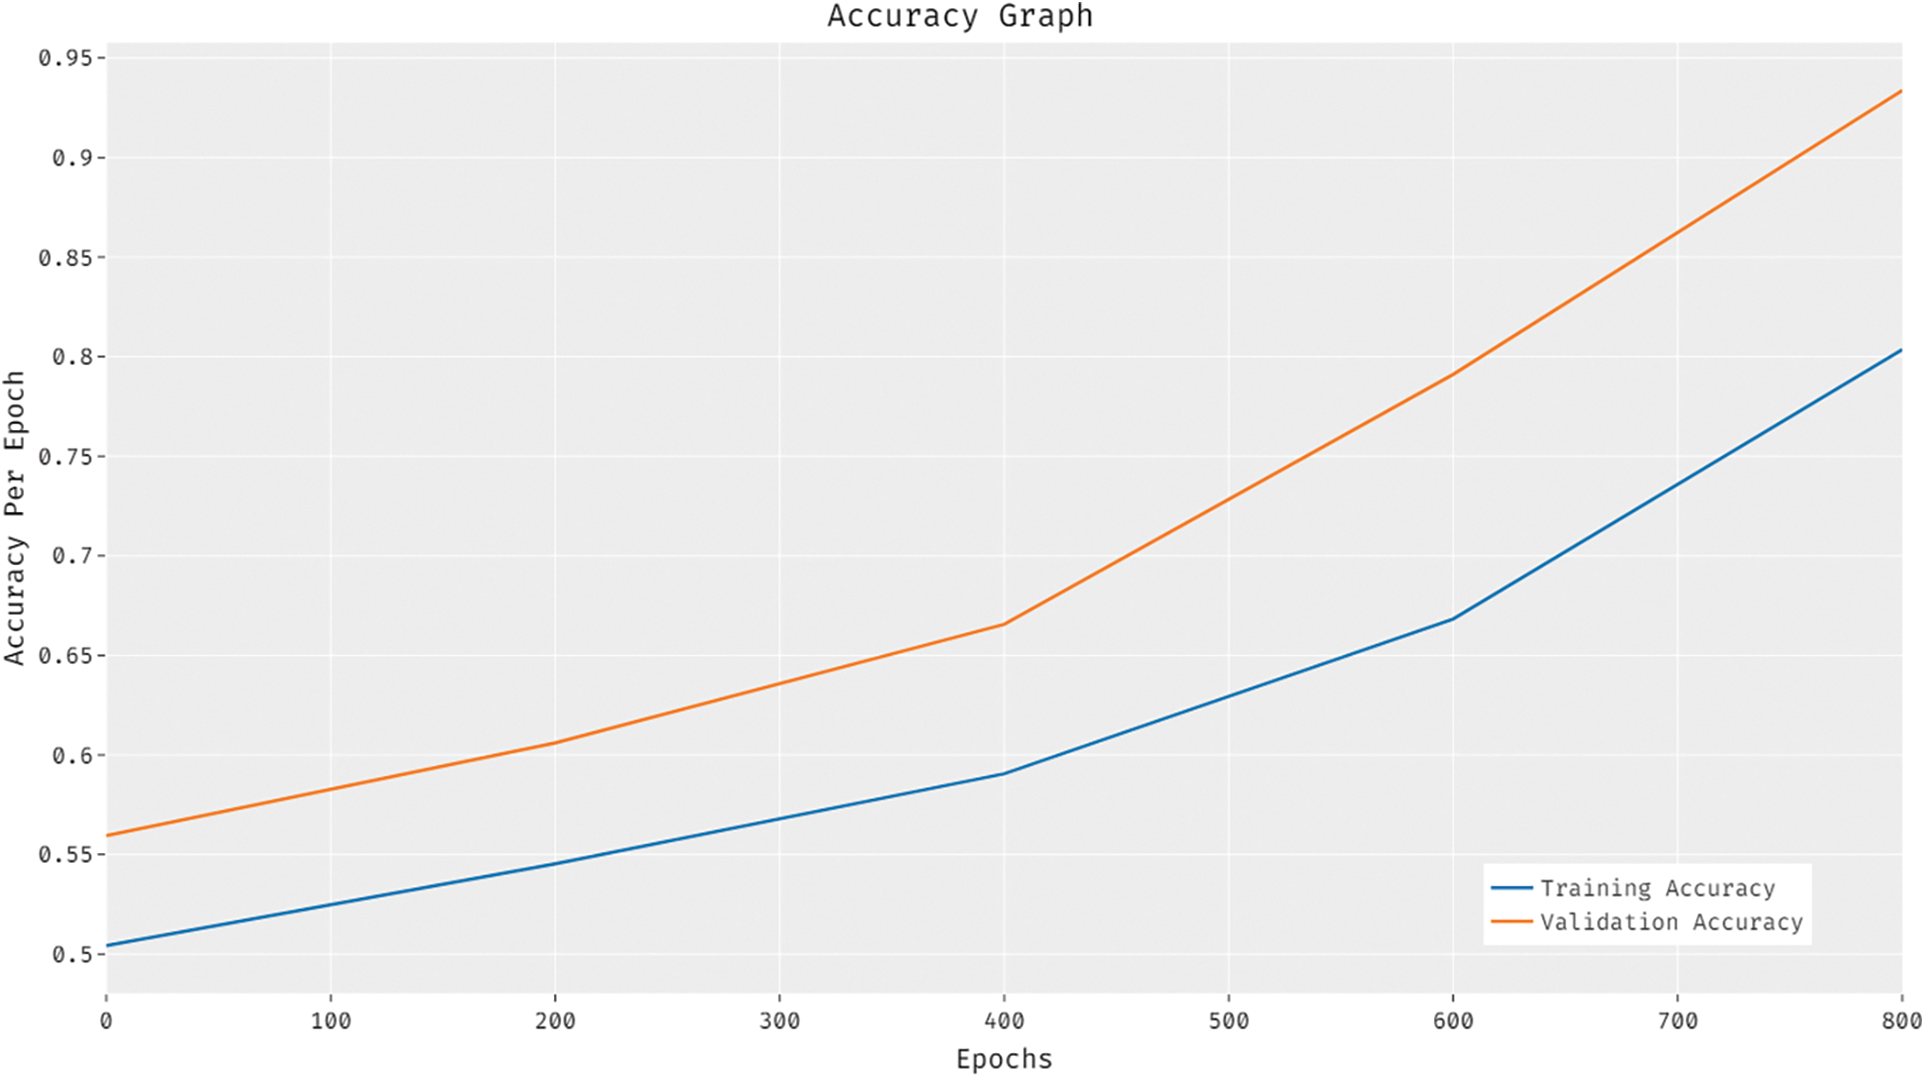
Figure 7: Accuracy analysis results of ODL-CDC model
Fig. 8 shows the results for loss graph analysis obtained by ODL-CDC manner. The figure infers that the loss values got established to a low, with an increase in epoch count. It is also clear that the validation loss is considerably lesser than the training loss.
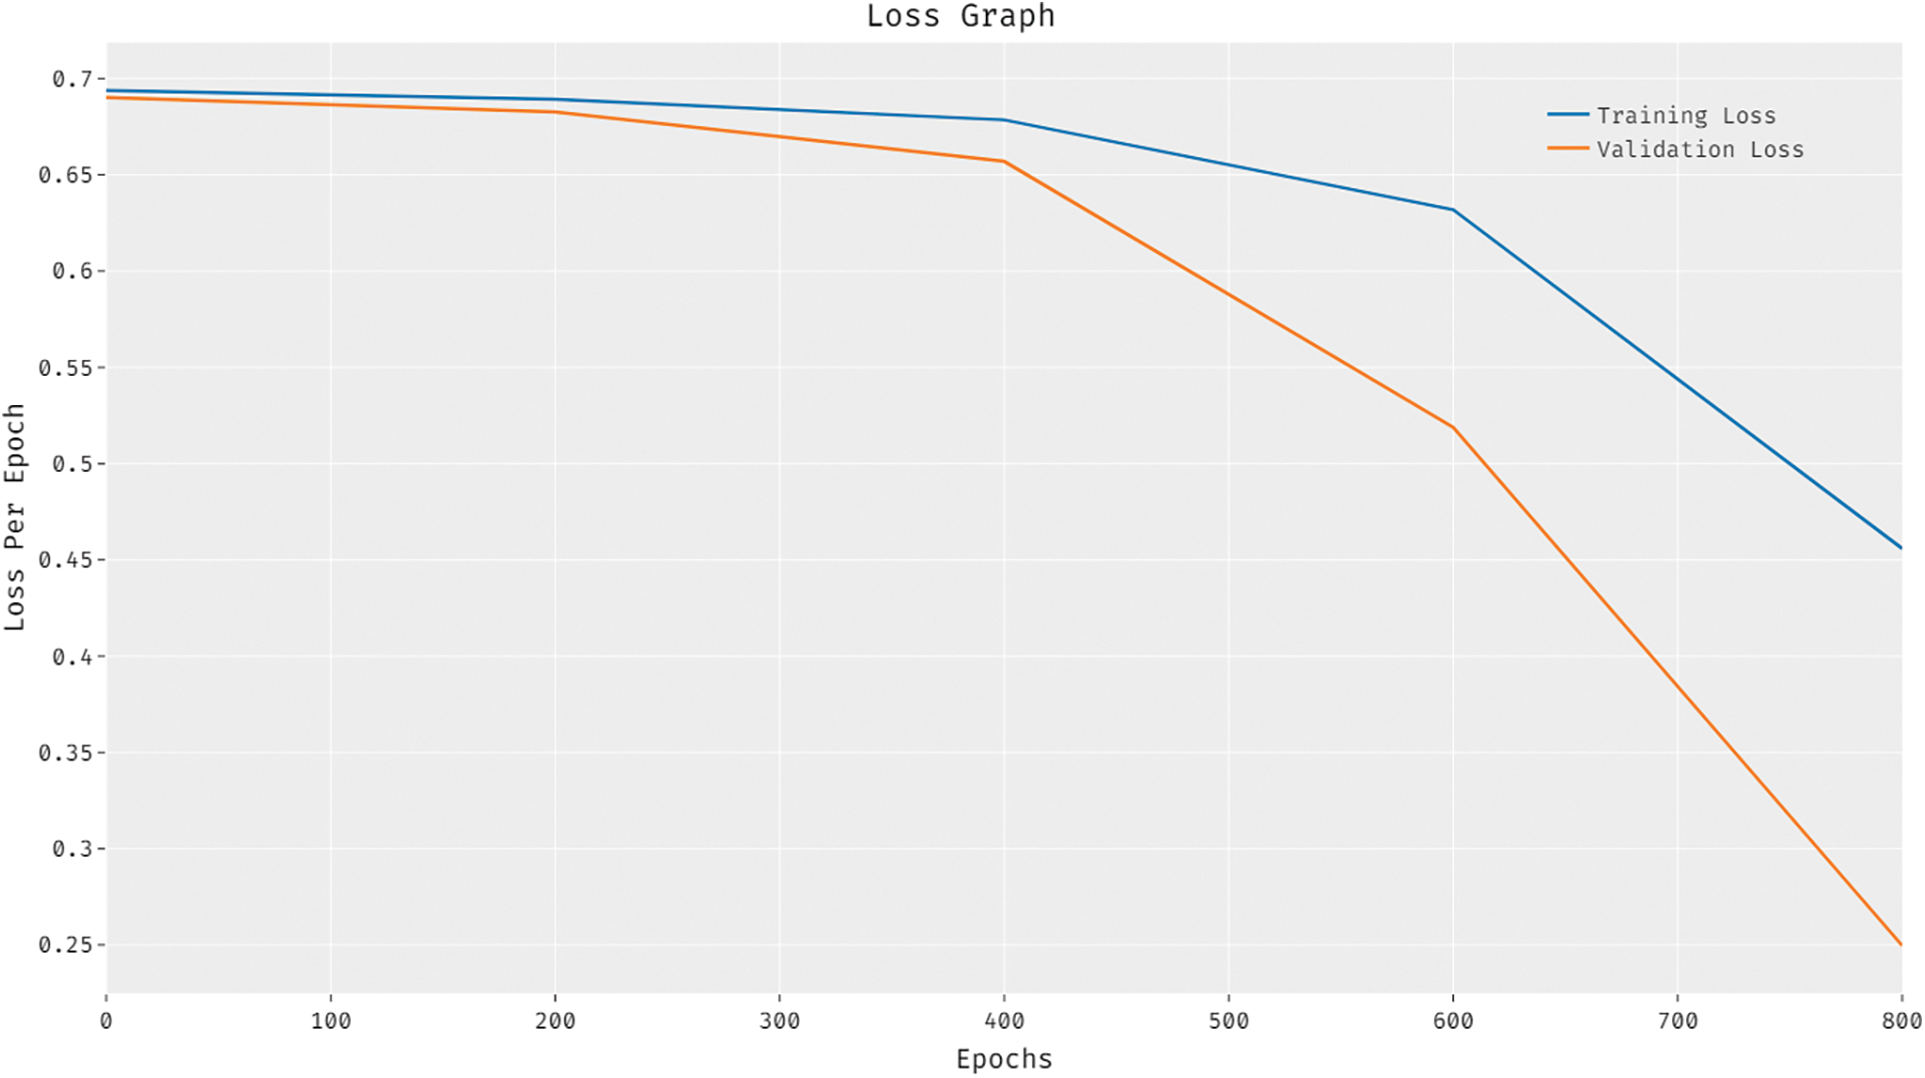
Figure 8: Loss analysis results of ODL-CDC model
Finally, a brief comparative accuracy analysis was conducted between ODL-CDC and recent approaches and the results are shown in Tab. 5 and Fig. 9. The results portray that BLSTM, GRU, LSTM, and RNN techniques obtained the least accuracy values such as 82.18%, 81.46%, 80.86%, and 81.01%. Followed by, BiGRNN technique accomplished a moderately reasonable accuracy of 91.66%. However, the proposed ODL-CDC technique resulted in maximum accuracy of 92.45%. These results validate the supremacy of the proposed ODL-CDC technique in tersm of detection and classification of cyberbullying.
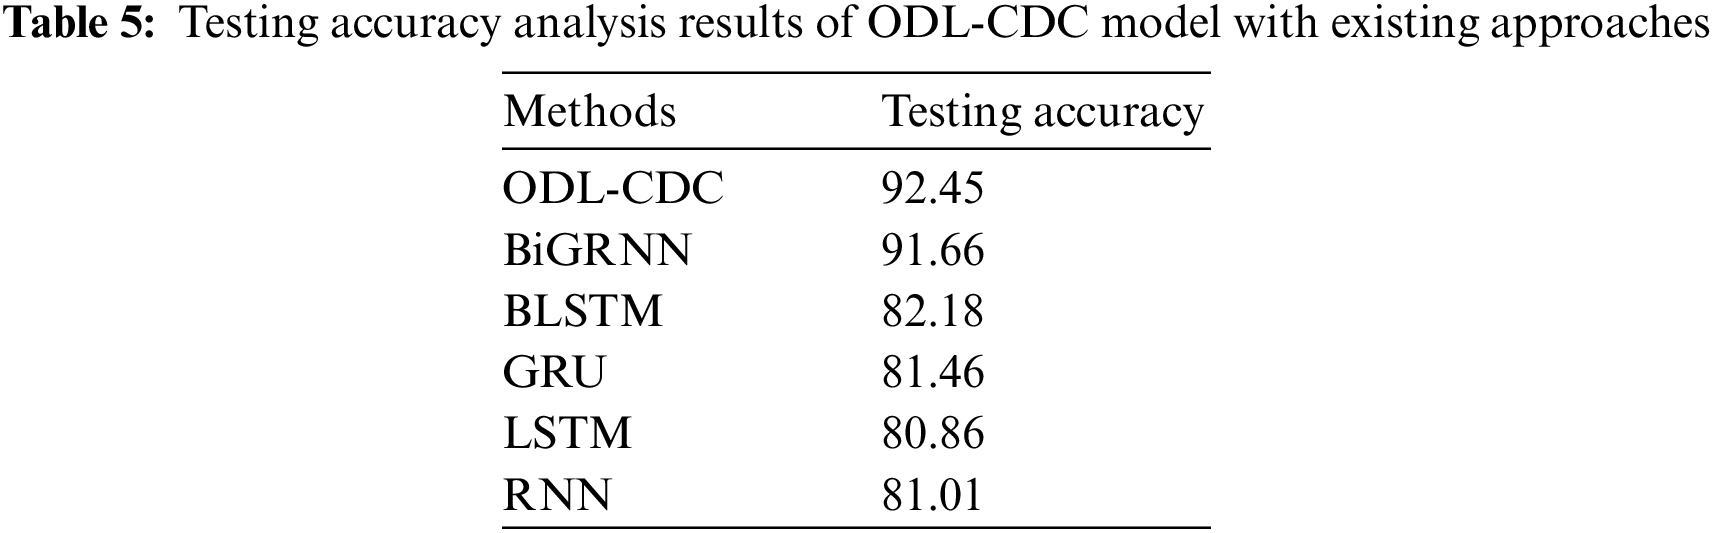
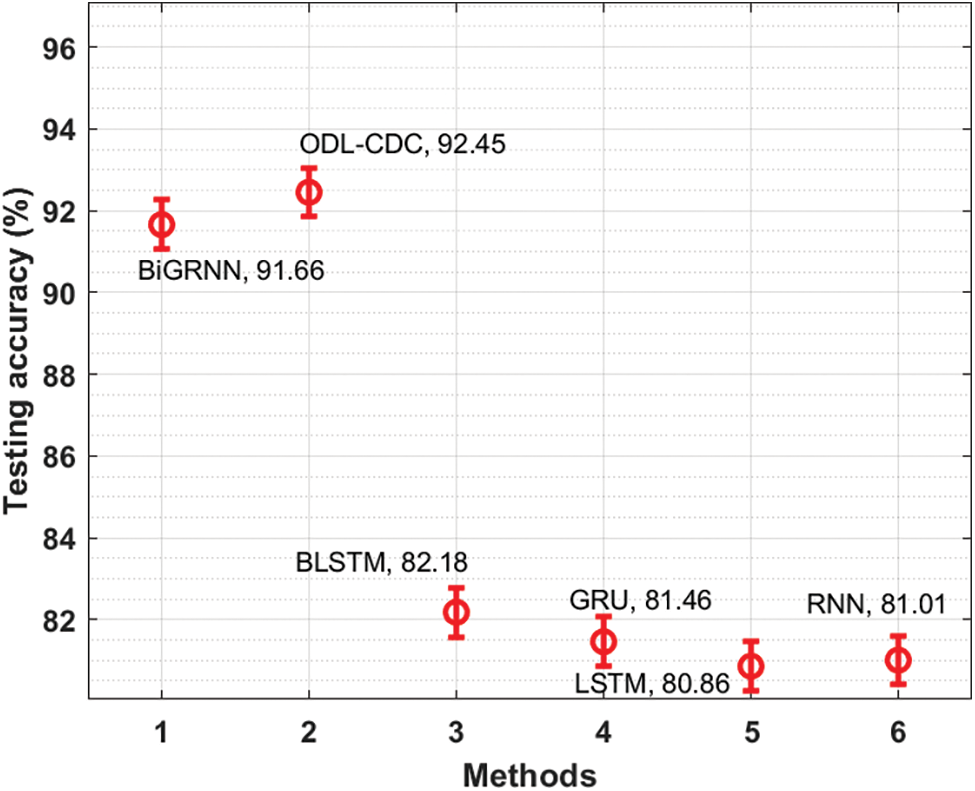
Figure 9: Testing accuracy analysis results of ODL-CDC model
In this study, a novel ODL-CDC technique is developed to identify the presence of cyberbullying in social networking data. The proposed ODL-CDC technique comprises of pre-processing, Glove-based word embedding, BiGRNN-based prediction, and SRO-based hyperparameter optimization processes. The utilization of SRO algorithm for proper hyperparameter tuning of BiGRNN parameters helps in boost the classification performance substantially. In order to ensure an improved classification performance of ODL-CDC technique, a comprehensive experimental analysis was carried out on benchmark dataset. The results were inspected under varying aspects while the proposed model achieved a maximum accuracy of 92.45%. A detailed comparative study portrayed the better performance of ODL-CDC technique over recent techniques under different measures. In future, hybrid metaheuristics and outlier detection concepts can be integrated with ODL-CDC technique to increase the detection performance.
Acknowledgement: The authors would like to acknowledge the support of Prince Sultan University for paying the Article Processing Charges (APC) of this publication.
Funding Statement: The authors extend their appreciation to the Deanship of Scientific Research at King Khalid University for funding this work under Grant Number (GPR/303/42). Princess Nourah bint Abdulrahman University Researchers Supporting Project Number (PNURSP2022R191), Princess Nourah bint Abdulrahman University, Riyadh, Saudi Arabia.
Conflicts of Interest: The authors declare that they have no conflicts of interest to report regarding the present study.
1. A. S. Medina, I. G. Sánchez and M. F. Monroy, “Applying artificial intelligence to explore sexual cyberbullying behaviour,” Heliyon, vol. 6, no. 1, pp. e03218, 2021. [Google Scholar]
2. K. Shankar, A. R. W. Sait, D. Gupta, S. K. Lakshmanaprabu, A. Khanna et al., “Automated detection and classification of fundus diabetic retinopathy images using synergic deep learning model,” Pattern Recognition Letters, vol. 133, pp. 210–216, 2020. [Google Scholar]
3. M. F. L. Vizcaíno, F. J. Nóvoa, V. Carneiro and F. Cacheda, “Early detection of cyberbullying on social media networks,” Future Generation Computer Systems, vol. 118, pp. 219–229, 2021. [Google Scholar]
4. K. Shankar, Y. Zhang, Y. Liu, L. Wu and C. H. Chen, “Hyperparameter tuning deep learning for diabetic retinopathy fundus image classification,” IEEE Access, vol. 8, pp. 118164–118173, 2020. [Google Scholar]
5. H. C. Chan and D. S. W. Wong, “Traditional school bullying and cyberbullying in Chinese societies: Prevalence and a review of the whole-school intervention approach,” Aggression and Violent Behavior, vol. 23, pp. 98–108, 2015. [Google Scholar]
6. A. Bozyigit, S. Utku and E. Nasiboglu, “Cyberbullying detection by using artificial neural network models,” in 2019 4th Int. Conf. on Computer Science and Engineering (UBMK), Samsun, Turkey, pp. 520–524, 2019. [Google Scholar]
7. R. J. S. Raj, S. J. Shobana, I. V. Pustokhina, D. A. Pustokhin, D. Gupta et al., “Optimal feature selection-based medical image classification using deep learning model in internet of medical things,” IEEE Access, vol. 8, pp. 58006–58017, 2020. [Google Scholar]
8. M. A. A. Ajlan and M. Ykhlef, “Optimized twitter cyberbullying detection based on deep learning,” in 2018 21st Saudi Computer Society National Computer Conf. (NCC), Riyadh, pp. 1–5, 2018. [Google Scholar]
9. M. A. Hashedi, L. K. Soon and H. N. Goh, “Cyberbullying detection using deep learning and word embeddings: An empirical study,” in Proc. of the 2019 2nd Int. Conf. on Computational Intelligence and Intelligent Systems, Bangkok Thailand, pp. 17–21, 2019. [Google Scholar]
10. B. Haidar, M. Chamoun and A. Serhrouchni, “Multilingual cyberbullying detection system: Detecting cyberbullying in Arabic content,” in 2017 1st Cyber Security in Networking Conf. (CSNet), Rio de Janeiro, pp. 1–8, 2017. [Google Scholar]
11. M. Ptaszynski, F. Masui, T. Nitta, S. Hatakeyama, Y. Kimura et al., “Sustainable cyberbullying detection with category-maximized relevance of harmful phrases and double-filtered automatic optimization,” International Journal of Child-Computer Interaction, vol. 8, pp. 15–30, 2016. [Google Scholar]
12. A. Bozyiğit, S. Utku and E. Nasibov, “Cyberbullying detection: Utilizing social media features,” Expert Systems with Applications, vol. 179, pp. 115001, 2021. [Google Scholar]
13. Z. L. Chia, M. Ptaszynski, F. Masui, G. Leliwa and M. Wroczynski, “Machine learning and feature engineering-based study into sarcasm and irony classification with application to cyberbullying detection,” Information Processing & Management, vol. 58, no. 4, pp. 102600, 2021. [Google Scholar]
14. J. Eronen, M. Ptaszynski, F. Masui, A. S. Pohl, G. Leliwa et al., “Improving classifier training efficiency for automatic cyberbullying detection with feature density,” Information Processing & Management, vol. 58, no. 5, pp. 102616, 2021. [Google Scholar]
15. V. Balakrishnan, S. Khan and H. R. Arabnia, “Improving cyberbullying detection using Twitter users” psychological features and machine learning,” Computers & Security, vol. 90, pp. 101710, 2020. [Google Scholar]
16. C. Iwendi, G. Srivastava, S. Khan and P. K. R. Maddikunta, “Cyberbullying detection solutions based on deep learning architectures,” Multimedia Systems, vol. 13, pp. 1–17, 2020. [Google Scholar]
17. A. K. Nandanwar and J. Choudhary, “Semantic features with contextual knowledge-based web page categorization using the GloVe model and Stacked BiLSTM,” Symmetry, vol. 13, no. 10, pp. 1772, 2021. [Google Scholar]
18. J. Yan, J. Liu, Y. Yu and H. Xu, “Water quality prediction in the luan river based on 1-DRCNN and BiGRU hybrid neural network model,” Water, vol. 13, no. 9, pp. 1273, 2021. [Google Scholar]
19. A. Shabani, B. Asgarian, S. A. Gharebaghi, M. A. Salido and A. Giret, “A new optimization algorithm based on search and rescue operations,” Mathematical Problems in Engineering, vol. 2019, pp. 1–23, 2019. [Google Scholar]
20. C. Muppala and V. Guruviah, “Detection of leaf folder and yellow stemborer moths in the paddy field using deep neural network with search and rescue optimization,” Information Processing in Agriculture, vol. 8, no. 2, pp. 350–358, 2021. [Google Scholar]
 | This work is licensed under a Creative Commons Attribution 4.0 International License, which permits unrestricted use, distribution, and reproduction in any medium, provided the original work is properly cited. |