DOI:10.32604/cmc.2022.024496
| Computers, Materials & Continua DOI:10.32604/cmc.2022.024496 | |
| Article |
Anomaly Detection for Internet of Things Cyberattacks
College of Computing and Information Technology, University of Tabuk, Tabuk, 71491, Saudi Arabia
*Corresponding Author: Manal Alanazi. Email: 412010323@stu.ut.edu.sa
Received: 19 October 2021; Accepted: 06 December 2021
Abstract: The Internet of Things (IoT) has been deployed in diverse critical sectors with the aim of improving quality of service and facilitating human lives. The IoT revolution has redefined digital services in different domains by improving efficiency, productivity, and cost-effectiveness. Many service providers have adapted IoT systems or plan to integrate them as integral parts of their systems’ operation; however, IoT security issues remain a significant challenge. To minimize the risk of cyberattacks on IoT networks, anomaly detection based on machine learning can be an effective security solution to overcome a wide range of IoT cyberattacks. Although various detection techniques have been proposed in the literature, existing detection methods address limited cyberattacks and utilize outdated datasets for evaluations. In this paper, we propose an intelligent, effective, and lightweight detection approach to detect several IoT attacks. Our proposed model includes a collaborative feature selection method that selects the best distinctive features and eliminates unnecessary features to build an effective and efficient detection model. In the detection phase, we also proposed an ensemble of learning techniques to improve classification for predicting several different types of IoT attacks. The experimental results show that our proposed method can effectively and efficiently predict several IoT attacks with a higher accuracy rate of 99.984%, a precision rate of 99.982%, a recall rate of 99.984%, and an F1-score of 99.983%.
Keywords: Anomaly detection; anomaly-based IDS; cybersecurity; feature selection; Internet of Things (IoT); intrusion detection
The Internet of Things (IoT) is now widely used and has been integrated into a wide range of critical domains, including healthcare, transportation systems, energy, and manufacturing. This technology enables multiple connected devices to communicate and exchange data with minimal or no human interaction, offering many great advantages for both service providers and end users. IoT applications have transformed buildings, vehicles, health-care systems, and even entire cities into smart objects. With increasing demand for such a technology, the number of IoT devices is expected to reach 83 billion by 2024 [1].
As heterogeneous data structures and protocols are inherent in IoT networks, security and privacy issues have emerged. Consequently, IoT networks remain susceptible to several cyberattacks that affect both service providers and end users. A well-known security issue that threatens web service availability is Distributed Denial of Service (DDoS) attacks. Such an attack benefits from a large group of compromised devices generating massive traffic toward the target, rendering the service unresponsive or unavailable to legitimate users. Even worse is when the attack employs a botnet, which enables the attacker to remotely control a large group of infected devices and launch IoT-based botnet DDoS attacks, consuming available resources and causing tremendous damage to the target in a short time [2]. Another common IoT security risk is a man-in-the-middle attack, in which an attacker intercepts the network communication between IoT nodes and masquerades as an authentic device to eavesdrop and compromise their communication [3]. Hide and seek (HNS) is another IoT threat in which a malware employs a botnet to quietly compromise thousands of devices using advanced communication techniques [4]. These devices are added to the malware network to perform malicious activities.
Cybersecurity threats continue to pose a significant challenge to IoT networks, raising the demand for securing them. Mirai botnet is a common IoT attack that causes significant damage. The IoT-based botnet Mirai exploits IoT vulnerabilities and employs millions of infected IoT devices for remote control and instruction by an attacker to behave as a group of malicious botnets to launch a destructive DDoS attack [5]. The Mirai attack renders various service providers unavailable as they encounter massive malicious traffic capable of disabling web services. In 2018, attackers targeted a Saudi petrochemical plant to remotely access the workstation by installing malicious malware to destroy data and shut down plant infrastructure [6]. Researchers found in 2019 that two million smart home devices, including security cameras, baby monitors, and smart doorbells might be used to track and eavesdrop on owners’ devices. The attack exploits vulnerabilities in Peer-to-Peer (P2P) technology, allowing access without manual configuration [7]. Another sophisticated botnet-based IoT attack is Dark Nexus, more than 40 versions of which have been developed in a short time (three months) and affect a wide range of IoT devices [8]. Regrettably, IoT devices in the health-care sector are vulnerable to and exploited by attackers. IoT devices can be deployed to monitor, manage, and alert health-care workers about patient status, including infusion pumps, insulin pumps, and thermometer sensors; attacks such as ransomware [9] and DDoS have had a major impact on smart healthcare devices [10].
An anomaly detection system has been implemented and integrated with IoT systems as an essential component for securing IoT networks from several cybersecurity threats [11–13]. The Intrusion Detection System (IDS) has grown in popularity as an effective protection for network services. IDS can be utilized in two forms, signature-based and anomaly-based [14]. Signature-based IDS (also known as rule-based IDS) detects attacks by searching for certain patterns to identify an attack’s signature and report matched existing threats [15]. However, signature-based IDS has a number of limitations [14]: it detects only known attacks and fails to identify new or previously unknown threats such as zero-day attacks. As the number of newly discovered attacks has increased, the number of signatures to match and identify attacks has also increased. Consequently, the detection system’s computation cost increases, affecting overall performance and causing a critical issue for real-time attack detection. Another issue with signature-based IDS is the need for human involvement in reviewing, analyzing, and developing signature rules for new attacks, which consumes time and effort and results in cost increases. Anomaly detection-based techniques can address all the limitations listed above and identify both known and unknown attacks [16]. In other words, the system builds normal user behavior from a sequence of incoming normal events; trained parameters identify suspicious activities and consider them anomalies if they differ from the trained normal user model. Although anomaly-based IDS approaches overcome numerous limitations in signature-based techniques, reducing false positive rates could be a challenge [17]. Many traditional solutions for anomaly-based IDS are designed for dedicated hardware or traditional networking models; less effort has been put into developing anomaly-based IDS for IoT networks [18]. The largest obstacle is that, owing to the nature of IoT environments that have limited computational resources, it is crucial to deploy an IDS on such an environment, raising the demand to design and develop a cost-effective anomaly-based IDS for IoT applications. The deployment of a lightweight IDS close to IoT devices will ensure an effective security protection to detect anomalies as near as possible to the IoT data source. Another issue is that many anomaly-based IDSs have been developed based on different techniques, such as statistical methods and rule-based models; these models often suffer from a high false positive rate [19]. Although some traditional anomaly detection methods provide promising results, these approaches rely on a single model, which may affect the prediction decision.
In this paper, an intelligent, lightweight, effective anomaly detection approach is proposed to overcome a diverse range of IoT cyberattacks. As traffic flow features play a vital role in detecting attack behavior, we propose a collaborative feature selection method for selecting the most valuable features that can effectively and efficiently detect attacks with higher accuracy and reduce false positives. Because a robust detection approach requires detecting attacks rapidly to avoid further damage to the target, our feature selection approach uses a set of algorithms to choose the best representation from a given traffic flow with the goal of removing unnecessary features and improving detection time. We also propose an ensemble learning method that employs multiple learning techniques that collaborate in detecting several different cyberattacks with improved predictive performance. Additionally, we validate our approach by applying the proposed model with the modern IoT dataset Aposemat IoT-23, whose modern attack features include sophisticated attacks such as IoT-based botnet attacks. The main contributions of this paper can be summarized as follows:
■ We propose an intelligent, lightweight, and effective anomaly detection approach to detect a diverse range of modern cyberattacks in IoT networks.
■ We develop a collaborative feature selection method that uses a group of machine learning models to produce an optimal representation set of data features to effectively and efficiently help the anomaly detection model predict IoT attacks.
■ To improve detection performance, we employ an ensemble learning model, which combines several learning techniques to produce the best prediction decision.
■ We model, validate, and analyze our anomaly detection approach with both large- and small-scale data to show the effectiveness of the proposed method, which can accurately and quickly identify abnormal data when the dataset is relatively small.
■ We analyze, evaluate, and compare our proposed method with other machine-learning techniques and existing works to demonstrate the robustness and effectiveness of our proposed method.
A number of related works for anomaly detection-based IDS in the IoT network have been proposed. Soe et al. [20] suggested a sequential attack detection approach for IoT environment that utilizes machine learning techniques. The proposed detection method is validated based on the N-BaIoT dataset which contains both normal and IoT attack traffic. The experiment result showed that the proposed method can detect attacks with higher accuracy result. Injadat et al. [21] proposed a detection mechanism by using a hybrid technique based on machine learning for attack classification. The detection approach utilized the bayesian Optimization Gaussian Process (BO-GP) model and Decision Tree (DT) model. The evaluation results showed the efficacy of the proposed mechanism; however, the result was performed on a small scale of normal data instances. Authors stated that in the future work they will use more normal data samples to ensure more normal trained behavior in such a complete dataset. Patel et al. [22] proposed a hybrid anomaly detection approach to identify anomalies in the network. Authors used entropy method to calculate traffic feature; and the entropy values were used then in a One Class Support Vector Machine (OCSVM) to classify anomalies. The evaluation results showed the efficacy of the proposed approach. However, the performance results have been performed on a synthetic dataset and limited to certain types of cyberattacks. Wang et al. [23] proposed a host-based detection method for predicting cyberattacks in IoT environment. Authors used a machine learning method named the Extreme Gradient Boosting (XGBoost) and Long Short-Term Memory (LSTM) as a deep learning model for anomalies detection. The performance metrics demonstrated that the proposed anomaly detection mechanism achieved good performance results. However, authors examined their approach on customized dataset, in which a part of the data was constructed by authors. In addition, the used dataset was limited to certain types of IoT attacks; and not including sophisticated attacks such as IoT based botnet attacks. Alrashdi et al. [24] proposed an anomaly detection approach (AD-IoT) to overcome cybersecurity attacks in a smart city. The detection method utilized a machine learning technique based on random forest algorithm. The evaluation results demonstrated that the proposed approach can effectively detect several IoT cybersecurity threats in a smart city. However, the training model was performed on UNSW-NB15 dataset which was available in 2015. Abbasi et al. [25] proposed an anomaly detection to detect several attacks in IoT networks. The proposed metho utilizes two machine learning techniques: logistic regression and Artificial Neural Network (ANN). Authors used logistic regression model for feature extraction, and ANN for attack classification. The performance results exhibit higher accuracy, precision, recall, and F1-score rate. However, authors have not provided the prediction time for the proposed method which is an essential part to evaluate the proposed model. Ullah et al. [26] proposed an anomaly-based IDS in IoT environments which utilizes a deep neural network model named a Convolutional Neural Network (CNN) and Gated Recurrent Unit (GRU) for classifications. Authors used Recursive Features Elimination (RFE) technique to select the best 48 features from 80 data features. The proposed approach obtained higher performance results compared to other used techniques in the paper. However, authors have not provided the training and prediction time for the proposed model. Sahu et al. [27] proposed a detection approach in the IoT environment using hybrid deep learning model. Authors used CNN to extract data features for traffic classification. In the detection phase, the proposed model used LSTM technique to predict and classify attack traffic. The evaluation results show that the proposed model achieved 96% as an accuracy rate in detecting IoT attacks. However, LSTM model is considered to be slow in attack detection due to sequential computation such a model utilized in several layers. Dutta et al. [28] proposed a hybrid detection model for network intrusion detection system. The proposed work utilized a Classical Auto Encoder (CAE) technique along with a Deep Neural Network (DNN) model. The CAE model employed as feature engineering to select most relevant features for traffic classification. The DNN used the produced features from CAE for anomaly detection. The performance results illustrated that the proposed model achieved good performance results comparing to other models. Xu et al. [29] proposed a hybrid deep learning mode using CNN with ConvLSTM to distinguish between authentic and fake biometrics in IoT platforms. The evaluation results of the proposed method achieved higher performance results in terms of accuracy, sensitivity, specificity, and the F1 score. A number of limitations have been identified in the literature. For example, using synthetic datasets rather than real-time IoT traffic may have an impact on detection performance. Another issue is the lack of publicly available real datasets for researchers to validate their approaches due to privacy concerns. Some proposed work provides promises performance results, but their approaches performed on outdated dataset which is limited to specific types of attacks and not including sophisticated cyberattacks such as botnet. Another issue is that some proposed techniques in the literature have a relatively high false alarm rate; they rely on a single method, which may have an impact on detection effectiveness.
Fig. 1 illustrates the proposed anomaly detection framework for IoT, which comprises three phases: the preprocessing phase, the feature selection phase, and the classification phase. In this subsection we illustrate the three phases of the anomaly detection framework.

Figure 1: The proposed anomaly detection framework for IoT
The cleaning and data standardization stages are the most significant parts of the preprocessing phase. Data cleaning is important; it guarantees that the data used to generate the models are of higher quality. As part of the data cleaning process, duplicates were removed, missing data were replaced, structural errors were fixed, and unnecessary (possibly noisy) observations were removed. After the data have been cleaned, they will be standardized by using the following expression:
where x represents the data value,
The data feature is the most critical step in identifying and detecting anomalies. To build an effective, efficient, lightweight detection model, it is necessary to choose the most distinctive features. The best selected representation of features leads to build a useful predictive model. The goals of the selected features are to reduce overfitting data, improve detection accuracy, and minimize detection time, as such a robust prediction model should rapidly detect attacks before they further damage the system. In addition, IoT devices have limited computational resources, which requires a lightweight anomaly detection technique. Therefore, we employ a collaborative machine learning model to select the most relevant features for our detection techniques. Our approach utilizes a group of machine learning models that cooperate in selecting the best distinctive features and eliminating the useless ones to predict attacks effectively and efficiently with higher accuracy and lower detection time. We utilize four machine learning techniques: Decision Trees (DT), Extra Trees (ET), Random Forest (RF), and XGBoost (XGB). Each feature selection method nominates best features independently based on their detection performance; features that achieve high scores are added to the optimal feature set, which is then utilized in the detection stage.
A DT is a tree structure that looks like a flowchart, with an internal node representing a feature (or attribute), a branch representing a decision rule, and each leaf node reflecting the outcome. In a decision tree, the root node is the uppermost node and learns to divide based on an attribute’s value. Recursive partitioning is a method of recursively splitting a tree. This flowchart-like form, which closely reflects the human thought process, aids in decision-making. DT takes less time than the other techniques to train data, and the number of records and characteristics in the provided data determine the temporal complexity of the decision trees. DT is a non-parametric or distribution-free approach that does not rely on probability distribution assumptions. The following is the core principle behind every decision tree algorithm:
■ To separate the records, choose the best attribute using Attribute Selection Measures (ASMs).
■ Break the dataset into smaller subgroups by making that attribute a decision node.
■ Start tree construction by recursively repeating this method for each child until one of the following three conditions matches:
o The tuples are all associated with the same attribute value.
o There are no more characteristics available.
o There are no more examples.
Attribute selection measures are heuristics for determining the optimum splitting criterion for partitioning data. Because they assist us in determining breakpoints for tuples on a particular node, they are also known as splitting rules. By describing the provided dataset, an ASM assigns a score to each feature (or attribute). As a dividing attribute, the best scoring attribute will be chosen (Source). Split points for branches must also be defined in the case of a continuous-valued property.
The Gini technique is used to produce split points in the decision tree algorithm [30].
The chance that a tuple in D belongs to class Ci is given by Pi. For each attribute, the Gini Index analyzes a binary split. You may compute a weighted sum of each partition’s impurity. If data D are partitioned into D1 and D2 as a result of a binary split on attribute A, the Gini index of D is [30]:
When a discrete-valued property is chosen, the subset that yields the lowest Gini index is picked as a splitting attribute. When dealing with continuous-valued characteristics, the method is to choose each pair of nearby values as a candidate splitting-point, with the point with the smallest Gini index chosen as the splitting point.
The attribute with the lowest Gini index is picked as the dividing attribute [30].
Extremely randomized trees (ET) is a type of learning method that generates a classification result by aggregating the results of many decorrelated decision trees gathered in a “forest,” except for how the decision trees in the forest are built. In the ET decision, the original training sample is used to build all the trees. The tree is then given a random sample of k features from the feature set at each test node, from which it must select the best feature to divide the data according to a mathematical criterion (typically the Gini index) [31]. This random sample of attributes is used to build several decorrelated decision trees. As the forest is constructed, the computed normalized reduction will be used in the feature decision (Gini index is utilized in constructing the forest) is computed for each feature to perform feature selection utilizing the above forest structure. The feature’s Gini importance is the name given to this value [31]. To conduct feature selection, each feature is ranked in descending order by Gini importance, and the user selects the top k features depending on their preferences [31]:
where C is the total classes and Pi is the probability that an element will be classified as belonging to a specific class.
■ Larger partitions are preferred.
■ The percentage of classes is squared.
■ If the element is perfectly categorized, the Gini index would be 0.
■ 1 – (1/# Classes) would be evenly distributed.
■ You are looking for a variable split with a low Gini index.
■ 1 – (P(class1)2 + P(class2)2 +… + P(classN)2) is the algorithm.
The RF model generates a collection of decision trees from a random sample of the training data [32]. It is made up of a collection of DT created from a randomly chosen training set, which then collects votes from numerous decision trees to arrive at the final prediction. To assess feature importance, the decrease in node impurity is weighted by the chance of achieving that node. The node probability is calculated by dividing the number of samples that arrive at the node by the total number of samples. The greater the score, the more important the trait [32]. For estimating the significance of each node in a decision tree utilizing Gini importance [33], under the assumption that there are only two child nodes (binary tree),
■ nij node j’s importance
■ wj number of samples reaching node j, weighted
■ Cj node j’s impurity value
■ left(j) child node from node j’s left split
■ right(j) child node from node j’s right split
The XGBoost provides a split-finding method for optimizing trees, as well as built-in regularization to prevent overfitting. In general, XGBoost is a faster and more accurate form of gradient boosting. The basic assumption of the XGBoost technique is to train an ensemble (group) tree model progressively with a penalty parameter.
3.2.5 Proposed Feature Selection Method
Given a classification task and a set of training examples (
where
■ N number of classifiers
■ Ac accuracy value
■ Pr denote for precision value
■ Fs indicate the F1-score
■ C (i)set of utilized classifiers
Applying the proposed criterion, we guaranty that the best features will be selected, and the dimension of the input data will be reduced; indeed, the proposed criterion is used as dimension reduction technique. Following that, the selected features will be entered to the ensemble learning model to determine whether a given flow of traffic is normal or indicates an attack.
Here is the complete algorithm:
Input:
a dataset
C is the set of the employed classifier, C
Output:
A set of features
For each of classifier C, apply its learning algorithm to estimate the parameter
Choose the best important features
Applying Eq. (7) for the given set of features will result in the addition of chosen features to the output pool Fcto help the detection model effectively predict IoT traffic.
In the classification phase, we apply ensemble techniques to determine whether a given flow of traffic is normal or indicates an attack. Ensemble learning involves a collection of models cooperating to solve a shared issue. Rather than relying on a single model for the optimal decision, ensemble learning utilizes multiple diverse techniques to compensate for each model’s particular flaws. The resultant collection should be less prone to errors than a single model. Compared with a single decision tree classifier, ensemble techniques aggregate many decision tree classifiers to provide higher prediction performance. The ensemble model’s basic premise is that a number of weak learners join forces to produce a strong learner, enhancing the model’s performance results. In general, decision trees are employed with ensemble learning because they are a dependable technique for achieving regularization. As the number of levels in a decision tree grows, the model becomes more susceptible to high variance and may overfit (resulting in high error on test data). To perform regularization and avoid overfitting, we employ ensemble methods with broad principles (rather than very specialized rules). The aggregate of several versions of a projected model is known as bagging (a method of parallel ensemble), also known as bootstrap aggregating. Each model is trained separately before it is merged through an averaging procedure. The goal of bagging is to achieve less variance than that of any particular model. Parallel techniques suit the different considered learners separately from one another, allowing them to be trained at the same time. Bagging seeks to create an ensemble method which is more resilient than the individual models it comprises. Bagging is a basic concept: we wish to fit multiple separate models, then “average” their predictions to get a model with reduced variance. In practice, however, we cannot fit entirely independent models, which would require far too much data. To fit models which are nearly independent, we rely on the good “approximate features” of bootstrap collections (representatively and independence).
To begin, we construct several bootstrap samples, each of which acts as a separate (nearly) independent dataset derived from the real distribution. Then, for each sample, we may train a weak learner and aggregate the samples, then “average” their outputs and produce an ensemble model with less variance than its elements. The learned base models are quasi-independent and identically distributed (i.i.d.), as are the bootstrap samples. Then, “averaging” weak learners’ outputs does not improve the anticipated response, however, it does minimize the variance (averaging i.i.d. random variables preserves predictable value but reduces variance).
Assume that we have L bootstrap samples of size B (approximations of L independent datasets).
We can nearly fit L as a self-contained weak learner:
Then, we can combine them in an averaging procedure to obtain an ensemble model with less variance. We may, for example, define our strong model in such a way that
There are some options for aggregating the numerous models that were fitted in simultaneously. The classification method was used in this study. In a classification scenario, each model’s output class may be viewed as a vote, with the ensemble model returning the class with the most votes to produce the prediction result. Fig. 2 depicts the architecture of the proposed detection model.

Figure 2: The architecture of the proposed ensemble learning model
4 Experimental Results and Discussion
This section aims to evaluate our proposed approach by performing the experimental results on a real-time dataset as a benchmark. We validated our anomaly detection model with both large- and small-scale data and obtained the performance results. As an important part in evaluating the proposed model, we have obtained the performance results by measuring different important metrics as follows:
Accuracy is computed by dividing the number of accurately estimated values by the total number of all values. The accuracy metric equation is shown in Eq. (11).
Precision, also known as Positive Predictive Value (PPV), determines how accurate the model is at recognizing events as positive. The precision metric equation is provided below.
Recall, also known as sensitivity, measures the number of corrected positive instances divided by the number of all positive instances. The recall equation is shown below:
Negative Predictive Value (NPV) means that when the test is negative, there is a good chance of no abnormality being present. The NPV metric equation is shown in Eq. (14).
The Matthews Correlation Coefficient (MCC) is a metric for assessing the quality of classification by taking into account TP, FN, TN, and FP. The MCC metric appears below.
The F1-score measures a classifier performance. It is a function calculated from precision and recall of the tested model. The equation for the F1-score metric is shown in Eq. (16).
Choosing a suitable dataset containing real-time IoT traffic from various devices is an important step in validating our anomaly detection approach. Furthermore, a wide range of IoT attacks, both rudimentary and advanced attacks, should be considered when validating such a detection approach. We use the Aposemat IoT-23 dataset, a publicly available dataset published in January 2020 [34]. The dataset includes 23 various IoT network traffic scenarios, of which three captured scenarios belong to benign IoT devices and twenty malware captured scenarios have been executed in IoT devices. The dataset provides massive real IoT traffic that is labeled either benign or malicious. The 23 malicious scenarios were each executed with a different type of malware, including more advanced and sophisticated attacks. Tab. 1 provides additional information about the Aposemat IoT-23 dataset.

4.2 Experiment Result Analysis
Two experiments have been performed on the IoT-23 dataset. The first experiment was carried out on a total of 266,910 data, which were divided into 75% for training and 25% for testing. In the second experiment, the data were split into 10% for training and 90% for validation to determine whether the proposed detection method can accurately and quickly identify abnormal data when the data is relatively small. As assessment measures, accuracy, precision, recall, NPV, MCC, and F1-score [35,36] are used to evaluate and analyze the effectiveness of the proposed method. Additionally, the training and testing time has been evaluated.
Different models have been employed as baseline algorithms to evaluate the performance results against our proposed method. These include bagging, ET, gradient boosting, and RF, all of which are frequently utilized in anomaly detection techniques. As Tab. 2 shows, the classification results indicate that our proposed method achieved good performance results with an accuracy rate of 99.984%, while bagging and RF models achieved similar accuracy results with 99.957% and 99.955% respectively. The gradient boosting model obtained an accuracy rate of 99.919%, considered the lower performance results of all models used. The proposed method also outperforms other models in terms of precision and recall, with 99.982% and 99.984%, respectively, whereas ET and RF obtained similar results for precision with 99.950% and 99.956%, respectively, and for recall measure ET and RF obtained 99.949% and 99.955%, respectively. The gradient boosting model obtained lower performance results of all models in terms of precision and recall measures with 99.920% and 99.919%, respectively. In the case of NPV, the proposed method obtained 99.98%, whereas bagging, ET, and RF achieved similar performance results with 99.95%, 99.94%, and 99.93, respectively. We have also evaluated the proposed method in terms of MCC, which is used to measure the quality of the classification. The proposed method obtained an MCC rate of 99.89%, considering the higher MCC value of all models used. The ET and RF had similar performance results of 99.79% and 99.74%, respectively. However, the gradient boosting model obtained an MCC rate of 99.48%, considered to be the lowest MCC performance of all models utilized. In terms of training and testing time, the proposed method performed well and obtained 3.9 s for training and 0.2 s for prediction, while ET and RF obtained 23.6 and 21.0 s respectively for training and 1.4, 1.1 s respectively for testing. The gradient boosting performed worst in terms of training time (591.54 s) and prediction time (2.49 s). Fig. 3 shows the graphical representation of the proposed method with the baseline algorithms in terms of accuracy and precision rates, recall, and F1-score.


Figure 3: Comparison of the proposed method with other models in the first experiment
The proposed method was also used to evaluate the performance of attack detection in for multi-class classification, and was compared to other machine learning models such as bagging, ET, gradient boosting, and RF. As Tab. 3 shows, the proposed method can predict different types of attacks with a higher performance results; our proposed method obtained a detection rate of 100% in many types of attacks, such as C&C-FD, C&C-HB, C&C-HB-Att, C&C-HB-FD, C&C-HPS, C&C-Torri, Okiru, and HorizPortSc-Att, whereas the lower detection rate of 83.33% was obtained in the FD attack. The RF and ET models achieved a similar detection rate in most cases; however, the RF model had a significantly lower detection rate than the ET model of 50.00% in the event of a HorizPortSc-Att attack. The bagging model performed well in some types of attacks, such as C&C-FD, C&C-HB, C&C-HB-Att, and C&C-HB-FD; however, it obtained lower detection rates in the case of C&C Torii and HorizPortSc-Att attacks, with 80.00% and 50.00%, respectively. The gradient boosting model obtained a lower detection rate when compared with other models; such a model completely failed to detect C&C-HB-FD and FD attacks. Fig. 4 shows the graphical representation of proposed method for multi-class classification in the first experiment.


Figure 4: Graphical representation of different attack detection in the first experiment
In the second experiment, different models must learn from a small training data set and examine their abilities in predicting attacks accurately. As Tab. 4 shows, our proposed method outperformed other employed models with an accuracy rate of 99.918%. While the bagging, ET, and RF models achieved similar accuracy rates (99.861%, 99.856%, and 99.887%, respectively), performance results were lower for gradient boosting than for all other models used. As Tab. 4 shows, the proposed method also outperforms other models in terms of precision and recall, with 99.982% and 99.984%, respectively, whereas ET and RF obtained similar results for precision with 99.917% and 99.918%, respectively, and for recall measure ET and RF obtained 99.949% and 99.955%, respectively. The gradient boosting model obtained lower performance results of all models in terms of precision and recall measures with 99.591% and 99.610%, respectively. In the case of NPV, the proposed method obtained 99.91%, whereas bagging, ET, and RF achieved similar performance results with 99.86%, 99.86%, and 99.88, respectively. The proposed method obtained an MCC rate of 99.65%, considering the higher MCC value of all models used. The bagging and RF had similar performance results of 99.4% and 99.43%, respectively. However, the gradient boosting model obtained an MCC rate of 99.14%, considered to be the lowest MCC performance of all models utilized. Fig. 5 shows the graphical representation of the proposed method with the baseline algorithms in terms of accuracy and precision rates, recall, and F1-score.

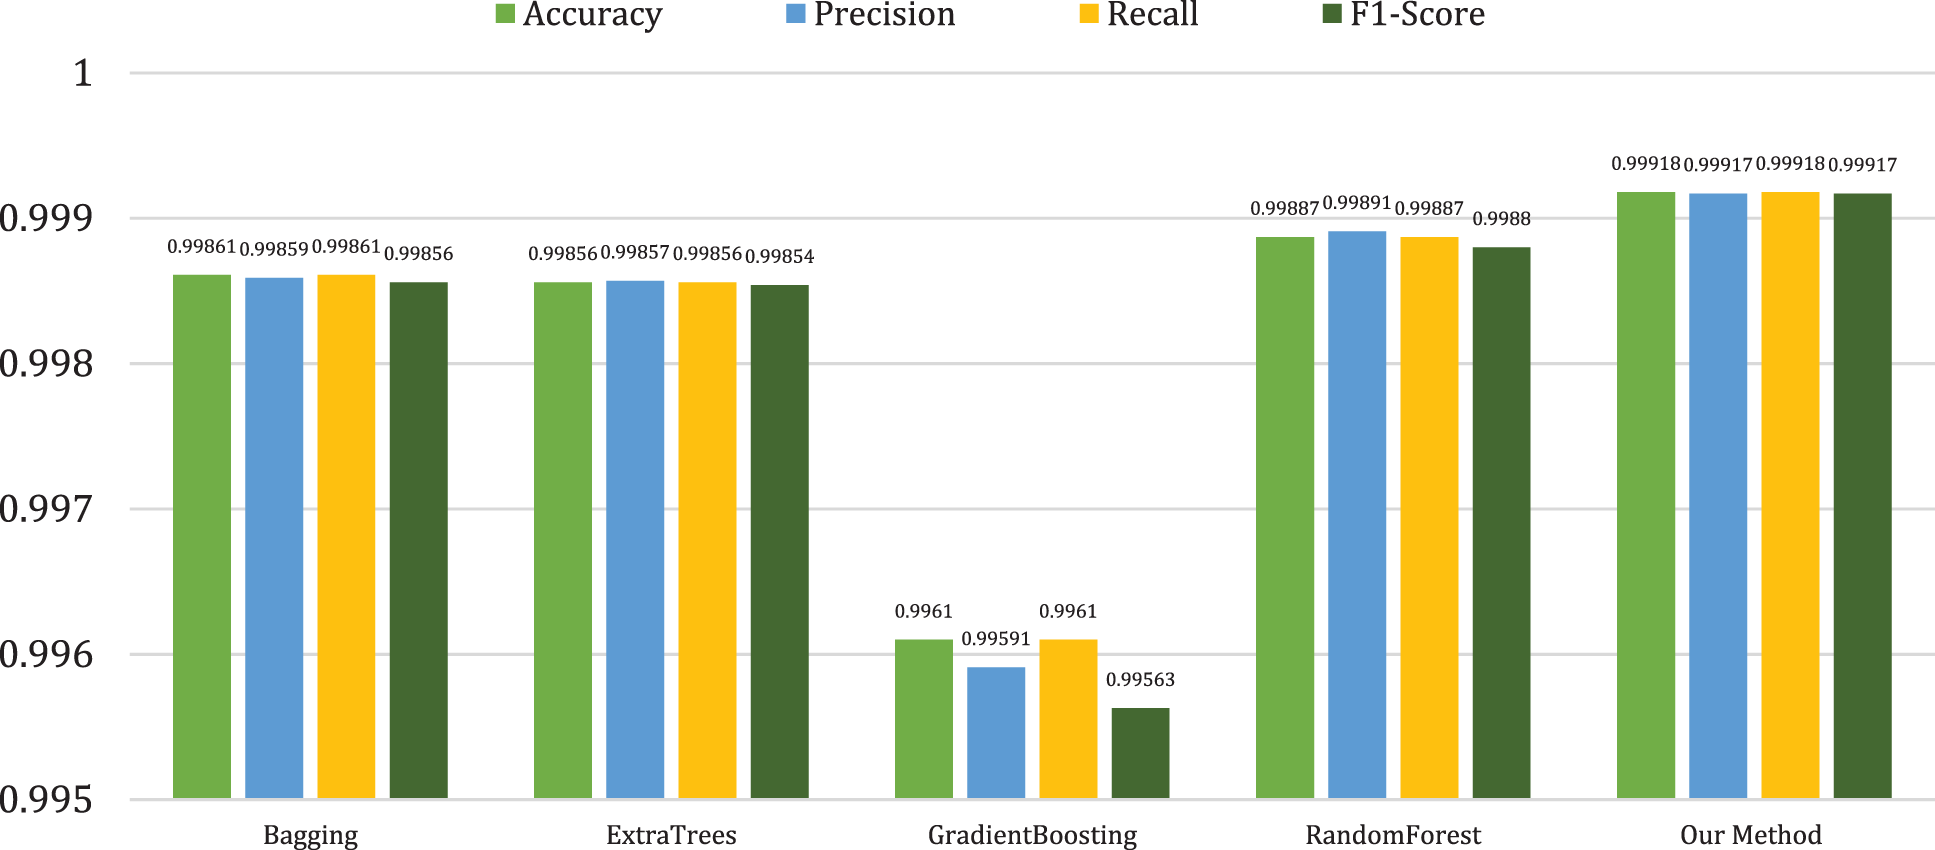
Figure 5: Comparison of the proposed method with other models in the second experiment
The detection performance of different types of attacks for multi-class classification has been evaluated in the second experiment, and was compared to other baseline algorithms such as bagging, ET, gradient boosting, and RF. As Tab. 5 shows, the proposed method can predict different class of attacks with higher performance results, our proposed method obtained a detection rate of 100% in some types of attacks, such as C&C-FD, FD, and HorizPortSc-Att, whereas the lower detection rates of 62.500% and 45.455% were obtained in the case of C&C-HB-FD and C&C-Torii attacks. The RF and ET models achieved a similar detection rate in most cases; however, the RF model had a significantly lower detection rate of 33.333% in the case of the FD attack. The bagging model performed well in some types of attacks, such as C&C, C&C-HB, C&C-HB-Att, DDoS, and C&C-HB-FD; however, it failed to detect FD and HorizPortSc-Att attacks. The gradient boosting model performed well in some types of attacks; however, it obtained a lower detection rate in other types of attacks, such as C&C-HB-FD, FD, and HorizPortSc-Att (42.857%, 44.00%, and 20.00%, respectively). Fig. 6 shows the graphical representation of proposed method for multi-class classification in the second experiment.

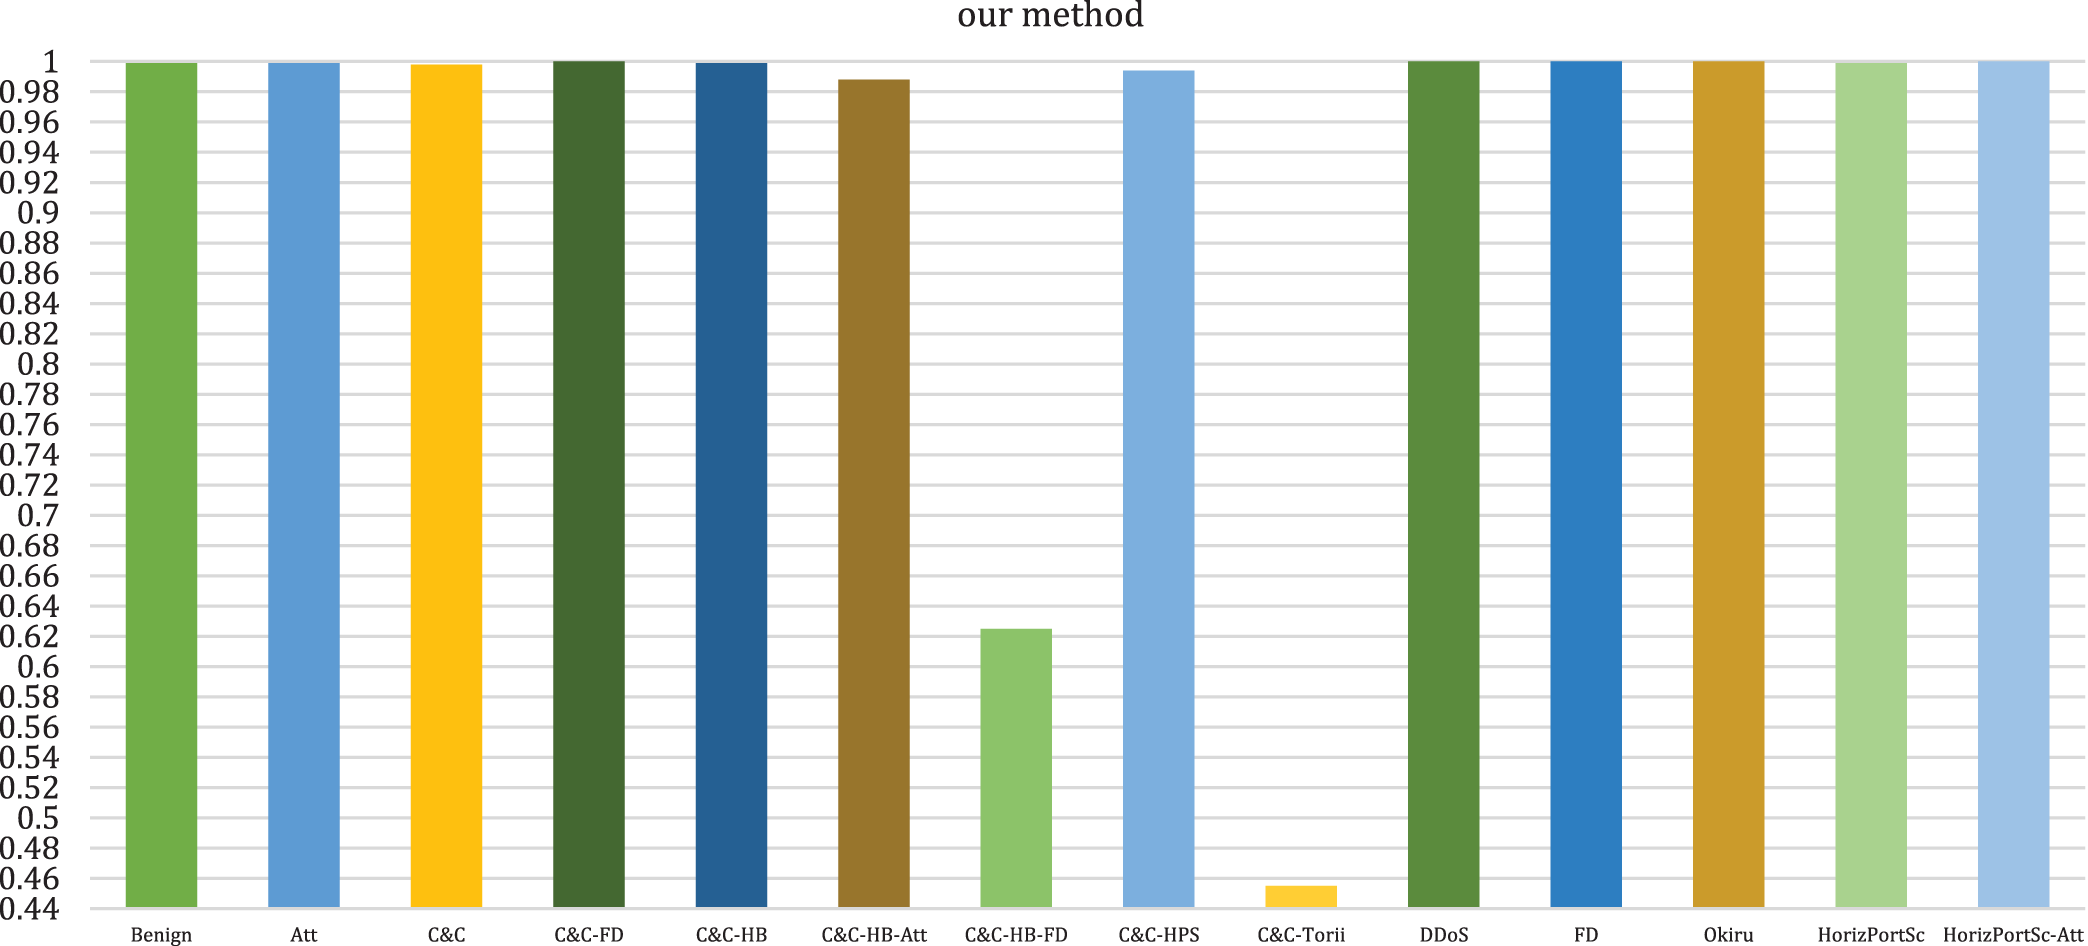
Figure 6: Graphical representation of different attack detection in the second experiment
We have compared the proposed method’s performance with that obtained in previous studies (see Tab. 6). Compared with Xu et al. [29], the proposed anomaly detection method improves the accuracy rate by 8.69% while significantly enhancing the precision and recall rate by 7.9% and 9.34%, respectively. The performance results of our anomaly detection method also outperform a recent proposed work by Dutta et al. [28], who used the CNN technique as a single machine learning for feature extraction and the LSTM method as the classifier model. The accuracy rate improves by 3.98%, while precision and recall were improved by 4.49% and 3.92%, respectively. We also evaluated our proposed method by comparison with other techniques that used a hybrid deep learning model, proposed by Sahu et al. [27]; the accuracy rate of our proposed anomaly detection improved by 0.02%, while precision and recall were improved by 0.08% and 9.24%, respectively. Our anomaly detection method employs a collaborative feature selection method for selecting the most valuable features, reducing the dimension of the input data, and improving the detection performance by using multiple classifiers to provide higher prediction performance with a reduced false alarm rate. Tab. 6 illustrates the classification results of the proposed method with existing methods.

In this paper, we propose an intelligent, effective, lightweight anomaly detection method to detect several IoT attacks. For our proposed model, we have developed a collaborative feature selection method that selects the best distinctive features and eliminates unnecessary features. For the detection stage, we have also proposed an ensemble learning technique to successfully predict several different types of IoT attacks. The experimental results show that our proposed model has achieved a higher accuracy rate of 99.984%, a precision rate of 99.982%, a recall rate of 99.984%, and an F1-score rate of 99.983%, compared with other existing models developed in recent studies. In future work, we will explore the effectiveness of our method with more data sets. In addition, we will investigate more learning techniques to improve our proposed method. We will perform more experimental evaluations to enhance our methods of detecting different types of attacks.
Acknowledgement: The authors would like to thank Dr. Okba Taouali and Dr. Mohammed Mustafa for their insightful comments om how we could improve the quality of paper. We greatly appreciate the time and effort they have dedicated to improving the manuscript.
Funding Statement: The authors received no specific funding for this study.
Conflicts of Interest: The authors declare that they have no conflicts of interest to report regarding the present study.
1. I. Ullah and Q. H. Mahmoud, “Design and development of a deep learning-based model for anomaly detection in IoT networks,” IEEE Access, vol. 9, pp. 103906–103926, 2021. [Google Scholar]
2. A. Aljuhani, “Machine learning approaches for combating distributed denial of service attacks in modern networking environments,” IEEE Access, vol. 9, pp. 42236–42264, 2021. [Google Scholar]
3. Z. Bakhshi, A. Balador and J. Mustafa, “Industrial IoT security threats and concerns by considering cisco and microsoft IoT reference models,” in 2018 IEEE Wireless Communications and Networking Conf. Workshops (WCNCW), Barcelona, Spain, pp. 173–178, 2018. [Google Scholar]
4. S. Haria, “The growth of the hide and seek botnet,” Network Security, vol. 2019, no. 3, pp. 14–17, 2019. [Google Scholar]
5. L. Vu, V. L. Cao, Q. U. Nguyen, D. N. Nguyen, D. T. Hoang et al., “Learning latent representation for IoT anomaly detection,” IEEE Transactions on Cybernetics, pp. 1–14, 2020. [Google Scholar]
6. M. Filho and C. Leonardo, “Modelling cybersecurity predictive analytical tools for IoT-enabled smart grids and smart cities,” 2020. [Online]. Available: https://bit.ly/3l5scCn. [Google Scholar]
7. L. Donnell, “2 million IoT devices vulnerable to complete takeover,” Threat Post, 2019. [Online]. Available: https://threatpost.com/iot-devices-vulnerable-takeover/144167/. [Google Scholar]
8. The Hacker News, “Dark Nexus: A new emerging IoT botnet malware spotted in the wild,” 2020. [Online]. Available: https://thehackernews.com/2020/04/darnexus-iot-ddos-botnet.html. [Google Scholar]
9. M. Humayun, N. Jhanjhi, A. Alsayat and V. Ponnusamy, “Internet of things and ransomware: Evolution mitigation and prevention,” Egyptian Informatics Journal, vol. 22, no. 1, pp. 105–117, 2020. [Google Scholar]
10. R. Vishwakarma and A. K. Jain, “A survey of DDoS attacking techniques and defence mechanisms in the IoT network,” Telecommunication System, vol. 73, no. 1, pp. 3–25, 2019. [Google Scholar]
11. X. -X. Lin, P. Lin and E. -H. Yeh, “Anomaly detection/prediction for the Internet of Things: State of the art and the future,” IEEE Network, vol. 35, no. 1, pp. 212–218, 2021. [Google Scholar]
12. M. Ahmad, Q. Riaz, M. Zeeshan, H. Tahir, S. A. Haider et al., “Intrusion detection in internet of things using supervised machine learning based on application and transport layer features using UNSW-NB15 data-set,” EURASIP Journal on Wireless Communications and Networking, vol. 2021, no. 1, pp. 1–23, 2021. [Google Scholar]
13. A. Huč and D. Trček, “Anomaly detection in IoT networks: From architectures to machine learning transparency,” IEEE Access, vol. 9, pp. 60607–60616, 2021. [Google Scholar]
14. M. Eskandari, Z. H. Janjua, M. Vecchio and F. Antonelli, “Passban IDS: An intelligent anomaly-based intrusion detection system for IoT edge devices,” IEEE Internet of Things Journal, vol. 7, no. 8, pp. 6882–6897, 2020. [Google Scholar]
15. W. Li, S. Tug, W. Meng and Y. Wang, “Designing collaborative blockchained signature-based intrusion detection in IoT environments,” Future Generation Computer Systems, vol. 96, pp. 481–489, 2019. [Google Scholar]
16. S. A. Althubiti, E. M. Jones and K. Roy, “LSTM for anomaly-based network intrusion detection,” in 2018 28th Int. Telecommunication Networks and Applications Conf. (ITNAC), Sydney, Australia, pp. 1–3, 2018. [Google Scholar]
17. R. Samrin and D. Vasumathi, “Review on anomaly based network intrusion detection system,” in 2017 Int. Conf. on Electrical, Electronics, Communication, Computer, and Optimization Techniques (ICEECCOT), Mysuru, India, pp. 141–147, 2017. [Google Scholar]
18. A. Verma and V. Ranga, “Machine learning based intrusion detection systems for IoT applications,” Wireless Personal Communications, vol. 111, no. 4, pp. 2287–2310, 2020. [Google Scholar]
19. A. -H. Muna, N. Moustafa and E. Sitnikova, “Identification of malicious activities in industrial Internet of Things based on deep learning models,’’ Journal of Information Security and Applications, vol. 41, pp. 1–11, 2018. [Google Scholar]
20. Y. N. Soe, Y. Feng, P. I. Santosa, R. Hartanto and K. Sakurai, “Machine learning-based IoT-botnet attack detection with Sequential architecture,” Sensors, vol. 20, no. 16, pp. 4372, 2020. [Google Scholar]
21. M. Injadat, A. Moubayed and A. Shami, “Detecting botnet attacks in IoT environments: An optimized machine learning approach,” in 2020 32nd Int. Conf. on Microelectronics (ICM), Aqaba, Jordan, pp. 1–4, 2020. [Google Scholar]
22. D. Patel, K. Srinivasan, C. -Y. Chang, T. Gupta and A. Kataria, “Network anomaly detection inside consumer networks—A hybrid approach,” Electronics, vol. 9, no. 6, pp. 923, 2020. [Google Scholar]
23. X. Wang and X. Lu, “A host-based anomaly detection framework using XGBoost and LSTM for IoT devices,” Security and Communication Networks, vol. 2020, pp. 1–13, 2020. [Google Scholar]
24. I. Alrashdi, A. Alqazzaz, E. Aloufi, R. Alharthi, M. Zohdy et al., “Ad-iot: Anomaly detection of IoT cyberattacks in smart city using machine learning,” in 2019 IEEE 9th Annual Computing and Communication Workshop and Conf. (CCWC), Las Vegas, USA, pp. 0305–0310, 2019. [Google Scholar]
25. F. Abbasi, M. Naderan and S. E. Alavi, “Anomaly detection in Internet of Things using feature selection and classification based on logistic regression and artificial neural network on N-baIoT dataset,” in 2021 5th Int. Conf. on Internet of Things and Applications (IoT), Isfahan, Iran, pp. 1–7, 2021. [Google Scholar]
26. I. Ullah, A. Ullah and M. Sajjad, “Towards a hybrid deep learning model for anomalous activities detection in internet of things networks,” IoT, vol. 2, no. 3, pp. 428–448, 2021. [Google Scholar]
27. A. K. Sahu, S. Sharma, M. Tanveer and R. Raja, “Internet of Things attack detection using hybrid deep learning model,” Computer Communications, vol. 176, pp. 146–154, 2021. [Google Scholar]
28. V. Dutta, M. Choras, R. Kozik and M. Pawlicki, “Hybrid model for improving the classification effectiveness on network intrusion detection system,” in Conf. on Complex, Intelligent, and Software Intensive Systems, Sydney, NSW, Australia, pp. 405–414, 2020. [Google Scholar]
29. M. Xu, J. Peng, B. Gupta, J. Kang, Z. Xiong et al., “Multi-agent federated reinforcement learning for secure incentive mechanism in intelligent cyber-physical systems,” IEEE Internet of Things Journal, vol. 14, no. 8, pp. 1–14, 2021. [Google Scholar]
30. A. Navaani, “Decision tree classification in python,” Datacamp, 2018. [Online]. Available: https://cutt.ly/iECszRP. [Google Scholar]
31. P. Geurts, D. Ernst and L. Wehenkel, “Extremely randomized trees,” Machine Learning, vol. 63, no. 1, pp. 3–42, 2006. [Google Scholar]
32. L. Breiman, “Random forests,” Machine Learning, vol. 45, pp. 5–32, 2001. [Google Scholar]
33. A. V. Lebedev, E. Westman, G. J. P. Van Westen, M. G. Kramberger, A. Lundervold et al., “Random forest ensembles for detection and prediction of Alzheimer’s disease with a good between-cohort robustness,” NeuroImage Clinical, vol. 6, pp. 115–125, 2014. [Google Scholar]
34. M. J. E. Agustin and S. Garcia, “Stratosphere laboratory aposemat iot-23,” 2020. [Online]. Available: https://www.stratosphereips.org/datasets-iot23. [Google Scholar]
35. X. Bai, T. Zhang, C. Wang, A. Abd El-latif and X. Niu, “A fully automatic player detection method based on one-class SVM,” IEICE Transactions on Information and Systems, vol. E96.D, no. 2, pp. 387–391, 2013. [Google Scholar]
36. A. Sedik, L. Tawalbeh, M. Hammad, A. Abd El-latif, G. El-banby et al., “Deep learning modalities for biometric alteration detection in 5g networks-based secure smart cities,” IEEE Access, vol. 9, pp. 94780–94788, 2021. [Google Scholar]
 | This work is licensed under a Creative Commons Attribution 4.0 International License, which permits unrestricted use, distribution, and reproduction in any medium, provided the original work is properly cited. |