DOI:10.32604/cmc.2022.024589
| Computers, Materials & Continua DOI:10.32604/cmc.2022.024589 | |
| Article |
A Lightweight CNN Based on Transfer Learning for COVID-19 Diagnosis
1Wuxi Research Institute, Nanjing University of Information Science & Technology, Wuxi, 214100, China
2Engineering Research Center of Digital Forensics, Ministry of Education, Jiangsu Engineering Center of Network Monitoring, School of Computer and Software, Nanjing University of Information Science & Technology, Nanjing, 210044, China
3Jiangsu Collaborative Innovation Center of Atmospheric Environment and Equipment Technology (CICAEET), Nanjing University of Information Science & Technology, Nanjing, 210044, China
4School of Automation, Nanjing University of Information Science & Technology, Nanjing 210044 China
5IT Fundamentals and Education Technologies Applications, University of Information Technology and Management in Rzeszow, Rzeszow Voivodeship, 100031, Poland
*Corresponding Author: Xiaorui Zhang. Email: zxr365@126.com
Received: 23 October 2021; Accepted: 04 January 2022
Abstract: The key to preventing the COVID-19 is to diagnose patients quickly and accurately. Studies have shown that using Convolutional Neural Networks (CNN) to analyze chest Computed Tomography (CT) images is helpful for timely COVID-19 diagnosis. However, personal privacy issues, public chest CT data sets are relatively few, which has limited CNN's application to COVID-19 diagnosis. Also, many CNNs have complex structures and massive parameters. Even if equipped with the dedicated Graphics Processing Unit (GPU) for acceleration, it still takes a long time, which is not conductive to widespread application. To solve above problems, this paper proposes a lightweight CNN classification model based on transfer learning. Use the lightweight CNN MobileNetV2 as the backbone of the model to solve the shortage of hardware resources and computing power. In order to alleviate the problem of model overfitting caused by insufficient data set, transfer learning is used to train the model. The study first exploits the weight parameters trained on the ImageNet database to initialize the MobileNetV2 network, and then retrain the model based on the CT image data set provided by Kaggle. Experimental results on a computer equipped only with the Central Processing Unit (CPU) show that it consumes only 1.06 s on average to diagnose a chest CT image. Compared to other lightweight models, the proposed model has a higher classification accuracy and reliability while having a lightweight architecture and few parameters, which can be easily applied to computers without GPU acceleration. Code:github.com/ZhouJie-520/paper-codes.
Keywords: Convolutional neural networks; chest computed tomography image; COVID-19; transfer learning; mobileNetv2
COVID-19 is an acute respiratory infection syndrome with high infectiousness, which negatively impacts the development of countries around the world [1]. For infectious diseases, the best means of prevention is timely diagnosis and isolation of patients. Currently, reverse transcription polymerase chain reaction (RT-PCR) testing, considered as the standard method to detect COVID-19. But, it has many disadvantages including time consuming, high false negative rate and low sensitivity. These disadvantages hind the diagnosis and treatment of COVID-19 patients to some extent [2–6]. Therefore, there is the need to develop more efficient diagnostic method.
Medical imaging is an effective tool for screening, diagnosis, treatment guidance, and evaluation of clinical diseases. The lung imaging characteristics of patients infected by COVID-19 present mainly ground glass opacities, lung consolidation, bilateral patchy shadowing, pulmonary fibrosis, multiple lesions, and crazy-paving pattern [7–9]. These characteristics serve as the main basis for COVID-19 diagnosis and treatment. Chest Computed Tomography (CT) and X-ray scans are the most widely used medical imaging techniques, and doctors analyze characteristics in chest CT images or X-ray images to diagnose COVID-19. Compared with CT images, X-ray images cannot accurately distinguish soft tissues, so CT images are selected for manual analysis [10]. However, the efficiency of manual diagnosis is not high, there is the need to design a method that can automatically analyze and classify chest CT images.
With the continuous advancement of deep learning and computing devices, Convolutional Neural Networks (CNN) is becoming more and more popular in the field of image processing. Now CNN has been widely used in the classification and segmentation of various medical images, including CT images [11]. To ensure the high accuracy and avoid the overfitting, we need sufficient data to train CNN, so as to classify COVID-19 CT images. However, due to the privacy of medical imaging data, there are relatively few public CT image data set of COVID-19. Although insufficient data set will cause overfitting of the trained model, CNN can pretrain its own weight parameters on large data sets, and then fine-adjust the trained weight parameters on small data sets to prevent model overfitting [12]. This way of training model is called transfer learning, which is an effective method to solve the issue of insufficient data. In this paper, we use the weight parameters obtained on the ImageNet database to initialize the backbone network of our model, and then retrain the network with the CT image data set available on Kaggle. Meanwhile, exploiting the existing CNN such as VGG16, ResNet50, GoogLeNet, and DenseNet201 requires a specialized computer with a dedicated Graphics Processing Unit (GPU), or even to connect to a remote server consisting of multiple GPUs. These hardwares configuration are expensive, and difficult to be transplanted to embedded devices for extensive application. Consequently, we propose a COVID-19 CT images classification model based on lightweight CNN, where a lightweight network, named MobileNetV2, is selected as the backbone. As a lightweight network, MobileNetV2 has fewer parameters, a lighter architecture, and its reliance on GPU is not as serious as other networks with complex designs. It is also easy to be transplanted to embedded devices for wider application. Finally, in order to maximize model performance, Bayesian optimization method is used to adjust model hyperparameters.
The rest of the article is arranged as follows. Section 2 introduces the related work. Section 3 describes the proposed model. Section 4 introduces the data set and hardware used in the experiment, presents the experimental results and shows the comparison analysis with other similar works. Section 5 summarizes this article, discusses the shortcomings and some future works.
Using CNN to analyze medical images and diagnose various diseases has always been research hotsopt. So far, many studies have been carried out for the detection of COVID-19. Among them, almost all detection works are based on chest CT images and chest X-ray images [13]. Studies have shown that the false positive rate of chest CT is lower than that of chest X-ray, therefore, more COVID-19 patients are detected by chest CT images [14].
Xu et al. [15] proposed a Deep learning system to distinguish COVID-19 pneumonia from Influenza-A viral pneumonia and healthy cases with CT images. Firstly, the method based on HU values was used to preprocess the CT image data set, and then used the VNET-IR-RPN segmentation model to segment the candidate region in the CT images. Finally, ResNet-18 network was used to classify and the final classification accuracy is 86.7% on a data set including 618 chest CT images. Li et al. [4] proposed a deep learning model called COVNet, which can distinguish between COVID-19 CT images, community acquired pneumonia CT images and non-pneumonia CT images. The backbone of COVNet is ResNet50 network. They also collected a CT image data set included 1,296 COVID-19 positive samples, 1,735 were community acquired pneumonia samples, and 1,325 were non-pneumonia samples. Wang et al. [16] proposed a COVID-19 classification and lesion location method based on CT volumes, they first use U-NET to segment lung region from CT volumes, and then the segmented lung region was input into 3D depth CNN to predict the probability of COVID-19. They employed 499 CT volumes to train their model, where 131 CT volumes were used to test the model and the final classification accuracy was 90.1%. Wang et al. [17] developed a deep learning system for COVID-19 diagnosis, which consisted of three parts: the Densenet121-FPN network for lung segmentation, the proposed operation for suppressing non-lung area and the proposed novel COVID-19Net for COVID-19 diagnosis. The structure of the model is DenseNet-like structure. To train the model, they also collected a total of 5,372 chest CT images, including 4,106 for training and 1,266 for validating. Gao et al. [18] proposed a dual branch combined network (DCN) for COVID-19 diagnosis. The model is divided into three parts. Part 1 is UNET, which is used to extract the lung region. Part 2 is the proposed DCN including a slice-level classification branch and a segmentation branch, the backbone of the classification branch is ResNet50 and the backbone of the segmentation branch is UNET. Part 3 used a three-layer fully connected network to get the final classification results. These studies have made a significant contribution to the COVID-19 detection. However, due to the lack of training data, these models have not been fully trained, which prevents these models from achieving optimal performance in COVID-19 diagnosis. Previous studies have shown that CNN based on transfer learning has achieved good results in COVID-19 patients diagnosis, and can effectively solve the problems caused by insufficient data.
Sarker et al. [12] proposed a classification model called COVID-DenseNet, and the backbone of COVID-DenseNet is DenseNet121. They used transfer learning technique to train the model and resolve the gradient vanishing problem, and then used the trained model to classify chest radiological images for diagnosing COVID-19 patients. The average classification accuracy of the model was 92.91%. Zhang et al. [19] proposed a deep learning model to diagnosis the COVID-19 patients. The backbone of the model is ResNet18 and used transfer learning to train the model, they used the parameters of ResNet18 trained in the ImageNet database to initialize their proposed model. They designed a multi-layer with a 100-neuron layer, a one-neuron output layer and the sigmoid activation. They used the multi-layer and a convolutional layer designed a classification head and supplement it at the end of the backbone. Jaiswal et al. [10] proposed a deep transfer learning model, which imported the parameters of the pretrained DenseNet201 network on the ImageNet database, then trained DenseNet201 to classify COVID-19 CT images in combination with their collected data set. Their collected data set included 1262 COVID-19 positive CT images and 1230 COVID-19 negative CT images. The final classification accuracy reached 96.25%. These models also lack data, but by using transfer learning technology, these models could be fully trained, solved the problem of insufficient data, and the test results were significantly better than the models without use transfer learning. However, almost all models run on a computer equipped with expensive GPU. Even if the GPU acceleration is used, these models still consume a lot of time. Also, it is difficult to be transplanted to embedded devices for wide application.
In order to solve the above problems, this paper proposes a lightweight CNN classification model based on transfer learning. Not only can it solve the problem of insufficient data set, but also run on a computer without GPU, which is easy to be transplanted to embedded devices and mobile devices for extensive application.
3 The Proposed Classification Model Framework
This section describes the overall process of the entire method, followed by explaining the specific steps in detail. First, the preprocessing method of the data set and the backbone network of the model is introduced. Then, describes the modification steps of MobileNetV2. Finally, illuminates the steps of transfer learning and Hyperparameter optimization.
The flow chart of the proposed method is shown in Fig. 1, including the following steps.
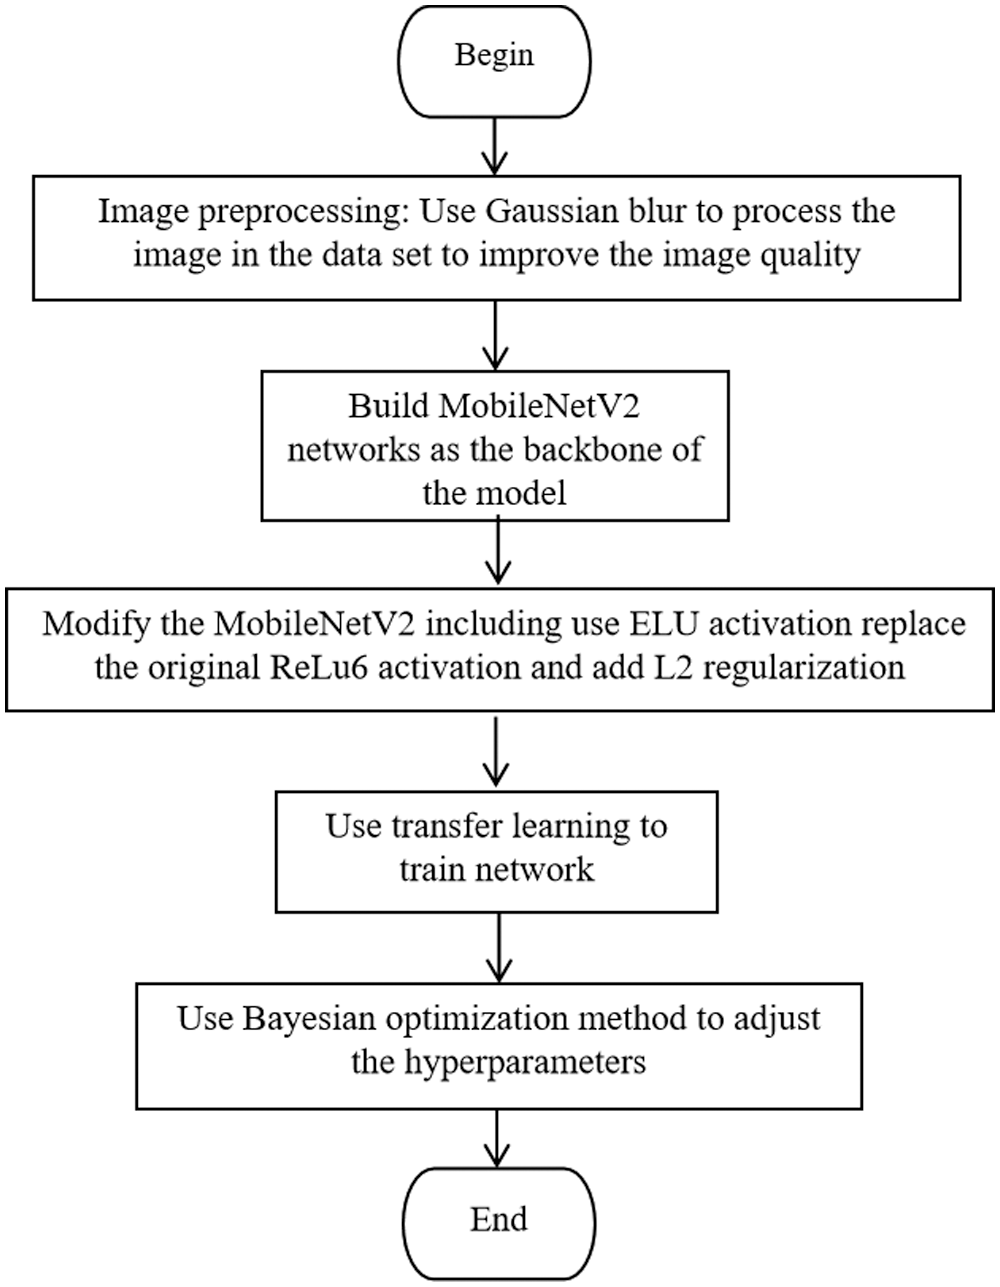
Figure 1: Flow chart of the proposed method
Step 1: Use Gaussian blur to preprocess the images in data set to improve the images quality.
Step 2: Build MobileNetV2 network as the backbone of the model.
Step 3: Modify the MobileNetV2 including use ELU activation replace the original ReLu6 activation and add L2 regularization.
Step 4: Use transfer learning to train network.
Step 5: Use Bayesian optimization method to adjust the hyperparameters.
For the training of CNN, if the data set becomes larger and the data quality is higher, the performance of the model will get better, also the generalization ability of the model will be better. However, the CT data set of COVID-19 is small and the CT images are affected by noise, so we use transfer learning to train the model and use Gaussian blur to process the images to enhance the image quality.
We choose the lightweight network, named MobileNetV2, as the backbone of the model and modify it. Including replace the original ReLu6 activation function with the ELU activation function and use L2 regularization to constrain the loss function of the model to prevent overfitting.
Finally, in order to achieve better performance of the model, Bayesian optimization method is used to adjust the hyperparameters.
The image-based tasks method is vulnerable to the image quality [20,21]. The quality of CT images is mainly affected by noise and artifacts, which affects the visualization effect of CT images [22]. Therefore, we use preprocessing method to improve the quality of CT images.
First, randomly crop CT images to different sizes, and then the cropped images were scaled with the default scale within the range of (0.08, 1.0). The scale indicates the sampling range of an area. If an image is 100
Meanwhile, we use Gaussian blur [23] to reduce noise in CT images and by this way we can improve images quality. When processing the 224
where,
In this paper, MobileNetV2 is used as the backbone for COVID-19 detection. MobileNetV2 is an improved version of the MobileNetV1, which is a lightweight network. Compared to the traditional CNN, MobileNetV1 greatly reduces model parameters and calculation amount under the premise of a small reduction in accuracy. Compared with VGG16, the accuracy of classification task is reduced by 0.9%, while the model parameters are only 1/32 of VGG [24]. Compared with MobileNetV1, MobileNetV2 has higher accuracy, less parameters and calculation. It can run on the computer only equipped with Central Processing Unit (CPU) [25].
For modifying the MobileNetV2 network, we replace the ReLu6 activation function with the ELU activation function in the “bottleneck module” in the MobileNetV2 network. Fig. 2 shows the structure of the improved “bottleneck module”, which includes convolution layer (convolution kernel size is 1
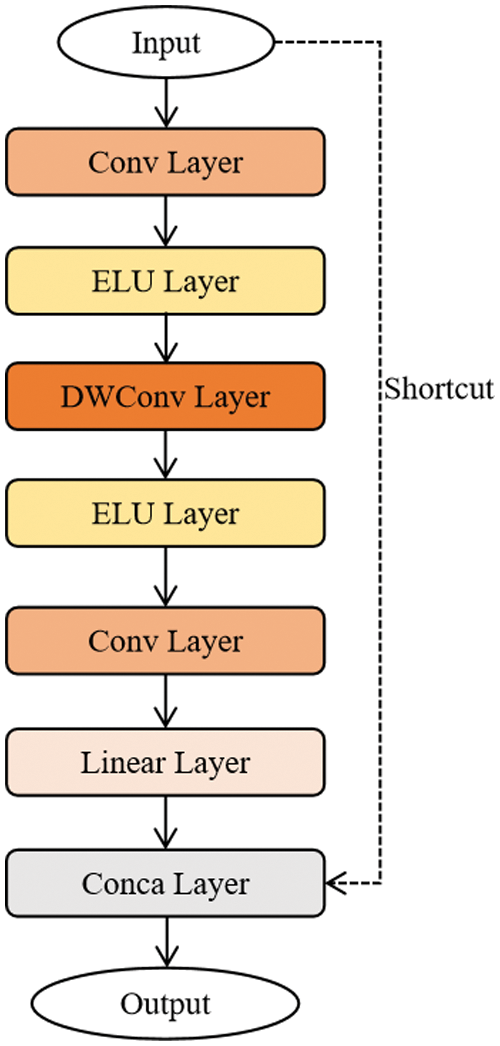
Figure 2: The structure of the improved bottleneck model
Compared with ReLU6 activation function, ELU activation function converges faster and has stronger robustness, which is more suitable for the proposed model in this paper, shown in Eq. (2):
where,
The step size of depthwise convolution [26] is 1 and 2, when it is 1, there is a shortcut branch, and when it is 2, there is no shortcut branch. In the “bottleneck module” structure, depthwise convolution and pointwise convolution are used at the same time, and pointwise convolution is a convolution with a convolution kernel size of 1. Theoretically, the calculation of depthwise convolution and pointwise convolution are much less than ordinary convolution, so depthwise convolution can reduce the calculation amount of MobileNetV2.
At the same time, in order to further avoid model overfitting, L2 regularization is used to constrain the loss function of the model. The loss function including L2 regularization is as follows:
Among them, L represents the loss function of the model including L2 regularization;
In this paper, we choose to train the weight parameters of the deeper layers of the model, because the deeper layers extract information with higher dimensions, which are more conducive to the accurate classification of the model.
We first use the weight parameters trained on the ImageNet database to initialize the MobileNetV2 network. Then, freeze the weight parameters of the six bottleneck modules in the shallow layers of the network, and use the CT image data set provided by Kaggle to train the model such that the weight parameters of the six bottleneck layers do not participate in the retraining, and only retrain the weight parameters of the deeper layers.
Next, use the CT image data set provided by Kaggle to train the whole model. After each epoch, we use validation data set to validate the training result to ensure the model converges normally. When the training is completed, the weight parameters of the trained model are saved. In this way, the model successfully uses transfer learning to complete the training.
Finally, in the test phase, we load the parameters of the model trained by transfer learning into the model, and use the test data set to verify the model performance.
In the classification task based on CNN, the setting of hyperparameters is the key to obtain good results. Unlike weight parameters, the hyperparameters are set before training the model. Commonly, hyperparameters are set through manual selection or grid search. It is best to manually select hyperparameters as little as possible due to the large number of hyperparameters in different configurations. Meanwhile, because selecting hyperparameters with grid search algorithm requires a lot of time to evaluate the previous hyperparameters settings, this hinders the model from achieving optimal results. To resolve the problem above, we choose the Bayesian optimization, it will account for the previous evaluation results when making the next hyperparameter adjustment, by using Bayesian optimization the model will get better performance and faster speed.
The Bayesian optimization algorithm flow is summarized as follows [27].
Step 1: input the object function f, data x, and acquisition function u.
Step 2: initialize data set
Step 3: fit the sample to get Gaussian process model
Step 4: find the extreme point by maximizing the acquisition function.
Step 5: get new sample.
Step 6: update data set.
And the pseudocode is shown in Algorithm 1.

In this paper we use Bayesian optimization algorithm to adjust the learning rate, decay index, and Batch Size of the model, L2 regularization parameter
For the proposed model, we prepared two sets of hardware devices. The first set is a computer equipped with Intel Core I7-10700 CPU and 16 GB RAM, and connecting to a remote server consisting of 4 NVIDIA GeForce RTX 3090 GPU. The second set is a computer equipped with Intel Core I5-10500 CPU and 16 GB RAM. The develop environment is Pytorch 1.7, and the first set computer that equipped with GPU is used for model training, hyperparameter optimization, and validation; the second set computer is used to perform tests on a test set to prove the performance and computational efficiency of the proposed model.
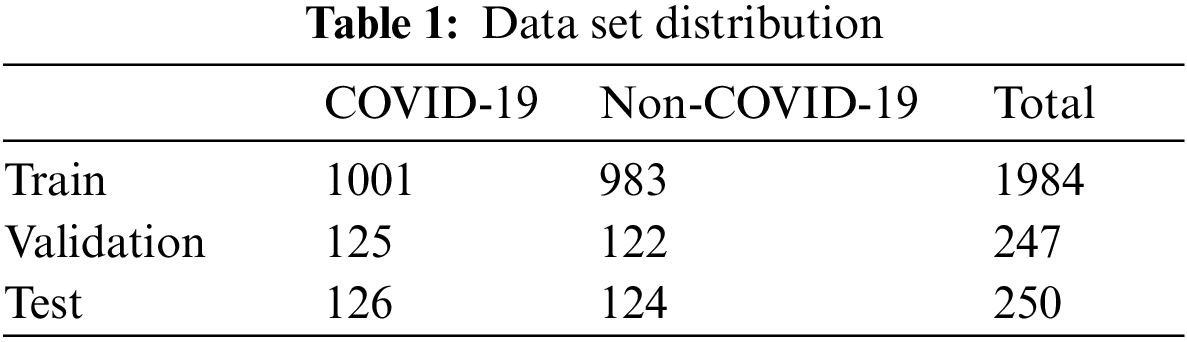
The used data is from the COVID-19 CT image data set available on Kaggle. There are 2,481 chest CT images, 1,252 positive CT images for COVID-19 and 1,229 negative CT images for COVID-19. Fig. 3 shows the samples of COVID-19 positive CT images and COVID-19 negative healthy chest CT images. The size of all the images on the data set was adjusted to 224 × 224 pixels, and the Gaussian blur was used to reduce images noise and improve image quality. According to the ratio of 8:1:1, we divided the data set into three sub data sets, including a training set, a validation set, and a test set, as shown in Tab. 1. The training set is used to train the model for 101 epochs, and then after each epoch, use the validation set to validate the model to ensure the model can successfully complete the training, finally after the training use the test set to verify the performance of the trained model.
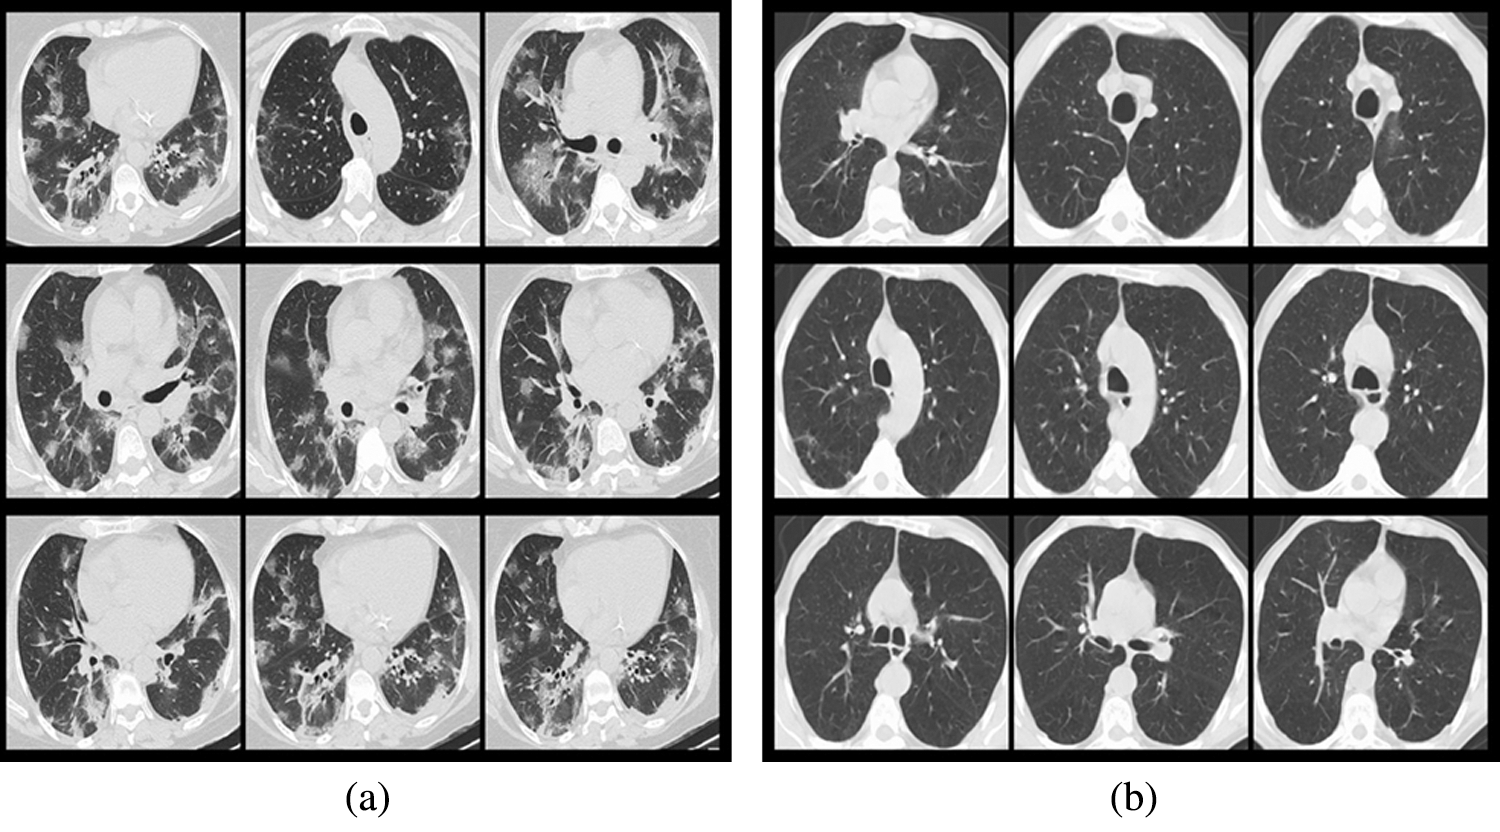
Figure 3: Samples from the data set (a) COVID-19 positive samples, (b) COVID-19 negative samples
4.3 Hyperparameters Optimization Results
For better visualization, the best results among the 30 iterations of each adjustment are chosen and shown in Tab. 2.
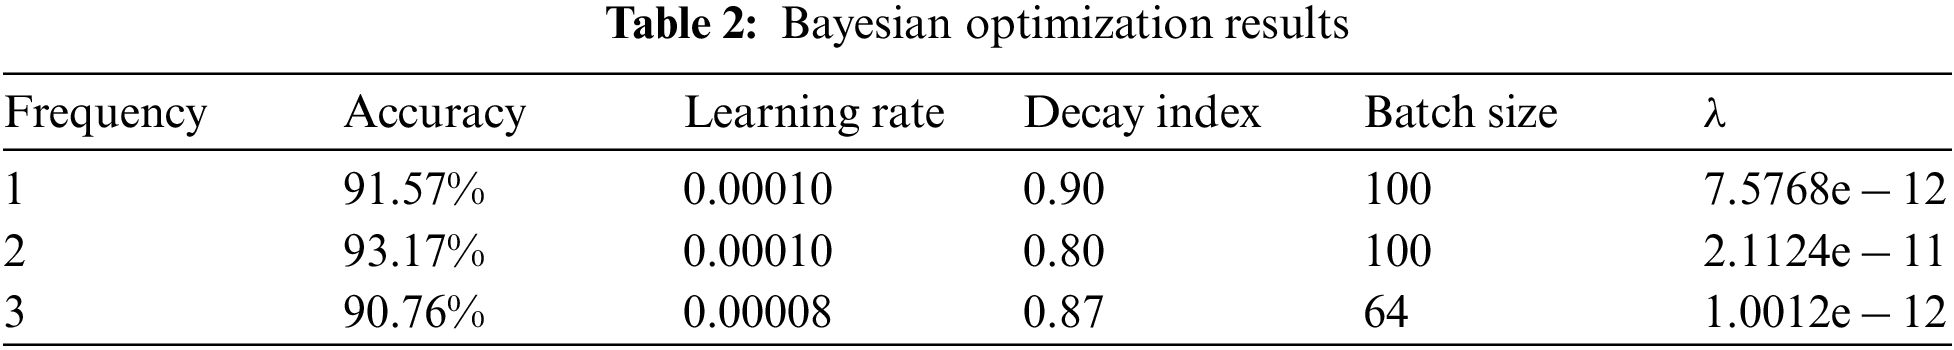
According to Tab. 2, when the learning rate is set to 0.00010, the decay index to 0.80, Batch size to 100 and let
In this paper we set the standard deviation of the Gaussian distribution
The model designed in this paper is mainly used to classify chest CT images to diagnose COVID-19 patients. The classification result is COVID-19 positive CT image or healthy CT image. The classification result of divide COVID-19 positive CT images into healthy CT images may appear. To solve this problem, we set true positive (
Accuracy (
The recall rate (
Precision (
The formula for calculating F1-score (
The formula for calculating Specificity (
We trained a total of 101 epochs on the model. After each epoch, use the validation set to validate the model. Use above evaluation indicators and the loss value of the model as verification criteria, presented in the form of charts. Observe the training process of the model to ensure that the model can successfully complete the training. Fig. 4a shows the accuracy change curve of the model during training for 101 epochs. Fig. 4b shows the convergence process of the loss function during model training for 101 epochs. It can be clearly seen from these two figures that the model converges very quickly in the first 20 epochs, and gradually decreases in the subsequent epochs until the training end, and the accuracy continues to increase as the loss value decreases. Similarly, the accuracy changes in the first 20 epochs. Obviously, the later epochs basically tend to be flat, and the highest accuracy reaches 94%. Fig. 4 shows that the proposed model converges fast and has high accuracy.
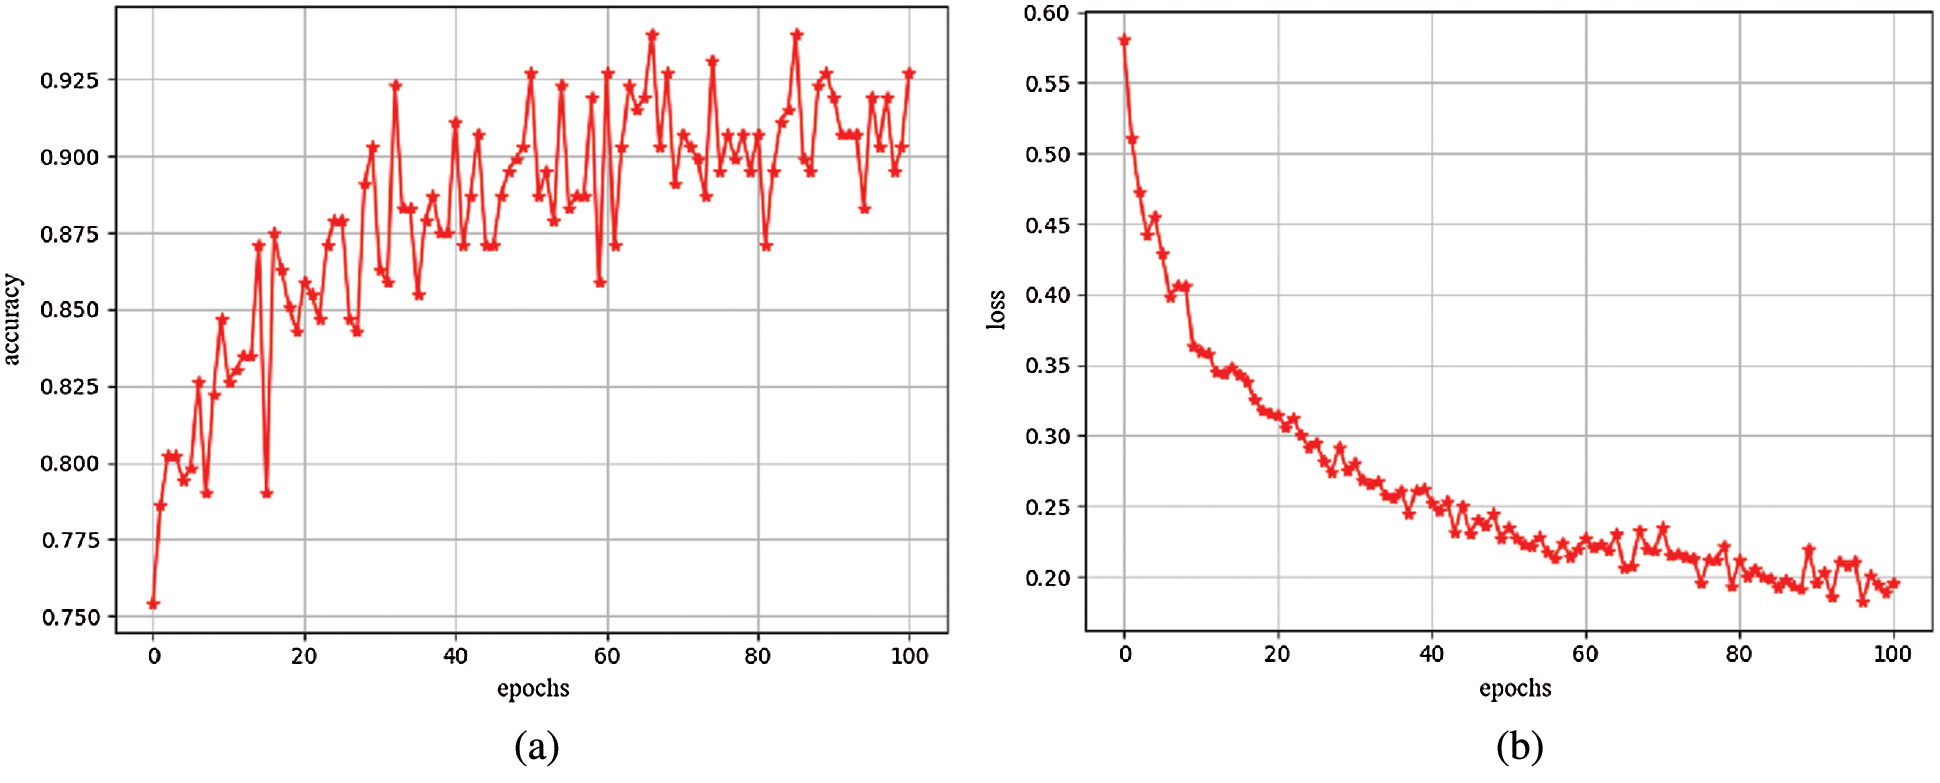
Figure 4: (a) Accuracy map (b) Loss map
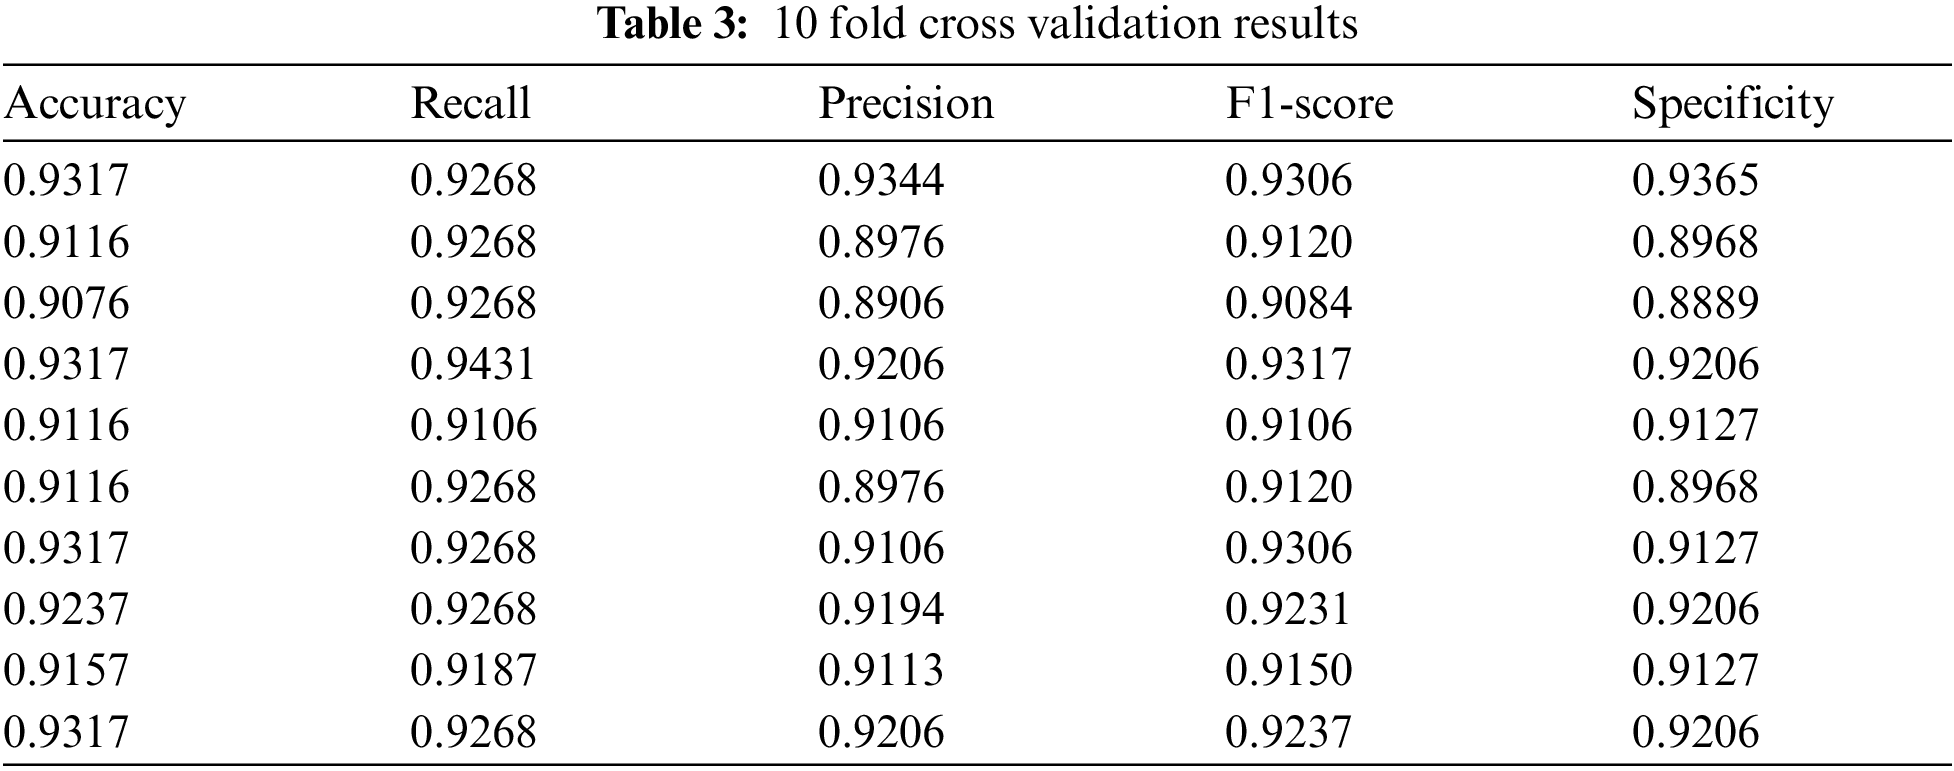
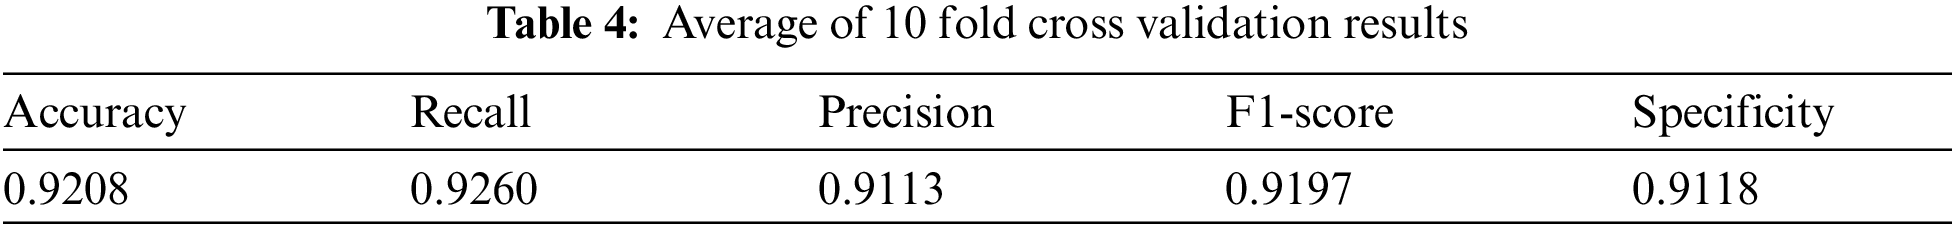
Use the test set data to perform 10 fold cross validation on the trained model from the five evaluation indicators mentioned above, as shown in Tab. 3. And Tab. 4 shows the average of the 10 fold cross validation results.
For proving the superiority of transfer learning and Bayesian optimization, we also conduct experiment on the model without using transfer learning and Bayesian optimization. The results are shown in Tab. 5.
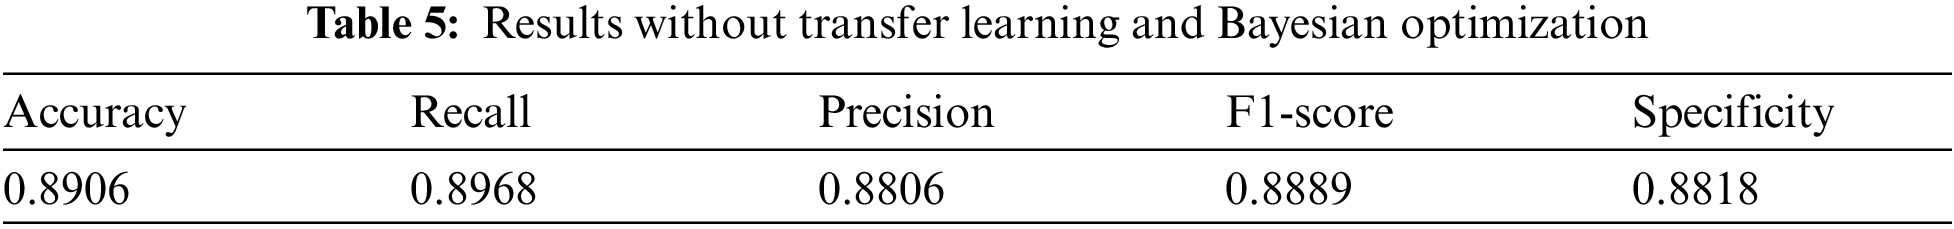
Comparing the results in Tabs. 4 and 5, we can see that based on transfer learning and Bayesian optimization, the model performance is more superior.
Meanwhile, in order to prove the validity of the proposed model, compare the experimental results of the proposed model with the models proposed by Jaiswal et al. [10] , Xu et al. [15], Wang et al. [16], Polsinelli et al. [28], Wang et al. [29] and Oh et al. [30]. Which are summarized in Tab. 6.
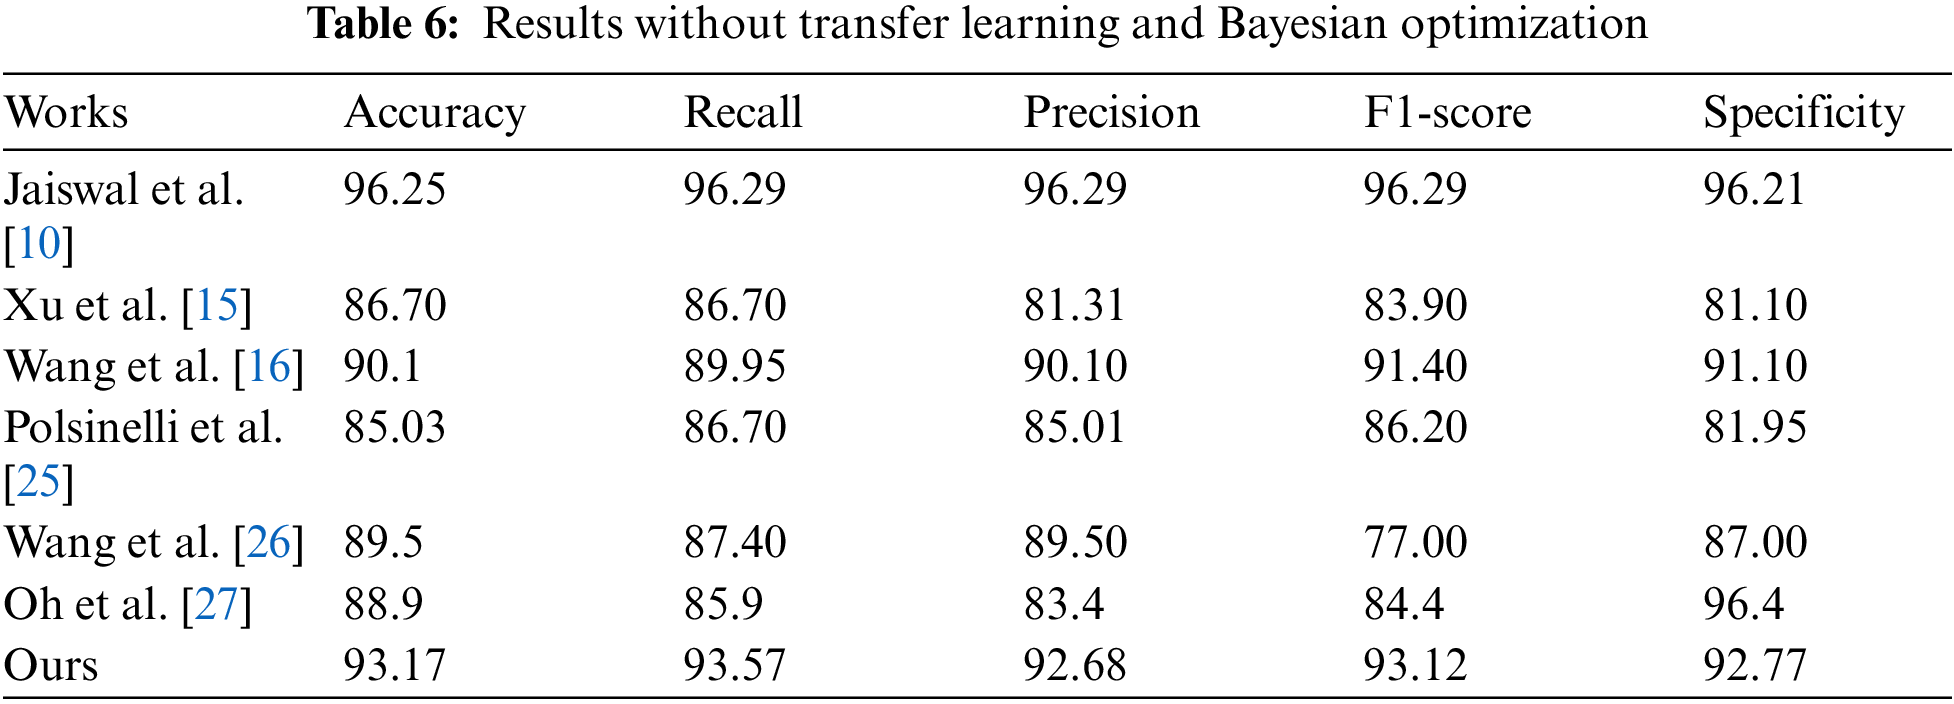
It can be seen from Tab. 6 that the results of our model are better than that of most models. Although the results of the model proposed by Jaiswal et al. [10] are higher than that of our model, it is mainly because literature Jaiswal et al. [10] used the DenseNet201 network as their model backbone. The depth of the DenseNet201 network is much deeper than that of the lightweight network MobileNetV2, so it can learn more complex features than ours and can get better results. However, the depth is also a disadvantage, because if a network becomes deeper it will consume more time, and must require a dedicated GPU device to accelerate.
On the computer equipped with GPU, we performed a efficiency test on the models compared above. We test the time required for each model to classify one COVID-19 CT image on average. The shortest average classification time, obtained by the model proposed by Polsinelli et al. [28], is 1.25 s. Meanwhile, the average time of our model to classify one CT image on the computer that without GPU is 1.06 s (the image preprocessing takes 0.7 s and classification consumes 0.36 s). Through the analysis we can see that, on the computer without GPU, our model can process a large number of CT images in a short time. For the 2,481 CT images in the data set, all classifications can be completed in about 44 min, and however the model proposed by Polsinelli et al. [28] consumes about 51 min on the computer equipped with GPU. By contrast, the efficiency of our model is the highest.
In this paper, based on MobileNetV2, a CT image classification model for diagnosing COVID-19 is proposed. Since the MobileNetV2 network is a lightweight CNN, the proposed model is more efficient than other complex models. Therefore, the designed model can run on the computers without expensive GPU, easy to be transplanted to embedded devices or mobile devices, and it is easy to be used widely. Simultaneously, exploiting transfer learning can effectively solve the problem of model overfitting caused by insufficient data. Also, adjusting the hyperparameters via Bayesian optimization can optimize the performance of our model. And experimental results verify the effectiveness of our method.
Although lightweight CNN can improve the efficiency of the model, it also has many problems. Firstly, the accuracy of the model cannot be guaranteed. In this paper, the accuracy of our model is still lower than some models that based on deep CNN, even though we use preprocessing to improve the quality of the data set and bayesian optimization method is used to adjust the model's hyperparameters. Secondly, the number of parameters in the model will affect the generalization ability of the model, which is ignored by us. Therefore, for model accuracy and generalization ability, in the future, we will improve the Gaussian filter used in the pretreatment process and add data enhancement technology to expand the data set. Meanwhile, it is prepared to design a new metric loss function training model based on the triplet loss, so as to encourage the model learn more distinguishing features. We will also try to modify the depthwise convolution layer in the bottleneck module.
Acknowledgement: We would like to thank the support of the School of Nanjing University of Information Science & Technology.
Funding Statement: This work was supported, in part, by the Natural Science Foundation of Jiangsu Province under Grant Numbers BK20201136, BK20191401; in part, by the National Nature Science Foundation of China under Grant Numbers 61502240, 61502096, 61304205, 61773219; in part, by the Priority Academic Program Development of Jiangsu Higher Education Institutions (PAPD) fund.
Conflicts of Interest: The authors declare that they have no conflicts of interest to report regarding the present study.
1. N. S. Chen, M. Zhou, X. Dong, J. M. Qu, F. Y. Gong et al., “Epidemiological and clinical characteristics of 99 cases of 2019 novel coronavirus pneumonia in Wuhan, China: A descriptive study,” The Lancet, vol. 395, no. 10223, pp. 507–513, 2020. [Google Scholar]
2. T. Ai, Z. L. Yang, H. Y. Hou, C. N. Zhang, C. Chen et al., “Correlation of chest CT and RT-PCR testing for coronavirus disease 2019 (COVID-19) in China: A report of 1014 cases,” Radiology, vol. 296, no. 2, pp. 32–40, 2020. [Google Scholar]
3. Y. C. Fang, H. Q. Zhang, J. C. Xie, M. J. Lin, L. J. Ying et al., “Sensitivity of chest CT for COVID-19: Comparison to RT-PCR,” Radiology, vol. 296, no. 2, pp. 115–117, 2020. [Google Scholar]
4. L. Li, L. X. Qin, Z. G. Xu, Y. B. Yin, X. Wang et al., “Artificial intelligence distinguishes COVID-19 from community acquired pneumonia on chest CT,” Radiology, vol. 296, no. 2, pp. 65–71, 2020. [Google Scholar]
5. National Health Commission of the People's Republic of China, “Diagnosis and treatment protocol for COVID-19 (Trial version 7),” 2020. [Online]. Available: http://en.nhc.gov.cn/2020-03/29/c_78469.htm (Accessed 29 March 2020). [Google Scholar]
6. World Health Organization, “Clinical management of severe acute respiratory infection when novel coronavirus (nCoV) infection is suspected: Interim guidance,” 2020. [Online]. Available: https://apps.who.int/iris/handle/10665/330854 (Accessed 25 January 2020). [Google Scholar]
7. J. Shi, L. L. Wang, S. S. Wang, Y. X. Chen, Q. Wang et al., “Applications of deep learning in medical imaging: A survey,” Journal of Image and Graphics, vol. 25, no. 10, pp. 1953–1981, 2020. [Google Scholar]
8. J. P. Kanne, “Chest CT findings in 2019 novel coronavirus (2019-nCoV) infections from Wuhan, China: Key points for the radiologist,” Radiology, vol. 295, no. 1, pp. 16–17, 2020. [Google Scholar]
9. H. S. Shi, X. Y. Han, N. C. Jiang, Y. K. Cao, O. Alwalid et al., “Radiological findings from 81 patients with COVID-19 pneumonia in wuhan, China: A descriptive study,” The Lancet Infectious Diseases, vol. 20, no. 4, pp. 425–434, 2020. [Google Scholar]
10. A. Jaiswal, N. Gianchandani, D. Singh, V. Kumar and M. Kaur, “Classification of the COVID-19 infected patients using densenet201 based deep transfer learning,” Journal of Biomolecular Structure and Dynamics, vol. 39, no. 15, pp. 5682–5689, 2020. [Google Scholar]
11. X. A. Xu, F. G. Zhou, B. Liu, D. S. Fu and X. Z. Bai, “Efficient multiple organ localization in CT image using 3D region proposal network,” IEEE Transactions on Medical Imaging, vol. 38, no. 8, pp. 1885–1898, 2019. [Google Scholar]
12. L. Sarker, M. M. Islam, T. Hannan and Z. Ahmed, “COVID-DenseNet: A deep learning architecture to detect COVID-19 from chest radiology images,” 2020. https://10.20944/preprints202005.0151.v1. [Google Scholar]
13. Z. Y. Han, B. Z. Wei, Y. F. Hong, T. Y. Li, J. Y. Cong et al., “Accurate screening of COVID-19 using attention-based deep 3D multiple instance learning,” IEEE Transactions on Medical Imaging, vol. 39, no. 8, pp. 2584–2594, 2020. [Google Scholar]
14. M. Chung, A. Bernheim, X. Y. Mei, N. Zhang, M. Q. Huang et al., “CT imaging features of 2019 novel coronavirus (2019-nCoV),” Radiology, vol. 295, no. 1, pp. 202–207, 2020. [Google Scholar]
15. X. W. Xu, X. G. Jiang, C. L. Ma, P. Du, X. K. Li et al., “Deep learning system to screen coronavirus disease 2019 pneumonia,” Engineering, vol. 6, no. 10, pp. 1122–1129, 2020. [Google Scholar]
16. X. G. Wang, X. B. Deng, Q. Fu, Q. Zhang, J. P. Feng et al., “A Weakly-supervised framework for COVID-19 classification and lesion localization from chest CT,” IEEE Transactions on Medical Imaging, vol. 39, no. 8, pp. 2615–2625, 2020. [Google Scholar]
17. S. Wang, Y. F. Zha, W. M. Li, Q. X. Wu, X. H. Li et al., “A fully automatic deep learning system for COVID-19 diagnostic and prognostic analysis,” European Respiratory Journal, vol. 56, no. 2, pp. 1–11, 2020. [Google Scholar]
18. K. Gao, J. P. Su, Z. B. Jiang, L. L. Zeng, Z. C. Feng et al., “Dual-branch combination network (DCNTowards accurate diagnosis and lesion segmentation of COVID-19 using CT images,” Medical Image Analysis, vol. 67, pp. 1–12, 2020. [Google Scholar]
19. J. P. Zhang, Y. T. Xie, Y. Li, C. H. Shen and Y. Xia, “Covid-19 screening on chest x-ray images using deep learning-based anomaly detection,” 2020. https://arxiv.org/pdf/2003.12338v1. [Google Scholar]
20. X. R. Zhang, W. F. Zhang, W. Sun, X. M. Sun and S. K. Jha, “A robust 3-D medical watermarking based on wavelet transform for data protection,” Computer Systems Science & Engineering, vol. 41, no. 3, pp. 1043–1056, 2022. [Google Scholar]
21. X. R. Zhang, X. Sun, X. M. Sun, W. Sun and S. K. Jha, “Robust reversible audio watermarking scheme for telemedicine and privacy protection,” Computers, Materials & Continua, vol. 71, no. 2, pp. 3035–3050, 2022. [Google Scholar]
22. X. R. Zhang, X. Sun, W. Sun, T. Xu and P. P. Wang, “Deformation expression of soft tissue based on BP neural network,” Intelligent Automation & Soft Computing, vol. 32, no. 2, pp. 1041–1053, 2022. [Google Scholar]
23. K. Ito and K. Xiong, “Gaussian filters for nonlinear filtering problems,” IEEE Transactions on Automatic Control, vol. 45, no. 5, pp. 910–927, 2000. [Google Scholar]
24. A. G. Howard, M. L. Zhu, B. Chen, D. Kalenichenko, W. J. Wang et al., “Mobilenets: Efficient convolutional neural networks for mobile vision applications,” 2020. https://arxiv.org/abs/1704.04861. [Google Scholar]
25. M. Sandler, A. Howard, M. L. Zhu, A. Zhmoginov and L. C. Chen, “Mobilenetv2: Inverted residuals and linear bottlenecks,” in Proc. of the IEEE Conf. on Computer Vision and Pattern Recognition, Salt Lake City, UT, USA, pp. 621–632, 2018. DOI 10.1109/CVPR.2018.00474. [Google Scholar] [CrossRef]
26. W. Sun, X. R. Zhang and X. Z. He, “Lightweight image classifier using dilated and depthwise separable convolutions,” Journal of Cloud Computing, vol. 9, no. 1, pp. 1–12, 2020. [Google Scholar]
27. J. Snoek, H. Larochelle and R. P. Adams, “Practical Bayesian optimization of machine learning algorithms,” in Neural Information Processing Systems, vol. 25, pp. 2951–2959, 2012. https://arxiv.org/abs/1206.2944v2. [Google Scholar]
28. M. Polsinelli, L. Cinque and G. Placidi, “A light CNN for detecting COVID-19 from CT scans of the chest,” Pattern Recognition Letters, vol. 140, pp. 95–100, 2020. [Google Scholar]
29. S. Wang, B. Kang, J. L. Ma, X. J. Zeng, M. M. Xiao et al., “A deep learning algorithm using CT images to screen for corona virus disease (COVID-19),” European Radiology, vol. 31, no. 8, pp. 6096–9104, 2021. [Google Scholar]
30. Y. J. Oh, S. J. Park and J. C. Ye, “Deep learning covid-19 features on cxr using limited training data sets,” IEEE Transactions on Medical Imaging, vol. 39, no. 8, pp. 2688–2700, 2020. [Google Scholar]
 | This work is licensed under a Creative Commons Attribution 4.0 International License, which permits unrestricted use, distribution, and reproduction in any medium, provided the original work is properly cited. |