DOI:10.32604/cmc.2022.024596
| Computers, Materials & Continua DOI:10.32604/cmc.2022.024596 | |
| Article |
Parkinson's Detection Using RNN-Graph-LSTM with Optimization Based on Speech Signals
1Department of Information Systems, College of Computer and Information Sciences, Prince Sultan University, Mahayil, 62529, Saudi Arabia
2Department of Information Systems-Girls Section, King Khalid University, Mahayil, 62529, Saudi Arabia
3Department of Computer Science, College of Science and Artsat Mahayil, King Khalid University, Mahayil, 62529, Saudi Arabia
4Faculty of Computer and IT, Sana'a University, Sana'a, Yemen
5Department of Software Engineering, College of Computer Science and Engineering, University of Jeddah, Saudi Arabia
6Department of Natural and Applied Sciences, College of Community-Aflaj, Prince Sattam bin Abdulaziz University, Mahayil, 62529, Saudi Arabia
7Department of Computer and Self Development, Preparatory Year Deanship, Prince Sattam bin Abdulaziz University, AlKharj, 62529, Saudi Arabia
*Corresponding Author: Manar Ahmed Hamza. Email: ma.hamza@psau.edu.sa
Received: 23 October 2021; Accepted: 27 December 2021
Abstract: Early detection of Parkinson's Disease (PD) using the PD patients’ voice changes would avoid the intervention before the identification of physical symptoms. Various machine learning algorithms were developed to detect PD detection. Nevertheless, these ML methods are lack in generalization and reduced classification performance due to subject overlap. To overcome these issues, this proposed work apply graph long short term memory (GLSTM) model to classify the dynamic features of the PD patient speech signal. The proposed classification model has been further improved by implementing the recurrent neural network (RNN) in batch normalization layer of GLSTM and optimized with adaptive moment estimation (ADAM) on network hidden layer. To consider the importance of feature engineering, this proposed system use Linear Discriminant analysis (LDA) for dimensionality reduction and Sparse Auto-Encoder (SAE) for extracting the dynamic speech features. Based on the computation of energy content transited from unvoiced to voice (onset) and voice to voiceless (offset), dynamic features are measured. The PD datasets is evaluated under 10 fold cross validation without sample overlap. The proposed smart PD detection method called RNN-GLSTM-ADAM is numerically experimented with persistent phonations in terms of accuracy, sensitivity, and specificity and Matthew correlation coefficient. The evaluated result of RNN-GLSTM-ADAM extremely improves the PD detection accuracy than static feature based conventional ML and DL approaches.
Keywords: Dimensionality reduction; LDA; feature extraction; auto encoder; classification; recurrent neural network; LSTM and optimization
Parkinson‘s disease (PD) is a neurodegenerative disorder which affects the human brain nerve cells. This is considered to be the second common disease after Alzheimer disease [1] that targets the peoples age more than 60 years. Most of the PD patients are diagnosed in the age of 70 and also 15% of cases are occurred under the age of 50. PD symptoms can be characterized as motor and non motor symptoms. PD motor symptoms includes tremor, stiffness, slowness of movement and postural instability. PD non motor symptoms includes cognitive dysfunction, mood disorders, sensory dysfunction, pain and dysautonomia [2]. Among these two motor symptoms are very common in PD patients. PD detection based on phonation is the proven method with 90% effectiveness [3] which shows voice impairments. Hence, Voice impairments through speech signals are considered to be the one of the earlier symptom that might not be noticeable to the listeners. PD vocal dysfunction is characterized as such as reduced tongue flexibility, longer pauses, reduced vocal volume, narrowing and variations in pitch range, articulation rate and voice intensity level. Acoustic analysis is considered as non-invasive tool by many researches to diagnose PD. Further more, early diagnosis of PD is done with phonation and speech data by many researchers [4–6]. Diagnosing the Parkinson's disease is difficult. It diagnosed through brain scans and clinical assessments which are very cost, leads to erroneous sometime and need some professional monitoring.
Speech signal processing is becomes the interdisciplinary research that includes artificial intelligence and signal processing. In order to solve human-computer interaction (HCI) issues, more methods are developed by many researchers [7]. Based on this many Machine Learning (ML) algorithms are applied to detect PD patients [8–15]. ML algorithms are considered PD detection as a classification task. Machine learning is a scheme that analyze the data, automatically learn the system data and attitudes [16]. ML can be divided into traditional ML algorithm and Deep Learning (DL) based algorithms. DL is inspired by brain signal processing that used programmed neural network [17] to make accurate decisions by the machine without human interference.
ML methods such as Artificial Neural Network [18], K-Nearest Neighbors (KNN) [19], Extreme Gradient Boosting (XGBoost) [20], Random Forest (RF) [21], Support Vector Machine (SVM), Decision Tree (DT) [22], Genetic algorithm (GA) [23] were used for PD classification using speech signals.
Neural network model with more generalization provides the accurate result on the analysis while the data tested before in the training also used for testing. With recurrent neural network (RNN) with Long Short Term Memory (LSTM), the input data are learned which consists of chunks of memory to retain the input information [24,25]. This paper illustrates how the classifiers variation, parameters representation and feature extraction are affect the performance of the model with more accuracy, efficient and robust. The major contribution of the paper is as follows:
• Proposed a PD detection model using static and dynamic features using deep learning model for earlier diagnosis. To scale the input features values in a range, preprocessing method called min-max normalization used.
• To create most relevant low dimensional space, Linear Discriminant Analysis based dimensionality reduction method used which will transform the data into low dimensional space execution
• Proposed a classification model called RNN-Graph LSTM to use the dynamic features of speech signals for PD detection. For each batch normalization layer, the proposed RNN-GLSTM has been applied after hidden layers to standardize the hidden layer output.
• In order to improve the classification model performance, ADAM optimizer used to adjust the network weight. Neural network optimization is used to increase the accuracy and also reduces the loss.
• The proposed models with speech signal dataset is experimented and quantitative results are compared with conventional PD detection model. The proposed model have generalization abilities that are not identified by previous studies. This model also be used for early diagnosis of PD prediction with lower complexity.
The rest of the paper is as follows: Section 2 discusses about the review of the literature, Section 3 stated about the dataset used for evaluation, Section 4 proposed an efficient PD classification model, Section 5 discusses about the experimented results and Section 6 concludes the work with future directions.
In order to differentiate PD patients from healthy people, ML and DL techniques would be the best tool. This section reviews various ML and DL based PD prediction system from speech signals. Sharma et al. [26] proposed a method to extract the voice signal features such as MFCC, Jitter, Shimmer, glottal pulse and pitch. Sakar et al., [27] proposed Tunable Q-Factor wavelet transform (TQWT) method to predict PD patients using voice signals. This dataset was experimented using DL methods called convolutional neural networks [28].
Bouchikhi et al., [29] proposed relief-F feature selection model with SVM classifier. This method chosen 10 features from 22 features. SVM classifier with 10 fold cross validation proves that Relief-F feature selection showed 96.88% accuracy. Experimented dataset consists of 195 voice samples. Relief based algorithms (RBA) are susceptible to noise intrusive with nearest neighbor. Hemmerling et al. [30] proposed nonlinear SVM with PCA based PD detection. This model obtained 93.43% of accuracy on PD classification. The experimented dataset was small and lack in lower precision in prediction.
Parisi et al. [31] proposed multilayer perceptron with lagrangian SVM based classifier to detect PD patients. The relevant features were assigned by custom cost functions by MLP which consists of both accuracy and AUC score. MLP extract 20 most important and relevant features with the score value. This proposed model obtained 100% accuracy than compared algorithms. Hybrid method for preprocessing and PD classification. Subtractive clustering features weighting (SCFW) was proposed as a preprocessing method to reduce the dataset variance. They proposed kernel based extreme learning machine (KELM) as a classifier and justified the efficiency of KELM in terms accuracy, sensitivity and specificity, Kappa statistic value and Roc curve.
Caliskan et al., [32] proposed DNN classifier for PD detection that consists of stacked auto encoder to extract the vocal features. This work is compared with traditional ML models and concludes that DNN based PD prediction secure high accuracy. Moreover, DNN needs more data in training phase and also it took more training time for parameter space search.
In [33] CNN has been used to extract the speech features from short time fourier transform and wavelet transform. Main issue of CNN is to model long distance contextual data while using dilated convolution layers [34]. Recurrent neural network (RNN) overcome this issue and able to model long distance contextual data by saving the previous computations. However, RNN based method suffer from gradient problem and it is hard to tune the parameters in the network layer. LSTM [35] has been used to overcome this issue.
In this paper RNN trained LSTM with graph structure has been proposed as a classification model for PD detection. The classification accuracy is further improved by ADAM optimizer based on various speech features. RNN-GLSTM can hope up with larger dataset without increase the model size. Compared to traditional time series models, GLSTM have more effective as it learn long term dependencies that follow the previous time proceeding and forward to next layers. This proposed model also acquire additional benefit on the use of preprocessing and feature extraction methods. It overcomes the disadvantages of previous methods such as limited dataset size and features that reduce the accuracy for PD prediction due to traditional NN use feed forward layer. RNN-GLSTM used loop network in forward and backward that enhance the accuracy of PD prediction.
The data set used for this analysis is created by Max Little of the University of Oxford which is the collaboration with National centre for voice and speech [36], Denver. The speech signals are recorded by Colorado. The details of the dataset are contained in Tab. 1. This data set consists of 31 peoples biomedical voice measurements. Among them 23 patients are with Parkinson’s disease. The column of the table is voice measure of particular person. Each row of the table corresponds to one of the 195 voice recordings of the individuals. Based on the status column in the table with binary value, aim is to classify the unhealthy (PD patients with value 1) from healthy persons (value 0). This data set consists of 24 attributes which includes number of frequencies (low, medium, high), number of variations in terms of frequency called Jitter and its types such as MDVP:Jitter(%), MDVP:Jitter(Abs), MDVP:RAP, MDVP:PPQ, Jitter:DDP [37,38] and number of variations in terms of amplitude called shimmer and its types such as MDVP:Shimmer, MDVP:Shimmer(dB), Shimmer:APQ3, Shimmer:APQ5, MDVP:APQ, Shimmer:DDA.MDVP:Fo(hz)-average vocal fundamental frequency, MDVP:Fhi(Hz)-average vocal fundamental frequency and MDVP:Flo(Hz)-maximum vocal fundamental frequency, Three nonlinear fundamental frequency variations such as Spread1, Spread2 and PPE, two measures of ratio of noise such as NHR and HNR. It is an unbalanced dataset. Sample data from the dataset is shown in Fig. 1.
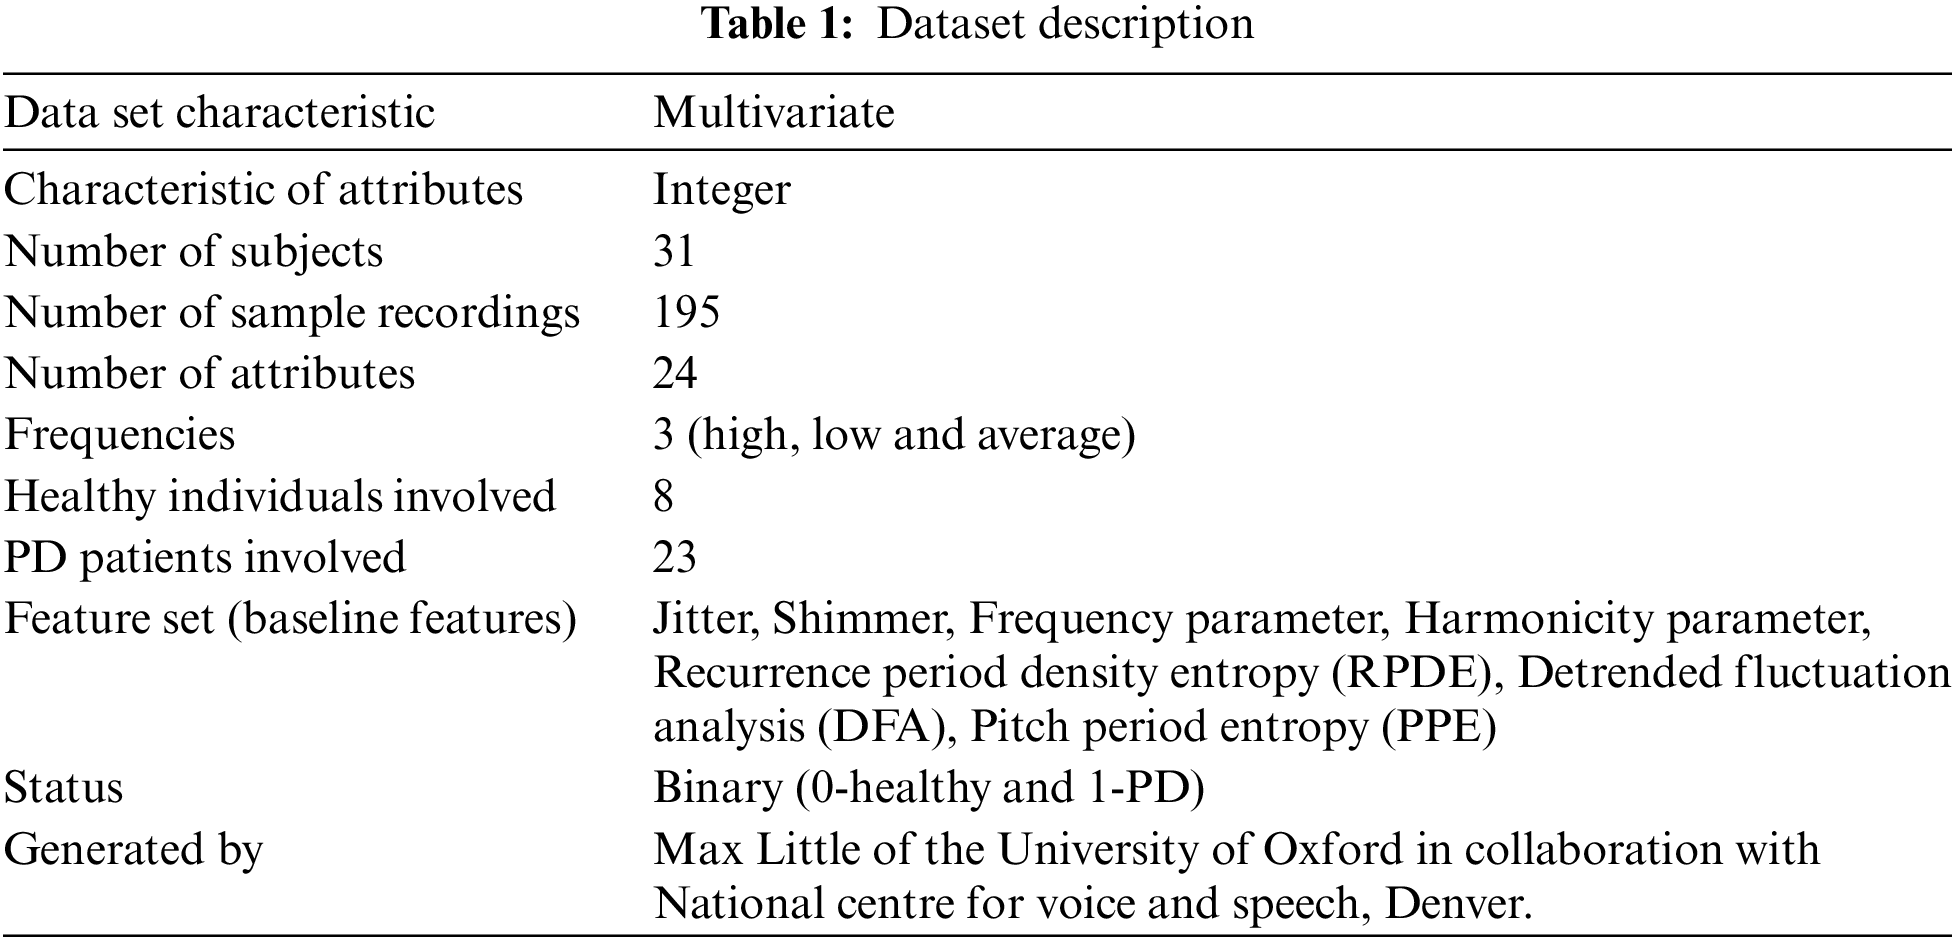
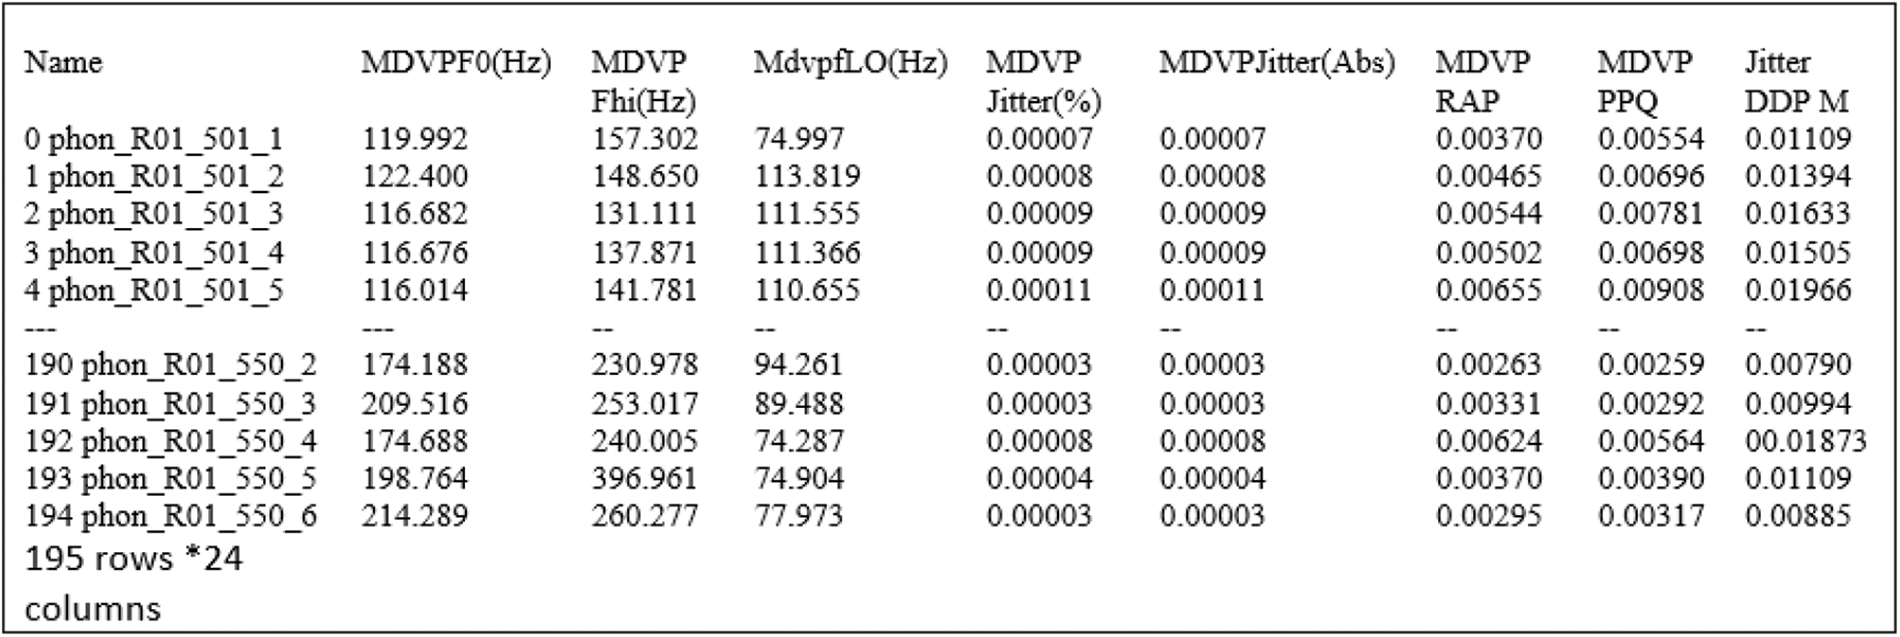
Figure 1: Sample data
The model for proposed PD diagnostic system is shown in Fig. 2. The voice speech signals are preprocessed with normalization to remove the null values. This model uses training database to construct the model. The generalization of the proposed model has been tested through testing database. The classification system performance is further improved with dimensionality reduction and feature extraction techniques. Dimensionality reduction is the mechanism to reduce the high dimensional data space into low dimensional space. Feature extraction is the procedure to select relevant features from feature set to improve the accuracy of the classifier [39,40]. There are numerous dimensionality reduction and feature extraction methods are available. In this work, we use Linear Discriminant Analysis (LDA) for dimensionality reduction and Sparse Auto encoder (SAE) for feature extraction. Each of these methods is explained in upcoming sections.
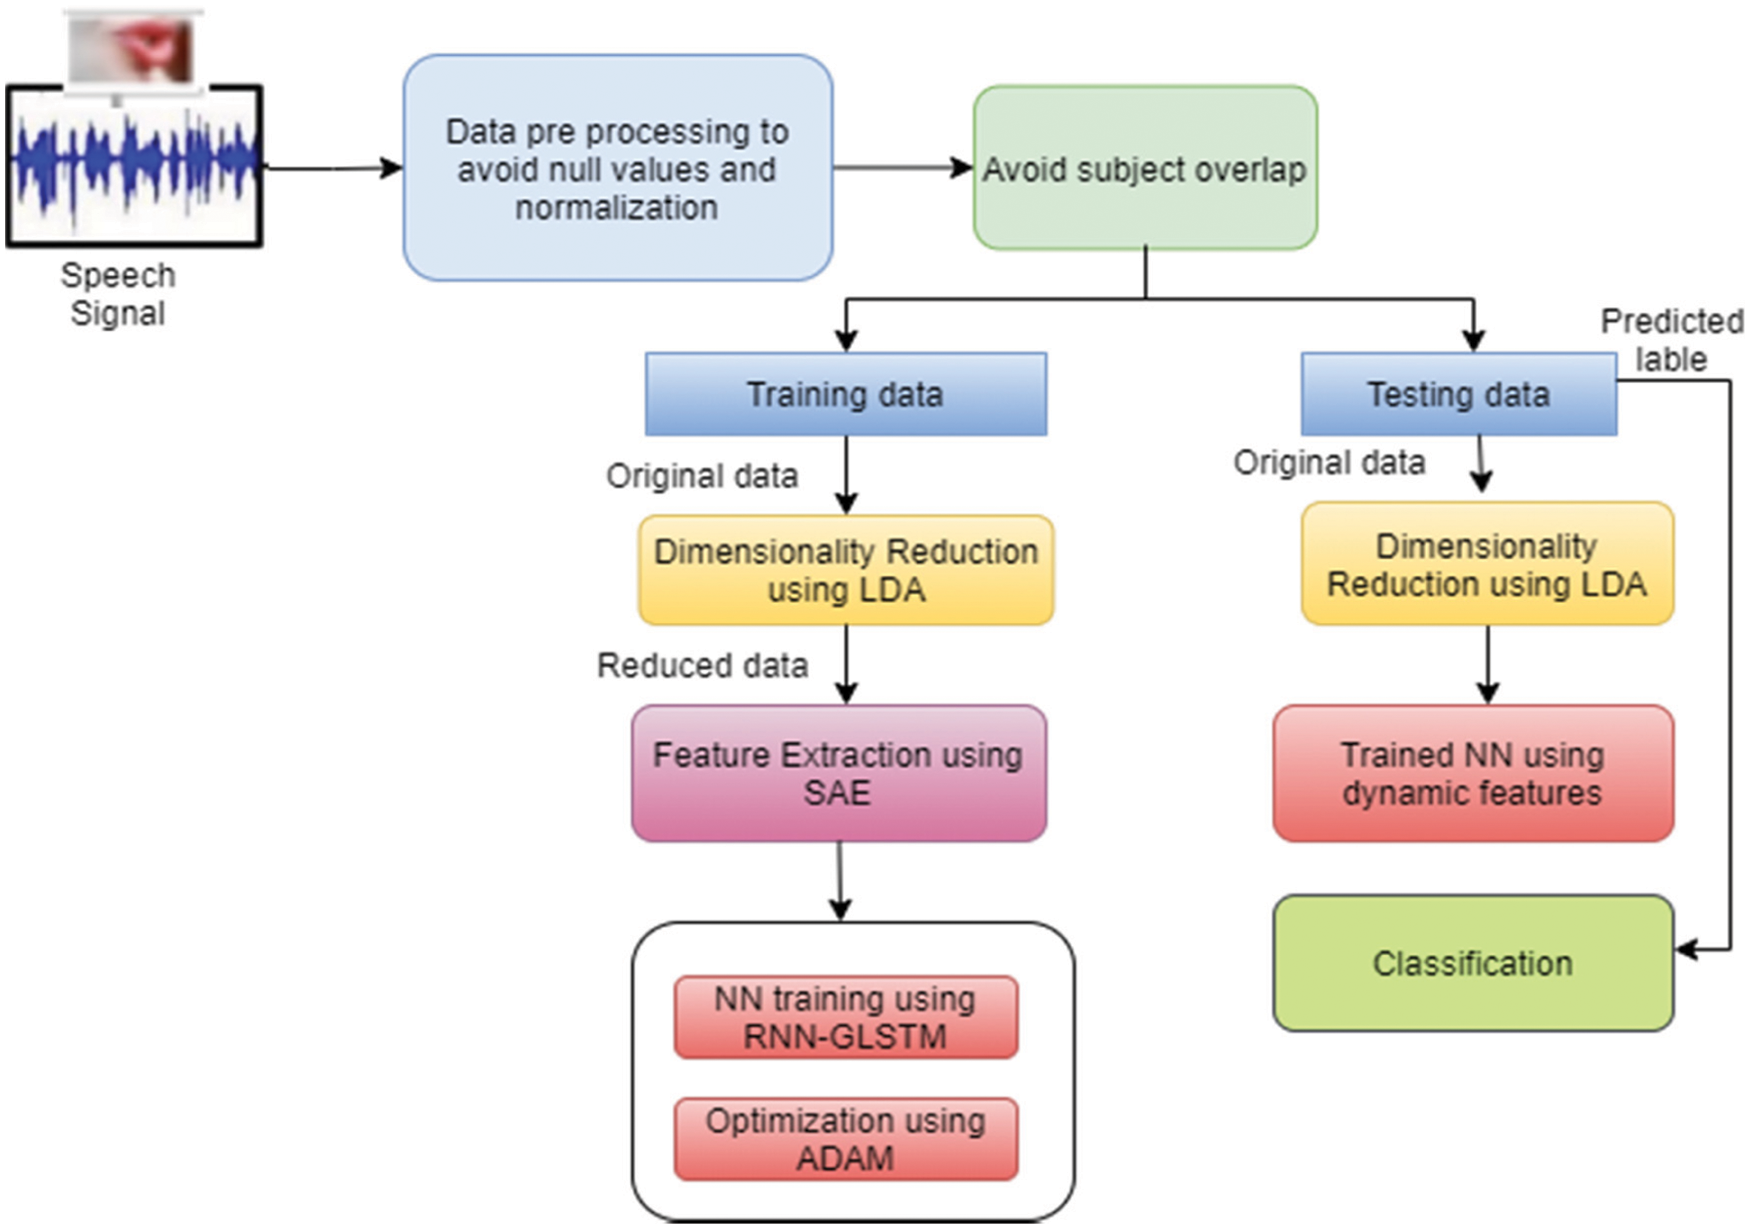
Figure 2: Overview of proposed PD diagnostic model
Raw data are inconsistent due to it contains lots of error and null values. These raw data are transformed into understandable format through pre processing phase that will improve the results. Good preprocessing method yields good classification result. The min-max normalization process is denoted in Eq. (1) for the data set D. After normalization the values are lie in the range [0,1].
4.2 Training Testing Data Model
The entire dataset is divided into three parts such as training dataset and testing dataset with the ration of 80:20 respectively. Based on the cross validation, the training set is further divided into training and validation dataset in the ratio 80:20 respectively. Fig. 3 shows the cross validation sets which the classification performed.
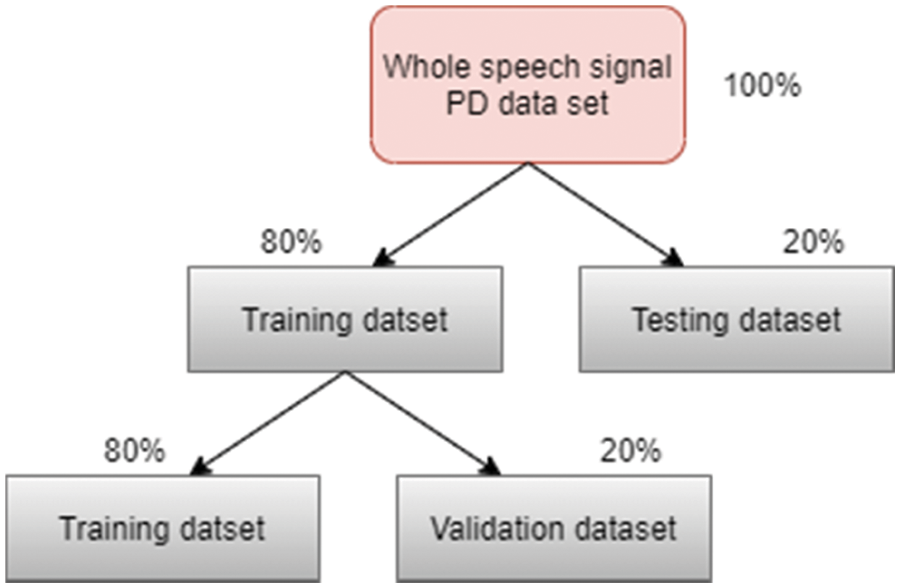
Figure 3: Cross validation ratio of dataset
4.3 Dimensionality Reduction Using LDA
Various feature extraction and classification approaches are used original pattern vector with low dimensionality. To meet this objective, this proposed work use Linear Discriminant Analysis (LDA) for dimensionality reduction method at initial stage of classification model for this, LDA uses Fisher ratio which is denoted as in Eq. (2)
where,
The main objective of phase is to transform the data into lower dimensional space by maximize the Eq. (3). To consider this, LDA use transformation matrix called w with
Hence Eq. (3) becomes
Transformation matrix w is evaluated by the calculation of eigenvectors of (
4.4 Feature Extraction Using SAE
Sparse Autoencoder (SAE) is an unsupervised deep neural network based feature extraction method with single hidden layer [41] to encodes the given data. This also estimates the error and extracts the relevant features through hidden layer expressions [42]. Autoencoder have some functional flaws. AE cannot find features through inputting and copying memory into its implicit layer [43]. To overcome this issue, sparsity based auto encoder is proposed [44]. SAE or sparsity regularization is denoted in Eq. (7).
where KL-Kullback-Leibler (KL) divergence,
SAE has been trained with the cost function stated in Eq. (9) which consists of three terms such as Mean Squared Error (MSE) denoted in Eq. (10) which reconstruct input X into
where N-total number of input data points, X-input,
where l = layer,

Figure 4: SAE with three hidden layers
Through hidden layers, encoder encodes the input data to latent space and decoder decodes the latent space code to output layer. Sigmoid activation function is used for nonlinear mapping. Rectified Linear Unit (ReLU) is not suitable for auto-encoder due to the capability of dealing negative value as zero. This will reduce network training ability. The considered dataset feature values also consist of negative values. Hence, Sigmoid activation function is used rather than ReLU. Objective of SAE is to learn the speech signal features from the input data.
4.5 Classification Using RNN-GLSTM
Recurrent Neural Network (RNN) is the generalized form of feed forward neural network with internal memory. The output of RNN relies with previous computation and sent back to the recurrent network. Internal memory in the RNN is used to operate the input series and make the decision. Long short term memory (LSTM) is based on back propagation for training. LSTM consists of three gates such as input gate, forget and output gate. Input gate used sigmoid activation function which is used to decide the values of input that modify the memory. Forget gate is responsible to decide the details that are to be discarded from previous state and output gate responsible to control the output. Compare to traditional LSTM, in graph LSTM each tree node represents the single LSTM unit, Fig. 5.

Figure 5: Proposed RNN-LSTM classification model
This model consists of seven layers such as input layer, five hidden layers and an output layer. Recurrent Neural network is comprised with the input layer of LSTM cell. Each input layer of LSTM layer represents the Phonation Features (PF) of the speech signals. 23 features are represented by 23 neurons in the input layer of LSTM cell which is shown in Fig. 6.
where, b-bias vector, w-weight matrices and H-hidden layer function of each feature.

Figure 6: GLSTM cell
For the forward GLSTM, the parameters in Fig. 6 such as input gate it, forget gate ft, output gate ot and cell state ct for particular iteration t with activation function
For backward GLSTM, the parameters are updated as follows in Eqs. (20) to (24).
4.6 Optimization of RNN-GLSTM with ADAM
The main objective of machine and deep learning is to reduce the difference between actual and predicted output which is called as cost or loss function. In order to choose the optimal value for the cost function, weight in cost function is updated using optimization algorithm while training the neural network. This will leads to enhance the result of prediction model. This proposed work uses ADAM optimizer [46,47] to update the weight. It is the most suggested optimization method for deep learning networks [48,49]. It takes advantages of stochastic gradient descent (SGD) algorithm and root mean square (RMS). This proposed PD classification model chose ADAM optimization due to the advantages such as it does not consume large memory, it uses second moment called uncentred variance of the gradients and first moment called mean.
Optimization algorithm
Step 1: Initialize 1st moment m1 = 0 and second moment m2 = 0 and iteration t = 0
Step2: bias of 1st and 2nd moment are updated according to Eqs. (20) and (21)
Step 3: bias corrected of 1st and 2nd moment are calculated according to Eqs. (22) and (23)
Step 4: parameters of RNN-GLSTM is updated as in Eqs. (24) to (27)
where
5 Proposed System Evaluation and Discussions
This section discusses about the validation and evaluation metrics used and evaluated results. Performance of the proposed system is compared with existing ML algorithms to prove the efficiency of the proposed PD diagnostic model. For experiment, dataset used in Section 3 was used and compared with conventional ML algorithms such as Multi layer perceptron (MLP), K-Nearest Neighbor (KNN), Random forest (RF) and Principal component analysis (PCA) with Support Vector Machine (SVM) are exhibited.
The output for the proposed RNN-GLSTM model has been evaluated with the evaluation metrics such as accuracy, precision, recall, F1 score and Mathew's correlation Coefficient (MCC) based on confusion matrix shown in Tab. 2, Fit time and score time .

From Tab. 2, accuracy, precision, recall, F1 score and MCC are denoted in Eq. from (28) to (32). MCC can be used with imbalanced dataset due to its robust evaluation characteristics.
Fit time: It is the time to fit the estimator on training data set for each cross validation split.
Score time: It is the time for scoring the estimator on testing dataset for each cross validation split.
The proposed PD diagnostic model RNN-GLSTM optimized by ADAM has been implemented in python Scikit-learn 0.22.1. The parameter settings of traditional ML models are shown in Tab. 3.
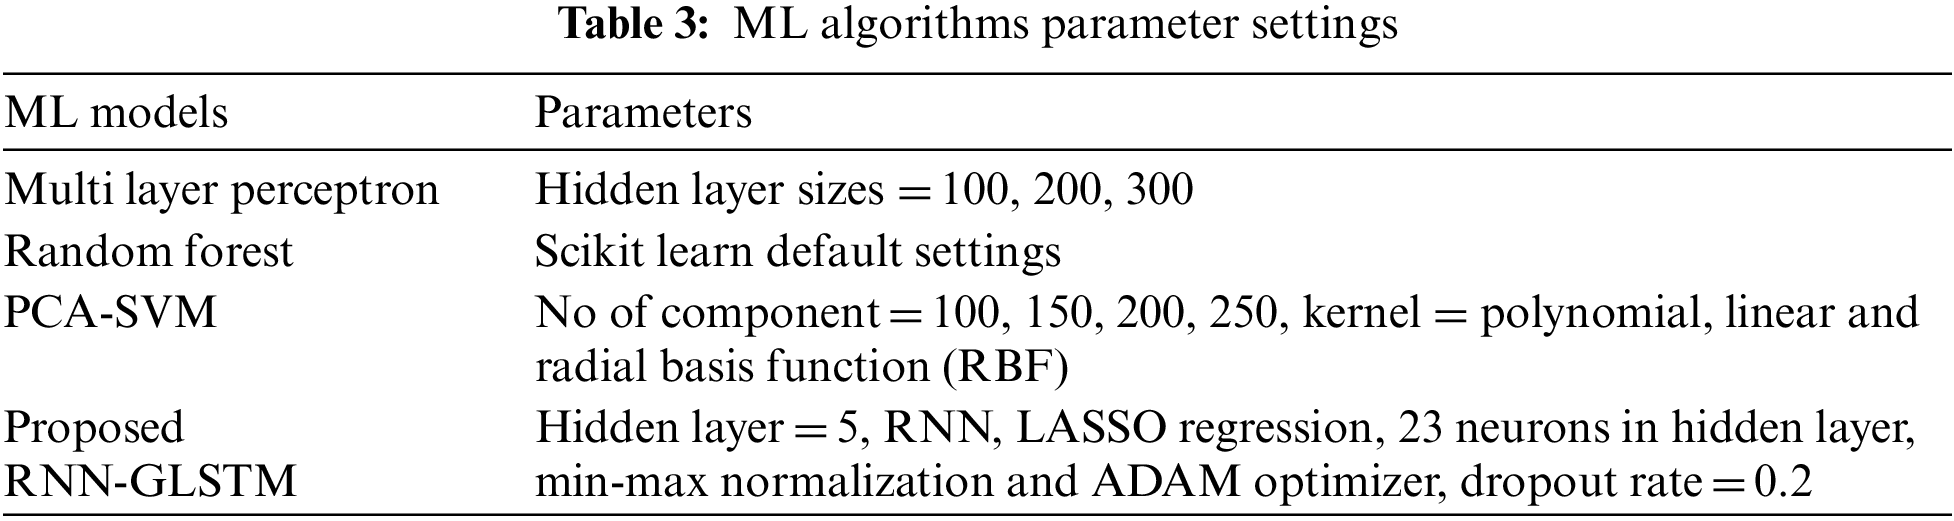
The simulation result of the proposed system with dimensionality reduction and optimization are shown in Tab. 3. For evaluation, various number of hyper parameters (H1, H2 and H3) are used for each layer. In our proposed work, 3 hidden layers are used. H1 is the number of neurons in first hidden layer, H2 is the number of neurons in second hidden layer and H3 is the number of neurons in third hidden layer of RNN-LSTM-ADAM in Tab. 4.

Experimental result in terms of different input speech signal on ML algorithms with proposed is discussed.
The MLP, RF and PCA-SVM were implemented in order to evaluate the performance of the proposed model. With the same set of training and testing data, PD prediction is made for all the models. From Fig. 7, it can be observed that random forest obtained least efficiency than other models and proposed RNN-GLSTM obtained high efficiency than other models in terms of the evaluation metrics. The proposed model obtained high accuracy of 91.21%, high F1 score of 85.02%, high precision of 86.72%, high recall value of 85.9% and high MCC value of 0.352.

Figure 7: Performance evaluation of proposed vs. conventional methods
Comparison in terms of standard dimensionality reduction and feature extraction methods and optimization. Compared to standard PCA with proposed classification model, proposed LDA with classification model obtained 93.5% of accuracy. Compared to standard ICA based feature extraction with proposed model shown in Tab. 5.

This paper presented an efficient PD diagnose model called Recurrent Neural Network based graph LSTM optimized with Adam optimizer. This proposed model used min-max normalization to scale the data values in the range [0,1], LDA based dimensionality reduction to transform the dataset into low dimensional space, SAE based feature extraction to consider the most relevant features for classification. This work used PD speech signal dataset and considered the dynamic features. Multiple evaluation in terms of dimensionality reduction, feature extraction methods were computed and the models is evaluated with various evaluation metrics. This classification model obtained 95.4% of accuracy, 93.4% of F1 score and 0.865 of MCC. In future, more features such as handwriting features are also considered for classification and explore this model to applicable on multi label classification with more deep learning based architectures.
Acknowledgement: The authors would like to acknowledge the support of Prince Sultan University for paying the Article Processing Charges (APC) of this publication.
Funding Statement: The authors extend their appreciation to the Deanship of Scientific Research at King Khalid University for funding this work under Grant Number (RGP 1/282/42). https://www.kku.edu.sa.
Conflicts of Interest: The authors declare that they have no conflicts of interest to report regarding the present study.
1. K. Wirdefeldt, H. O. Adami, P. Cole, D. Trichopoulos and J. Mandel, “Epidemiology and etiology of Parkinson's disease: A review of the evidence,” European Journal of Epidemiology, vol. 26, no. 1, pp. 1–12, 2011. [Google Scholar]
2. A. Q. Rana, U. S. Ahmed, Z. M. Chaudry and S. Vasan, “Parkinson's disease: A review of non-motor symptoms,” Expert Review of Neurotherapeutics, vol. 15, no. 5, pp. 549–562, 2015. [Google Scholar]
3. L. Naranjo, C. J. Perez, Y. Campos Roca and J. Martin, “Addressing voice recording replications for Parkinson's disease detection,” Expert Systems with Applications, vol. 46, pp. 286–292, 2016. [Google Scholar]
4. L. Ali, C. Zhu, M. Zhou and Y. Liu, “Early diagnosis of Parkinson's disease from multiple voice recordings by simultaneous sample and feature selection,” Expert Systems with Applications, vol. 137, pp. 22–28, 2019. [Google Scholar]
5. İ Cantürk and F. Karabiber, “A machine learning system for the diagnosis of Parkinson's disease from speech signals and its application to multiple speech signal types,” Arabian Journal for Science and Engineering, vol. 41, no. 12, pp. 5049–5059, 2016. [Google Scholar]
6. M. Shanmugam, S. Nehru and S. Shanmugam, “A wearable embedded device for chronic low back patients to track lumbar spine position,” Biomedical Research, vol.29, pp. S118–S123, 2018. [Google Scholar]
7. V. Delić, Z. Perić, M. Sečujski, N. Jakovljević, J. Nikolić et al., “Speech technology progress based on new machine learning paradigm,” Computational Intelligence and Neuroscience, vol. 2019, pp. 1–19, 2019. [Google Scholar]
8. K. Chenausky, J. MacAuslan and R. Goldhor, “Acoustic analysis of PD speech,” Parkinson's Disease, vol. 2011, pp. 1–13, 2011. [Google Scholar]
9. C. O. Sakar and O. Kursun, “Telediagnosis of Parkinson's disease using measurements of dysphonia,” Journal of Medical Systems, vol. 34, no. 4, pp. 591–599, 2010. [Google Scholar]
10. M. Can, “Neural networks to diagnose the Parkinson's disease,” Southeast Europe Journal of Soft Computing, vol. 2, no. 1, pp. 15467–15479, 2013. [Google Scholar]
11. J. S. Almeida, P. P. Rebouças Filho, T. Carneiro, W. Wei, R. Damaševičius et al., “Detecting Parkinson's disease with sustained phonation and speech signals using machine learning techniques,” Pattern Recognition Letters, vol. 125, pp. 55–62, 2019. [Google Scholar]
12. F. Åström and R. Koker, “A parallel neural network approach to prediction of Parkinson's disease,” Expert Systems with Applications, vol. 38, no. 10, pp. 12470–12474, 2011. [Google Scholar]
13. C. Ma, J. Ouyang, H. L. Chen and X. H. Zhao, “An efficient diagnosis system for Parkinson's disease using kernel-based extreme learning machine with subtractive clustering features weighting approach,” Computational and Mathematical Methods in Medicine, vol. 2014, pp. 1–14, 2014. [Google Scholar]
14. S. Lahmiri, “Parkinson's disease detection based on dysphonia measurements,” Physica A: Statistical Mechanics and its Applications, vol. 471, pp. 98–105, 2017. [Google Scholar]
15. K. Kavin Kumar, M. Devi and S. Maheswaran, “An efficient method for brain tumor detection using texture features and SVM classifier in MR images,” Asian Pacific Journal of Cancer Prevention, vol. 19, no. 10, pp. 2789, 2018. [Google Scholar]
16. M. Nawir, A. Amir, N. Yaakob and O. B. Lynn, “Effective and efficient network anomaly detection system using machine learning algorithm,” Bulletin of Electrical Engineering and Informatics, vol. 8, no. 1, pp. 46–51, 2019. [Google Scholar]
17. D. Kollias, A. Tagaris, A. Stafylopatis, S. Kollias and G. Tagaris, “Deep neural architectures for prediction in healthcare,” Complex & Intelligent Systems, vol. 4, no. 2, pp. 119–131, 2018. [Google Scholar]
18. R. M. Sadek, S. A. Mohammed, A. R. K. Abunbehan, A. K. H. A. Ghattas, M. R. Badawi et al., “Parkinson's disease prediction using artificial neural network,” International Journal of Academic Health and Medical Research, vol. 3, no. 1, pp. 1–8, 2019. [Google Scholar]
19. R. A. Shirvan and E. Tahami, “Voice analysis for detecting Parkinson's disease using genetic algorithm and KNN classification method,” in Proc. 18th Iranian Conf. of Biomedical Engineering (ICBME), Tehran, Iran, IEEE, pp. 278–283, 2011. [Google Scholar]
20. C. Wang, C. Deng and S. Wang, “Imbalance-XGBoost: Leveraging weighted and focal losses for binary label-imbalanced classification with XGBoost,” Pattern Recognition Letters, vol. 136, pp. 190–197, 2020. [Google Scholar]
21. E. Vaiciukynas, A. Verikas, A. Gelzinis and M. Bacauskiene, “Detecting Parkinson's disease from sustained phonation and speech signals,” PloS One, vol. 12, no. 10, pp. e0185613, 2017. [Google Scholar]
22. S. Lahmiri, D. A. Dawson and A. Shmuel, “Performance of machine learning methods in diagnosing Parkinson's disease based on dysphonia measures,” Biomedical Engineering Letters, vol. 8, no. 1, pp. 29–39, 2018. [Google Scholar]
23. M. Shahbakhi, D. T. Far and E. Tahami, “Speech analysis for diagnosis of Parkinson's disease using genetic algorithm and support vector machine,” Journal of Biomedical Science and Engineering, vol. 2014, pp. 147–156, 2014. [Google Scholar]
24. J. Xu, L. Xiang, Q. Liu, H. Gilmore, J. Wu et al., “Stacked sparse autoencoder (SSAE) for nuclei detection on breast cancer histopathology images,” IEEE Transactions on Medical Imaging, vol. 35, no. 1, pp. 119–130, 2015. [Google Scholar]
25. B. K. Reddy and D. Delen, “Predicting hospital readmission for lupus patients: An RNN-LSTM-based deep-learning methodology,” Computers in Biology and Medicine, vol. 101, pp. 199–209, 2018. [Google Scholar]
26. A. Sharma and R. N. Giri, “Automatic recognition of Parkinson's disease via artificial neural network and support vector machine,” International Journal of Innovative Technology and Exploring Engineering, vol. 4, no. 3, pp. 2278–3075, 2014. [Google Scholar]
27. C. O. Sakar, G. Serbes, A. Gunduz, H. C. Tunc, H. Nizam et al., “A comparative analysis of speech signal processing algorithms for Parkinson's disease classification and the use of the tunable Q-factor wavelet transform,” Applied Soft Computing, vol. 74, pp. 255–263, 2019. [Google Scholar]
28. H. Gunduz, “Deep learning-based Parkinson's disease classification using vocal feature sets,” IEEE Access, vol. 7, pp. 115540–115551, 2019. [Google Scholar]
29. S. Bouchikhi, A. Boublenza, A. Benosman and M. Chikh, “Parkinson's disease detection with SVM classifier and relief-F features selection algorithm,” South East European. Journal of Soft Compuing, vol. 2, no. 1, pp. 1–4, 2013. [Google Scholar]
30. D. Hemmerling and D. Sztaho, “Parkinson's disease classification based on vowel sound,” in Journal of Speech, Language, and Hearing Research, vol. 56, no. 5, pp. 1485–1502, 2019. [Google Scholar]
31. L. Parisi, N. Ravi Chandran and M. L. Manaog, “Feature-driven machine learning to improve early diagnosis of Parkinson's disease,” Expert Systems with Applications, vol. 110, pp. 182–190, 2018. [Google Scholar]
32. A. Caliskan, H. Badem, A. Basturk and M. E. Yuksel, “Diagnosis of the Parkinson disease by using deep neural network classifier,” IU-Journal of Electrical & Electronics Engineering, vol. 17, no. 2, pp. 3311–3318, 2017. [Google Scholar]
33. J. C. Vásquez Correa, J. R. Orozco Arroyave and E. Nöth, “Convolutional neural network to model articulation impairments in patients with Parkinson's disease,” in INTERSPEECH, Stockholm, pp. 314–318, 2017. [Google Scholar]
34. K. I. Funahashi and Y. Nakamura, “Approximation of dynamical systems by continuous time recurrent neural networks,” Neural Networks, vol. 6, no. 6, pp. 801–806, 1993. [Google Scholar]
35. S. Hochreiter and J. Schmidhuber, “Long short-term memory,” Neural Computation, vol. 9, no. 8, pp. 1735–1780, 1997. [Google Scholar]
36. M. Little, P. McSharry, E. Hunter, J. Spielman and L. Ramig, “Suitability of dysphonia measurements for telemonitoring of Parkinson's disease,” Nature Precedings, 2008. [Google Scholar]
37. M. Farrús, J. Hernando and P. Ejarque, “Jitter and shimmer measurements for speaker recognition,” in Proc. 8th Annual Conf. of the Int. Speech Communication Association, Antwerp, Belgium, pp. 778–781, 2007. [Google Scholar]
38. M. Little, P. McSharry, S. Roberts, D. Costello and I. Moroz, “Exploiting nonlinear recurrence and fractal scaling properties for voice disorder detection,” Nature Precedings, vol. 23, pp. 1–10, 2007. [Google Scholar]
39. M. L. Raymer, W. F. Punch, E. D. Goodman, L. A. Kuhn and A. K. Jain, “Dimensionality reduction using genetic algorithms,” IEEE Transactions on Evolutionary Computation, vol. 4, no. 2, pp. 164–171, 2000. [Google Scholar]
40. Y. Liu, L. Chen and C. Zhu, “Improved robust tensor principal component analysis via low-rank core matrix,” IEEE Journal of Selected Topics in Signal Processing, vol. 12, no. 6, pp. 1378–1389, 2018. [Google Scholar]
41. M. Kang, K. Ji, X. Leng, X. Xing and H. Zou, “Synthetic aperture radar target recognition with feature fusion based on a stacked autoencoder,” Sensors, vol. 17, no. 1, pp. 192, 2017. [Google Scholar]
42. J. Leng and P. Jiang, “A deep learning approach for relationship extraction from interaction context in social manufacturing paradigm,” Knowledge-Based Systems, vol. 100, pp. 188–199, 2016. [Google Scholar]
43. B. A. Olshausen and D. J. Field, “Emergence of simple-cell receptive field properties by learning a sparse code for natural images,” Nature, vol. 381, no. 6583, pp. 607–609, 1996. [Google Scholar]
44. M. Hoq, M. N. Uddin and S. B. Park, “Vocal feature extraction based artificial intelligent model for Parkinson's disease detection,” Diagnostics, vol. 11, no. 6, pp. 1076, 2021. [Google Scholar]
45. A. NG, “Sparse autoencoder,” CS294A Lecture Notes, vol. 72, no. 2011, pp. 1–19, 2011. [Google Scholar]
46. D. P. Kingma and J. Ba, “Adam: A method for stochastic optimization,” Arxiv Preprint Arxiv:1412.6980, 2014. [Google Scholar]
47. S. Bock, J. Goppold and M. Weiß, “An improvement of the convergence proof of the ADAM-optimizer,” Arxiv Preprint Arxiv:1804.10587, 2018. [Google Scholar]
48. S. Manikandan and M. Chinnadurai, “Effective energy adaptive and consumption in wireless sensor network using distributed source coding and sampling techniques,” Wireless Personal Communication, vol. 118, no. 2, pp. 1393–1404, 2021. [Google Scholar]
49. P. Palani Murugan, M. Chinnadurai and S. Manikandan, “Tour planning design for mobile robots using pruned adaptive resonance theory networks,” Computers, Materials & Continua, vol. 70, no. 1, pp. 181–194, 2022. [Google Scholar]
 | This work is licensed under a Creative Commons Attribution 4.0 International License, which permits unrestricted use, distribution, and reproduction in any medium, provided the original work is properly cited. |