DOI:10.32604/cmc.2022.024618
| Computers, Materials & Continua DOI:10.32604/cmc.2022.024618 | |
| Article |
Artificial Intelligence-Based Fusion Model for Paddy Leaf Disease Detection and Classification
1Department of Information Systems, College of Computer and Information Sciences, Prince Sultan University, Riyadh, 11586, Saudi Arabia
2Department of Information Systems, College of Science and Arts, King Khalid University, Muhayel Aseer, 62529, Saudi Arabia
3Department of Information Systems-Girls Section, King Khalid University, Muhayel Aseer, 62529, Saudi Arabia
4Department of Natural and Applied Sciences, College of Community-Aflaj, Prince Sattam bin Abdulaziz University, Aflaj, 16828, Saudi Arabia
5Computer Science Department, Community College-Girls Section, King Khalid University, Muhayel Aseer, 62529, Saudi Arabia
6Department of Computer and Self Development, Preparatory Year Deanship, Prince Sattam bin Abdulaziz University, Al-Kharj, 16278, Saudi Arabia
*Corresponding Author: Manar Ahmed Hamza. Email: ma.hamza@psau.edu.sa
Received: 25 October 2021; Accepted: 05 January 2022
Abstract: In agriculture, rice plant disease diagnosis has become a challenging issue, and early identification of this disease can avoid huge loss incurred from less crop productivity. Some of the recently-developed computer vision and Deep Learning (DL) approaches can be commonly employed in designing effective models for rice plant disease detection and classification processes. With this motivation, the current research work devises an Efficient Deep Learning based Fusion Model for Rice Plant Disease (EDLFM-RPD) detection and classification. The aim of the proposed EDLFM-RPD technique is to detect and classify different kinds of rice plant diseases in a proficient manner. In addition, EDLFM-RPD technique involves median filtering-based preprocessing and K-means segmentation to determine the infected portions. The study also used a fusion of handcrafted Gray Level Co-occurrence Matrix (GLCM) and Inception-based deep features to derive the features. Finally, Salp Swarm Optimization with Fuzzy Support Vector Machine (FSVM) model is utilized for classification. In order to validate the enhanced outcomes of EDLFM-RPD technique, a series of simulations was conducted. The results were assessed under different measures. The obtained values infer the improved performance of EDLFM-RPD technique over recent approaches and achieved a maximum accuracy of 96.170%.
Keywords: Rice plant disease; classification model; artificial intelligence; deep learning; fusion model; parameter optimization
Early detection of pests and plant diseases is one of the challenging problems in the domain of agriculture. In India, rice is accountable for 70% of overall crop production and 93% overall production in terms of grain yield. For this reason, early detection of diseases in paddy plants is of national importance to ensure the productivity of staple in India [1]. Identification and classification of pests and plant diseases remain the main challenge faced in the field of agriculture. Insect damages the crops in almost every stage which in turn affects the yield of crops. Classification of insects that damages the crops is a tedious process, due to high number of connections and complex formation in the emergence of distinct species. However, it is crucial to recognize, categorize and reduce the infection of insects that cause damage to crops, mainly by selecting effective pesticide and biological systems to avoid less yield and heavy damage to the crops [2,3].
In general, few factors that include weather conditions i.e., temperature/moisture, abnormal fertilization unfavourable conditions such as stress, and imbalanced soil nutrient [4] affect the crop yield. In addition to these, if the crops are prematurely harvested and placed in heap, gets damaged by natural phenomena such as cyclone/strong wind, because of collision of panicle and attack of pests at the time of grain formation, these conditions might result in the formation of discoloured grains. Deep Learning (DL) techniques have triggered large expectations in image classification. These methods function on the basis of feature learning from labelled training datasets. Further, these methods have been utilized earlier in recognizing the diseases that affect apple, tea, grapes, tomato, pears, and peaches. Generally, the methods utilize leaves’ images to recognize the diseases. In this background, images are utilized from a homogeneous background [5] for this study. Moreover, the data is accessible from different sources on internet.
Every disease has their own special feature. A disease can be identified based on its impact upon the host i.e., plant, in terms of colour, shape, and size of disease symptoms. Some plant diseases induce the plant to exhibit similar colours, but distinct shapes; while some have distinct colours, but similar shapes. Occasionally, farmers get confused owing to these differences and fail to take appropriate action for pesticide selection [6]. One of the ways to avoid crop loss that occurs due to disease infection is by capturing the images of infected leaves, identifying the data about the disease and taking precautionary measures or corrections measures to overcome the disease. As an automated solution to these problems, cameras can be installed across the fields at specific distance for periodic capturing of the images. This image can be transmitted to the main system for disease analysis; the system can identify the disease, provide data about the selection of pesticides and measures to control the disease. These systems, based on their training knowledge, automatically recognize the diseases that occurred earlier. In this background, the aim of this study is to demonstrate how Machine Learning (ML) methods can be made use of in other fields like agriculture [7]. One of the crucial segment in deploying ML fields is the choice of better features. Only, disease-based features can be extracted after the segmentation of non-disease and disease parts. So, it is crucial that the main component of this study is to extract leaf parts from disease portion (most plants have green colour leaves), which is a critical phase in determining the quality of feature.
In order to attain Artificial Intelligence (AI)-enabled accurate and rapid disease recognition, Wang et al. [8] presented the Attention-based Depthwise Separable Neural Network with Bayesian Optimization (ADSNN-BO) algorithm-based augmented attention mechanism and MobileNet structure. Furthermore, Bayesian optimization algorithm was also employed for fine tuning the hyperparameter of the system. Cross-validated classification experiment was carried out, according to public rice disease datasets with four classes in total. The stimulation result demonstrated that the proposed architecture attained 94.65% test accuracy. In Chen et al. [9], MobileNet-V2, pretrained on ImageNet, was selected as the backbone network to improve the learning capacity for minute lesion feature. Further, the study also added attention mechanism to learn the significance of spatial points and inter-channel relationships for input feature. Meanwhile, loss function got improved and Transfer Learning (TL) method was implemented twice for training the model.
In Zhang et al. [10], a group of automated diagnosis and detection approaches, integrated with spectral and image analysis, was presented to detect different diseases that are broadly deleterious. The method also checked the quality of rice and yields. This research presented a stepwise methodology to detect rice sheath blight. Temniranrat et al. [11] proposed an object refinement process and detection model training to enhance the performance of prior studies on rice leaf disease recognition. This method depends upon examining the model prediction outcomes and can be used recurrently to improve the quality of dataset in training the following model. Deployment framework was chosen from the elected performances in prior studies i.e., You Only Look Once (YOLO) v3 and is trained by the refined trained dataset.
Jiang et al. [12] focused on three types of rice leaves’ disease and two types of wheat leaf disease. The researchers gathered a total of 40 images of all the leaf diseases and improved them. This study focused on improving the Visual Geometry Group (VGG-16) method depending on the concept of multitask learning. It utilized pretraining method on ImageNET for alternate learning and TL method. In Krishnamoorthy et al. [13], InceptionResNetV2, a kind of Convolutional Neural Network (CNN) was used by TL method to recognize the diseases in rice leaf images. The parameter of the presented method enhanced the classification task and attained a better performance.
Bhoi et al. [14], proposed an Internet of Things (IoT)-enabled Unmanned Aerial Vehicles (UAVs)-enabled rice pest detection method with Imagga cloud to recognize the pest in rice, at the time of crop production. This IoT-enabled UAV model focused on Python programming and AI model to send the rice pest images to cloud and provide the pesticide data. It decides the pesticide after determining the confidence value with tags. Tiwari et al. [15] presented a DL-based method for plant diseases’ classification and detection from leaf images, captured in different resolutions. A dense CNN framework undergone training on huge plant leaf image datasets from many nations and was used in this study.
The objective of the proposed technique is to detect and classify different kinds of rice plant diseases proficiently, thereby avoiding the loss of crop productivity.
The current research paper devises an Efficient Deep Learning-based Fusion Approach for Rice Plant Disease (EDLFM-RPD) diagnosis. In addition, EDLFM-RPD technique involves Median Filtering (MF)-based preprocessing and K-means segmentation to determine the infected portions. Further, a fusion of handcrafted Graylevel Co-occurrence Matrix (GLCM) and Inception-based deep feature was conducted to derive the features. Finally, Fuzzy Support Vector Machine (FSVM) model was utilized for classification. In order to validate the enhanced outcomes of the proposed EDLFM-RPD technique, a series of simulations was conducted and the results were reviewed under different aspects.
The upcoming portions of the study are planned as follows. Section 2 elaborates the proposed EDLFM-RPD technique and a detailed discussion of results is given in Section 3. At last, the concluding remarks are drawn in Section 4.
In this study, a new EDLFM-RPD technique is presented to proficiently detect and classify different kinds of rice plant diseases, thereby avoiding the loss in crop productivity. The proposed EDLFM-RPD technique encompasses preprocessing, K-means segmentation, fusion-based feature extraction, and FSVM-based classification. A comprehensive work of every module is discussed in succeeding sections.
MF is a non-linear procedure that is helpful in decreasing impulsive or salt-and-pepper noise. It is also helpful in maintaining the edge from images, but decreases the arbitrary noise. Impulsive noise occurs due to arbitrary bit error under transmission channel [16]. MF smoothens the images and so it is helpful in decreasing the noise. Unlike low pass filter, MF preserves the discontinuity from a step purpose and smoothens some pixels whose value differs considerably, from its surrounding, without affecting another pixel.
Clustering is a technique to divide a group of data under particular sets of groups. One of the most famous clustering techniques is k-means cluster. K-means cluster splits a group of data into k number of data collected for the study.
It categorizes the provided group of data under k amount of disjoint clusters. There are two distinct stages present in K-means technique. The primary stage computes k centroid whereas secondary stage gets all the points to cluster i.e., adjacent centroid in respective data points. Several techniques are used to define the distance of nearby centroids whereas the most utilized technique is Euclidean distance. When the grouping is completed, it recomputes a novel centroid of all the clusters. Based on this centroids, a novel Euclidean distance is computed amongst all the centers and all data points. Then, the point is allocated from the cluster with minimal Euclidean distance. All the separated clusters are determined as their member objects and within their centroids. The centroid to all the cluster points to the sum of distance in every object from that cluster gets minimized [17]. Therefore,
Assume an image with resolution
1. Initializing the amount of cluster k and centre.
2. To all the pixels of an image, compute the Euclidean distance d, among the center and all pixels of image based on the relation given herewith.
3. Allocate every pixel to adjacent centre, depending upon distance d.
4. Afterward, each pixel is allocated and then the novel place of centre is recomputed based on the relation given herewith.
5. Repeat the procedure till it fulfills the tolerance or error value.
6. Reshape the cluster pixel as to image.
When primary centroid is arbitrarily selected, it attains distinct outcomes to different primary centers. Thus, the primary center is carefully selected so that it can obtain the desired segmentation. Some other terms are also required in addition to computational difficulty while the development of
2.3 Fusion Based Feature Extraction
In this phase, GLCM and Inception features are fused together to derive a set of feature vectors. In general, GLCM is meant to be a statistical method with spatial connection among the pixels. Here, five varied texture features are explained in
where m indicates the mean value of
CNN has a total of five layers such as input, convolution, pooled, Fully Connected (FC), and output. GoogLeNet network is intended to make CNN, an utilizable element by Google. It implements the Inception network approach, which restricts the amount of network attributes and improves the depth of systems. So, it can be widely utilized in image classification processes. Fig. 1 shows the sample of usual CNN.
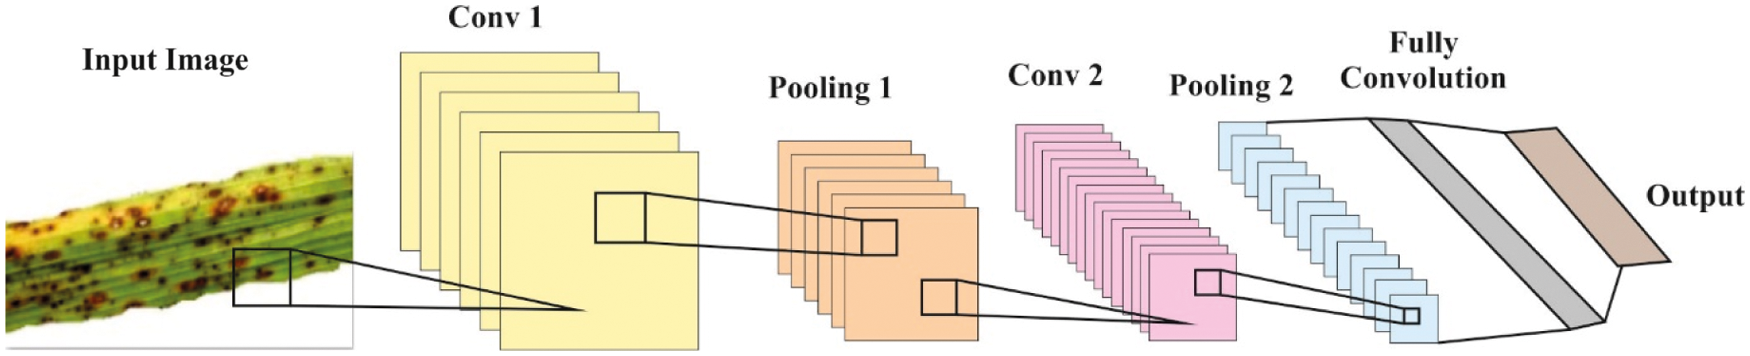
Figure 1: Structure of CNN
Convolutional layer obtains various layers in Neural Network (NN) while not every pixel is connected to future layer with weight and bias. But the entire image gets separated to a small area, while weight and bias are utilized. Here, Pooling layer is executed to decrease the spatial dimensions of image and parameter counts and minimize the processes. It carries out a set function to input due to lack of some parameters. Distinct kinds of pooling layers are available such as average, stochastic, and max pooling. At this point, the flattened outcome of final pooling layer is fed as input to FC layer. It performs the role of CNN in every neuron of the present layer which is connected to present layer. Therefore, the number of parameters should be the maximum than convolutional layer. This FC layer is linked with resultant layer i.e., classifier.
Activation function
The diverse activation function is implemented on various frameworks of CNN. Non-linear activation function is demonstrated with better results than previous sigmoid or tangent functions. Non-linear functions are executed to enhance the training speed. So, distinct activation functions are implemented and Rectified Linear Unit (ReLU) is a remarkable technique compared to other such techniques.
CNN learning technique depends on vector calculus and chain rule. Let z is scalar (for instance,
Particularly,
During fractional derivative of
The cost or loss function is employed to measure the alteration amongst the forecast of CNN
Filter f is sized at
The probability of every label
Cross Entropy (CE) loss can be differentiated with respect to logit
Then, it can be understood that CE is calculated as given herewith.
Therefore, label-smoothing regularization is similar to be applied as a single CE loss
The main objective of GoogLeNet network is Inception network framework while GoogLeNet technique is called Inception networks [19]. It encompasses maximal GoogLeNet version and is classified as distinct versions such as Inception v1, Inception v2, Inception v3, Inception v4, and Inception-ResNet. Therefore, Inception usually has three sizes of convolutional and maximal pooling layers. The outcomes of the network from preceding layer are determined as channel has gathered the information, when implementation of convolutional task and non-linear fusion is performed. Also, the express purpose of this network is to have appropriate and improved distinct scales and remove the over-fitting issues. Inception v3 signifies the network framework utilized by Keras. For sample, a 3 * 3 convolutional is separated as 3 * 1 and 1 * 3 convolutional layers. By utilizing this partition technique, the amount of attributes are restricted; so, training speed of the network gets triggered, while removing the spatial feature from efficient model. Concurrently, Inception v3 optimizes the Inception model with the help of three distinct-sized grids namely, 35 * 35, 17 * 17, and 8 * 8.
Data fusion is applied in different computer vision and ML fields. Feature fusion is an important process, which incorporates the maximum number of feature vectors. The proposed technique is based on fusion of features using entropy. Furthermore, the features are attained and integrated with individual vectors. It is expressed as follows.
Next, feature extraction is integrated as an individual vector.
whereas f indicates a fused vector. Entropy is performed on features vector to elect the features as follows.
In Eqs. (18) and (19), p represents the feature likelihood and
Finally, FSVM model is applied to determine the classes that exist in rice plant image. In traditional Support Vector Machine (SVM), each data point is considered to have equally importance and is allocated a similar penal variable in its objective function. To address this issue, FSVM system is proposed. Fuzzy memberships are proposed to each sample point; therefore, distinct instance points can create different contributions to the creation of decision surfaces. Fig. 2 depicts the hyperplane of SVM model.
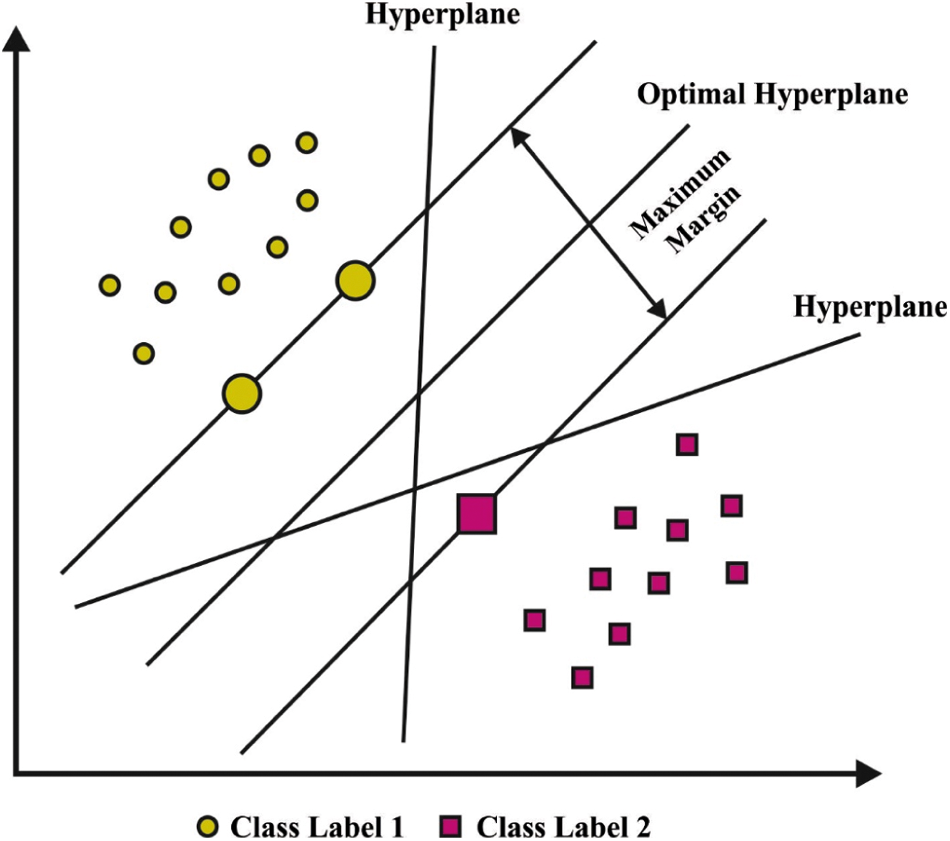
Figure 2: SVM model
Consider training instance as follows
Whereas
While w signifies the standard vector for splitting hyperplane, b means bias term, and C implies the variable that should be described before controlling the trade-offs between cost of misclassification error and classification margin [20]. Subsequently,
Like regular SVM, the aforementioned representation has a small variation, i.e., upper bound of
This section investigates the performance of the proposed EDLFM-RPD technique in terms of rice plant disease detection and classification. The model was validated against a benchmark dataset [21] that comprises of 40 images under Bacterial Leaf Blight (BLB), Brown Spot (BS), and Leaf Smut (LS).
Fig. 3 demonstrates the confusion matrices generated by the proposed EDLFM-RPD technique on classification of rice plant disease images under five runs. With run-1, EDLFM-RPD technique classified 35 images under class 0, 36 images under class 1, and 36 images under class 2. Similarly, with run-3, EDLFM-RPD technique classified 40 images under class 0, 34 images under class 1, and 37 images under class 2. Lastly, with run-5, EDLFM-RPD technique classified 39 images under class 0, 36 images under class 1, and 34 images under class 2.
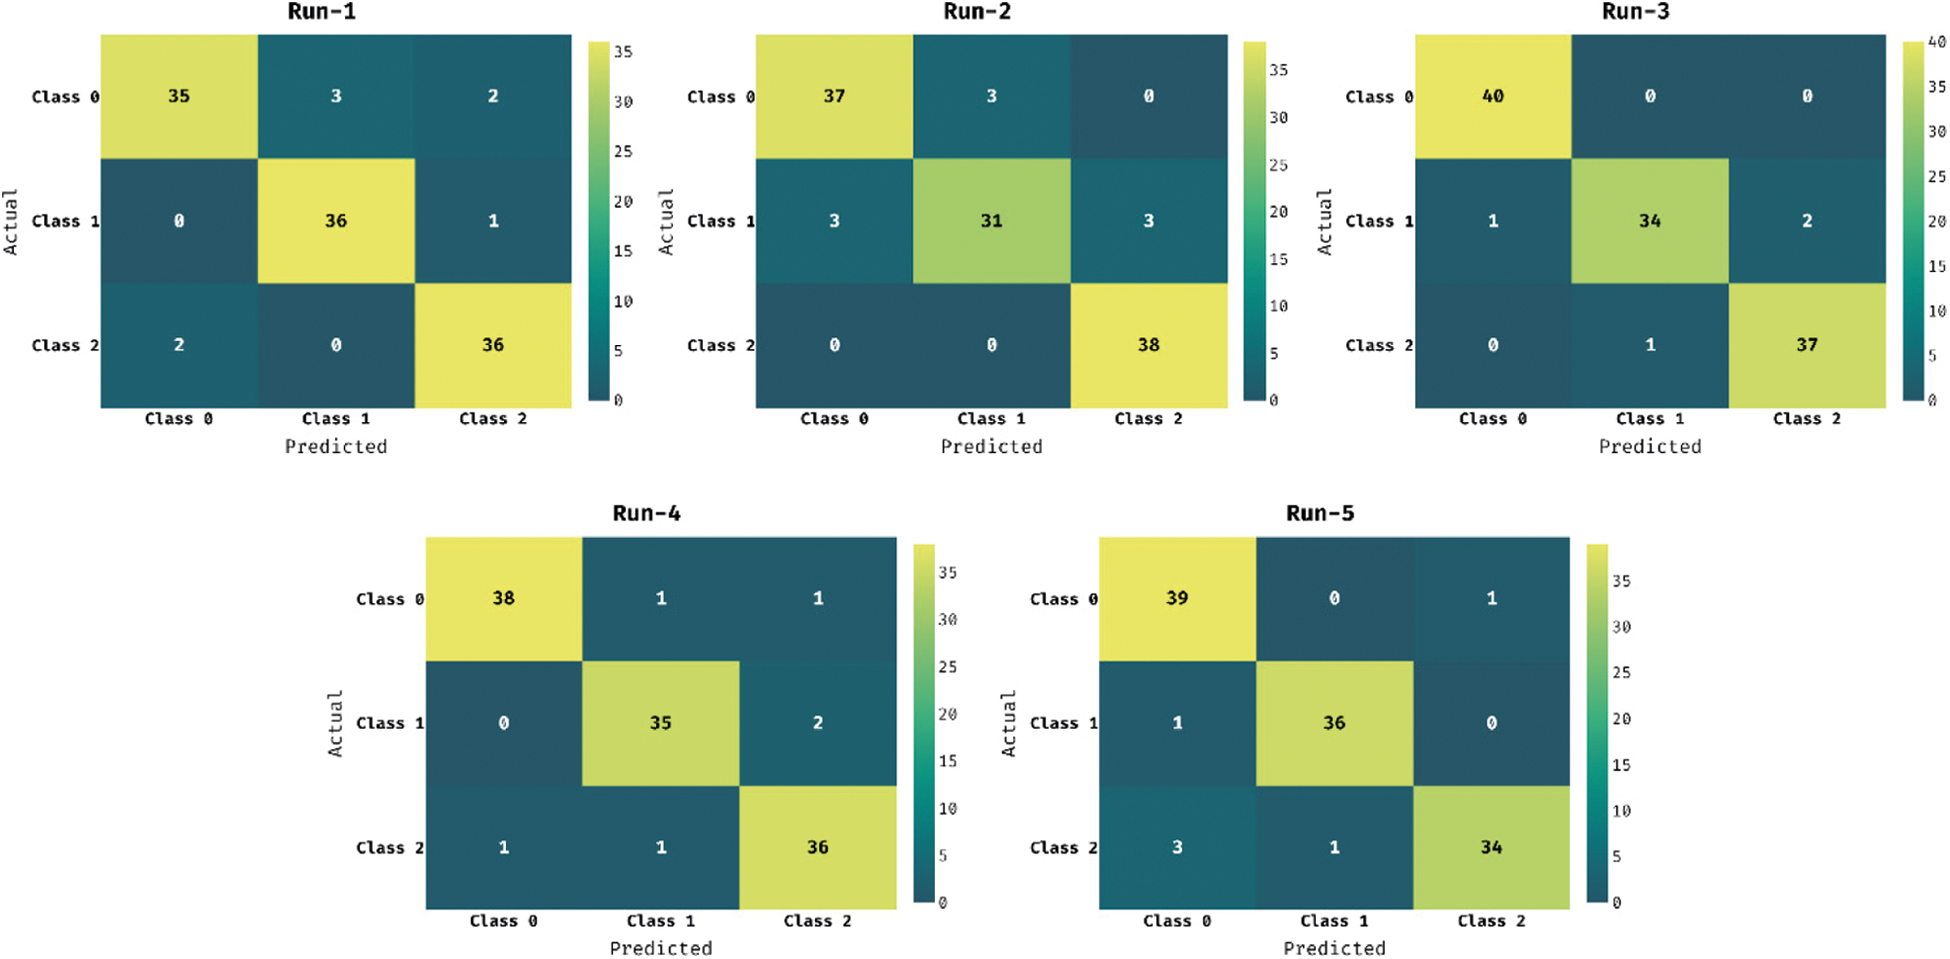
Figure 3: Confusion matrix of EDLFM-RPD model
Tab. 1 shows the results from overall classification analysis accomplished by EDLFM-RPD technique. The table values denote that the proposed EDLFM-RPD technique identified the class labels effectually under distinct test runs. For instance, with run-1, the EDLFM-RPD technique achieved
Fig. 4 illustrates the results of accuracy graph analysis attained by EDLFM-RPD technique on test dataset. The figure depicts that the proposed EDLFM-RPD technique improved both training and validation accuracies.
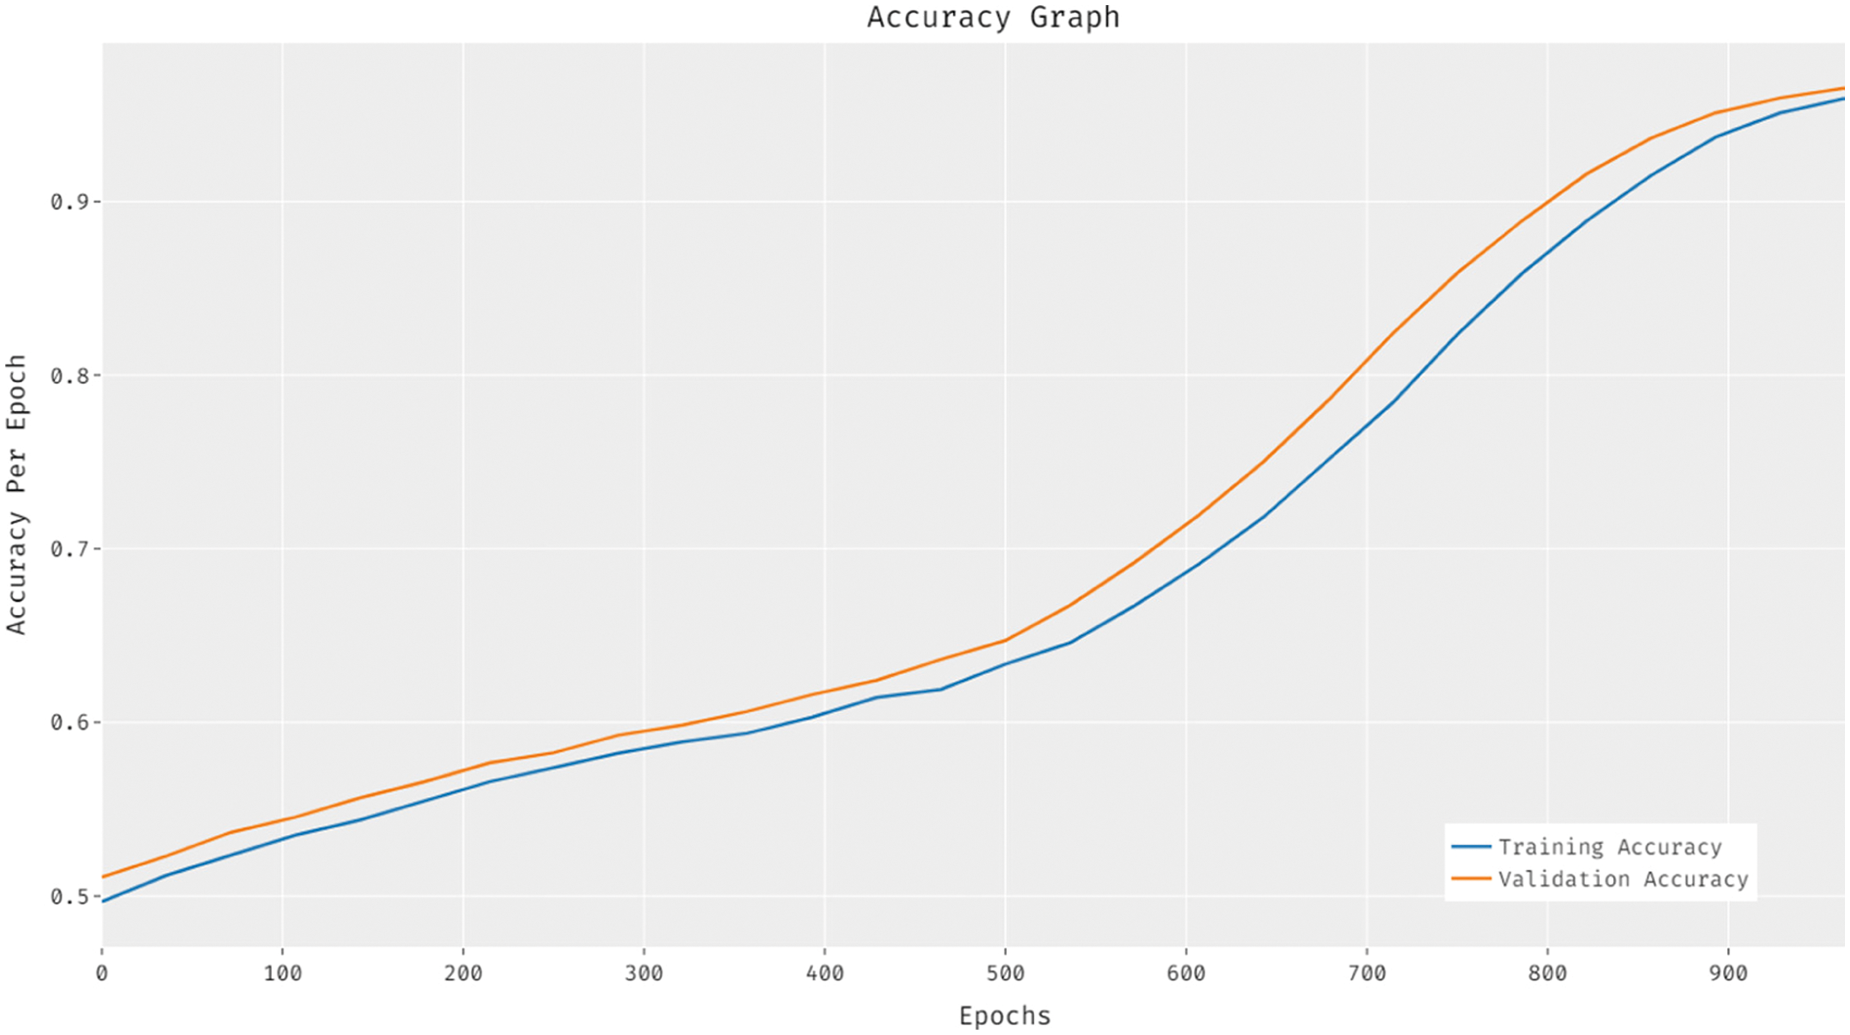
Figure 4: Accuracy analysis results of EDLFM-RPD model
Fig. 5 demonstrates the loss graph analysis results accomplished by EDLFM-RPD technique on test dataset. The figure portrays that the proposed EDLFM-RPD technique reduced both training and validation losses.
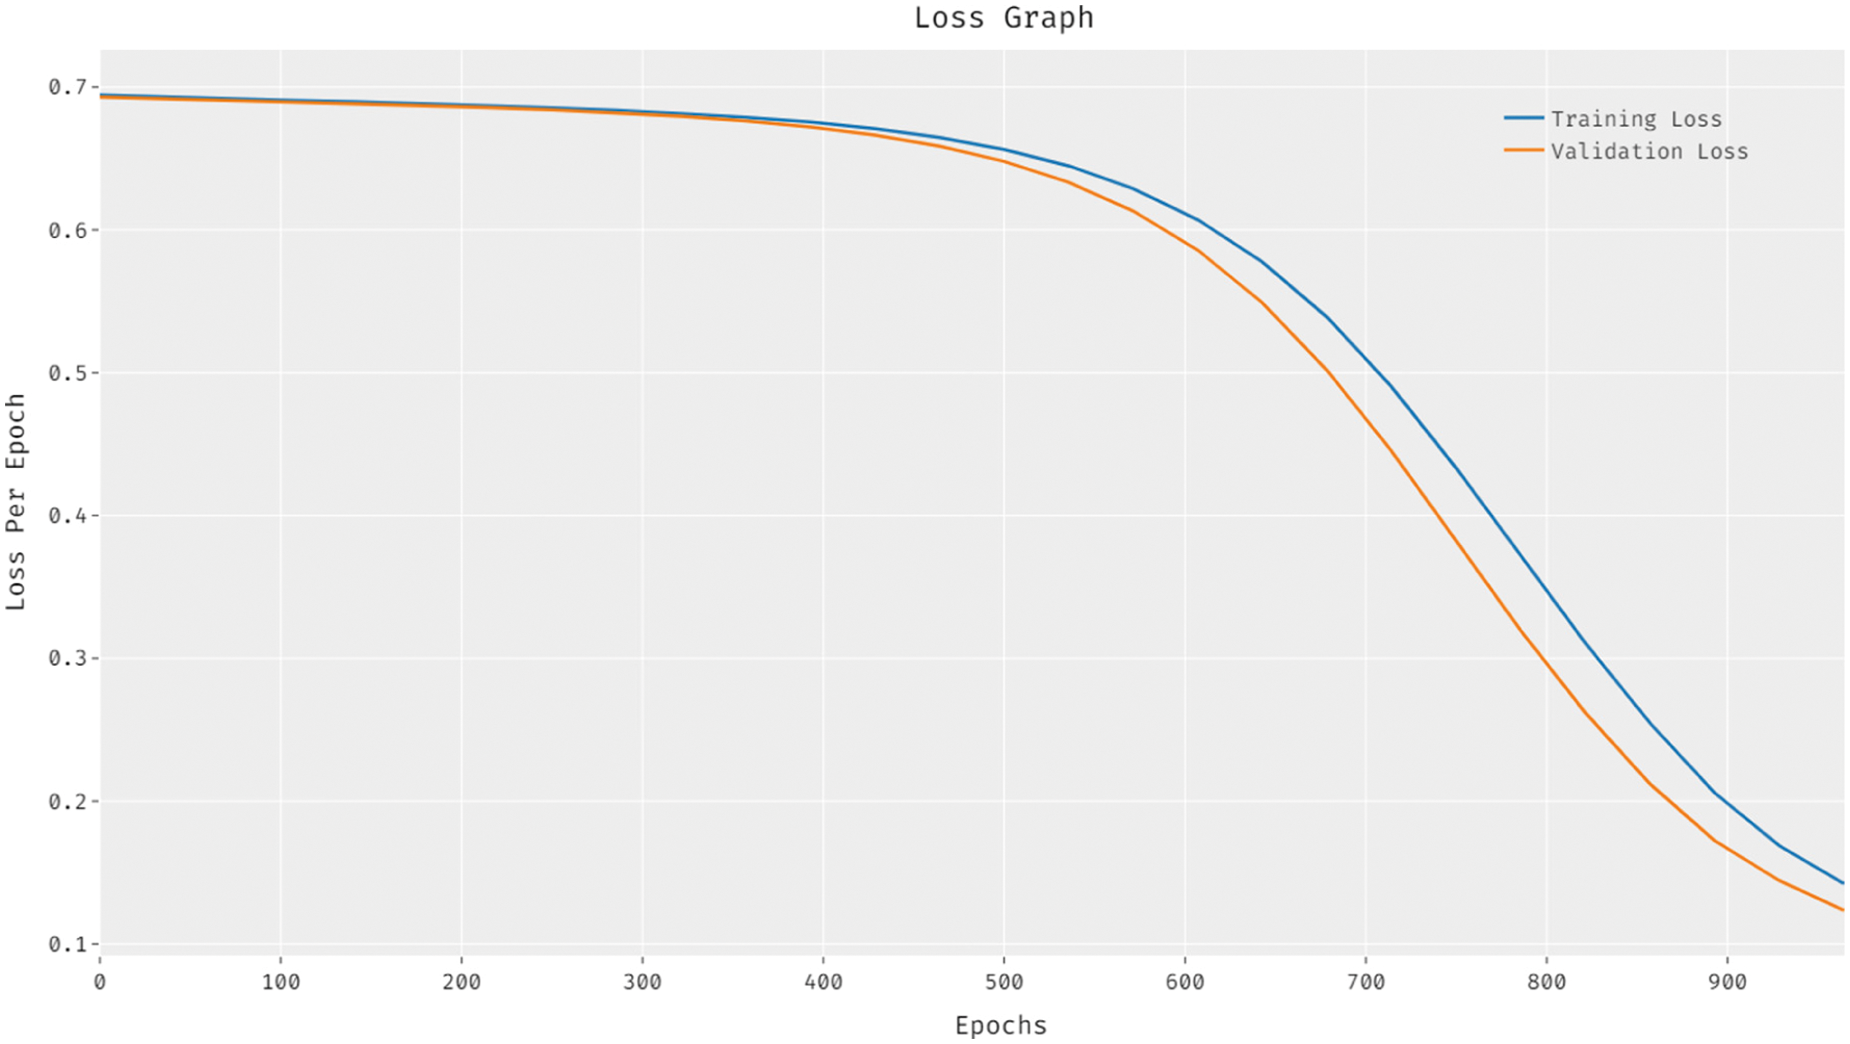
Figure 5: Loss analysis results of EDLFM-RPD model
Fig. 6 reports the Receiver Operating Characteristic (ROC) analysis results achieved by the proposed EDLFM-RPD technique on test dataset. The figure implies that EDLFM-RPD technique gained a higher ROC of 99.2300.
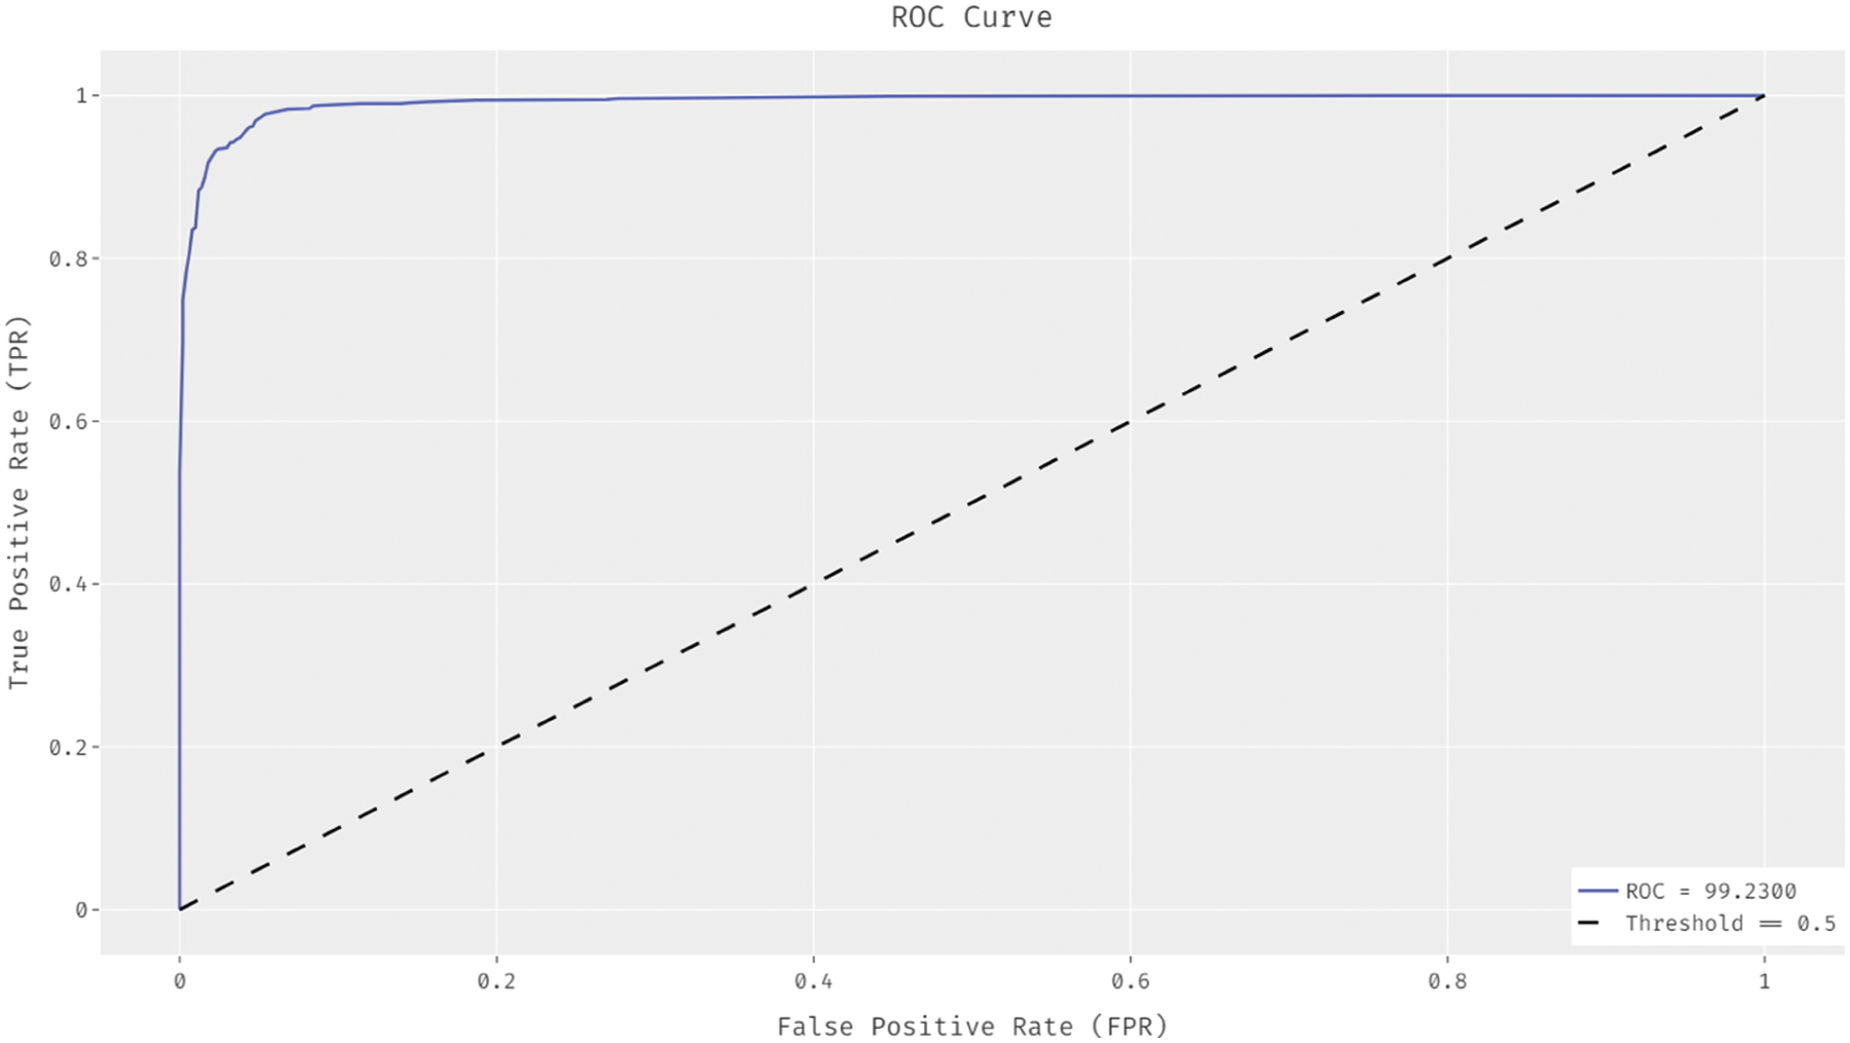
Figure 6: ROC analysis results of EDLFM-RPD model
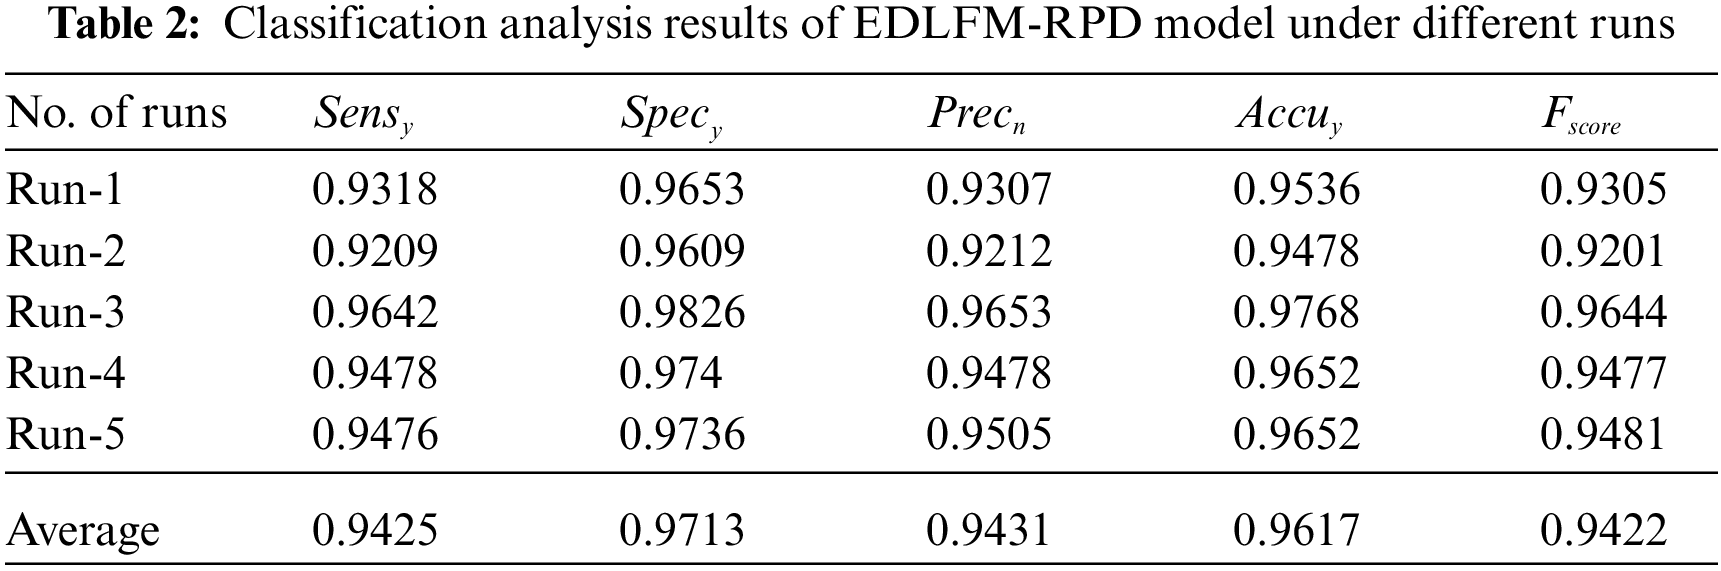
Tab. 2 offers the results for overall classification analysis accomplished by EDLFM-RPD technique under five different runs. The figure depicts that the proposed EDLFM-RPD technique achieved increased average
Finally, a comprehensive comparative classification analysis was conducted upon EDLFM-RPD technique under different measures and the results are shown in Tab. 3. The proposed model was compared with CNN-based inception with ResNset v2 model and Optimal Weighted Extreme Learning Machine (CNNIR-OWELM), VGG-16, Deep NN, deep autoencoder (AE), Artificial neural networks (ANN), Conv. NN, K-nearest neighbor (KNN), Scale-invariant feature transform with support vector machine (SIFT-SVM), and SIFT-KNN.
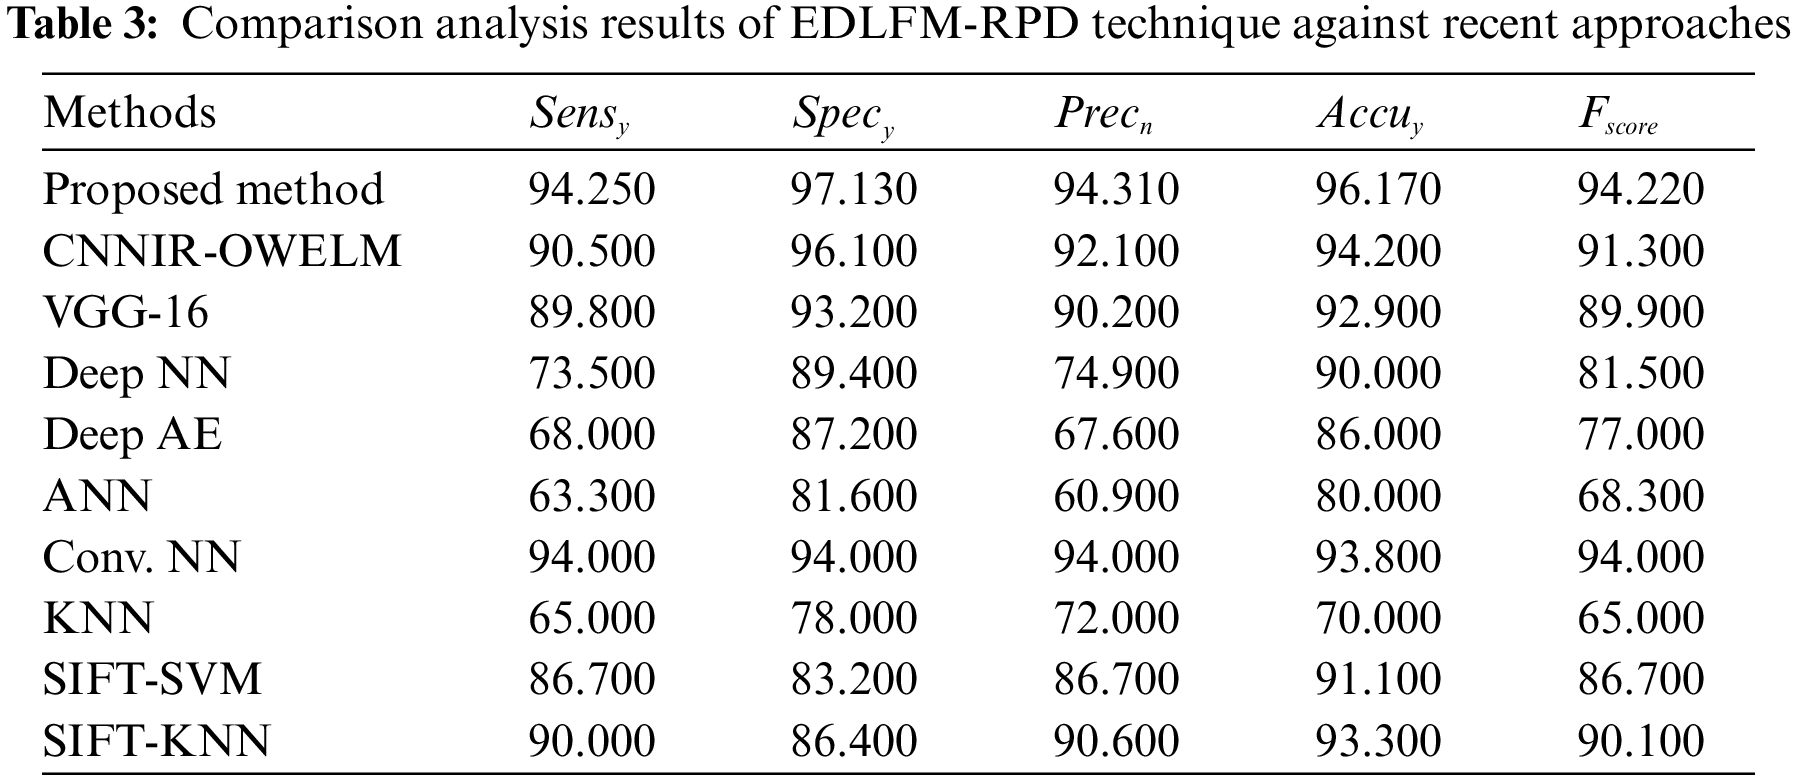
Fig. 7 shows the results of
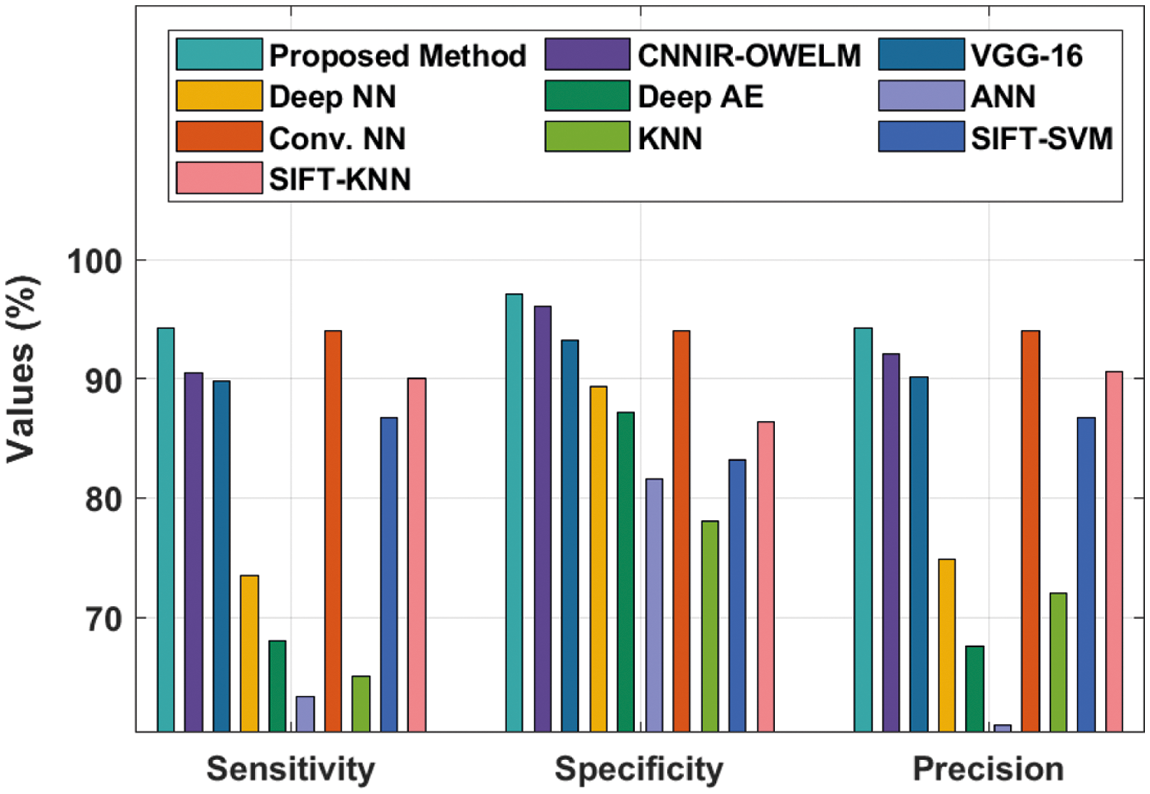
Figure 7: Comparative analysis of EDLFM-RPD model with varying measures
Fig. 8 shows the results of accuracy analysis attained by EDLFM-RPD technique against other techniques. The results demonstrate that Deep AE, ANN, and KNN techniques resulted in low
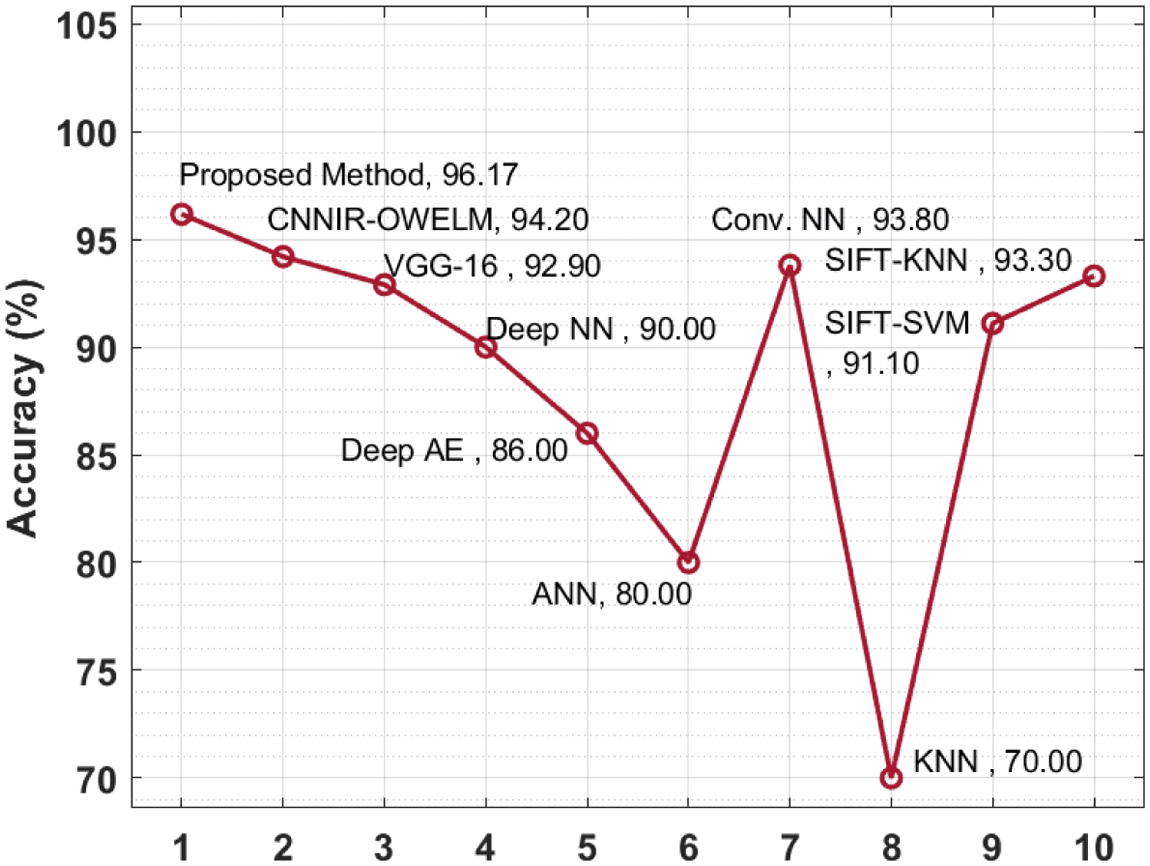
Figure 8: Accuracy analysis results of EDLFM-RPD technique against existing approaches
At last, a brief
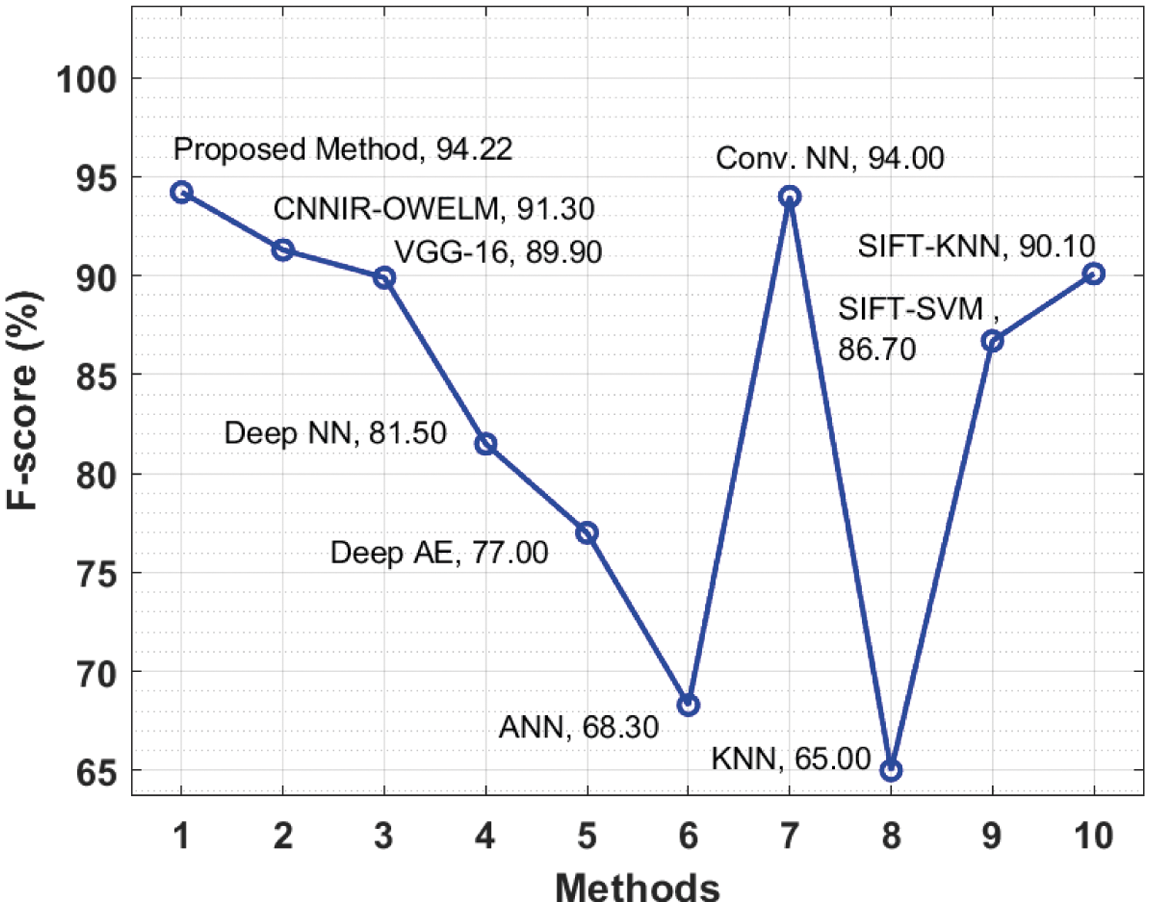
Figure 9: F-score analysis results of EDLFM-RPD technique against existing approaches
In this study, a novel EDLFM-RPD technique is derived to detect and classify different kinds of rice plant diseases proficiently, thereby avoiding the loss in crop productivity. The proposed EDLFM-RPD technique encompasses preprocessing, K-means segmentation, fusion-based feature extraction, and FSVM-based classification. In order to validate the improved outcomes of EDLFM-RPD approach, a series of simulations was conducted and the results were inspected under different dimensions. The experimental values establish the improved performance of EDLFM-RPD technique against recent approaches. Therefore, the proposed EDLFM-RPD technique can be employed as a proficient tool for rice plant disease detection and classification. In future, EDLFM-RPD technique can be realized in IoT and cloud environments to assist farmers in real-time setting.
Acknowledgement: The authors would like to acknowledge the support of Prince Sultan University for paying the Article Processing Charges (APC) of this publication.
Funding Statement: The authors extend their appreciation to the Deanship of Scientific Research at King Khalid University for funding this work under Grant Number (RGP.1/127/42). https://www.kku.edu.sa.
Conflicts of Interest: The authors declare that they have no conflicts of interest to report regarding the present study.
1. M. M. Yusof, N. F. Rosli, M. Othman, R. Mohamed and M. H. A. Abdullah, “M-DCocoa: M-agriculture expert system for diagnosing cocoa plant diseases,” in Int. Conf. on Soft Computing and Data Mining, SCDM 2018, Recent Advances on Soft Computing and Data Mining, Proc. of Advances in Intelligent Systems and Computing, Malaysia, vol. 700, pp. 363–371, 2018. [Google Scholar]
2. R. Sowmyalakshmi, T. Jayasankar, V. A. PiIllai, K. Subramaniyan, I. V. Pustokhina et al., “An optimal classification model for rice plant disease detection,” Computers, Materials & Continua, vol. 68, no. 2, pp. 1751–1767, 2021. [Google Scholar]
3. A. K. Singh, B. Ganapathysubramanian, S. Sarkar and A. Singh, “Deep learning for plant stress phenotyping: Trends and future perspectives,” Trends in Plant Science, vol. 23, no. 10, pp. 883–898, 2018. [Google Scholar]
4. I. V. Pustokhina, D. A. Pustokhin, J. J. P. C. Rodrigues, D. Gupta, A. Khanna et al., “Automatic vehicle license plate recognition using optimal k-means with convolutional neural network for intelligent transportation systems,” IEEE Access, vol. 8, pp. 92907–92917, 2020. [Google Scholar]
5. M. M. Kamal, A. N. I. Masazhar and F. A. Rahman, “Classification of leaf disease from image processing technique,” Indonesian Journal of Electrical Engineering and Computer Science, vol. 10, no. 1, pp. 191–200, 2018. [Google Scholar]
6. N. Krishnaraj, M. Elhoseny, M. Thenmozhi, M. M. Selim and K. Shankar, “Deep learning model for real-time image compression in internet of underwater things (IoUT),” Journal of Real Time Image Processing, vol. 17, no. 6, pp. 2097–2111, 2020. [Google Scholar]
7. D. Y. Kim, A. Kadam, S. Shinde, R. G. Saratale, J. Patra et al., “Recent developments in nanotechnology transforming the agricultural sector: A transition replete with opportunities,” Journal of the Science of Food and Agriculture, vol. 98, no. 3, pp. 849–864, 2018. [Google Scholar]
8. Y. Wang, H. Wang and Z. Peng, “Rice diseases detection and classification using attention based neural network and Bayesian optimization,” Expert Systems with Applications, vol. 178, pp. 114770, 2021. [Google Scholar]
9. J. Chen, D. Zhang, A. Zeb and Y. A. Nanehkaran, “Identification of rice plant diseases using lightweight attention networks,” Expert Systems with Applications, vol. 169, pp. 114514, 2021. [Google Scholar]
10. J. Zhang, Y. Tian, L. Yan, B. Wang, L. Wang et al., “Diagnosing the symptoms of sheath blight disease on rice stalk with an in-situ hyperspectral imaging technique,” Biosystems Engineering, vol. 209, pp. 94–105, 2021. [Google Scholar]
11. P. Temniranrat, K. Kiratiratanapruk, A. Kitvimonrat, W. Sinthupinyo and S. Patarapuwadol, “A system for automatic rice disease detection from rice paddy images serviced via a Chatbot,” Computers and Electronics in Agriculture, vol. 185, pp. 106156, 2021. [Google Scholar]
12. Z. Jiang, Z. Dong, W. Jiang and Y. Yang, “Recognition of rice leaf diseases and wheat leaf diseases based on multi-task deep transfer learning,” Computers and Electronics in Agriculture, vol. 186, pp. 106184, 2021. [Google Scholar]
13. N. Krishnamoorthy, L. V. N. Prasad, C. S. Pavan Kumar, B. Subedi, H. B. Abraha et al., “Rice leaf diseases prediction using deep neural networks with transfer learning,” Environmental Research, vol. 198, pp. 111275, 2021. [Google Scholar]
14. S. K. Bhoi, K. K. Jen, S. K. Panda, H. V. Long, R. Kumar et al., “An internet of things assisted unmanned aerial vehicle based artificial intelligence model for rice pest detection,” Microprocessors and Microsystems, vol. 80, pp. 103607, 2021. [Google Scholar]
15. V. Tiwari, R. C. Joshi and M. K. Dutta, “Dense convolutional neural networks based multiclass plant disease detection and classification using leaf images,” Ecological Informatics, vol. 63, pp. 101289, 2021. [Google Scholar]
16. Y. Zhu and C. Huang, “An improved median filtering algorithm for image noise reduction,” Physics Procedia, vol. 25, pp. 609–616, 2012. [Google Scholar]
17. N. Dhanachandra, K. Manglem and Y. J. Chanu, “Image segmentation using k -means clustering algorithm and subtractive clustering algorithm,” Procedia Computer Science, vol. 54, pp. 764–771, 2015. [Google Scholar]
18. K. Shankar and E. Perumal, “A novel hand-crafted with deep learning features based fusion model for COVID-19 diagnosis and classification using chest X-ray images,” Complex Intelligent Systems, vol. 7, no. 3, pp. 1277–1293, 2021. [Google Scholar]
19. Jahandad, S. M. Sam, K. Kamardin, N. N. Sjarif and N. Mohamed, “Offline signature verification using deep learning convolutional neural network (cnn) architectures googlenet inception-v1 and inception-v3,” Procedia Computer Science, vol. 161, pp. 475–483, 2019. [Google Scholar]
20. Z. Rustam, F. Nadhifa and M. Acar, “Comparison of SVM and FSVM for predicting bank failures using chi-square feature selection,” Journal of Physics: Conference Series, vol. 1108, pp. 012115, 2018. [Google Scholar]
21. Dataset: https://www.kaggle.com/vbookshelf/rice-leaf-diseases. 2020. [Google Scholar]
 | This work is licensed under a Creative Commons Attribution 4.0 International License, which permits unrestricted use, distribution, and reproduction in any medium, provided the original work is properly cited. |