DOI:10.32604/cmc.2022.024779
| Computers, Materials & Continua DOI:10.32604/cmc.2022.024779 | |
| Article |
Enhancement of Biomass Material Characterization Images Using an Improved U-Net
1College of Computer and Control Engineering, Qiqihar University, Qiqihar, 161006, China
2College of Light Industry and Textile, Qiqihar University, Qiqihar, 161006, China
3Elastic Block Store Performance Team, Amazon Web Services, Boston, 02210, USA
*Corresponding Author: Hong Zhao. Email: hzzhao2020@163.com
Received: 31 October 2021; Accepted: 05 January 2022
Abstract: For scanning electron microscopes with high resolution and a strong electric field, biomass materials under observation are prone to radiation damage from the electron beam. This results in blurred or non-viable images, which affect further observation of material microscopic morphology and characterization. Restoring blurred images to their original sharpness is still a challenging problem in image processing. Traditional methods can't effectively separate image context dependency and texture information, affect the effect of image enhancement and deblurring, and are prone to gradient disappearance during model training, resulting in great difficulty in model training. In this paper, we propose the use of an improved U-Net (U-shaped Convolutional Neural Network) to achieve image enhancement for biomass material characterization and restore blurred images to their original sharpness. The main work is as follows: use of depthwise separable convolution instead of standard convolution in U-Net to reduce model computation effort and parameters; embedding wavelet transform into the U-Net structure to separate image context and texture information, thereby improving image reconstruction quality; using dense multi-receptive field channel modules to extract image detail information, thereby better transmitting the image features and network gradients, and reduce the difficulty of training. The experiments show that the improved U-Net model proposed in this paper is suitable and effective for enhanced deblurring of biomass material characterization images. The PSNR (Peak Signal-to-noise Ratio) and SSIM (Structural Similarity) are enhanced as well.
Keywords: U-Net; wavelet transform; image enhancement; biomass material characterization
In recent years, a looming energy crisis and greater emphasis on environmental protection have led to 100% environmentally-friendly biomass composites becoming a popular research topic. Their sizes have entered the submicron level, which brings about some difficulties when measuring and characterizing nanoscale surfaces [1]. The rapid development of scanning electron microscopy imaging is now a common and effective analytical technique used for surface morphology observation. It has high resolution, high magnification, strong depth of field, a large field of view, stereoscopic imaging and can directly observe microstructures on uneven surfaces of various specimens [2]. However, when using conventional electron microscopy for direct observation of plant fiber samples, the high-energy electron beam can penetrate the sample, blurring its edges and making it impossible to capture images in severe cases [3]. The issue of unclear material characterization images due to irradiation damage or breakdown of the SEM electric field affecting biomass samples is a common phenomenon when researching on the characterization of natural fiber composites.
All types of biomass composites have their own unique microstructures, and new imaging techniques have played an important role in early studies of hemp-plastic composites. However, there is a tendency for the electron beam to radiate damage to biomass materials under the high-resolution strong electric field during scanning electron microscopy. This leads to blurred or non-viable images, which affect further observation of microscopic morphology. Therefore, there is an urgent need to develop a method for extracting high-resolution and high-magnification microscopic morphological images in spite of sample damage. This damage limits the use of equipment, resulting in low-quality blurred images from electron microscopy which affects the analysis of samples. The restoration of blurred material images to their original sharpness is of great importance. However, due to great variability in the structural complexity and functionality of materials, enhanced sharpening using deep learning techniques for natural fiber composite characterization images can reduce the experimental workload of researchers. This can also facilitate observation of material surface morphology, provide a convenient way to study the morphological structure of samples and help to improve material properties and optimize the preparation process.
Therefore, in this work, we propose an improved U-Net for sharpening biomass material characterization images. First, depthwise separable convolution is used instead of standard convolution in the encoder of U-Net to reduce the computation workload and the number of parameters. In addition, a dense multi-receiver domain channel module in the deep layer decoder of U-Net is used to extract image detail information to improve image quality. Second, wavelet transform and inverse wavelet transform are embedded into U-Net to reduce model training difficulty and the loss of image information. Third, contextual channel attention modules are used to improve the skip connection and the decode connection for contextual information fusion. The experiments show that the improved U-Net proposed in this paper is suitable and effective for the sharpening of biomass material characterization images. The peak signal-to-noise ratio and structural similarity are enhanced as well.
The remainder of this paper is organized as follows. In Section 2, we briefly introduce the backgroud of the related work about material characterization and image enhancement. The details of improved U-Net model proposed and the method of image deblurring are described in Section 3. In Section 4, we show the details of the experimental settings and results. Finally, the conclusions and our further works are given in Section 5.
In the field of materials science, SEM (Scanning Electron Microscope) is often used to receive the information beam of the secondary electron beam [4] to form an image of the observed sample. The properties of the observed sample are obtained by analysis of the image. However, due to objective factors such as charge effects, edge effects, sample damage, poor conductivity of the sample and subjective factors such as the skill of the operator, SEM is prone to producing low-quality images. These low-quality images have defects such as blurring, low contrast, high noise and inconspicuous edges, which make it difficult to extract sample information effectively and hinder scientific research.
Most research has focused on the improvement of SEM operational methods [5] and the accuracy of SEM instrument design and fabrication. The former approach relies on the proficiency of the operator, while the latter approach incurs higher costs. In the Information Age, digital image processing techniques [6] have matured and are widely used in various fields. SEM images can also be enhanced using digital image processing methods. Yu et al. [7] designed a suitable enhancement algorithm for SEM images to improve image quality and further designed a method to outline the edges of the sample so as to extend the SEM image analysis function. Xu et al. [8] improved the quality of SEM images by a spatial domain image enhancement method to improve resolution and adjust for the appropriate brightness. The image recognition function was further investigated to automatically outline sample edges, which makes it easy for researchers to identify sample objects precisely and with ease.
Most of the existing traditional image enhancement sharpening methods use regularization and hand-crafted prior images to estimate the blur kernel, followed by iterative optimization to gradually restore a clear image. The traditional approach involves the estimation of complex blur kernels, which leads to a tedious sharpening process, poor real-time performance and poor algorithm performance. With the rapid development of deep learning, image sharpening methods based on deep learning [9] have been increasingly applied. Sun et al. [10] used CNN (Convolutional Neural Network) to estimate the blurring kernel and then applied a non-uniform sharpening model using prior knowledge of block-level images to remove image blur. Niu et al. [11] proposed a background difference method based on the Gaussian model, which updates the background in real time to avoid the influence of background interference on raindrop detection in medium rain, heavy rain and snow environments. Nah et al. [12] proposed end-to-end image sharpening based on deep learning, which uses a multi-scale convolutional neural network to directly restore the sharpness of blurred images. Kupyn et al. [13] used a feature pyramid model with generative adversarial networks to remove motion image blur, which provides a new conceptual approach to image sharpening. Tao et al. [14] proposed scaled recurrent networks, which introduces long and short memory networks to increase the acceptance domain and shared parameters to reduce the number of model parameters. Zhang et al. [15] used CNN to learn recurrent per location neural network (RNN) with pixel weights to increase the receptive domain. However, only a small portion of domain information can be captured with RNN or CNN and global context-dependent information cannot be obtained effectively. Zeng et al. [16] used a dense network for image sharpening, which can avoid the gradient disappearance problem, but the acceptance domain of the network is small and a limited amount of image information can be obtained.
Wavelet transform [17,18] can divide the image signal into multi-directional subbands. Both wavelet transform and inverse transform can replace the down sampling and up sampling of CNN. Wavelet transform can describe the contextual dependencies and texture information of the image at different levels. High frequency subbands help to recover image texture details while constraining reconstruction of the low frequency subbands. Therefore, wavelet transform can be applied to image processing such as super resolution [19], image reconstruction [20], image defogging [21] and image sharpening [22], in which the combination of wavelet transform and deep learning is used for image sharpening. Wavelet transform images are used for decomposition extraction followed by deep learning to eliminate the data redundancy caused due to wavelet transform.
In this paper, we propose an improved U-Net [23–25] model for biomass material characterization image enhancement and the model structure is shown in Fig. 1, which mainly consists of depthwise separable convolution [26], residual depthwise separable convolution [27], wavelet transform, a dense multiple receiver domain channel module (DMRFC) and a contextual channel attention module (CCA).
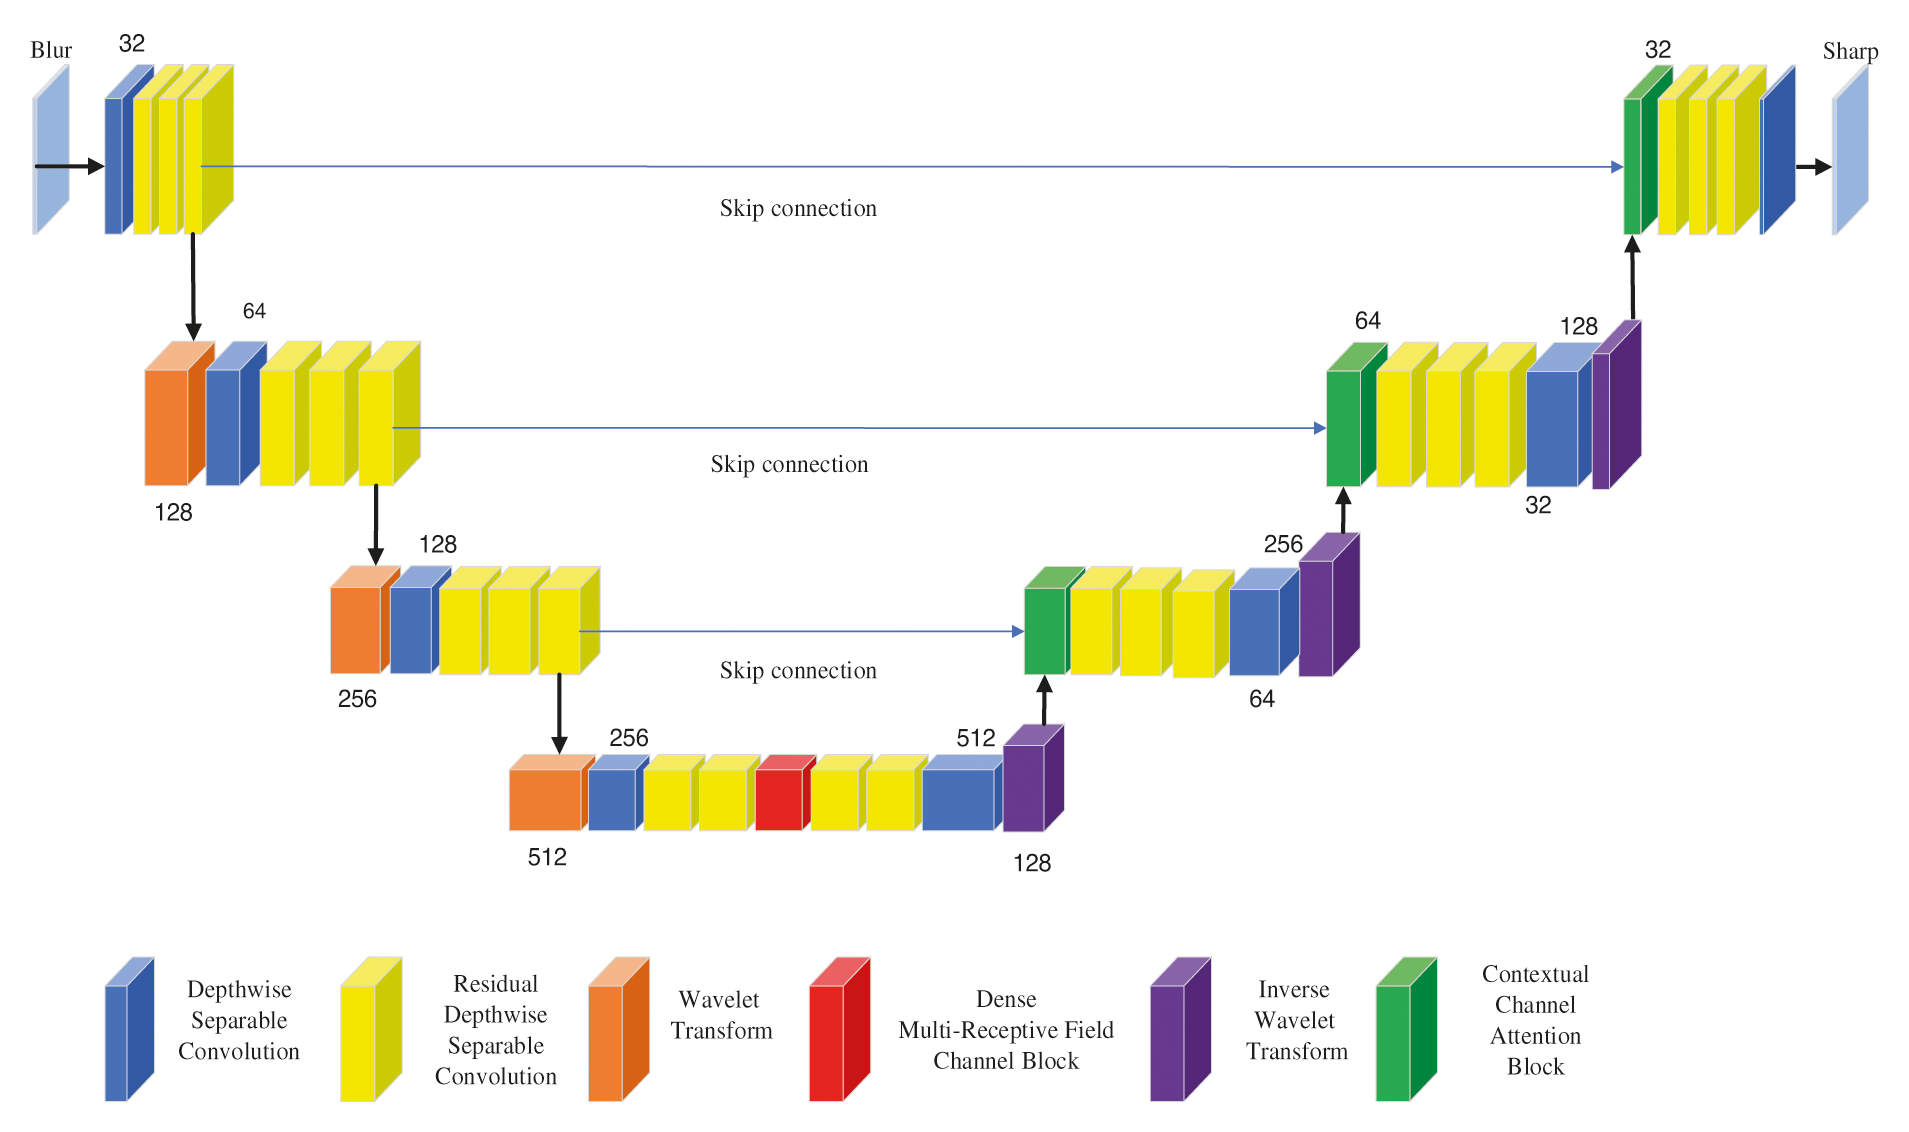
Figure 1: Model structure
3.1.1 Description of the Structure
In the improved U-Net network structure, the encoder is on the left and the decoder is on the right. The encoder implements the convolution operation with depthwise separable convolution instead of normal convolution and replaces the normal residual block with residual depthwise separable convolution. This aims to reduce the parameters in the network. Two-dimensional discrete wavelets are used instead of down sampling with the aim of obtaining contextual and texture information at different frequencies of the image, thereby reducing computational complexity and training difficulty. In deep coding, a DMRFC (dense multi-receptive field channel) module is used to obtain image information at different scales as well as to mitigate gradient disappearance and the emergence of reuse features. Decoding uses inverse wavelet permutation instead of the up sampling process to reduce the loss of image information. The CCA module is then used to fuse the splicing of image features from different network layers, which facilitates the propagation of detailed information from different layers and improves the sharpening effect.
The MSE (Mean Square Error) loss is often used as an evaluation metric for image sharpening by using the Euclidean distance to measure the difference between the predicted and actual values as shown in Eq. (1). However, the MSE loss function does not contain high-frequency information regarding the image, which may cause the model to be too smooth for the recovered image. Therefore, to obtain a clearer image, a perceptual loss function is used. This is expressed as the Euclidean distance between the sharpened image R and the clear image S in the convolution layer of VGGNet (Visual Geometry Group Network) as shown in Eq. (2). To further reduce the effect of noise in the sharpening process of the image as well as to recover the smoothness of the image space, the TV (Total Variation) loss function is used as shown in Eq. (3). Therefore, the loss function in this paper Ltotal consists of three components as shown in Eq. (4).
In Eqs. (1)–(4), R denotes a sharpened image, S denotes a clear image, and
3.2 Proposed Image Enhancement Method
In this paper, we propose an improved U-Net network model for image enhancement and a sharpening method using the following approaches.
(1) Incorporate the 2D DWT (Discrete Wavelet Transform) into the U-Net convolutional neural network. In the encoding stage, the original feature size is reduced and computational complexity is decreased. In the decoding stage, the sharpened image is recovered with the IWT (Inverse Wavelet Transform).
(2) Introduce a DMRFC module in the U-Net network model. First, the potential features are extracted by improving the perceptual field through multiple receptive domains. The important channels and features are then selected by the channel attention mechanism to reduce the number of parameters. Finally, the potential feature information is reused via dense connectivity.
(3) Improve the propagation of cross-layer information using the contextual channel attention module. The features between shallow and deep layers are fully fused to reduce the loss of image information and improve image reconstruction.
In order to reduce the computational complexity and improve the quality of the reconstructed image, this paper mainly uses Haar wavelet transformation with two-dimensional DWT to divide the image signal into directional sub-bands so as to obtain different frequency information of the material characterization image. The one-dimensional high-pass filter is used φ(-). The low-pass filter ψ(-) is used to filter and vertically downsample each row of the image. Two filters are then used to filter and horizontally downsample each column. The wavelet transformation is represented as follows.
The x and y in Eqs. (5)–(8) denote the x and y axes of the image information representing the image. IHL denotes the horizontal high-frequency and vertical low-frequency information of the image representing the material. IHH denotes the horizontal and vertical high-frequency information of the image representing the material. ILL denotes the horizontal and vertical low-frequency information of the image representation the material. ILH represents the horizontal low-frequency and vertical high-frequency information of the image representing the material. In contrast, the wavelet inversion is the inversion of the four sub-images using the same filter. Upsampling of IHL, IHH, ILH and ILL is fused into the original image. Therefore, as shown in Fig. 2, the original image is decomposed using DWT and then reconstructed using IWT without loss of information. A multi-level wavelet transform is performed and further processing of IHL, IHH, ILH, and ILL is carried out to obtain the transformation results of the multilevel wavelets.
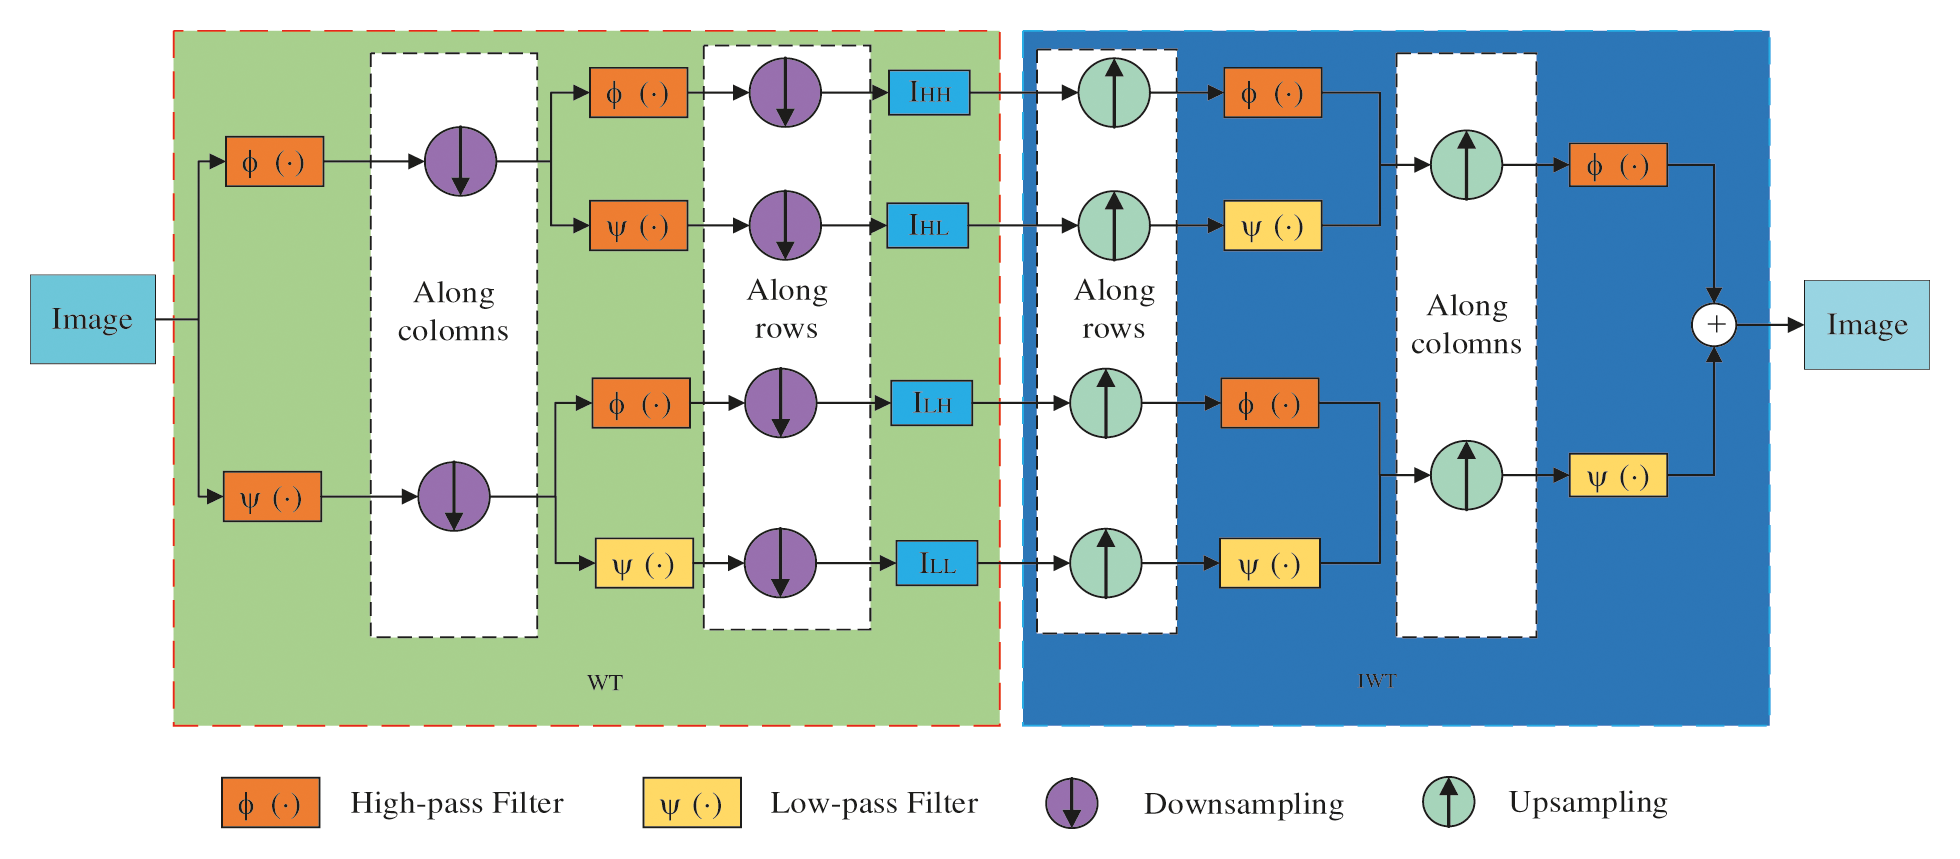
Figure 2: Two-dimensional discrete Haar wavelet transform with inverse transform
The DMRFC is shown in Fig. 3 and the multi-receptive channel block is shown in Fig. 4, which is a combination of the dilation acceptance domain block and the channel attention module. To increase the diversity of feature extraction in the dilation receptive domain, four feature extraction branches are used, using 3 × 3 convolution kernels with dilation rates of 1, 3, 5, and 7 respectively. The connection operation fuses the parallel feature maps of the four branches as shown in Eq. (9). The nonlinear features are adaptively weighted at each channel and the channel attention module in the attention mechanism module (CBAM) [28] is used for learning the weights of each channel. Merging the average pooling features and maximum pooling features improves the nonlinear representation of the network and improves the sharpening ability using these two features. The output of the multi-acceptance channel block is shown in Eq. (10).
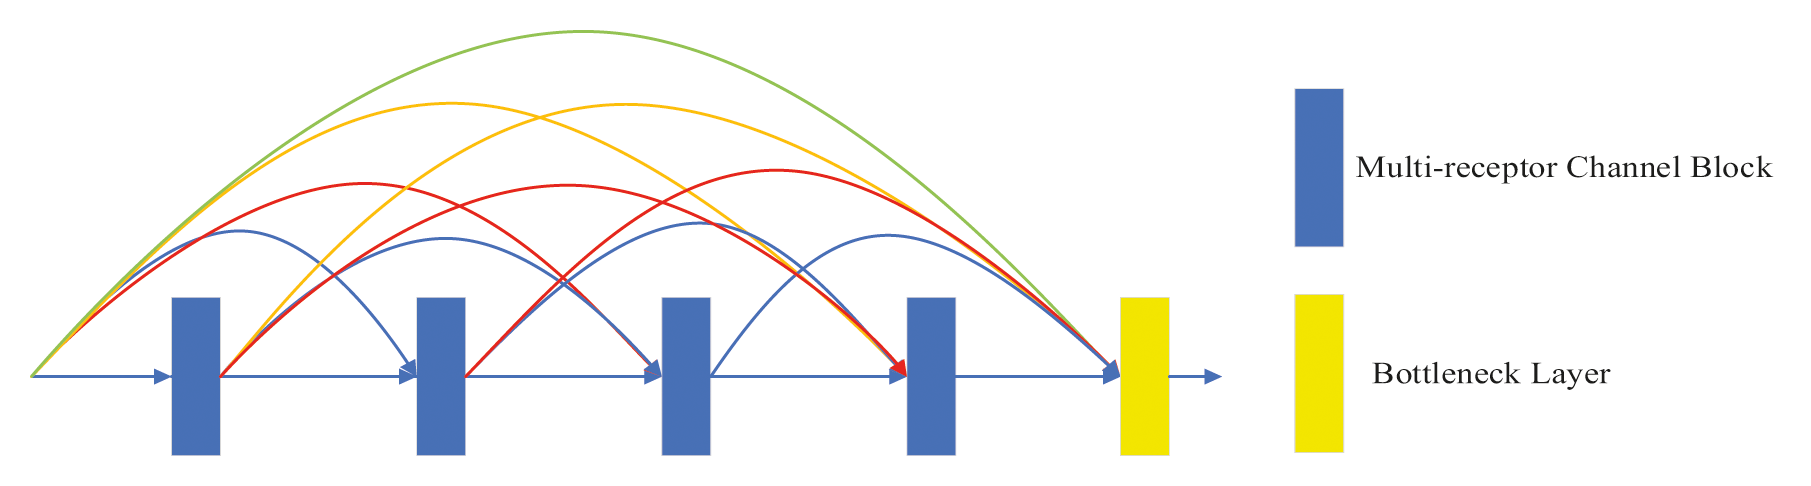
Figure 3: DMRFC module

Figure 4: Multi-receptive channel block
In Eqs. (9), (10), x represents the input features, * is the convolution operation, and w is the convolution layer. The superscript represents the dilation convolution size and the subscript is the convolution kernel size. LK represents the Leaky ReLU activation function, the cat[.] represents the joint operation and C denotes the fused features. The expression Maxpool in Eq. (10) represents the maximum pooling, the Avgpool represents the average pooling and FC denotes the fully connected layer. ƍ is the Sigmoid activation function, and Out is the output.
In order to connect the low-level decoder and skip connection, obtain rich image semantic information and reduce information redundancy, the CCA [29] module is introduced as shown in Fig. 5. The CCA feeds low-level image coding information (represented by LD) and skip connection information (represented by SC) into the CA (channel attention) module to obtain two types of feature information (represented by CA(LD) and CA(SC)) as shown in Eq. (11). The two are then summed as shown in Eq. (12) and the results obtained are each multiplied by the original information. Finally, they are fused as shown in Eq. (13). This method can fully fuse the information in LD and SC, which is beneficial for image sharpening.
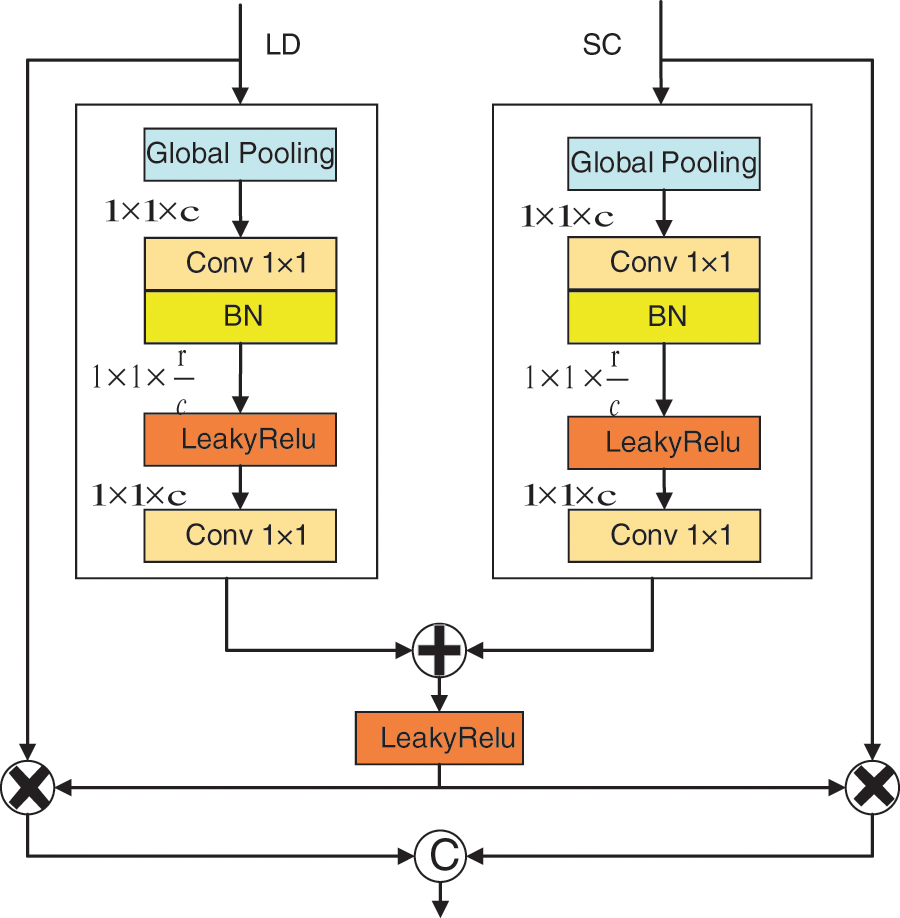
Figure 5: CCA block
In Eqs. (11)–(13), GLPool denotes global pooling, and Conv1_BN denotes 1 × 1 convolution followed by batch normalization. LK represents the Leaky ReLU activation function, Conv1 denotes 1 × 1 convolution and cat[.] represents the joint operation.
4.1 Characterization Images Dataset
In this paper, we used the biomass sample dataset obtained from the materials laboratory to train the model. In order to improve the generalization ability of the model, we performed data enhancement operations on the training set by randomly rotating as well as randomly flipping left, right, up and down. Gaussian noise was also added with rotation angles of 90, 180 and 270 degrees with a noise mean of 0 and variance of 0.0001. As a result, 7680 sets of images were obtained, with each set consisting of a blur and clear image pair. 5760 sets of images were selected as the training set and 1920 sets of images were selected as the test set.
To prevent overfitting of the model, the training set images were randomly cropped to a size of 128 × 128 pixels. The training period was set to 4000 rounds and the initial learning rate was set to 1e−4, which was halved every 1000 rounds. The network optimization method uses Adam [30], with parameters β1 = 0.9 and β2 = 0.999. The network model was built using the PyTorch deep learning framework and a GTX 2080 GPU.
PSNR (Peak signal-to-noise ratio) and SSIM (structural similarity) are used as quantitative evaluation metrics, Larger values represent better image quality and they are calculated per Eqs. (14), (15).
where MAX is the maximum value for the image (MAX = 255) and RMSE is the root mean square error of the recovered clear and blurred images. μx and μy are the mean values of the image x and y respectively,
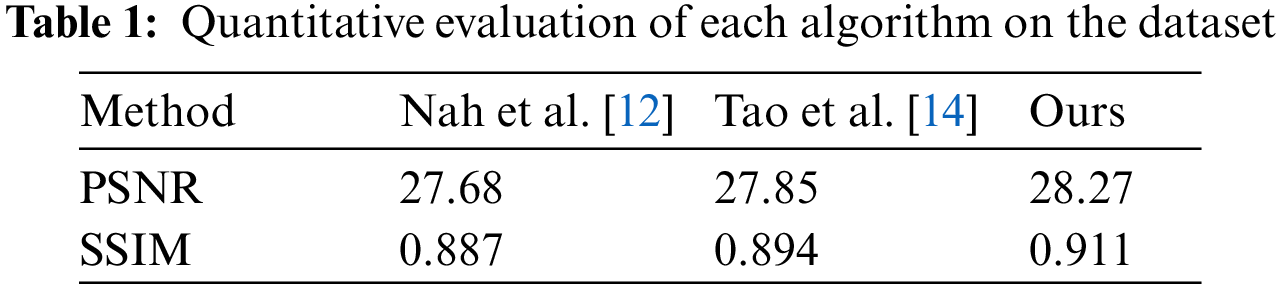
Tab. 1 shows the quantitative comparison of the average PSNR and average SSIM on the experimental test dataset with other methods. The comparison reveals that the method in this paper outperforms the other methods in terms of PSNR and SSIM. It is 0.42 dB higher than PSNR and 0.017 dB higher than SSIM in the literature [14].
Tab. 2 shows the time used on the experimental test dataset which is labeled as ‘Time’. The model parameter size is labeled using ‘Size’. The method used in this paper requires less time and smaller model parameters than those in the literature [12,14].

4.4 Characterization Image Enhancement Analysis
Ten material characterization images were randomly taken from the test set and the average grayscale and gray gradient of the images before and after processing were analyzed as shown in Figs. 6 and 7. Light gray represents the value of the image before processing and dark gray represents the value of the image after processing. From Fig. 6, it can be seen that the average gray scale of the processed image has been improved. From Fig. 7, it can be seen that the gray gradient of the processed image is lower than that of the unprocessed image, which helps to improve the quality of the material characterization image.
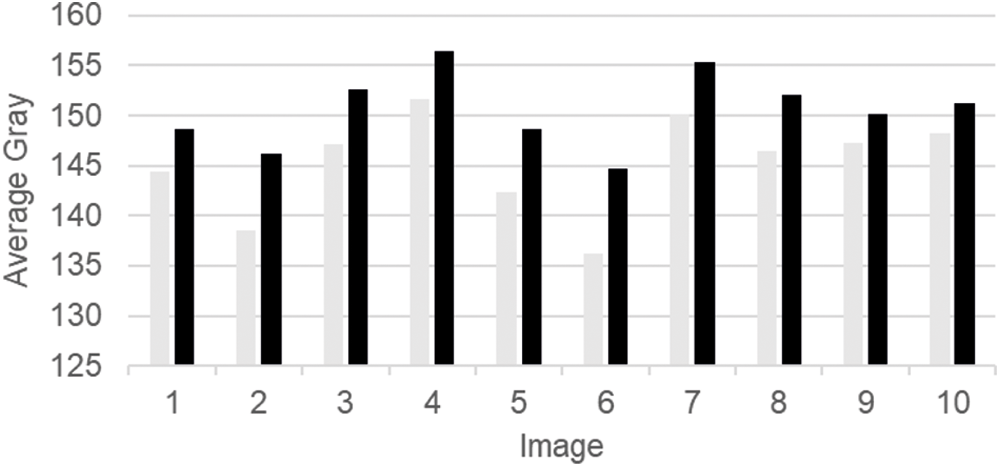
Figure 6: Comparison of average greyscale before and after processing
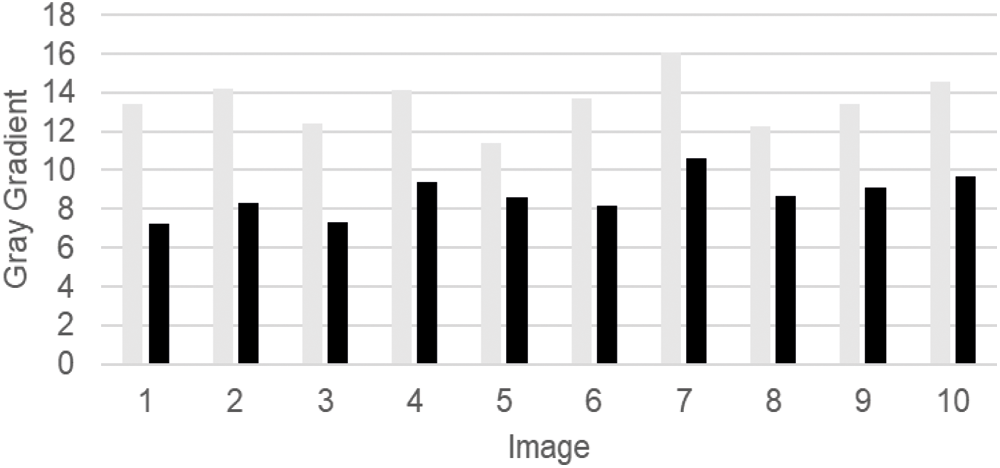
Figure 7: Comparison of gray gradient before and after processing
To further verify the effectiveness of the method in this paper, a fuzzy biomass material characterization image (e.g., Fig. 8a) was selected for more specific analysis as shown in Tab. 3. From Tab. 3, we can see that the original image has an average gray value of 138.5 and a gray gradient value of 14.2. Its average gray value is low and the gray gradient is too high, meaning that it is a low-quality fiber material characterization image which needs to be enhanced to better observe the surface morphology. After processing by the improved U-Net model in this paper, the enhanced sharpened image shown in Fig. 8b is obtained. By visual observation, the sample brightness and contrast are improved, the image is smoother with less noise and the details are highlighted. The processed average gray values and gray gradient values are in the range of values for high-quality images when it comes to material characterization. The peak signal-to-noise ratio is 28.27 and a greater structural similarity quantitatively confirms the enhancement effect.
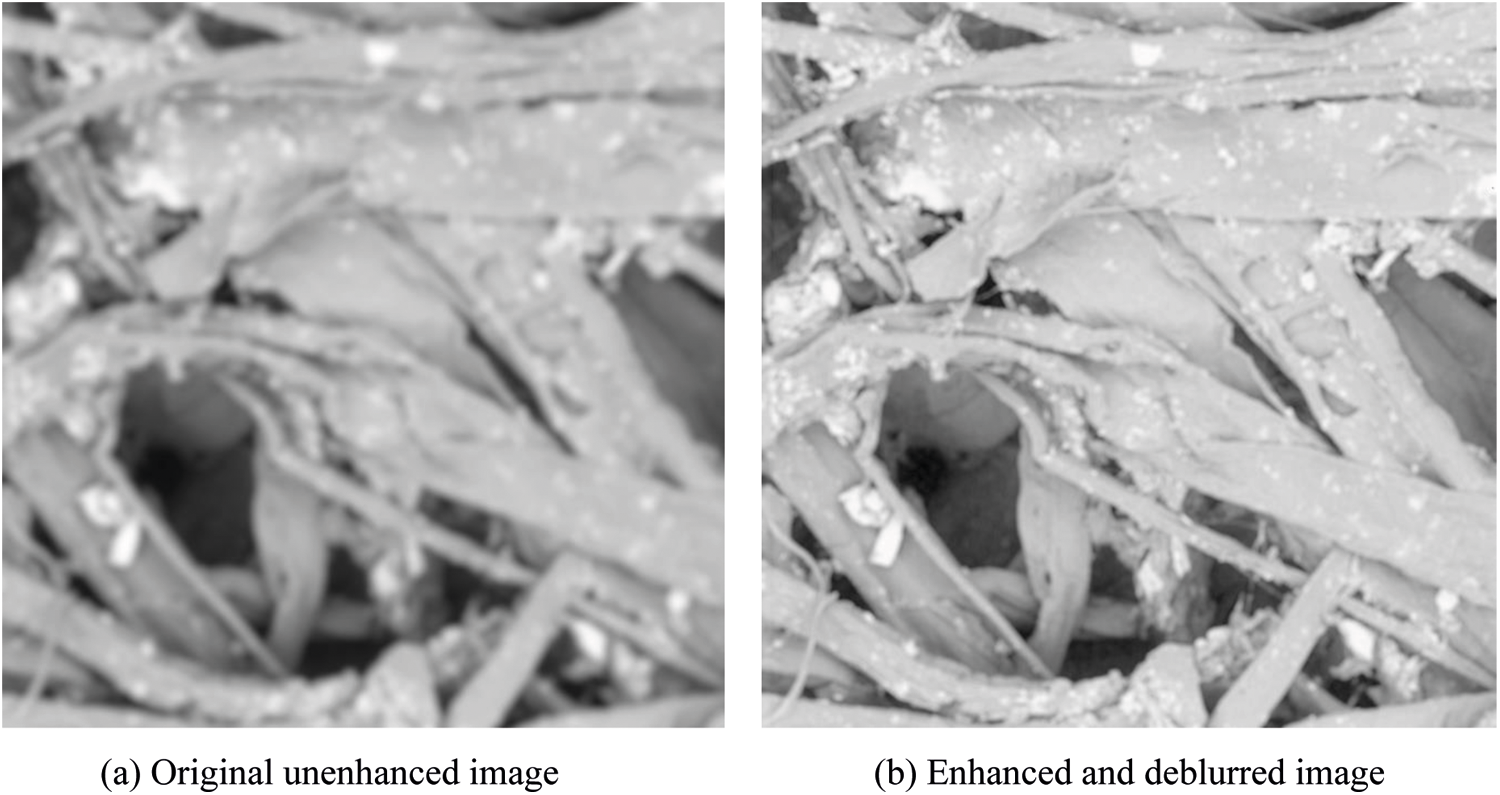
Figure 8: Comparison of enhanced image sharpening effect

4.5 Performance Impact Analysis of the Modules
To verify the effectiveness of each module, three model experiments are conducted to illustrate the effect of dense multi-receiver domain channel blocks and CCA on the method in this paper. Model 1 contains only wavelet transformations, which replaces the dense multi-receiver domain blocks with five depth-separable residual blocks, with simple summation used instead of CCA. Model 2 contains wavelet transformations and dense multi-receiver domain channel blocks without CCA. Model 3 is the method used in this paper. The results are shown in Tab. 4.
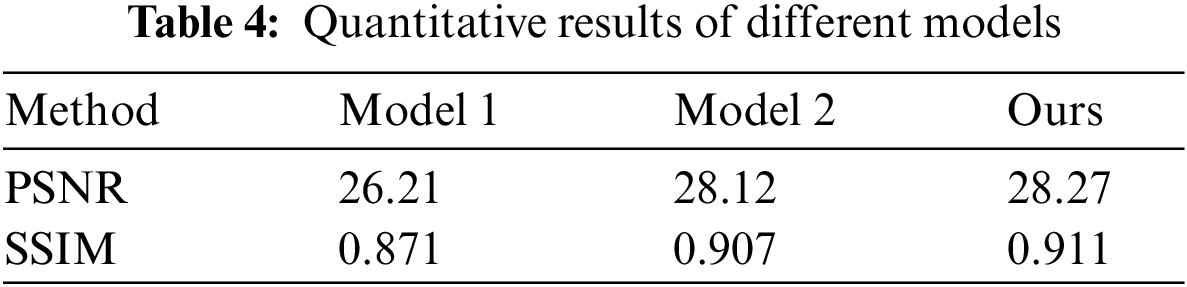
From Tab. 4, it can be seen that the Model 1 PSNR reaches 26.21 dB after introducing wavelet transformation, which indicates that wavelet introduction can improve performance. This is due to the fact that wavelet transformation provides four types of sub-frequency information along with the potential to learn more detailed information. The Model 2 PSNR is slightly higher at 28.12 dB, which indicates that the dense multi-receiver domain channel block helps to improve the quality of model recovery due to reduced information reuse, increased receiver domain and selection of important channel information. Model 3 introduces CCA, with the PSNR going up to 28.27 dB in this paper, which indicates that CCA can further improve the model to obtain high-quality images.
An improved U-Net network model for material characterization image enhancement via image sharpening is proposed in this paper. It uses wavelet transformation to decompose and extract the frequency information of the blurred image and reduces the complexity of the computation. In order to extract the deep information in the image, a dense multi-receptor domain channel block is used to connect the multi-receptor domain channel blocks with dense connections. This reduces the multi-receptor domain channel block parameters and enhances the transfer of features. The multi-receptor domain channel blocks can extract deep features and select important channels and features with the channel attention module. During the decoding process, the information between the skip connection and the low-resolution encoder is fused with the CCA module to produce a clearer image of the network. It has been shown experimentally that the method in this paper can significantly reduce the size of the model and reduces the computing time of the clear images recovered by the model. It also shows that the enhanced sharpened images have achieved better results. Information pickup from characteristic regions in materials science images plays a crucial role in helping R&D personnel in the preparation and characterization of new materials.
The model proposed in this paper introduces more relevant modules and the next objective is to classify the samples into categories and conduct experiments for different modules to choose the optimal combination and to reduce the complexity of the model.
Acknowledgement: The authors thanks Dr. Qiang Li for his help. The authors would like to thank the anonymous reviewers and the editor for the very instructive suggestions that led to the much-improved quality of this paper.
Funding Statement: This work was supported by the Fundamental Research Funds for Higher Education Institutions of Heilongjiang Province (135409505, 135509315, 135209245), the Heilongjiang Education Department Basic Scientific Research Business Research Innovation Platform “Scientific Research Project Funding of Qiqihar University” (135409421) and the Heilongjiang Province Higher Education Teaching Reform Project (SJGY20190710).
Conflicts of Interest: The authors declare that they have no conflicts of interest to report regarding the present study.
1. M. Mabaso, D. Withey and B. Twala, “Spot detection methods in fluorescence microscopy imaging: A review,” Image Analysis and Stereology, vol. 37, no. 3, pp. 173–190, 2018. [Google Scholar]
2. B. L. Zhu, L. J. Lu, W. C. Dai, C. Y. Zhang, L. W. Fang et al., “Facile solid-state synthesis and magnetic properties of cobalt monosilicide,” Chinese Journal of Inorganic Chemistry, vol. 35, no. 5, pp. 876–880, 2019. [Google Scholar]
3. Y. Wang, Y. L. Sun, S. He, H. T. Li and L. Liu, “Comparative analysis of surface morphology of yeast by scanning electron microscopy and atomic force microscopy,” Journal of Chinese Electron Microscopy Society, vol. 37, no. 2, pp. 178–182, 2018. [Google Scholar]
4. A. Suri, A. Pratt, S. Tear, C. Walker and M. El-gomati, “Next generation secondary electron detector with energy analysis capability for SEM,” Journal of Microscopy, vol. 279, no. 3, pp. 207–211, 2020. [Google Scholar]
5. I. Jozwik, A. Barcz, E. Dumiszewska and D. Elzbieta, “Ion-Irradiated damage in semiconductors visualized by means of low-kv scanning electron microscopy,” Microscopy and Microanalysis, vol. 25, no. S2, pp. 486–487, 2019. [Google Scholar]
6. X. Song, “Research on fragmentation distribution of rock based on digital image processing technology,” Journal of Physics Conference Series, vol. 1744, no. 4, pp. 042034, 2021. [Google Scholar]
7. S. Yu, H. Sun, R. Zhu, Z. Yang, K. Rui et al., “Design- and implementation of low quality scanning electron microscope picture's enhancement,” Microcomputer & its Applications, vol. 33, no. 14, pp. 38–41, 2014. [Google Scholar]
8. W. J. Xu and G. Z. Liu, “Space domain and frequency domain combination of image enhancement technology and its realization,” China Measurement & Test, vol. 35, no. 4, pp. 52–54, 2009. [Google Scholar]
9. J. S. Pan, “Research progress on deep learning-based image debluring,” Computer Science, vol. 48, no. 3, pp. 9–13, 2021. [Google Scholar]
10. J. Sun, W. Cao, Z. Xu and J. Pronce, “Learning a convolutional neural network for non-uniform motion blur removal,” in 2015 IEEE Conf. on Computer Vision and Pattern Recognition. CVPR, Boston, MA, USA, pp. 769–777, 2015. [Google Scholar]
11. J. Niu, Y. Jiang, Y. Fu, T. Zhang and N. Masini, “Image deblurring of video surveillance system in rainy environment,” Computers, Materials & Continua, vol. 65, no. 1, pp. 807–816, 2020. [Google Scholar]
12. S. Nah, T. H. Kim and K. M. Lee, “Deep multi-scale convolutional neural network for dynamic scene deblurring,” in 2017 IEEE Conf. on Computer Vision and Pattern Recognition. CVPR, Honolulu, HI, USA, pp. 257–265, 2017. [Google Scholar]
13. O. Kupyn, V. Budzan, M. Mykhailych, D. Mishkin and J. Matas, “DeblurGAN: Blind motion deblurring using conditional adversarial networks,” in 2018 IEEE/CVF Conf. on Computer Vision and Pattern Recognition. CVPR, Salt Lake City, UT, USA, pp. 8183–8192, 2018. [Google Scholar]
14. X. Tao, H. Gao, X. Shen, J. Wang and J. Jia, “Scale-recurrent network for deep image deblurring,” in 2018 IEEE/CVF Conf. on Computer Vision and Pattern Recognition. CVPR, Salt Lake City, UT, USA, pp. 8174–8182, 2018. [Google Scholar]
15. J. Zhang, J. Pan, J. Ren, Y. Song, L. Bao et al., “Dynamic scene deblurring using spatially variant recurrent neural networks,” in 2018 IEEE/CVF Conf. on Computer Vision and Pattern Recognition. CVPR, Salt Lake City, UT, USA, pp. 2521–2529, 2018. [Google Scholar]
16. T. Zeng and C. Diao, “Single image motion deblurring based on modified denseNet,” in 2020 2nd Int. Conf. on Machine Learning, Big Data and Business Intelligence. MLBDBI, Taiyuan, TY, China, pp. 521–525, 2020. [Google Scholar]
17. L. Xiong, X. Zhong and C. Yang, “DWT-SISA: A secure and effective discrete wavelet transform-based secret image sharing with authentication,” Signal Processing, vol. 173, no. 11, pp. 107571, 2020. [Google Scholar]
18. S. Mallat, “Wavelets for a vision,” Proceedings of the IEEE, vol. 84, no. 4, pp. 604–614, 1996. [Google Scholar]
19. T. Guo, H. S. Mousavi, T. H. Vu and V. Monga, “Deep wavelet prediction for image super-resolution,” in 2017 IEEE Conf. on Computer Vision and Pattern Recognition Workshops. CVPRW, Honolulu, HI, USA, pp. 1100–1109, 2017. [Google Scholar]
20. P. Liu, H. Zhang, K. Zhang, L. Lin and W. Zuo, “Multi-level wavelet-CNN for image restoration,” in 2018 IEEE/CVF Conf. on Computer Vision and Pattern Recognition Workshops. CVPRW, Salt Lake City, UT, USA, pp. 886–895, 2018. [Google Scholar]
21. H. Yang and Y. W. Fu, “Wavelet U-Net and the chromatic adaptation transform for single image dehazing,” in 2019 IEEE Int. Conf. on Image Processing. ICIP, Taipei, Taiwan, pp. 2736–2740, 2019. [Google Scholar]
22. C. Min, G. Wen, B. Li and F. Fan, “Blind deblurring via a novel recursive deep CNN improved by wavelet transform,” IEEE Access, vol. 6, pp. 69242–69252, 2018. [Google Scholar]
23. O. Ronneberger, P. Fischer and T. Brox, “U-Net: Convolutional networks for biomedical image segmentation,” in Medical Image Computing and Computer-Assisted Intervention. MICCAI, Cham: Springer, pp. 234–241, 2015. [Google Scholar]
24. H. Li, C. Pan, Z. Chen, A. Wulamu and A. Yang, “Ore image segmentation method based on U-Net and watershed,” Computers, Materials & Continua, vol. 65, no. 1, pp. 563–578, 2020. [Google Scholar]
25. R. Tao, Y. Zhang, L. Wang, P. Cai and H. Tan, “Detection of precipitation cloud over the Tibet based on the improved U-Net,” Computers, Materials & Continua, vol. 65, no. 3, pp. 2455–2474, 2020. [Google Scholar]
26. Y. Chen, F. Peng, X. Kang and Z. J. Wang, “Depthwise separable convolutional neural network for image forensics,” in 2019 IEEE Visual Communications and Image Processing. VCIP, Sydney, NSW, Australia, pp. 1–4, 2019. [Google Scholar]
27. F. Chollet, “Xception: Deep learning with depthwise separable convolutions,” in 2017 IEEE Conf. on Computer Vision and Pattern Recognition. CVPR, Honolulu, HI, USA, pp. 1800–1807, 2017. [Google Scholar]
28. S. Woo, J. Park, J. Y. Lee and I. S. Kweon, “CBAM: Convolutional block attention module,” in European Conf. on Computer Vision. ECCV, Cham, Springer, pp. 3–19, 2018. [Google Scholar]
29. Y. Xu, Z. Zhou, X. Li, N. Zhang and P. Wei, “FFU-Net: Feature fusion U-Net for lesion segmentation of diabetic retinopathy,” BioMed Research International, vol. 2021, no. 3, pp. 1–12, 2021. [Google Scholar]
30. D. Kingma and J. Ba, “Adam: A method for stochastic optimization,” in The 3rd Int. Conf. for Learning Representations. ICLR, San Diego, California, USA, 2015. [Google Scholar]
 | This work is licensed under a Creative Commons Attribution 4.0 International License, which permits unrestricted use, distribution, and reproduction in any medium, provided the original work is properly cited. |