DOI:10.32604/cmc.2022.024913
| Computers, Materials & Continua DOI:10.32604/cmc.2022.024913 | |
| Article |
Automatic Segmentation and Detection System for Varicocele Using Ultrasound Images
1Department of Computer Science, Al-Zaytoonah University of Jordan, Amman, 11733, Jordan
2Department of Computer Science, Jordan University of Science and Technology, Irbid, 22110, Jordan
3Department of Water and Environmental Engineering, Al-Huson University College, Al-Balqa Applied University, Irbid, Jordan
*Corresponding Author: Ayman M. Abdalla. Email: ayman@zuj.edu.jo
Received: 04 November 2021; Accepted: 27 December 2021
Abstract: The enlarged veins in the pampiniform venous plexus, known as varicocele disease, are typically identified using ultrasound scans. The medical diagnosis of varicocele is based on examinations made in three positions taken to the right and left testicles of the male patient. The proposed system is designed to determine whether a patient is affected. Varicocele is more frequent on the left side of the scrotum than on the right and physicians commonly depend on the supine position more than other positions. Therefore, the experimental results of this study focused on images taken in the supine position of the left testicles of patients. There are two possible vein structures in each image: a cross-section (circular) and a tube (non-circular) structure. This proposed system identifies dilated (varicocele) veins of these structures in ultrasound images in three stages: preprocessing, processing, and detection and measurement. These three stages are applied in three different color modes: Grayscale, Red-Green-Blue (RGB), and Hue, Saturation, and Value (HSV). In the preprocessing stage, the region of interest enclosing the pampiniform plexus area is extracted using a median filter and threshold segmentation. Then, the processing stage employs different filters to perform image denoising. Finally, edge detection is applied in multiple steps and the detected veins are measured to determine if dilated veins exist. Overall implementation results showed the proposed system is faster and more effective than the previous work.
Keywords: Varicocele; color mode; HSV; median filter; segmentation; canny
Ultrasound (US) is a commonly used technique in medical imaging. It is convenient for most patients because it is quick, affordable, and secure. The applications of automated segmentation of US images emerged in a variety of medical diagnostics. For example, US is used in obstetrics to obtain fetus measurements such as head circumference and femur length. In cardiovascular applications [1], US can be used in various types of vessel detection including pampiniform plexus veins and intercostal veins.
Varicocele is the dilatation or abnormal tortuosity of the pampiniform venous plexus. It typically occurs in nearly 15% of adult and adolescent males. There is an association between varicocele, infecundity, infertility, and sperm alteration in 30% to 40% of patients diagnosed with varicocele [2]. Varicocele has no serious manifestations but it may cause discomfort and scrotal pain. The symptoms may include the appearance of a small palpable scrotal mass accompanied, in some cases, by mild pain. This pain usually occurs if the patient makes a vigorous physical effort or sits for an extended period or stands abruptly. This pain sensation has the strength of a toothache, does not expand to the rest of the body [3], and it can be relieved by lying down. However, the patient developing varicocele can barely be alerted to the pain until the scrotal wall becomes thick and contracted. In many cases, the patient is alerted to his varicocele condition only after an infertility evaluation.
Color Doppler Ultrasound is applied among other techniques to examine varicose veins [4]. US imaging is applied to the testicles along with the surrounding tissues to detect anomalies in the scrotum, testicles, and epididymis. In this research, two-dimensional (2D) US images are examined for varicocele detection. The US images for varicocele identification are generally obtained in three positions: supine, Valsalva, and standing [5,6]. The supine position, also known as the dorsal decubitus position, is the most commonly used in medical diagnosis. Generally, the head is laid down on a foam pillow, with the neck kept in a neutral position, and the patient's arms are tucked at his sides. Fig. 1 shows an image taken in the supine position of a varicocele patient [7]. Although the diagnosis of varicocele is usually obtained with US in clinical practice, there is currently a significant variability in image acquisition methods and formats [8]. Nonetheless, there is an effort to produce a framework that allows standardization across future studies to clarify the role of US in varicocele assessment [8].

Figure 1: US image taken in the supine position of a varicocele patient
Despite the abundance of previous research on automatic vein detection, there are only a few studies on the veins of the testicle area. Previous research focused on the identification of the vessels in other organs such as cardiovascular and retinal vessels. Moreover, the limited number of studies on automatic varicocele detection did not provide very effective systems for the identification of the disease. Therefore, this study aims at advancing the work on automatic vein detection in the testicle area using US images. Automatic detection of varicocele can overcome the hurdles of manual detection that requires the significant time and effort of a specialist. Furthermore, US images are affordable and such an automated system can serve more patients especially in remote and low-income areas.
This paper presents a new system for detecting varicocele using ultrasound images, which involves an area of limited previous work. The proposed system investigates an extra color mode, is faster, and produces more meaningful results than the previous work. This paper is organized as follows. Section 2 reviews the related previous works. Then, Section 3 explains the methodology of the proposed system in detail. After that, Section 4 discusses and analyzes the experimental results. Finally, Section 5 presents the conclusions and proposes some future works.
Image segmentation algorithms for medical images of anatomical form have become increasingly important in aiding and automating a variety of radiological tasks over the years. They play a critical role in a variety of biomedical imaging applications such as diagnosis, pathology localization, and treatment planning [9]. Image segmentation is the dividing of an image into non-overlapping, component areas that are homogeneous with respect to some attribute such as intensity or texture. Image segmentation is used in a variety of methods such as thresholding, region growing, classifiers, artificial neural networks, deformable models, models based on Markov random fields, clustering, and atlas-guided approaches [10]. Segmentation methods may be modified to segment and transmit medical images securely [11].
The methods presented by [12] for detecting blood vessels in retinal images were based on adaptive histogram equalization and morphological operations. They put the image through the morphological opening operations using a structuring element and then applied a median filter for removing noise and smoothing. They used the red and green channels of the Red-Green-Blue (RGB) images as they gave them more accurate results than the blue channel in detecting blood vessels. They removed the background from the filtered image using subtraction and then converted the image into a binary format using an appropriate threshold. They used the binary morphological opening for removing small components. For extraction, they used Prewitt, Sobel, and Canny edge detection methods. They concluded that using the Prewitt edge detector gave the best results while Sobel resulted in more accuracy than Canny.
Ma et al. [13] developed a local-phase-based snake method for increasing the accuracy of vessel segmentation in US images. They used the local phase for generating image energy on all edges in any case of the strengths by using the intensity-invariant local phase. They evaluated this local phase using the quadrature filters in multiple image scales. The performance of the proposed segmentation method was evaluated using 180 US images of three types of vessels.
Klingensmith et al. [14] designed an autoregressive model for spectral analysis of the US radiofrequency. They computed eight spectral parameters for evaluating the autoregressive order and region-of-interest (ROI) size and created random forests. They utilized the spectral analysis of radio frequency signals in identifying intercostal blood vessels in a US image of the paravertebral space and the intercostal space. They built a database of ROIs of two classes: intercostal blood vessels and outside the blood vessels. Finally, they chose one of the random forest classifiers based on performance in training data to identify the vessels in a set of test data.
Georgieva et al. [15] developed a method of three main steps for renal vessel evaluation with segmentation in US images. First, they performed preprocessing of the image using Contrast Limited Adaptive Histogram Equalization (CLAHE) and decreased the noise using a modified homomorphic filter. Next, the Doppler US image is segmented into colors via the active contour model. They used an initial contour position that is close to the kidney boundaries which is selected by a specialist for more accuracy. Finally, they used k-mean clustering for classifying color and undirected partial Hausdorff distance for computing the accuracy, sensitivity, and specificity.
Abd Rahim et al. [16] evaluated the use of image processing techniques to enhance US images to aid the diagnosis of varicocele. They classified images into three classes: normal testicles, testicles with varicocele, and testicles with severe varicocele. They applied a preprocessing operation to remove noise from the image, utilizing a median filter. Then, they cropped the image using a Soble edge detector to focus on the testicle region that needs to be examined. The results showed that the Sobel technique performs a good job of revealing the varicocele area and the dilated veins.
Karami et al. [17] presented an approach for segmenting and tracking the internal jugular vein (IJV) using the optical flow algorithms: Lucas-Kanade, Horn-Schunck, and Farneback to create a vector field that connects each frame to the next. To begin, the Lucas-Kanade algorithm divides the image into smaller blocks assuming that the pixel shift is constant. Next, the cost of the displacement vector is calculated by the Farneback method assuming that the flow vector field is smooth. Finally, the Horn-Schunck algorithm uses a quadratic polynomial to approximate the neighborhood of each pixel. The implementation results showed that the algorithm achieved segmentation quality close to that obtained by manual segmentation.
Ikhsan et al. [18] proposed a method for automatically identifying, segmenting, and tracking the cross-section of the common carotid artery (CCA) and the IJV using the US image feed during a central venous catheter implantation process. A modified star algorithm was utilized to segment, implement, and track the blood vessel. They employed a novel approach to identify the location of the IJV and the CCA via two critical tasks: selecting the initial starting point at the start of the trace and reviewing the fragmentation results for each successive window. They investigated blood vessel categorization using ellipse parameters, which examines the physical properties of the blood vessel cross-section. The cascade classifier was implemented using a support vector machines in two steps. The first step differentiates between blood vessels and non-vessel structures, while the second differentiates between the IJV and the CCA. According to their findings, technologies that work in a cascade manner may be able to identify the IJV and CCA cross-section in US imaging frames accurately in real time.
One research that utilized ultrasonic imaging to process carotid artery transactions was conducted by Licev et al. [19]. For artery identification, they employed the Hough transform. They also utilized an active contour based on level set approaches updated for use in object segmentation. They utilized the CLAHE approach to preprocess the images and the median filter to reduce the transfer function slope. Then, the traditional Sobel filter was applied for edge detection and iterative adaptive thresholding to eliminate speckle noise. The results were obtained using Hough transform to identify arteries where the specific artery structure was described using the local Gaussian distribution fitting energy. The reliability of this approach was shown to be 79.1%. For a general literature review of carotid US image analysis, refer to the work done by Latha et al. [20].
Kang et al. [21] presented an automated technique for detecting retinal vascular morphological alterations, such as arteriovenous nicking, by utilizing crossover points detection. First, they employed multi-scale line detection and vascular boundary information to prepare for viewing the image. Then, they utilized crossover points realized from vessel segmentation and centerline extraction. After that, the vessels in the crossing area were categorized as arteries or veins.
Narayan et al. [22] utilized tissue echogenicity and US image formation for tracking, detecting, and segmenting the carotid in 2D and 2D+t US images of the thyroid gland. In the first stage, they used the local phase of the input image for segmenting the hypoechoic anatomical regions. In the second stage, they detected the carotid within the segmented hypoechoic regions by using Hessian-based blob analysis. It segmented the carotid artery using the least-squares ellipse fit for the edge points around the detected carotid candidate. The third stage required a trace of the carotid. The input to the system was a time series (2D+t) comprising the US images of the thyroid gland. Experiments using a dataset of 41 images achieved a detection accuracy of 95%.
Ghadiri et al. [23] devised a fuzzy inference and edge detection method for identifying vessels in retinal analysis to extract information such as blood vessel alterations. They utilized linear structures and split the image into overlapping windows. Then, the Sobel operator was utilized to extract edges in the predefined direction, in addition to employing a genetic algorithm to aid in the vessel validation process. Finally, they used morphological methods to reconstruct the vessel structures. Their experimental results demonstrated high performance compared to previous methods.
AlZoubi et al. [24] introduced a novel system for the automatic segmentation and detection of varicocele using US images. The system employed multiple edge detectors with segmentation and it was tested with different noise filters and color-modes. Their best test results showed a sensitivity of 91%, a specificity of 39%, a positive predictive value of 81%, and a negative predictive value of 60%. These results were achieved with a segmentation threshold parameter equal to 0.1. When the threshold parameter was 0.2, the values of these results were significantly lower.
This paper presents an improved system to detect and identify varicocele disease. The system starts with extracting the Region of Interest (ROI) using thresholding and segmentation techniques with different color modes: grayscale, RGB, and Hue, Saturation, and Value (HSV). Different color modes were used to investigate the effect of each mode on the efficacy of the system and to help select the color mode that yields the best results. The segmentation process is commonly employed in identifying particular objects in an image and may be used in post-processing medical images to aid the diagnosis of various diseases such as tumors [25] and varicose [16].
The US images in this research were randomly collected from various US machines at the radiology department of a hospital in Amman, Jordan for 90 males between 13 and 63 years old. Overall, 72.2% of the patients were 19 to 60 years old and 14.4% were older than 60. Each US image was obtained and analyzed by medical specialists aiming to examine the pampiniform plexus venous (PPV) area in the left testicle. The images were initially taken in Digital Imaging and Communications in Medicine (DICOM) format and then converted into Portable Network Graphics (PNG) format by a medical conversion program in MATLAB. The PNG format has several properties that make it very suitable for use in US images [26]. This format preserves image quality after compression and allows the creation of small files while preserving transparency. There is a small loss of details due to this conversion but it is limited to fine details that do not have a significant negative effect on dilated vein detection. We designed a program in MATLAB to detect and identify the ROI in the PPV area and then detect dilated veins in this region using different segmentation, enhancement, denoising, and edge detection techniques.
Fig. 2 shows an original unprocessed US image that was taken of the left testicle of a patient in the supine position. Fig. 3 illustrates the normal and abnormal images used for varicocele disease diagnosis, with only non-dilated veins appearing around the testicle on the left-hand side image and some dilated veins visible in the right-hand side image.

Figure 2: An original US image of a left testicle

Figure 3: Images of normal (non-varicocele) and abnormal (varicocele) testicles
As seen in Tab. 1, the images in the dataset comprise three different types, classified according to the shapes of the veins visible in the US image. These types are cross-section (circular shape), tube (non-circular shape), and mixed (cross-section and tube shapes) images.

3.2 Overview of the Proposed System
The proposed varicocele diagnosis system consists of three stages: preprocessing, processing, and detection and measurement, where each stage comprises several components. The first step, preprocessing, is responsible for smoothing the US image as well as extracting the ROI using threshold segmentation and a region property function for removing the surrounding unneeded parts of the image. The second stage is processing, which performs image enhancement and denoising. The third and final stage is edge detection, which utilizes the Canny edge detector to determine if the patient has a varicocele condition. That is, if the system detects any dilated veins in the ROI, the patient is diagnosed with varicocele; otherwise, the image is considered normal. Fig. 4 illustrates a diagram of the steps of the preprocessing, processing, and detection and measurement stages that comprise the proposed system.

Figure 4: A diagram of the stages that comprise the proposed system
Preprocessing is the first stage in the proposed system. At the beginning of this stage, a color mode is applied, followed by a median filter, and then threshold segmentation is performed with a 0.2 threshold parameter. After that, the system crops the image to eliminate the unneeded parts, such as the frame containing some written information. Finally, the ROI encompassing the veins is extracted by multiplying the cropped image by the median-filtered image.
The threshold parameter value (0.2) used in segmentation was obtained as follows. First, Otsu's method was applied to all input images and the average value of the results was computed. This average value was approximately 0.22. Then, multiple experiments were done with values near 0.22 to determine the threshold value that yields the best segmentation results for the dataset. Fig. 5 shows the preprocessing steps applied with three color-modes: Grayscale, RGB (Red Channel), and HSV.

Figure 5: Example demonstrating the steps of preprocessing: (a) Original US image, (b) Converting original image to different color modes, (c) Applying a Median filter, (d) Applying threshold segmentation with 0.2 parameter, (e) Removing unnecessary information, (f) ROI resulting from multiplying images of Part (c) and Part (e)
Some existing techniques are commonly used in cropping different types of medical images such as Magnetic Resonance Imaging (MRI) and Computed Tomography (CT) scans [26]. However, US images present extra challenges that make conventional methods inadequate. Processing US images acquired for varicocele diagnosis must consider the following issues.
• Expanded veins are not located in a fixed or specific place within the image.
• Different US images have different sizes while common cropping techniques normally require images to have fixed dimensions.
• Common cropping techniques are more suited for other image types, such as MRI and CT scan, where the patient is placed in a fixed location with a fixed posture to capture the image. This placement cannot be applied with US images since the specialist moves a mobile camera to find the area with possible expanded veins.
The region property technique, used in the detection of breast cancer [27], can move in the high and low areas in the image to identify regions with specific properties. We have applied the same technique in the preprocessing stage of the proposed system to overcome the challenges mentioned above. The steps of this stage are described in detail in the following sub-subsections.
Preprocessing starts with applying a color mode where three different modes (RGB, HSV, and grayscale) are examined to choose the mode that produces the best results. With the RGB mode, we experimented with red, green, and blue channels and found the red channel to be the most suitable for detecting blood vessels in general and varicocele in particular. Additionally, the grayscale mode was applied because it is known to reduce the computational complexity of the system [28]. Furthermore, each pixel in the greyscale image is a single value, which simplifies the detection and measurement of veins. The preprocessing is also applied with the HSV color mode, which can enhance the quality of images containing blurred details before applying an edge detector [29]. Moreover, HSV has been found to produce good recognition results when used with the Canny edge detector [30] or with Otsu segmentation [31]. Note that using the Canny edge detector with Otsu segmentation also produced good varicocele detection results in US images with other color modes [24].
3.3.2 Median Filter and Threshold Segmentation
The median filter is used for establishing and smoothing the borders of the input US image, thus increasing the efficacy of segmentation. Moreover, it reduces different types of noise in the images, such as impulsive and salt-and-pepper noise, while preserving the valuable characteristics and edges of the images. Fig. 5 illustrates how a (3 × 3)-median filter can be used with the three color-systems (RGB, HSV, and grayscale) and threshold segmentation. The threshold segmentation method is used with a 0.2 threshold value since it was found to produce a ROI similar to the region examined manually by medical experts. After threshold segmentation, details in the background of the image are removed (See Fig. 5e) and then the ROI is determined, as in Fig. 5f.
US images are known to be noisy and include some unwanted details of the examined area. Therefore, the processing stage needs to include different enhancement and denoising filters. We tried several arrangements of different filters and found the arrangement (Weiner filter, CLAHE filter, Average filter) to produce the best results. Among these three filters, the Average filter with a size of (3 × 3) had the highest impact on the results. Fig. 6 shows an example of these processing steps with different color modes: Grayscale, RGB (Red), and HSV.
3.5 Detection and Measurement Stage
This stage is the most significant in identifying the disease. It contains multiple steps and employs the Canny edge detector which was found to be better than other detectors in varicocele detection in US images [24]. The details of these steps are explained in the following sub-subsections.
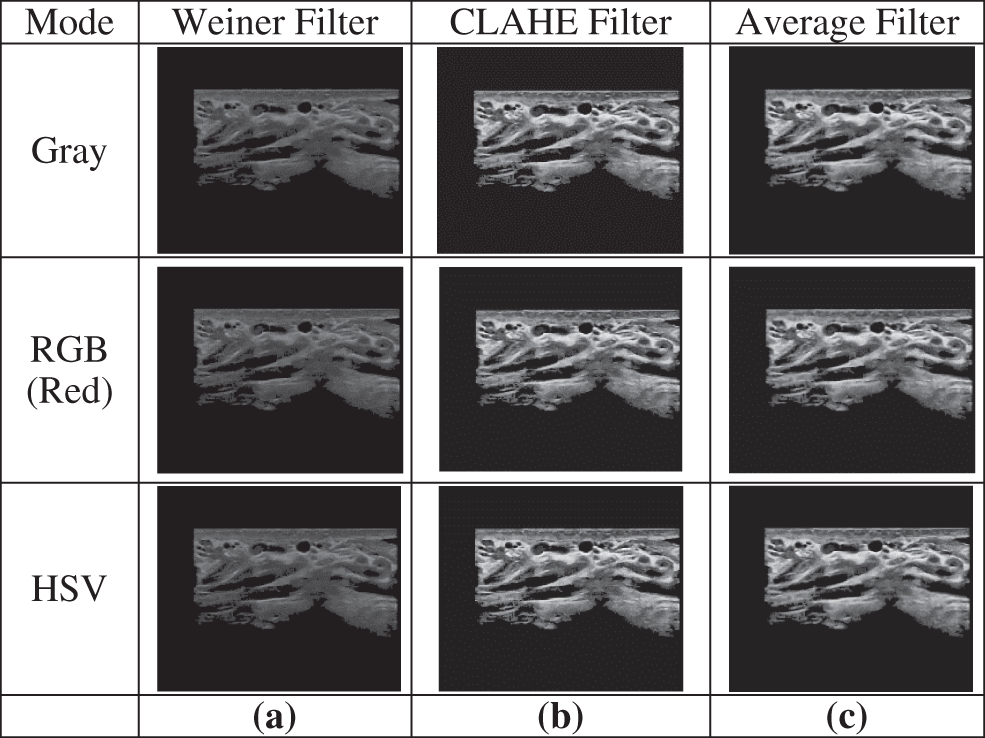
Figure 6: Example of the steps of the processing stage: (a) Applying a Weiner filter, (b) Applying a CLAHE filter, (c) Applying an average filter
The Canny edge detector [32] smooths the image by computing the gradient magnitude and orientation using finite-difference approximations for the partial derivatives. It applies non-maxima suppression to the gradient magnitude and uses a double thresholding algorithm to detect and link edges.
The edge detection algorithm used in the proposed system starts with the Canny edge detector and then applies more operations to identify the veins in the ROI. It segments the image by locating the areas of contrast variation. Changes in the contrast can be detected by gradient operators such as a Binary Gradient Mask and a Dilated Gradient Mask, as illustrated in Figs. 7a and 7b. However, the gradient operators create pepper noise and require image closing and inverse image closing for removing the noise. Additionally, the closing/inverse closing operations are needed to differentiate the outside environment from the particle interior and to close the particle boundaries. These two operations are illustrated in Figs. 7c and 7d. Then, the initial areas of the expanded veins in the ROI are located by identifying their boundaries, as shown in Fig. 7e.
3.5.2 Classifying and Measuring Shapes
After identifying the boundaries, the shapes of the veins visible in the image need to be classified as circular (cross-section) or non-circular (tube) structures. A circular shape can be identified as a circle by measuring its area (A) and circumference (C) and computing the ratio in Eq. (1) where k = 1 indicates a perfect circle.
Since the veins are not perfect circles, we identify near-circular shapes as those satisfying the condition in Eq. (2). A lower bound value of 0.5 was specified because experimental results showed that values less than 0.5 will cause more unwanted irregular shapes to be included in the region of interest. The upper bound value of 0.96 was chosen to exclude perfect circles since they are unlikely natural occurrences of vein shapes and they are usually created by noise or distortions during image acquisition.
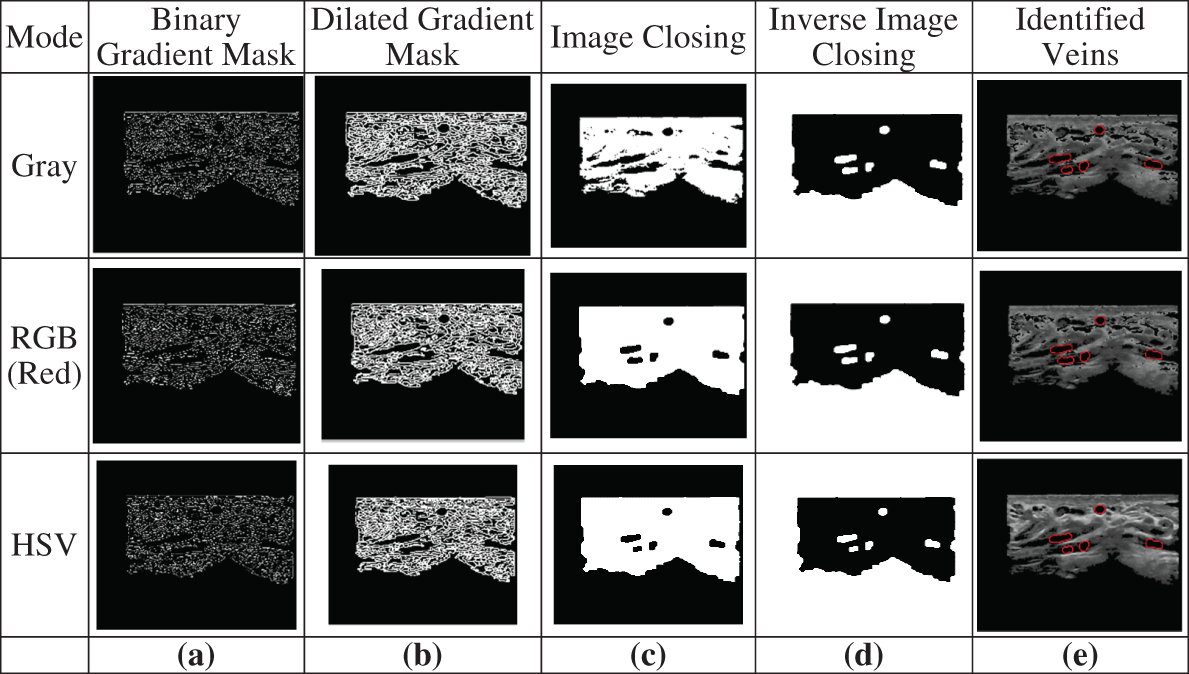
Figure 7: Example of edge detection: (a) Applying a Binary gradient mask, (b) Applying a dilated gradient mask, (c) Applying image closing, (d) Applying inverse image closing, (e) Identifying the boundaries surrounding the veins
For non-circular shapes, we calculate the Euclidean distance (d), measured in pixels, between the edges, as in Eq. (3). This equation is also used for computing the diameter of circular shapes.
To exclude non-dilated veins and non-vein tissues, the computed distance is limited by the condition in Eq. (4). This condition will also exclude any circular shapes identified in the previous step if these shapes are too large to be veins or too small to be identified as dilated (varicocele) veins. The lower bound (23) was experimentally determined to reduce false positive results. The upper bound (60) was based on medical information about varicocele. According to consulted medical experts, the maximum value of the diameter of a dilated vein in varicocele should not exceed five millimeters, and this value in the digital images in the dataset is equivalent to approximately 60 pixels.
Fig. 8 shows an example of the steps of the classification and measurement of circular and non-circular shapes. After identifying the boundaries surrounding the veins (Fig. 8a), round shapes are identified and the Euclidian distances are computed for all detected veins (Fig. 8b). Then, all veins having Euclidean distances out of the specified range are excluded (Fig. 8c). Finally, the detected varicocele veins are produced as output (Fig. 8d). In experimental analysis, this output is compared to the ground truth (Fig. 8e) for performance measurement. The ground truth for each image used in this paper was manually classified with the help of a medical expert.
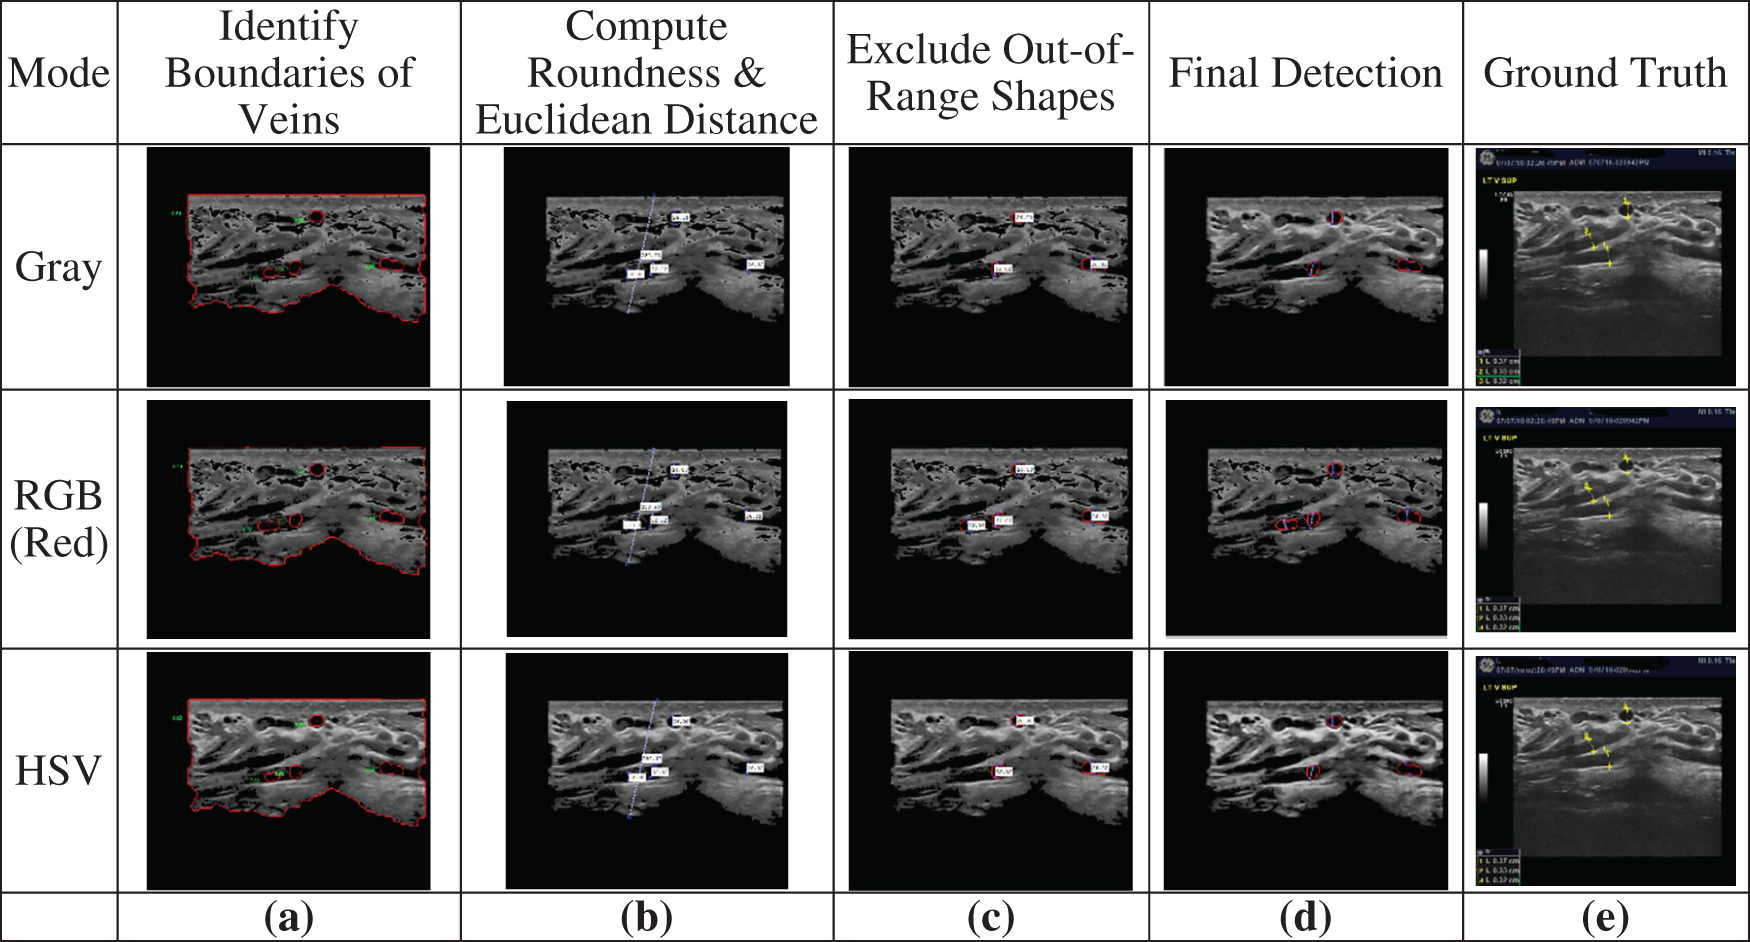
Figure 8: Example of classifying and measuring shapes: (a) Veins identified by edge detection, (b) Identifying round shapes and computing the Euclidian distances for all detected veins, (c) Identifying veins having Euclidean distance within range, (d) The detected varicocele veins, (e) The ground truth
4 Experimental Results and Analysis
The confusion matrix, also called the contingency table, is a commonly used method used in the performance evaluation of detection and identification algorithms. It is based on four classification parameters: True Positive (TP), True Negative (TN), False Positive (FP), and False Negative (FN). TP indicates the positive classification for a positive case. FP is the positive classification for a negative case. TN is the negative classification for a negative case. FN is the negative classification for a positive case. There are several measures for determining the performance of the classification based on the confusion matrix. The Accuracy is the ratio of correctly classified instances [33], as computed in (5), where TP, FP, TN, FN represent the number of true positives, false positives, true negatives, and false negatives, respectively.
Other performance measures include Sensitivity, Specificity, Positive Predictive Values (PPV), and Negative Predictive Value (NPV), given by Eq. (6) through Eq. (9). Sensitivity and specificity represent the ratio of correct identification instances of patients with or without a disease, respectively. That is, they represent the proportions of correctly diagnosed patients by the system based on the ground truth. PPV is the proportion of true positive results to all positive results. Likewise, NPV is the proportion of true negative results to all negative results. These ratios are often expressed as percentages where the ideal value for each of them is 100%, and the worst possible value is zero.
The experimental results in detecting varicocele disease were evaluated based on the performance measures of a binary confusion matrix, extended as shown in Tab. 2. Examples of US image classification according to the confusion matrix are shown in Fig. 9.

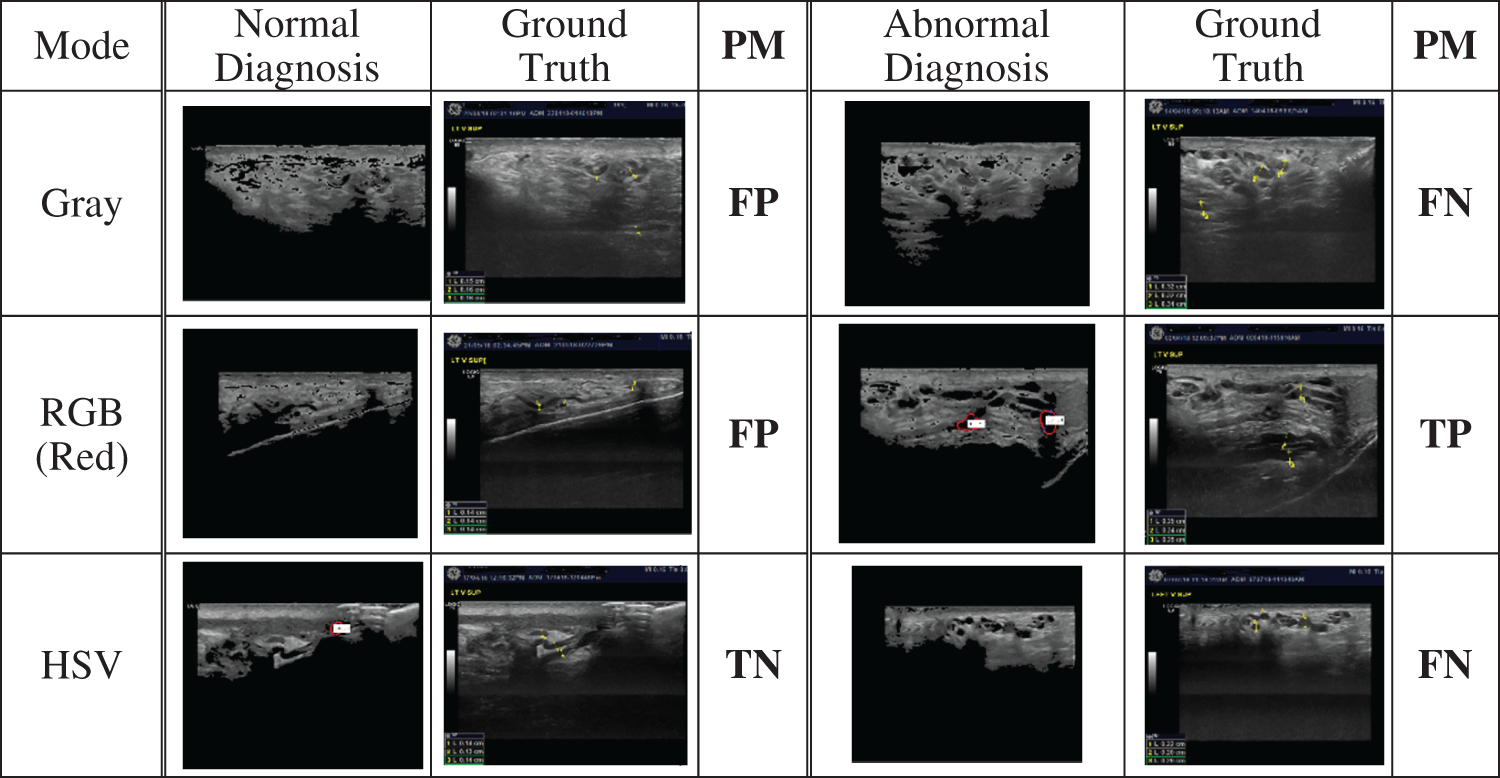
Figure 9: Samples of images classified by the system as normal or abnormal, their ground truth classifications, and their performance measurements (PM) based on the confusion matrix
4.2 Implementation Results and Analysis
The proposed system was implemented in MATLAB and tested on a personal computer with a dataset consisting of 90 US images obtained from a local hospital in Amman, Jordan. The images were taken of the testicle area to diagnose varicocele disease in males whose ages ranged from 13 to 63 years. The US image dataset consists of 22 normal images and 78 abnormal (varicocele) images as classified by a medical expert who established the ground truth. The original images were provided in DICOM format with different sizes, and they were converted by our system into PNG format.
As seen in Tab. 3 and illustrated in Fig. 10, the best (highest) accuracy, sensitivity, and PPV values were obtained with the RGB (Red Channel) mode while the best (highest) specificity and NPV values were obtained with the HSV color mode. Nevertheless, the differences between the values obtained with different color modes for all five measures were three percentage points or less. The best (least) execution time was achieved with the grayscale color mode, as seen in Fig. 11. Despite the relatively low accuracy values, the PPV values were high. This reflects a high probability that a positive test result correctly indicates the presence of the disease.


Figure 10: System performance measures with different color modes

Figure 11: System execution time with different color modes
When comparing the results of the proposed system with the one presented by AlZoubi et al. [24], as seen in Tab. 4, the proposed system appears to surpass it only in terms of specificity (43.5% vs. 39%) and execution time (6.34 vs. 11.67 s). However, this simple comparison is not objective because AlZoubi et al. [24] indicated that their results were obtained when applying threshold segmentation with a threshold parameter of 0.1 and that a threshold value of 0.2 produced noticeably lower values. On the other hand, the proposed system was applied with a threshold value of 0.2 because it limited the ROI to an area similar to that examined by the medical experts and, consequently, provided a more meaningful comparison to the ground truth supplied by these experts. Furthermore, the experimental results of this paper showed that processing with an average filter produced better detection results than the Gaussian filter used by AlZoubi et al. [24], as seen in the samples in Fig. 12.


Figure 12: Samples of images with vein detection results after being processed using an average filter vs. using a Gaussian filter
In this research, US images were used to identify and segment the enlarged veins in the pampiniform venous plexus, which indicate varicocele disease. A novel system was developed to determine whether the potential patient is affected by varicocele. This system involves an area of limited previous work. The proposed system is faster, investigates an extra color mode and more image filters, and produces more meaningful results than the previous work. It was applied to 90 US images that were taken of the left testicles in the supine position of 90 patients. It was applied with three color-modes (Grayscale, RGB, and HSV), threshold segmentation, different image denoising filters, and multiple steps of edge detection and vein measurement. These techniques were effective with both tube and cross-section vein structures.
The system was implemented and tested using parameters that produced a ROI similar to the one used by medical experts. Implementation results with the above three color-modes showed small performance differences among these modes. The best accuracy, sensitivity, and PPV values were obtained with the RGB (Red Channel) mode while the best specificity and NPV values were obtained with the HSV color mode. The best execution time was achieved with the grayscale color mode.
In future work, researchers can apply other image denoising techniques [34,35] and other color modes, such as L*a*b* and L*C*h, and study their effects on the efficacy of the system. In addition, automated varicocele diagnosis may be done using Neural Networks since many medical applications are employing them in designing better medical diagnostics systems [36]. A recent review of machine learning approaches, such as support vector machines, deep learning, and neural networks, showed that they significantly increased the recognition performance of tumors in MRI images [37]. Therefore, it is motivating to investigate using such methods in the recognition of varicocele in US images, especially deep learning techniques.
Acknowledgement: The authors extend their sincere thanks to everyone who contributed to the completion of this work, especially the hospital in Amman, Jordan, that provided the dataset and its radiologist who extracted the images from US machines. The authors owe a debt of gratitude to Dr. Tareq Shbelat, Head of Radiology Department at Al Nadeem Hospital in Madaba, Jordan, who helped analyze and classify the US images.
Funding Statement: The authors received no specific funding for this study.
Conflicts of Interest: The authors declare that they have no conflicts of interest to report regarding the present study.
1. J. Guerrero, S. E. Salcudean, J. A. McEwen, B. A. Masri and S. Nicolaou, “Real-time vessel segmentation and tracking for ultrasound imaging applications,” IEEE Transactions on Medical Imaging, vol. 26, no. 8, pp. 1079–1090, 2007. [Google Scholar]
2. S. Pauroso, N. Di Leo, I. Fulle, M. Di Segni, S. Alessi et al., “Varicocele: Ultrasonographic assessment in daily clinical practice,” Journal of Ultrasound, vol. 14, no. 4, pp. 199–204, 2011. [Google Scholar]
3. S. C. Esteves, C. -L. Cho, A. Majzoub and A. Agarwal, Varicocele and Male Infertility: A Complete Guide. Switzerland: Springer Nature, 2019. [Google Scholar]
4. G. Liguori, C. Trombetta, G. Garaffa, S. Bucci, I. Gattuccio et al., “Color Doppler ultrasound investigation of varicocele,” World Journal of Urology, vol. 22, no. 5, pp. 378–381, 2004. [Google Scholar]
5. L. Rocher, J. -L. Gennisson, J. Barranger, A. Rachas, A. Criton et al., “Ultrasensitive Doppler as a tool for the diagnosis of testicular ischemia during the valsalva maneuver: A new way to explore varicoceles?,” Acta Radiologica, vol. 60, no. 8, pp. 1048–1056, 2019. [Google Scholar]
6. Y. S. Kim, S. K. Kim, I. -C. Cho and S. K. Min, “Efficacy of scrotal Doppler ultrasonography with the valsalva maneuver, standing position, and resting-valsalva ratio for varicocele diagnosis,” Korean Journal of Urology, vol. 56, no. 2, pp. 144–149, 2015. [Google Scholar]
7. B. B. Najari, M. J. Katz, M. L. Schulster, D. J. Lee, P. S. Li et al., “Increased body mass index in men with varicocele is associated with larger spermatic vein diameters when supine,” Urology, vol. 89, pp. 40–44, 2016. [Google Scholar]
8. M. Bertolotto, S. Freeman, J. Richenberg, J. Belfield, V. Dogra et al., “Ultrasound evaluation of varicoceles: Systematic literature review and rationale of the ESUR-SPIWG guidelines and recommendations,” Journal of Ultrasound, vol. 23, no. 4, pp. 487–507, 2020. [Google Scholar]
9. D. Angelova and L. Mihaylova, “Contour segmentation in 2D ultrasound medical images with particle filtering,” Machine Vision and Applications, vol. 22, no. 3, pp. 551–561, 2011. [Google Scholar]
10. D. L. Pham, C. Xu and J. L. Prince, “Current methods in medical image segmentation,” Annual Review of Biomedical Engineering, vol. 2, no. 1, pp. 315–337, 2000. [Google Scholar]
11. S. Al-Zu'bi, B. Hawashin, A. Mughaid and T. Baker, “Efficient 3D medical image segmentation algorithm over a secured multimedia network,” Multimedia Tools and Applications, vol. 80, no. 11, pp. 16887–16905, 2021. [Google Scholar]
12. A. Halder, A. Sarkar and S. Ghose, “Adaptive histogram equalization and opening operation-based blood vessel extraction,” in J. Nayak, A. Abraham, B. Krishna, G. Chandra Sekhar, A. Das, (Eds.Soft Computing in Data Analytics, Advances in Intelligent Systems and Computing, vol. 758. Singapore: Springer, pp. 557−564, 2019. [Google Scholar]
13. L. Ma, H. Kiyomatsu, K. Nakagawa, J. Wang, E. Kobayashi et al., “Accurate vessel segmentation in ultrasound images using a local-phase-based snake,” Biomedical Signal Processing and Control, vol. 43, pp. 236–243, 2018. [Google Scholar]
14. J. D. Klingensmith, A. Haggard, R. J. Fedewa, B. Qiang, K. Cummings III et al., “Spectral analysis of ultrasound radiofrequency backscatter for the detection of intercostal blood vessels,” Ultrasound in Medicine & Biology, vol. 44, no. 7, pp. 141–1422, 2018. [Google Scholar]
15. V. Georgieva, P. Petrov and A. Mihaylova, “Ultrasound image processing for improving diagnose of renal diseases,” in Proc. 9th National Conf. with Int. Participation, ELECTRONICA 2018, Sophia, Bulgaria, pp. 1–4, 2018. [Google Scholar]
16. M. A. Abd Rahim, N. Othman and W. M. H. W. Mahmud, “Preliminary study of image processing techniques for the detection of varicocele based on 2D ultrasound images,” Journal of Physics: Conference Series, vol. 1049, no. 1, pp. 1–6, 2018. [Google Scholar]
17. E. Karami, M. S. Shehata and A. Smith, “Tracking of the internal jugular vein in ultrasound images using optical flow,” in Proc. Canadian Conf. on Electrical and Computer Engineering, Windsor, ON, Canada, pp. 1–4, 2017. [Google Scholar]
18. M. Ikhsan, K. K. Tan, A. S. Putra, T. H. Sophia Chew and C. F. Kong, “Automatic identification of blood vessel cross-section for central venous catheter placement using a cascading classifier,” in Proc. Annual Int. Conf. of the IEEE Engineering in Medicine and Biology Society, EMBS, Jeju, Korea (Southpp. 1489–1492, 2017. [Google Scholar]
19. L. Licev, K. Feberova, J. Tomecek and J. Hendrych, “An enhanced method for automatic detection and segmentation of carotid artery in ultrasound images,” ACM International Conference Proceeding Series, vol. 1164, no. June, pp. 206–213, 2016. [Google Scholar]
20. S. Latha, D. Samiappan and R. Kumar, “Carotid artery ultrasound image analysis: A review of the literature,” Proceedings of the Institution of Mechanical Engineers, Part H: Journal of Engineering in Medicine, vol. 234, no. 5, pp. 417–443, 2020. [Google Scholar]
21. J. Kang, Z. Ma, H. Li, L. Xu and L. Zhang, “Automatic detection of arteriovenous nicking in retinal images,” in Proc. 2016 IEEE 11th Conf. on Industrial Electronics and Applications, ICIEA 2016, Hefei, China, pp. 795–800, 2016. [Google Scholar]
22. N. S. Narayan and P. Marziliano, “Echogenicity based approach to detect, segment and track the common carotid artery in 2D ultrasound images,” in Proc. Annual Int. Conf. of the IEEE Engineering in Medicine and Biology Society, EMBS, Milan, Italy, vol. 2015-November, pp. 2989–2992, 2015. [Google Scholar]
23. F. Ghadiri, M. R. Akbarzadeh-T and S. Haddadan, “Vessel segmentation based on sobel operator and fuzzy reasoning,” in Proc. 2011 1st Int. EConf. on Computer and Knowledge Engineering, ICCKE 2011, Mashhad, Iran, pp. 189–194, 2011. [Google Scholar]
24. O. AlZoubi, M. A. Awad and A. M. Abdalla, “Automatic segmentation and detection system for varicocele in supine position,” IEEE Access, vol. 9, pp. 125393–125402, 2021. [Google Scholar]
25. B. Sciolla, L. Cowell, T. Dambry, B. Guibert and P. Delachartre, “Segmentation of skin tumors in high-frequency 3-D ultrasound images,” Ultrasound in Medicine & Biology, vol. 43, no. 1, pp. 227–238, 2017. [Google Scholar]
26. R. Sumner, Processing RAW Images in MATLAB, Department of Electrical Engineering, University of California Sata Cruz, 2014. [Online]. Available: https://rcsumner.net/raw_guide/RAWguide.pdf. [Google Scholar]
27. A. Martellosio, M. Pasian, M. Bozzi, L. Perregrini, A. Mazzanti et al., “Dielectric properties characterization from 0.5 to 50 GHz of breast cancer tissues,” IEEE Transactions on Microwave Theory and Techniques, vol. 65, no. 3, pp. 998–1011, 2017. [Google Scholar]
28. T. Kumar and K. Verma, “A theory based on conversion of RGB image to gray image,” International Journal of Computer Applications, vol. 7, no. 2, pp. 7–10, 2010. [Google Scholar]
29. A. M. F. Alali, “Enhancement of illumination for medical image processing and early detection of lesions,” Turkish Journal of Computer and Mathematics Education (TURCOMAT), vol. 12, no. 12, pp. 4680–4688, 2021. [Google Scholar]
30. I. Maiti and M. Chakraborty, “A new method for brain tumor segmentation based on watershed and edge detection algorithms in HSV colour model,” in Proc. 2012 National Conf. on Computing and Communication Systems, Durgapur, India, pp. 1–5, 2012. [Google Scholar]
31. A. T. Somnathe and S. R. Reddy, “Image retrieval based on colour, texture and shape feature similarity score fusion using genetic algorithm,” PalArch's Journal of Archaeology of Egypt/Egyptology, vol. 18, no. 7, pp. 1669–1679, Apr. 2021. [Google Scholar]
32. R. Kirti and A. Bhatnagar, “Image segmentation using canny edge detection technique,” International Journal of Techno-Management Research, vol. 4, no. 4, pp. 8–14, 2017. [Google Scholar]
33. S. Aruna, S. P. Rajagopalan and L. V. Nandakishore, “Knowledge based analysis of various statistical tools in detecting breast cancer,” Computer Science & Information Technology, vol. 2, no. 2011, pp. 37–45, 2011. [Google Scholar]
34. A. M. Abdalla, M. S. Osman, H. Alshawabkah, O. Rumman and M. Mherat, “A review of nonlinear image-denoising techniques,” in Proc. 2nd World Conf. on Smart Trends in Systems, Security and Sustainability, WorldS4 2018, London, UK, pp. 84–89, 2019. [Google Scholar]
35. J. Hu, Z. Lei, X. Li, Y. He and J. Zhou, “Ultrasound speckle reduction based on histogram curve matching and region growing,” Computers, Materials and Continua, vol. 65, no. 1, pp. 705–722, 2020. [Google Scholar]
36. I. Ozsahin and D. U. Ozsahin, “Chapter 7-Neural network applications in medicine,” in W. Zgallai, (Ed.Biomedical Signal Processing and Artificial Intelligence in Healthcare, Cambridge, MA, USA: Academic Press, pp. 183–206, 2020. [Google Scholar]
37. R. Hajjo, D. A. Sabbah, S. K. Bardaweel and A. Tropsha, “Identification of tumor-specific MRI biomarkers using machine learning (ML),” Diagnostics, vol. 11, no. 5, pp. 1–27, 2021. [Google Scholar]
 | This work is licensed under a Creative Commons Attribution 4.0 International License, which permits unrestricted use, distribution, and reproduction in any medium, provided the original work is properly cited. |