DOI:10.32604/cmc.2022.025213
| Computers, Materials & Continua DOI:10.32604/cmc.2022.025213 | |
| Article |
User Recognition System Based on Spectrogram Image Conversion Using EMG Signals
1Interdisciplinary Program in IT-Bio Convergence System, Chosun University, Gwangju, 61452, Korea
2IT Research Institute, Chosun University, Gwangju, 61452, Korea
*Corresponding Author: Sung Bum Pan. Email: sbpan@chosun.ac.kr
Received: 16 November 2021; Accepted: 28 December 2021
Abstract: Recently, user recognition methods to authenticate personal identity has attracted significant attention especially with increased availability of various internet of things (IoT) services through fifth-generation technology (5G) based mobile devices. The EMG signals generated inside the body with unique individual characteristics are being studied as a part of next-generation user recognition methods. However, there is a limitation when applying EMG signals to user recognition systems as the same operation needs to be repeated while maintaining a constant strength of muscle over time. Hence, it is necessary to conduct research on multidimensional feature transformation that includes changes in frequency features over time. In this paper, we propose a user recognition system that applies EMG signals to the short-time fourier transform (STFT), and converts the signals into EMG spectrogram images while adjusting the time-frequency resolution to extract multidimensional features. The proposed system is composed of a data pre-processing and normalization process, spectrogram image conversion process, and final classification process. The experimental results revealed that the proposed EMG spectrogram image-based user recognition system has a 95.4% accuracy performance, which is 13% higher than the EMG signal-based system. Such a user recognition accuracy improvement was achieved by using multidimensional features, in the time-frequency domain.
Keywords: EMG; user recognition; spectrogram; CNN
In recent years, the ability to access various IoT services using mobile devices has become possible with the commercialized of 5G services, and such services have led to major changes in the interaction with the external environment which is not limited to only communication between users. 5G based mobile environment allows users to conveniently access services at anytime from anywhere on a real-time basis, and the structure of mobile networks has changed dramatically through information and communication technologies (ICT) technology [1]. Mobile device-based IoT services share value-added attributes such as ubiquity, localization, instant connectivity, personalization, and security. Based on these features of mobile devices, the range of service scope is further expanding to financial, health, life, and entertainment services such as Fig. 1 [2]. Therefore, as various IoT services become more common, user recognition research showing a high level of security and convenience in mobile devices is being conducted.

Figure 1: IoT services provided by 5G based mobile device
With the increasing popularity of various internet services using mobile devices, the user recognition method has attracted significant attention for the authentication of personal identity. The use of existing mobile device user recognition methods, such as inputting a designated password or using a specific device, is associated with issues related to password loss, device loss, and theft. Accordingly, user recognition technology using unique information or behavioral features of a user on mobile devices is emerging. User recognition technology is a technology that performs user recognition based on different features for each person by extracting and converting an individual's unique biometrics information or behavioral features instead of using a simple password [3].
The application of user recognition in a mobile device environment by utilizing user's biometrics information such as facial and fingerprint information has been done in various fields, including electronic banking, smart medical service, information and communications technologies, access control, and healthcare services [4]. However, in South Korea, an identification fraud incident in banking industry was reported in which a silicon fingerprint was produced using a three-dimensional printer, and an issue was identified where Face ID was unlocked using the face of a family member who looks similar to the user. With respect to overseas cases, there was an incident in which a German hacker group copied and hacked the iris information using a picture of the president of Russia, and a case has been reported in which finger vein information was implemented on a fake hand to pass a vein authentication system. In order to address such problems of biometrics information, there has been attention on a user recognition technology using bio-signals that are unique to each individual and generated inside the body.
Bio-signals are electrical signals that are generated inside the body and which have unique features for each individual. Electromyograms (EMGs), electrocardiograms (ECGs), and electroencephalograms (EEGs) are some representative bio-signals [5]. Studies are actively being conducted to improve the performance of user recognition technologies using ECG signals that contain unique features such as electrophysiological properties of the heart, the heart's position and size, and the physical conditions. However, the ECG signals have the drawback that the signals cannot be varied when they are externally exposed because of hacking threats. Further, in the ECG signals, the heart rate and the waveform may change based on an individual's physical activity, measurement time period, or psychological influence; hence, there is the problem of having segments where relatively large waveform changes occur and where relatively small waveform changes occur. However, the EMG signals that can address these drawbacks are relatively easier to acquire compared to ECG and EEG signals as they can measure the muscle of the desired region from the skin surface; they have the advantage of generating different signal patterns according to the muscles being used. In addition, the signals are unique to each individual because the degree of muscle development and physical activity varies for each person. There are ongoing studies on user recognition systems that employ the unique attributes of EMG signals for each person [6].
However, the existing feature extraction method using fast fourier transform (FFT) for the EMG signals can only analyze frequency components. There is a problem of having low recognition accuracy. To resolve this problem, this paper proposes an EMG signal-based user recognition system that extracts features in two-dimensional (2D) from a spectrogram image that can be analyzed multi-dimensionally in the time-frequency domain. The process of the proposed user recognition system using EMG signals is as follows. For user recognition, EMG signals are first pre-processed. Then, features are extracted in the time-frequency domain, and finally, the classifier is used to recognize the user by searching for the target with the highest similarity.
In the proposed method of this paper, the short-time fourier transform (STFT) is applied to extract 2D features from EMG signals in the time-frequency domain, and the extracted features are converted to EMG spectrogram images. The STFT is a transform method that can analyze the frequency content of a specific time period and extract time-frequency multidimensional features from continuous signals such as EMG signals. In the process, the time-frequency resolution is evaluated according to the changes in the window length, which is a parameter of the STFT, and a EMG spectrogram image is generated to find an optimal parameter that most accurately recognizes the user.
The system structure of the proposed method consists of an EMG database construction process, an EMG data pre-processing and normalization process, a conversion process that transforms EMG signals into spectrogram images, and a final classification process for user recognition. Based on the experimental results, the proposed system achieved a 95.4% recognition accuracy when the window length was set to 256, and all 12 channels of Ninapro2 DB composed of 40 subjects were used, which is a 2.4% improvement on the 93.08% recognition accuracy obtained when the window length was 512. It was also demonstrated that the user recognition accuracy obtained using the EMG images combined with 12 channels is 82.1%, revealing that the user recognition accuracy improved by more than 13% when the EMG signals are converted to spectrogram images.
This paper is organized as follows. Section 2 analyzes research trends and application areas using EMG signals, Section 3 describes the proposed user recognition system using EMG spectrogram images, and Section 4 analyzes the experimental methods and results for the proposed user recognition system. Finally, Section 5 discusses conclusions and future studies.
As shown in Tab. 1, EMG signals are applied in various fields such as muscle activity recognition, motion control, sign language recognition, and user recognition, by utilizing behavioral features. Initially, EMG signals were used mainly for medical purposes to determine and analyze muscle activity [7]. With the development of signal processing methods and algorithms, EMG signals generated from muscles have also been used for recognizing motions. For example, EMG signals are used to recognize muscle movements to control prosthetic hands or legs for patients with amputations or paralysis, and to recognize sign language and fingerspelling by using signals generated by the anterior forearm muscles or muscles around the wrist. Recently, user recognition studies have been conducted using features of different levels of muscle development and activity for each person.

Recognition research using the existing EMG signal recognized users by extracting behavioral features such as hand motion and gait. In addition, a method of fusing two or more hand motion features using at least two or more authentication factors, or a method of fusing EMG and electrocardiogram to recognize a user is being conducted. The technical structure of the user recognition system using the overall EMG signal is shown in Fig. 2. The first step involves the process of acquiring EMG signal data or composing a database using open datasets, the second step involves a pre-processing and normalization process to remove noise present in the raw signal data, and the third step involves the process of extracting features from the preprocessed signal data. Finally, the fourth step involves the process of evaluating user recognition accuracy using a classifier.

Figure 2: EMG signal-based user recognition system
EMG data are first constructed for user recognition. EMG data are composed of the muscles and gestures that are desired to be used. For hand gestures and wrist motion, open DBs, Ninapro2, and sEMG for Basic Hand Movements Data Set are available, and for leg motion open DB, the EMG Dataset in Lower Limb Dataset is available [17,18]. Data can be constructed using open DBs or acquired by direct measurements using development equipment, medical equipment, and wearable devices. For the data acquisition process, the EMG DB is constructed according to acquisition conditions such as the total number of gesture repetitions and rest time by configuring the gestures to be performed and allocating the muscle channels that are activated when performing the gesture.
The constructed DB needs to go through pre-processing as it contains noise generated from various environments. Noises that need to be removed include power line noise generated by the measuring equipment, modulated wave of 60-Hz band and white noise of broadband, noise that are due to differences in the accuracy and function of each disposable electrode, noise caused by human physiological interference, and noise occurring from the characteristics of muscle tissue. Pre-processing needs to be conducted to remove such noises. After identifying noises through frequency analysis, they can be removed by utilizing noise removal filters such as high-pass, low-pass, band-pass, Butterworth [19], and notch filters [20].
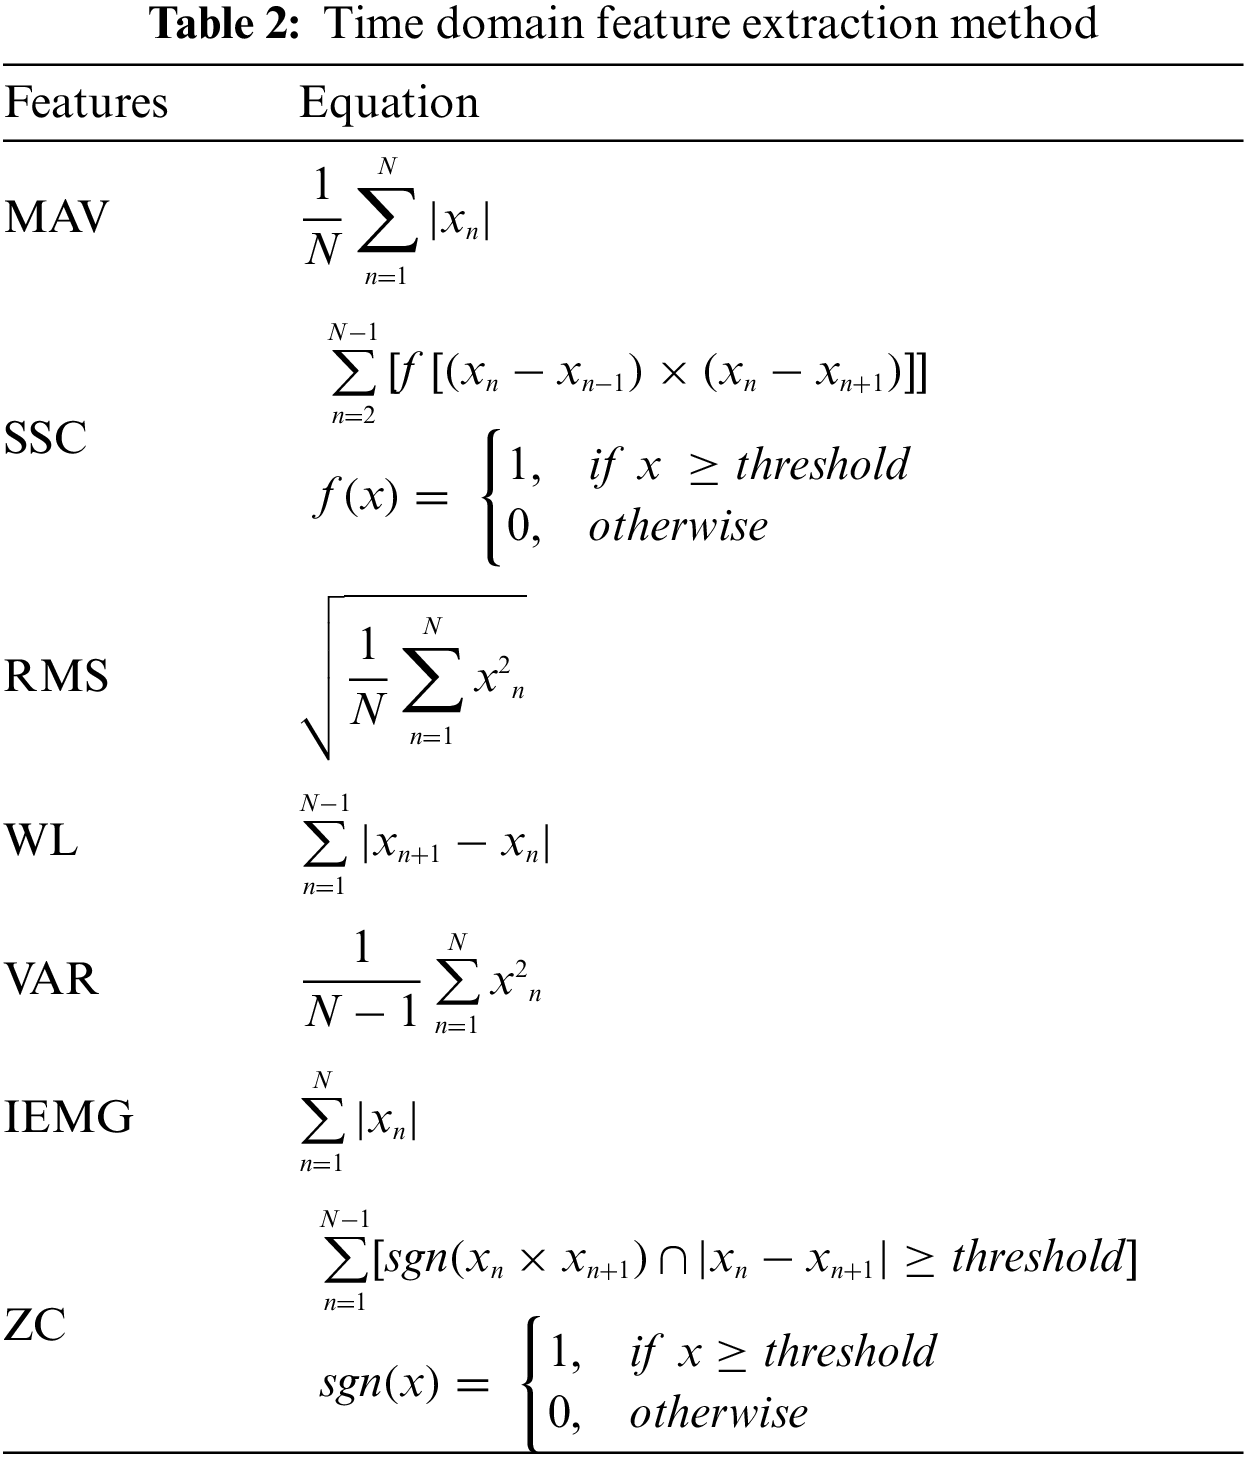
Features are extracted from the pre-processed EMG signal data. Feature extraction is mainly divided into time domain, frequency domain, and time-frequency domain. The time domain feature extraction methods include the mean absolute value (MAV), slope sign change (SSC), root mean square (RMS), waveform length (WL), variance (VAR), integrated EMG (IEMG), and zero crossing (ZC). Tab. 2 summarizes the equations for each method [21].
However, EMG signal recordings are continuous signals whose features change over time. Thus, even for the same gesture, it is challenging to find a coherent periodicity because it is difficult to repeat the gesture with a constant intensity at a certain time. FFT is one of the most widely used feature extraction methods in the frequency domain. FFT enables the transformation of a signal in time domain to frequency domain. However, the FFT method does not support analyses of the frequency components at the point of the desired time owing to its temporal limitations [22].
STFT is one of the most popular feature extraction methods for the time-frequency domain [23]. STFT is a method that overcomes the temporal limitations of the FFT method, and it enables the splitting of a longer time signal into shorter segments by setting the desired window length to perform Fourier transform on each of the split segments. Because the STFT method enables us to analyze the frequency components in time domain, it has been proven to be more efficient in performing analyses based on time-frequency multidimensional features by applying the EMG signals whose features change over time to the STFT, when compared with analyses using temporal and frequency features [24].
Models that are used for EMG signal classification tasks include machine learning and deep learning models. Machine learning is a technique that trains a machine to perform a task on its own to acquire the desired result, and it is mainly classified into supervised learning and unsupervised learning. Supervised learning employs a training method that uses labeled data, i.e., correct answers, and the support vector machine (SVM) is one of the most popular supervised learning methods [25]. Unsupervised learning employs a training method using unlabeled data, and it attempts to locate similar patterns by clustering. The k-nearest neighbor (KNN) of cluster analysis using clustering is one of the most popular unsupervised learning methods. Other classifiers include decision tree learning, random forest, principal component analysis (PCA) [26], and linear discriminant analysis (LDA) [27]. Deep learning is a type of machine-learning method that uses artificial neural networks (ANN) as its basis. It is a technology that solves problems that are difficult to train by configuring deeper layers of neural networks. Representative networks of deep learning include convolutional neural networks (CNN) and long short-term memory (LSTM). LSTM is an algorithm that addresses the problem of long-term dependencies of RNN, and it is widely used for data containing temporal features. CNN is the most popular deep learning method, and it is an effective algorithm for finding patterns in images [28].
3 User Recognition System using 2D Spectrogram Image based on EMG Signal
As shown in Fig. 3, the overall structure of the EMG spectrogram image-based user recognition system that is proposed in this paper includes an EMG database construction process, an EMG data pre-processing and normalization process, which is a conversion process that transforms EMG signals into spectrogram images, and a final classification process. First, the EMG signal dataset is constructed using an open database. Subsequently, because the constructed EMG data contain different types of noises, pre-processing is performed to remove the noises through filtering. Once the noises are removed from the EMG signals, the signals are split into cycle signals; then, the normalization is performed to reconstruct the data to combine the desired number of channels to be used. The pre-processed and normalized EMG signals are then converted into spectrogram images by applying STFT. Finally, CNN is used for user recognition.

Figure 3: 2D EMG spectrogram image-based user recognition system
First, EMG training and test data were constructed using Ninapro DB2. The noise included in the EMG signal was removed by bandpass and notch filters. Fig. 4a illustrates the EMG DB constructed after removing noises, and the signals were split into one cycle for each repetition cycle of each gesture, as shown in Fig. 4b. The EMG signal divided into one cycle is easy to check the activity of each channel, and in order to use all 12 muscle information, the signal for each channel of the same motion cycle is combined into a time domain as shown in Fig. 4c and reconstructed.
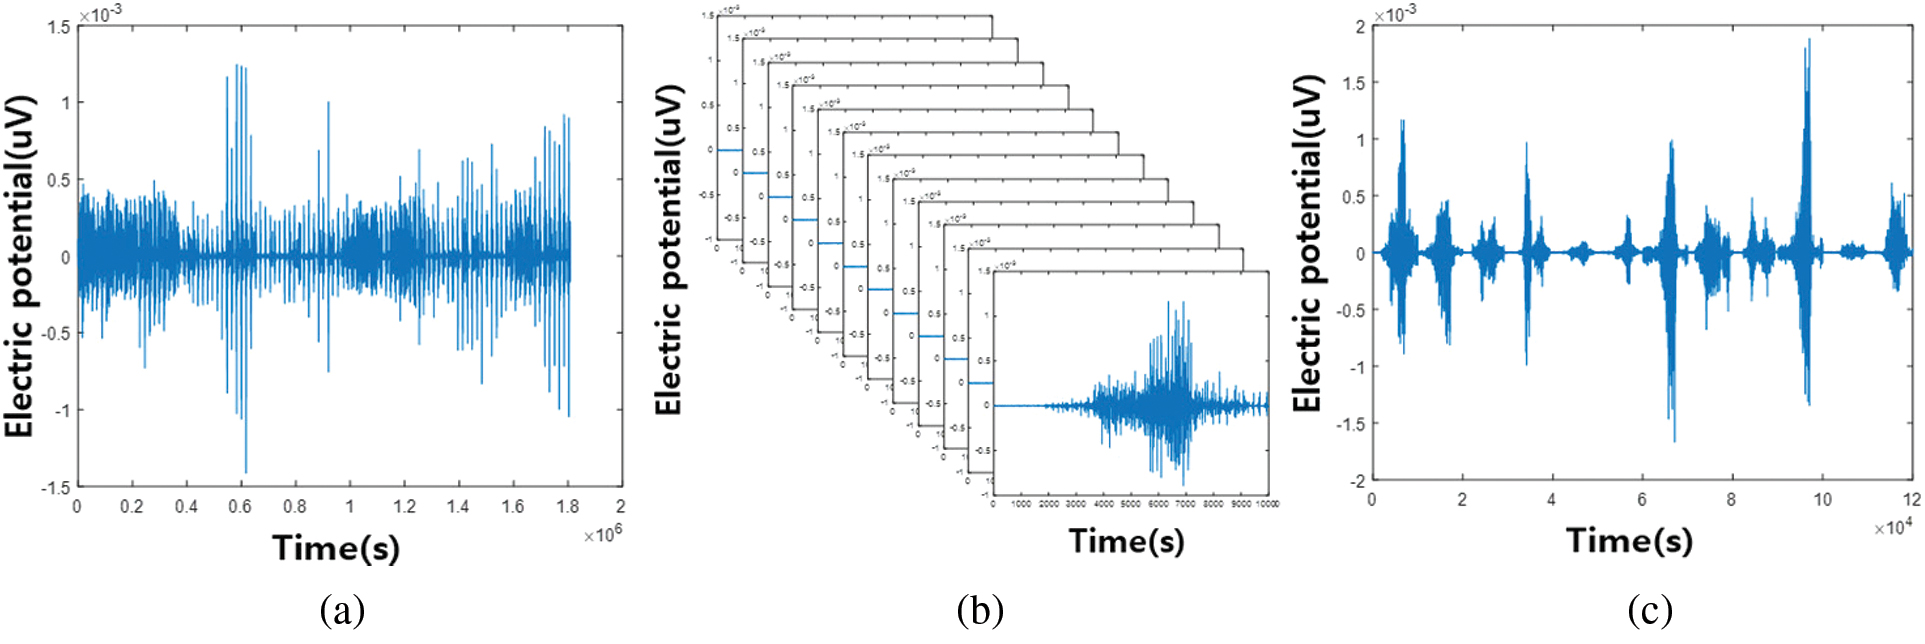
Figure 4: EMG signal pre-processing and normalization (a) EMG original signal (b) Split into one cycle signal (c) 12 channels combined
In this paper, multidimensional features were extracted by applying STFT, a time-frequency feature extraction method, to the pre-processed and normalized EMG signals. STFT is a method that overcomes the drawbacks of FFT in the existing frequency domain feature extraction method by analyzing frequency components at a desired time point for the signals that change over time. It enables the extraction of multidimensional features, including time and frequency domains. Eq. (1) describes the STFT that was applied in this paper.
The spectrogram conversion is performed based on the FFT length using the input signal
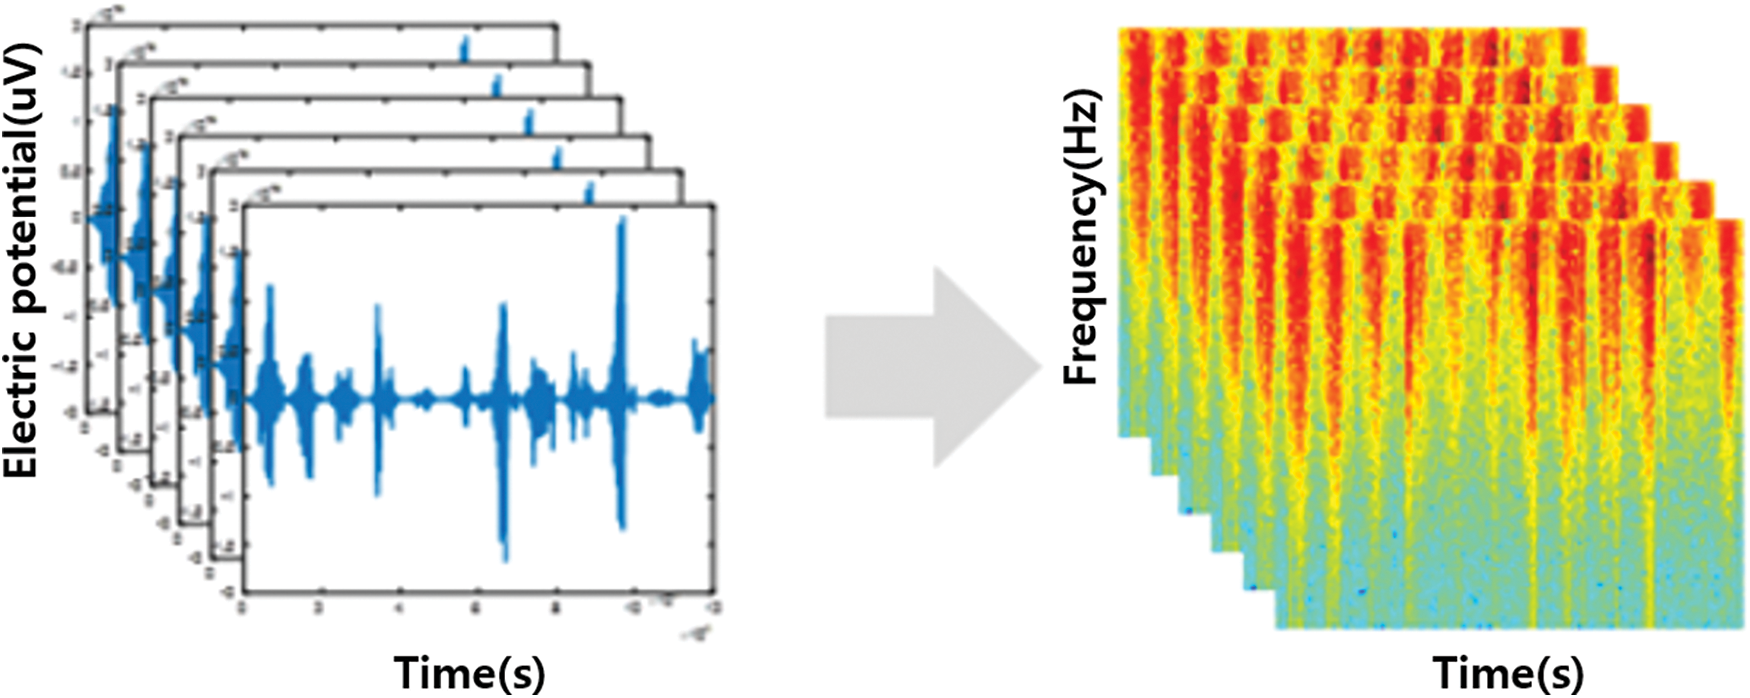
Figure 5: Conversion of EMG signals to spectrogram images
However, both the temporal and frequency resolutions cannot be improved simultaneously because the STFT feature extraction method performs the FFT based on a predefined window length
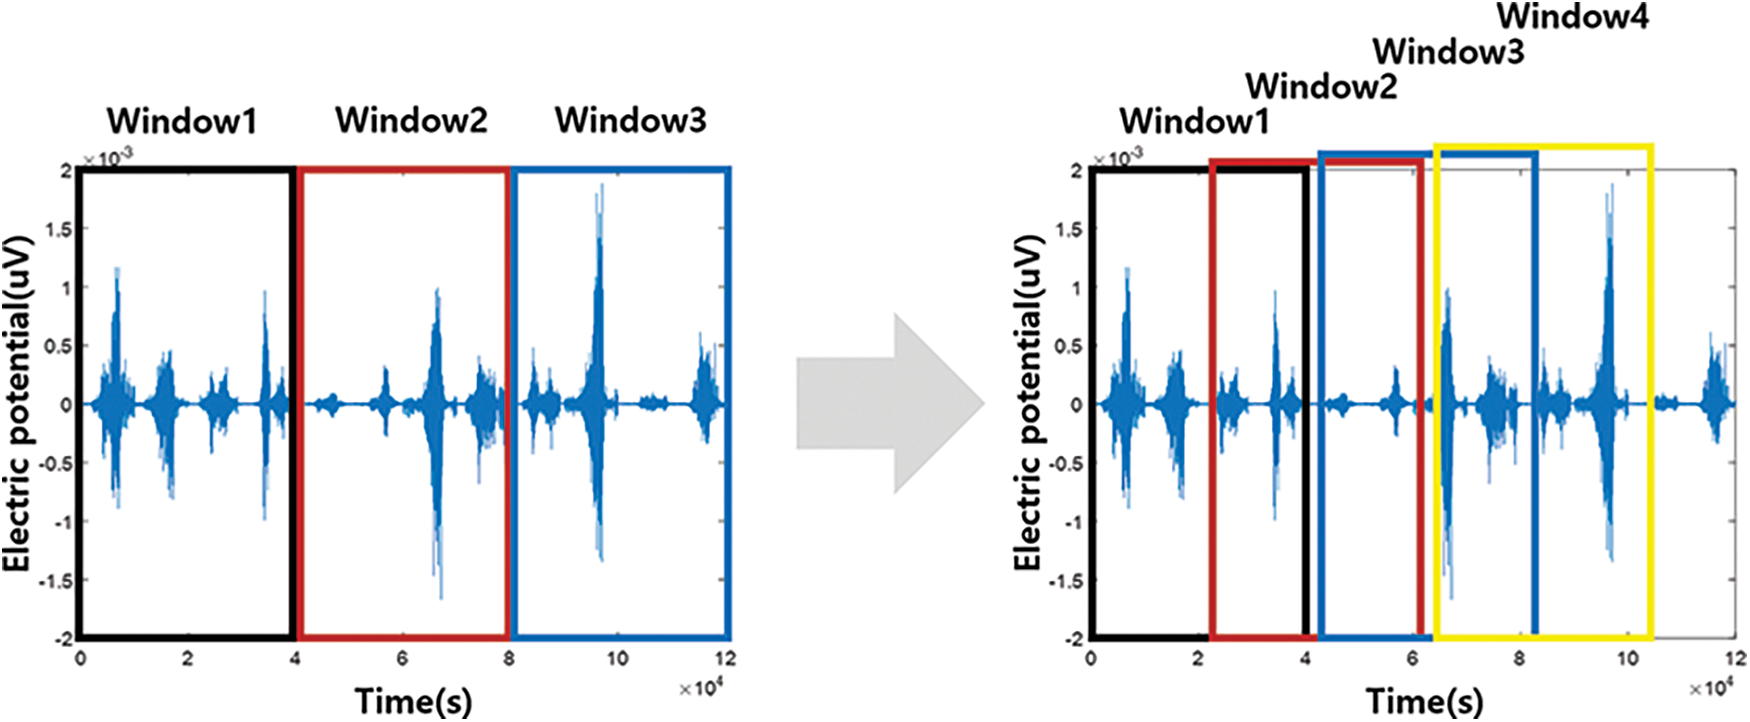
Figure 6: Overlap application in STFT
To evaluate the time-frequency resolution according to the change in the window length
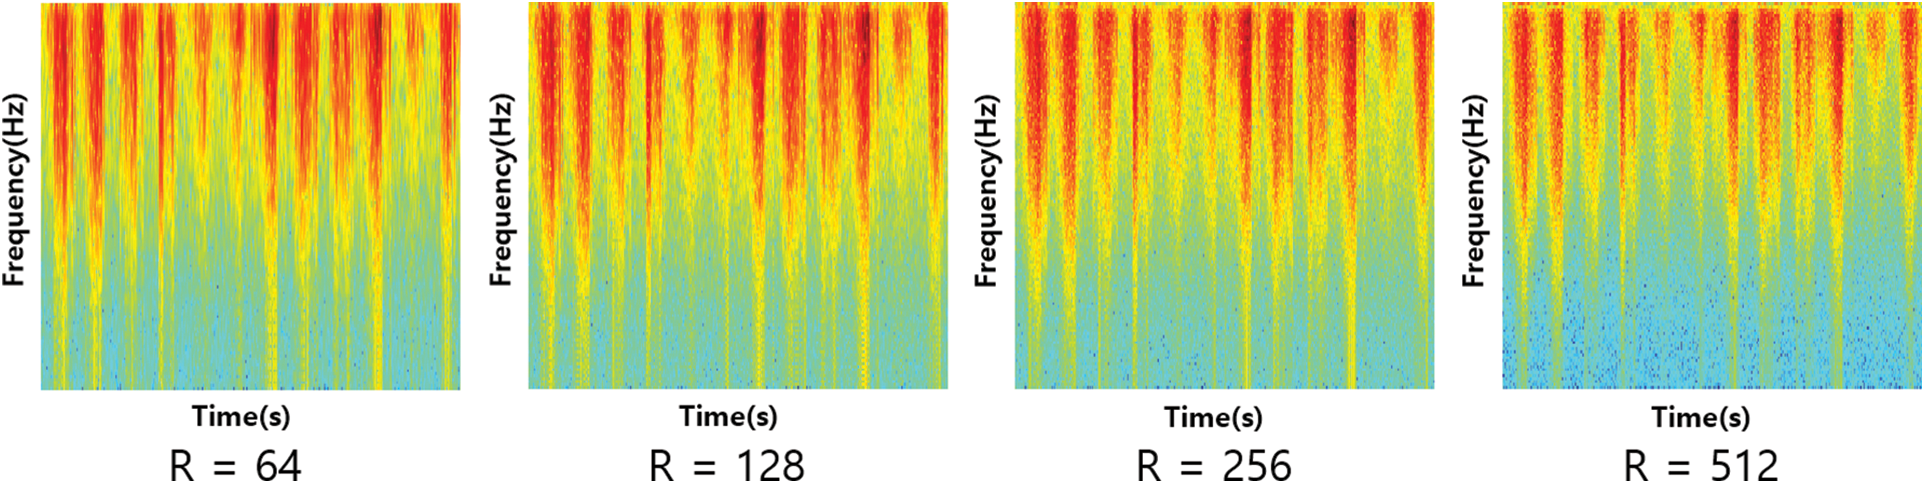
Figure 7: 2D spectrogram imaged according to STFT window length change
In this paper, EMG spectrogram images with different time-frequency resolutions are used to perform feature extraction and final classification. The final classification process is performed in the softmax layer of CNN. The configured CNN model consists of three convolutional layers, two max pooling layers, two fully connected layers, and ReLU activation function. The final classification is performed by the Softmax classifier. Fig. 8 displays the overall network structure. The filter size of the convolutional layer of the CNN model was set to
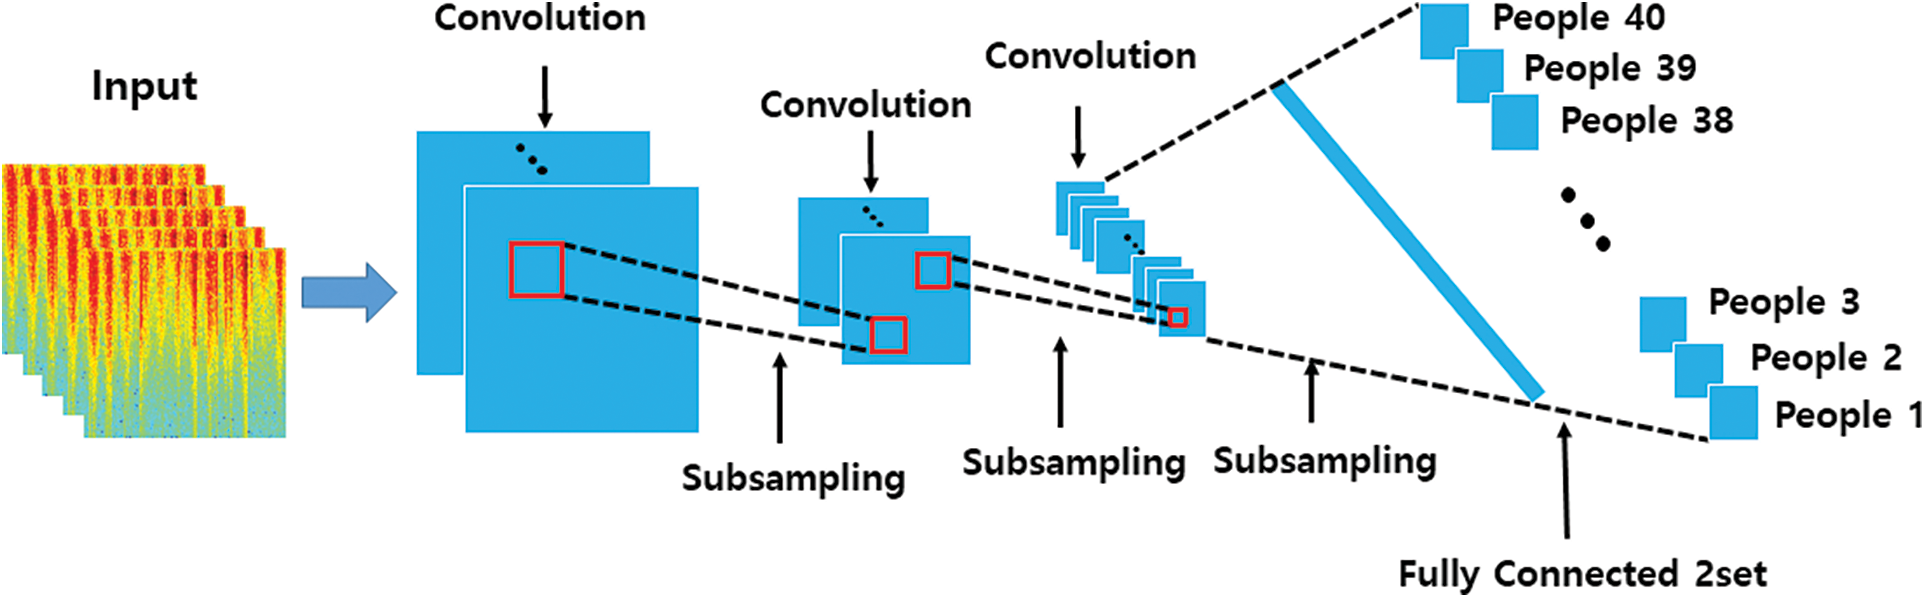
Figure 8: CNN model of network structure
4 Experimental Method and Results
The recognition system using the proposed EMG spectrogram image was analyzed with accuracy by 1:N matching for reproducibility. Ninapro DB2 composed of more subjects than other public DBs was used as experimental data. The Ninapro DB2 composition is shown in Tab. 3. It consists of a total of 40 subjects, and the data was organized using three hand gestures, such as Fig. 9, which were performed within the palm range, except for actions that were large in order to recognize hand gestures using hand gestures as ciphers. Each gesture was repeated six times for 5 s with a three second rest at a sample rate of 2000 Hz. A total of 12 channels were used, including the forearm muscle surroundings, biceps, and triceps [30]. In this paper, a total of 720 data were used as experimental data. The training and test data consisted of 7:3 ratio to verify the accuracy of the user recognition system. In addition, CNN designed with low single stream due to EMG data limitations.

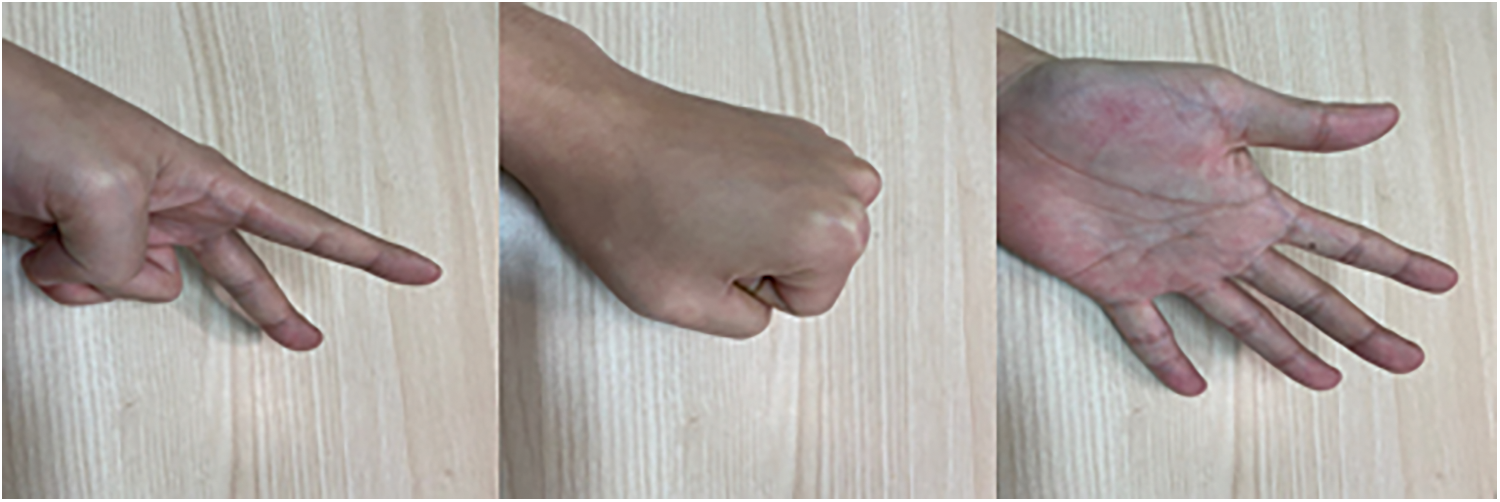
Figure 9: Three gestures of rock, paper, and scissors
To compare and analyze the proposed EMG spectrogram image-based user recognition system with the existing EMG signal-based user recognition, EMG signal data of the same DB were converted into images, and the user recognition accuracy was evaluated with the CNN. After combining the preprocessed EMG signal data with 12 channels in the time domain, the EMG signal were converted into images. The converted EMG signal images were used as input of the CNN model, and the images were finally classified after feature extraction.
To analyze the user recognition accuracy of the EMG spectrogram image-based system, the STFT parameter window length was configured as 64, 128, 256, and 512 to evaluate the recognition accuracy while altering the time-frequency resolution. The initial subject group consisted of 10 subjects, and it was increased to a maximum of 40 subjects in increments of 10. The channels were composed of 4, 8, and 12 channels to evaluate the change in recognition accuracy according to the change in the number of channels. In the final classification process, the average accuracy was evaluated by repeating the process five times to verify the user recognition accuracy.
Fig. 10 shows the variation in the user recognition accuracy with changes in the number of subjects when each group is composed of 10, 20, 30, and 40 subjects, and the same method is applied. It is demonstrated that the user recognition accuracy improves as the number of subjects decreases. Further, the recognition accuracy also improves as the number of muscle channels that are used increases. When the number of channels was set to 12 and the window length was set to 256, the recognition accuracy for each subjects group was 96.4% for 10 subjects, 96.2% for 20 subjects, and 95.9% for 30 subjects, showing the highest recognition accuracy than other window lengths. In addition, when the number of channels was reduced to 4 channels and the window length was set to 256, the recognition accuracy for each group was 92.1% for 10 group, 88.9% in the 20 subjects group, and 88.3% in the 30 subjects group showing the highest user recognition performance when using 256 window length. From the evaluation results for the user recognition accuracy differences according to the number of channels in each group, it was revealed that the 10, 20, and 30 subject groups showed differences of 4.3%, 7.3%, and 7.6%, respectively. For each channel, the sensitivity to changes in the user recognition accuracy was the lowest when the window length of 256 was applied and when the EMG signals were converted to EMG spectrogram images.
Fig. 10d displays the user recognition accuracy when the group was composed of 40 subjects, which is the largest number of subjects. Similar to other groups, the highest recognition accuracy was achieved when using all 12 channels compared to 4 channels and 8 channels. The user recognition accuracy also improved as the window length was increased from 64, and the highest accuracy of 95.4% was observed when the EMG spectrogram images converted using 12 channels and window length of 256 were used as inputs. In addition, when the window length is 256, the user recognition performance according to the channel is 4 channels 86.7%, 8 channels 90.6%, and 12 channels 95.4%, indicating that the change in user recognition accuracy is the lowest when using 256 windows compared to other windows.
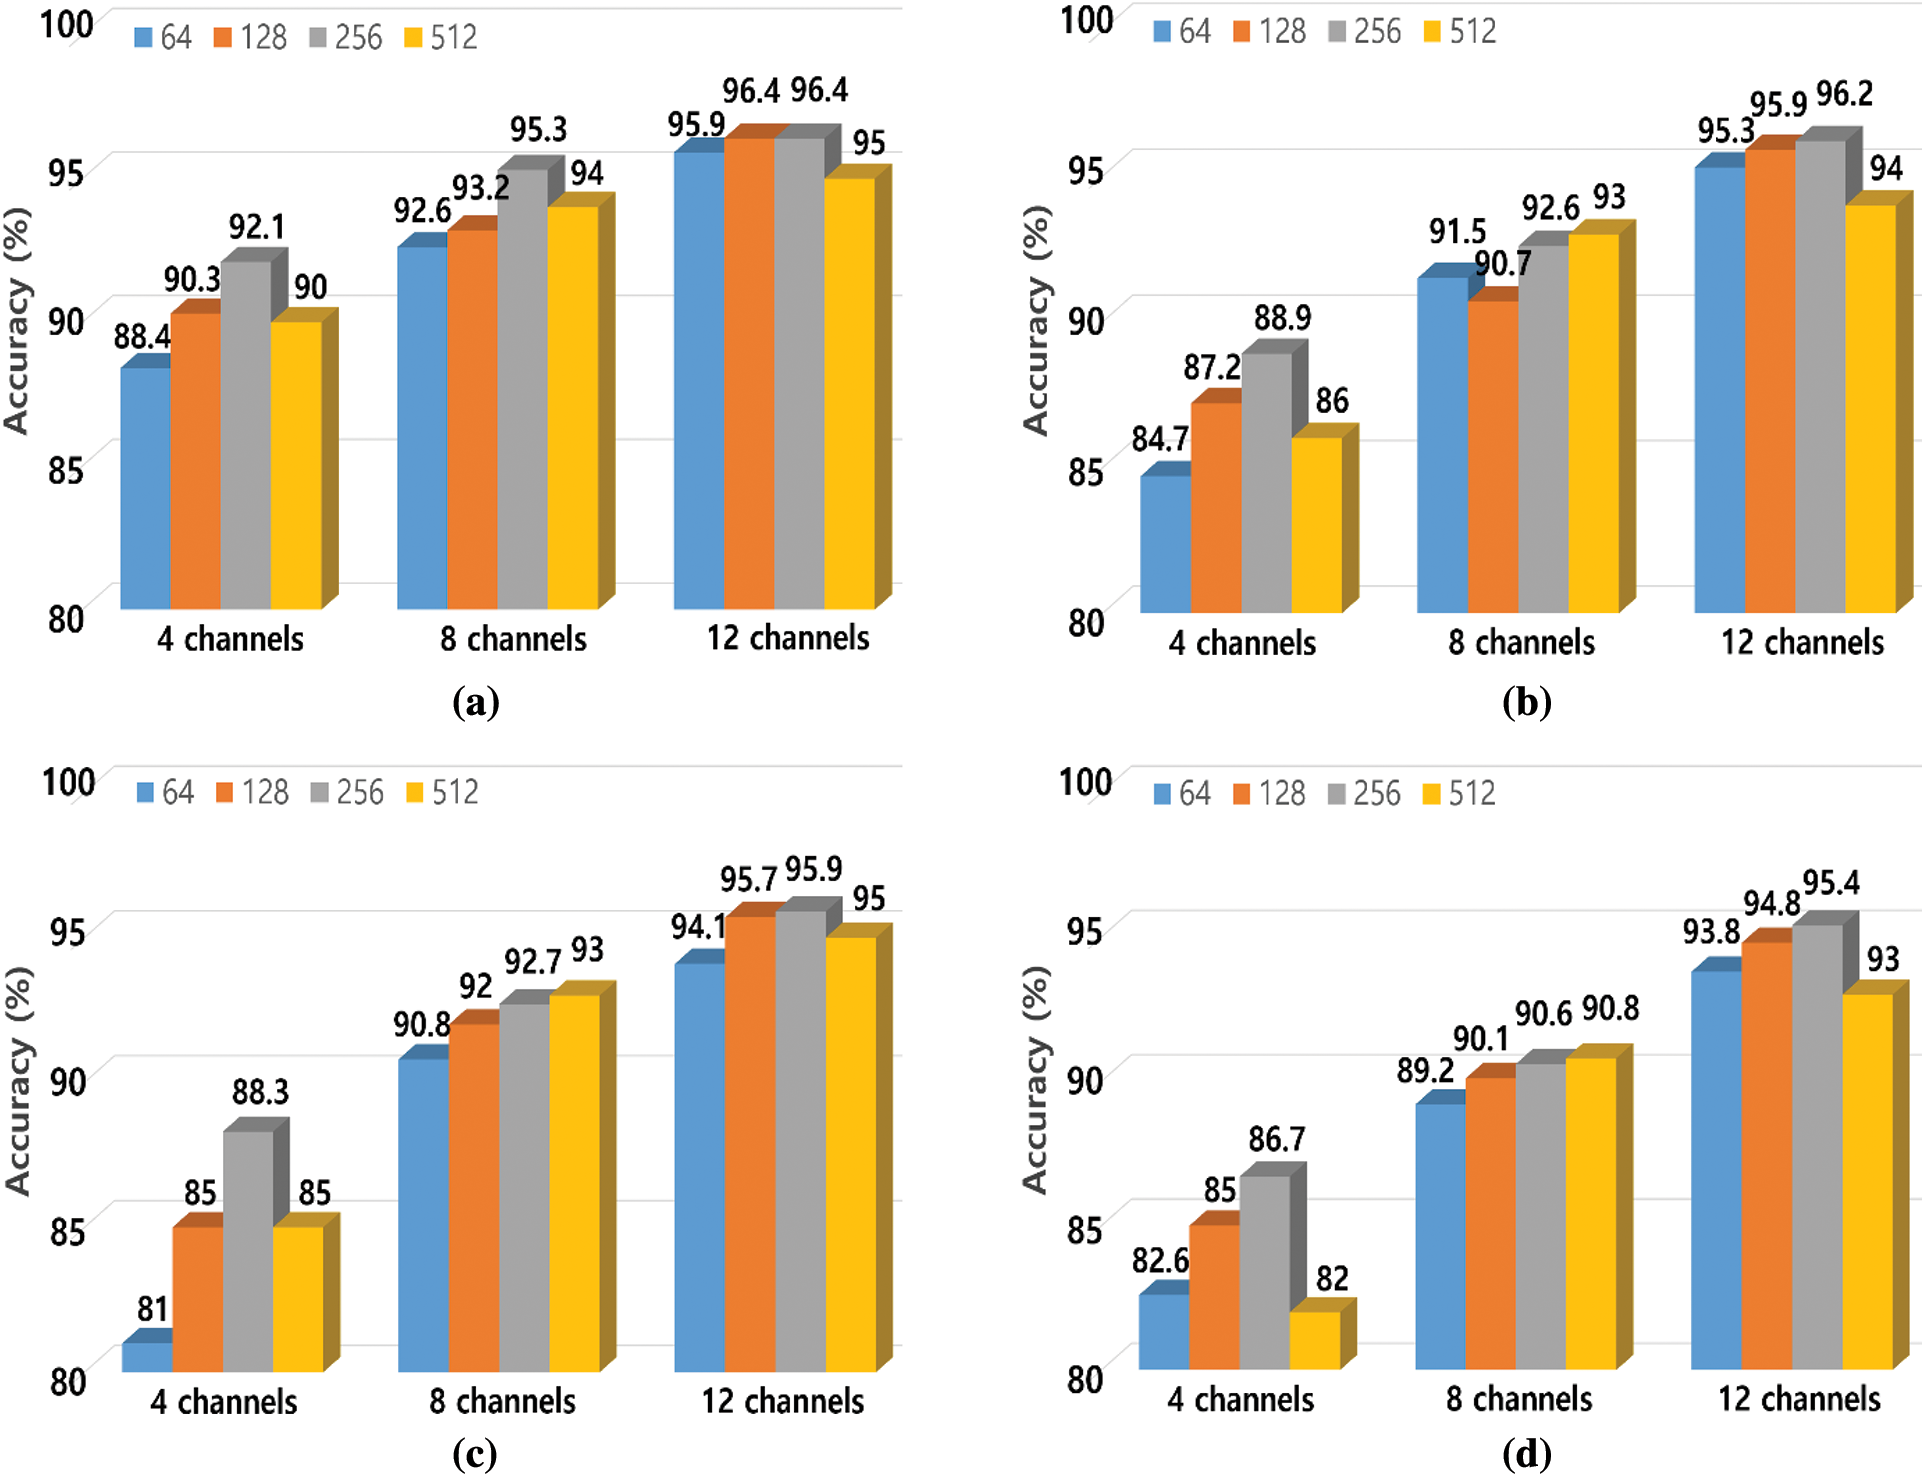
Figure 10: User recognition accuracy according to change in number of subjects (a) Group of 10 (b) Group of 20 (c) Group of 30 (d) Group of 40
In this paper, a comparative experiment was conducted with the feature extraction of the EMG signals using CNN to confirm the superiority of the proposed method. Hao et al. [31] conducted gesture recognition using the method of considering the time information and the method of spatial attention. Experiments showed 82.1% user recognition accuracy when used the CNN designed in this paper composed of time information like the method of Hao et al. and 86.4% user recognition accuracy was shown when used the ANN designed in this paper composed of time and frequency feature like the method of Shin et al. [15] and the user recognition accuracy obtained by converting the EMG signals into spectrogram images that can be analyzed in a multidimensional time-frequency domain was 95.4%. The results confirmed that the proposed method achieved a 13.3% and 9% accuracy improvement compared to when using EMG signals, as shown in Fig. 11. In addition, accuracy comparisons were conducted with existing user recognition studies using the same dataset. Zhai et al. [24] converted it to a two-dimensional image using spectrogram and recognized the user with open source library LIBSVM. As a result of the accuracy comparisons, 77.41% accuracy was shown when using SVM-based time-frequency features analysis methods using the input data configured in this paper. The user recognition accuracy with CNN and spectrogram features proposed in this paper was 95.4%, which is 18% higher than the analysis method of SVM-based time-frequency features, as shown in Fig. 11.
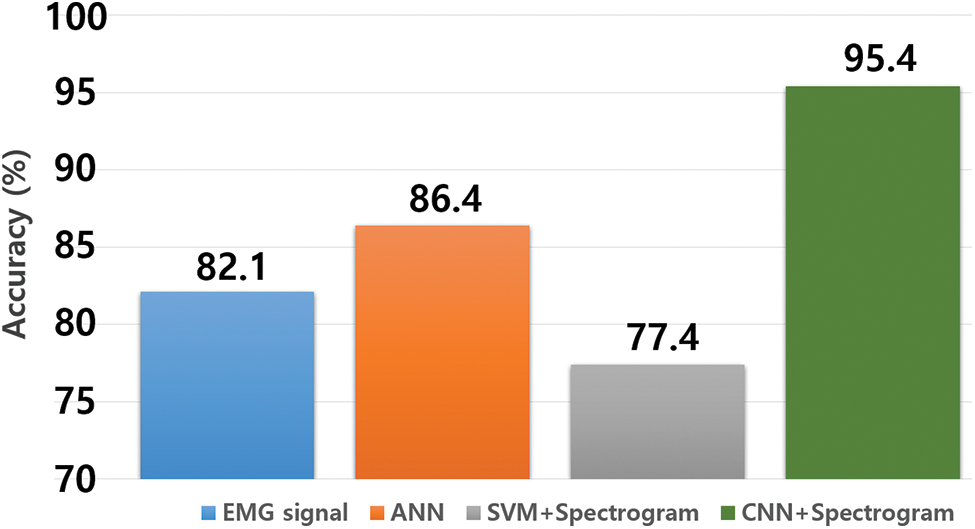
Figure 11: Comparison of EMG signal-based and EMG spectrogram image-based accuracy
In this paper, we proposed a user recognition system that extracts multidimensional features by applying STFT, which is a time-frequency feature extraction method, to the EMG signal data that converts the data to EMG spectrogram images to be used as the input to a CNN model. The proposed system is composed of an EMG database construction process, an EMG data pre-processing and normalization process, a conversion process that transforms EMG signals into spectrogram images, and a final classification process.
By using the proposed algorithm, we confirmed that its recognition accuracy for 40 subjects was 95.4% when using 12 channels and a window length of 256 and it was found and the sensitivity to changes in user recognition accuracy was the lowest even if the muscle channel decreased. When the user recognition was conducted after converting EMG signals to images, the average recognition accuracy for 40 subjects was 82.1%. In contrast, when the recognition was conducted using the proposed method that utilizes EMG spectrogram images, the average recognition accuracy for 40 subjects was 95.4%, resulting in a 13.3% user recognition accuracy improvement when the time-frequency multidimensional feature extraction method is employed. In addition, accuracy comparisons were conducted with existing user recognition studies. As a result of the accuracy comparisons, 77.4% accuracy was shown when using SVM-based feature analysis method. The user recognition accuracy with spectrogram features proposed in this paper was 95.4%, which is 18% higher than the analysis method of CNN based time features. Accordingly, we confirmed the feasibility of conducting user recognition using STFT to EMG signals to extract multidimensional features and adjusting the time-frequency resolution using the window length, which is a parameter of STFT. In a future paper, to improve the user recognition technique, we will acquire more EMG DB composed of diverse hand gestures from more subjects and then analyze the accuracy by utilizing deep learning.
Acknowledgement: Data Availability: The Ninapro DB2 used to support the findings of the study have been deposited in Ninaweb (http://ninaweb.hevs.ch/).
We thank the anonymous referees for their useful suggestions.
Funding Statement: This research was supported by Basic Science Research Program through the National Research Foundation of Korea (NRF) funded by the Ministry of Education (No. 2017R1A6A1A03015496) and the National Research Foundation of Korea (NRF) grant funded by the Korea government (MSIT) (No. NRF-2021R1A2C1014033).
Conflicts of Interest: The authors declare that they have no conflicts of interest to report regarding the present study.
1. H. K. Kim, “5G core network security issues and attack classification from network protocol perspective,” Journal of Internet Services and Information Security, vol. 10, no. 2, pp. 1–15, 2020. [Google Scholar]
2. M. S. Park, S. R. Kim and J. S. Kim, “Research on note-taking apps with security,” Journal of Wireless Mobile Networks, Ubiquitous Computing, and Dependable Applications, vol. 11, no. 4, pp. 63–76, 2020. [Google Scholar]
3. J. L. Wayman, “Technical testing and evaluation of biometric identification devices,” in Biometrics: Personal Identification in Networked Society, Boston, MA, USA: Springer, pp. 345–368, 1996. [Google Scholar]
4. J. Pathuel, “Biometric control systems and associated methods of use,” U.S. Patent Application, no. 11/159, 2005. [Google Scholar]
5. R. D. Luis-Garcia, C. Alberola-Lopez, O. Aghzout and J. Ruiz-Alzola, “Biometric identification systems,” Signal Processing, vol. 83, no. 12, pp. 2539–2557, 2003. [Google Scholar]
6. E. Scheme and K. Englehart, “Electromyogram pattern recognition for control of powered upper-limb prostheses: State of the art and challenges for clinical use,” The Journal of Rehabilitation Research and Development, vol. 48, no. 6, pp. 643–659, 2011. [Google Scholar]
7. X. Yang, X. Chen, X. Cao, S. Wei and X. Zhang, “Chinese sign language recognition based on an optimized tree-structure framework,” IEEE Journal of Biomedical and Health Informatics, vol. 21, no. 4, pp. 994–1004, 2017. [Google Scholar]
8. X. Chen, X. Zhang, Z. Zhao, J. Yang, V. Lantz et al., “Multiple hand gesture recognition based on surface EMG signal,” in Proc. ICBBE, Wuhan, China, pp. 506–509, 2007. [Google Scholar]
9. M. Haris, P. Chakraborty and B. V. Rao, “EMG signal based finger movement recognition for prosthetic hand control,” in Proc. CCIS, Mathura, India, pp. 194–198, 2015. [Google Scholar]
10. M. Leon, J. M. Gutierrez, L. Leija and R. Munoz, “EMG pattern recognition using support vector machines classifier for myoelectric control purposes,” in Proc. PAHCE, Rio de Janeiro, Brazil, pp. 175–178, 2011. [Google Scholar]
11. C. Savur and F. Sahin, “Real-time American sign language recognition system using surface EMG signal,” in Proc. ICMLA, Miami, FL, USA, pp. 497–502, 2015. [Google Scholar]
12. B. Divya, J. Delpha and S. Badrinath, “Public speaking words (Indian sign language) recognition using EMG,” in Proc. SmartTechCon, Bengaluru, India, pp. 798–800, 2017. [Google Scholar]
13. R. Shiohi, S. Ito, M. Ito and M. Fukumi, “Personal authentication and hand motion recognition based on wrist EMG analysis by a convolutional neural network,” in Proc. IOTAIS, Bail, Indonesia, pp. 184–188, 2014. [Google Scholar]
14. M. Lee, J. Ryu and I. Youn, “Biometric personal identification based on gait analysis using surface EMG signals,” in Proc. ICCIA, Beijing, China, pp. 318–321, 2017. [Google Scholar]
15. S. Shin, J. Jung, M. Kang and Y. T. Kim, “A study on EMG signal acquisition modules and artificial neural networks for personal authentication,” in Proc. CSCI, Las Vegas, NV, USA, pp. 1458–1459, 2018. [Google Scholar]
16. B. Fan, X. Liu, X. Su, P. Hui and J. Niu, “EmgAuth: An EMG-based smartphone unlocking system using siamese network,” in Proc. PerCom, Austin, TX, USA, pp. 1–10, 2020. [Google Scholar]
17. M. Atzori, A. Gjisberts, C. Castellini, B. Caputo, A. M. Hager et al., “Electromyography data for non-invasive naturally-controlled robotic hand prostheses,” Scientific Data, vol. 1, no. 1, pp. 1–13, 2014. [Google Scholar]
18. C. Sapsanis, G. Georgoulas and A. Tzes, “EMG based classification of basic hand movements based on time-frequency features,” in Proc. MED, Platanias, Greece, pp. 716–722, 2013. [Google Scholar]
19. I. W. Selesnick and C. S. Burrus, “Generalized digital butterworth filter design,” IEEE Transactions on Signal Processing, vol. 46, no. 6, pp. 1688–1694, 1998. [Google Scholar]
20. A. Nehorai, “A minimal parameter adaptive notch filter with constrained Poles and zeros,” IEEE Transactions on Acoustics, Speech, and Signal Processing, vol. 33, no. 4, pp. 983–996, 1985. [Google Scholar]
21. A. Phinyomark, S. Hirunviriya, C. Limsakul and P. Phukpattaranont, “Evaluation of EMG feature extraction for hand movement recognition based on Euclidean distance and standard deviation,” in Proc. ECTI-CON2010, Chiang Mai, Thailand, pp. 856–860, 2010. [Google Scholar]
22. D. D. Jayasree, “Classification of power quality disturbance signals using FFT, STFT, wavelet transforms and neural networks-a comparative analysis,” in Proc. ICCIMA, Sivakasi, India, pp. 335–340, 2007. [Google Scholar]
23. D. Huang and B. Chen, “Surface EMG decoding for hand gestures based on spectrogram and CNN-LSTM,” in Proc. CCHI, Xi'an, China, pp. 123–126, 2019. [Google Scholar]
24. X. Zhai, B. Jelfs, R. H. M. Chan and C. Tin, “Short latency hand movement classification based on surface EMG spectrogram with PCA,” in Proc. EMBC, Orlando, FL, USA, pp. 327–330, 2016. [Google Scholar]
25. M. A. Oskoei and H. Hu, “Support vector machine-based classification scheme for myoelectric control applied to upper limb,” IEEE Transactions on Biomedical Engineering, vol. 55, no. 8, pp. 1956–1965, 2008. [Google Scholar]
26. S. Wold, K. Esbensen and P. Geladi, “Principal component analysis,” Chemometrics and Intelligent Laboratory Systems, vol. 2, no. 1–3, pp. 37–52, 1987. [Google Scholar]
27. S. Mika, G. Ratsch, J. Weston, B. Scholkopf and K. R. Mullers, “Fisher discriminant analysis with kernels,” in Proc. IEEE Workshop on Neural Networks for Signal Processing, Madison, WI, USA, pp. 41–48, 1999. [Google Scholar]
28. T. Bao, A. Zaidi, S. Xie and Z. Zhang, “Surface-EMG based wrist kinematics estimation using convolutional neural network,” in Proc. BSN, Chicago, IL, USA, pp. 1–4, 2019. [Google Scholar]
29. T. N. S. T. Zawawi, A. R. Abdullah, E. F. Shair, I. Halim and O. Rawaida, “Electromyography signal analysis using spectrogram,” in Proc. SCOReD, Putrajaya, Malaysia, pp. 319–324, 2013. [Google Scholar]
30. Z. Zhang, K. Yang, J. Qian and L. Zhang, “Real-time surface EMG pattern recognition for hand gestures based on an artificial neural network,” Sensors, vol. 19, no. 14, pp. 3170, 2019. [Google Scholar]
31. S. Hao, R. Wang, Y. Wang and Y. Li, “A spatial attention based convolutional neural network for gesture recognition with HD-sEMG signals,” in Proc. HEALTHCOM, Shenzhen, China, pp. 1–6, 2021. [Google Scholar]
 | This work is licensed under a Creative Commons Attribution 4.0 International License, which permits unrestricted use, distribution, and reproduction in any medium, provided the original work is properly cited. |