DOI:10.32604/cmc.2022.025330
| Computers, Materials & Continua DOI:10.32604/cmc.2022.025330 | |
| Article |
Fault Pattern Diagnosis and Classification in Sensor Nodes Using Fall Curve
1Chitkara University Institute of Engineering and Technology, Chitkara University, Punjab, India
2Computer Science & Engineering Department, Lovely Professional University, Jalandhar, Punjab, India
3Department of Computer Science, College of Computers and Information Technology, Taif University, P. O. Box 11099, Taif, 21944, Saudi Arabia
4Higher Polytechnic School/Industrial Organization Engineering, Universidad Europea del Atlántico, Isabel Torres 21, 39011, Santander, Spain
5Department of Project Management, Universidad Internacional Iberoamericana, Campeche, 24560, Mexico
6Computer Science and Engineering Department, Deenbandhu Chhotu Ram University of Science and Technology, Murthal, Sonipat, Haryana, India
*Corresponding Author: Nitin Goyal. Email: dr.nitingoyal30@gmail.com
Received: 20 November 2021; Accepted: 11 January 2022
Abstract: The rapid expansion of Internet of Things (IoT) devices deploys various sensors in different applications like homes, cities and offices. IoT applications depend upon the accuracy of sensor data. So, it is necessary to predict faults in the sensor and isolate their cause. A novel primitive technique named fall curve is presented in this paper which characterizes sensor faults. This technique identifies the faulty sensor and determines the correct working of the sensor. Different sources of sensor faults are explained in detail whereas various faults that occurred in sensor nodes available in IoT devices are also presented in tabular form. Fault prediction in digital and analog sensors along with methods of sensor fault prediction are described. There are several advantages and disadvantages of sensor fault prediction methods and the fall curve technique. So, some solutions are provided to overcome the limitations of the fall curve technique. In this paper, a bibliometric analysis is carried out to visually analyze 63 papers fetched from the Scopus database for the past five years. Its novelty is to predict a fault before its occurrence by looking at the fall curve. The sensing of current flow in devices is important to prevent a major loss. So, the fall curves of ACS712 current sensors configured on different devices are drawn for predicting faulty or non-faulty devices. The analysis result proved that if any of the current sensors gets faulty, then the fall curve will differ and the value will immediately drop to zero. Various evaluation metrics for fault prediction are also described in this paper. At last, this paper also addresses some possible open research issues which are important to deal with false IoT sensor data.
Keywords: Fault identification; fault classification; IoT sensor nodes; analog sensors; digital sensors; fall curve
Internet of Things (IoT) technology has shown its productive nature in several sectors like industry, agriculture, healthcare, academia and many more [1–3]. IoT is gaining importance in almost every new research especially in industrial communities [4,5]. Currently, the global IoT market has reached $9.1 billion and the Compound Annual Growth Rate is rising at a rate of 40% by 2024 [6,7]. IoT is not just used as a point of communication for obtaining the data of physical objects but it collects a tremendous amount of data to monitor several methods that enhance the profit of companies. An idea of the architecture of IoT is shown in Fig. 1. IoT is capable to monitor real-time data which opens up a new area for researchers working on different applications. Sensors are fundamental elements that collect relevant raw data from a device to check the performance of the overall system and its dependent processes [8]. A faulty sensor produces corrupted data and predicting faults in IoT sensors is a quite difficult task [9]. IoT systems run continuously and generate a large volume of data so assuring accurate data fetched from IoT sensors is a critical task. So, a rigid monitoring process is required to validate the sensors’ performance. This process is sometimes referred to as sensor fault prediction which predicts faults in the sensor's readings that affect the working of the device. In the research domain, the prediction of faults is of great interest [10–13]. IoT-enabled systems gather information from different sensors through which unique insights can be achieved. Schemes for the identification of sensor faults use data-centric approach [14–18].
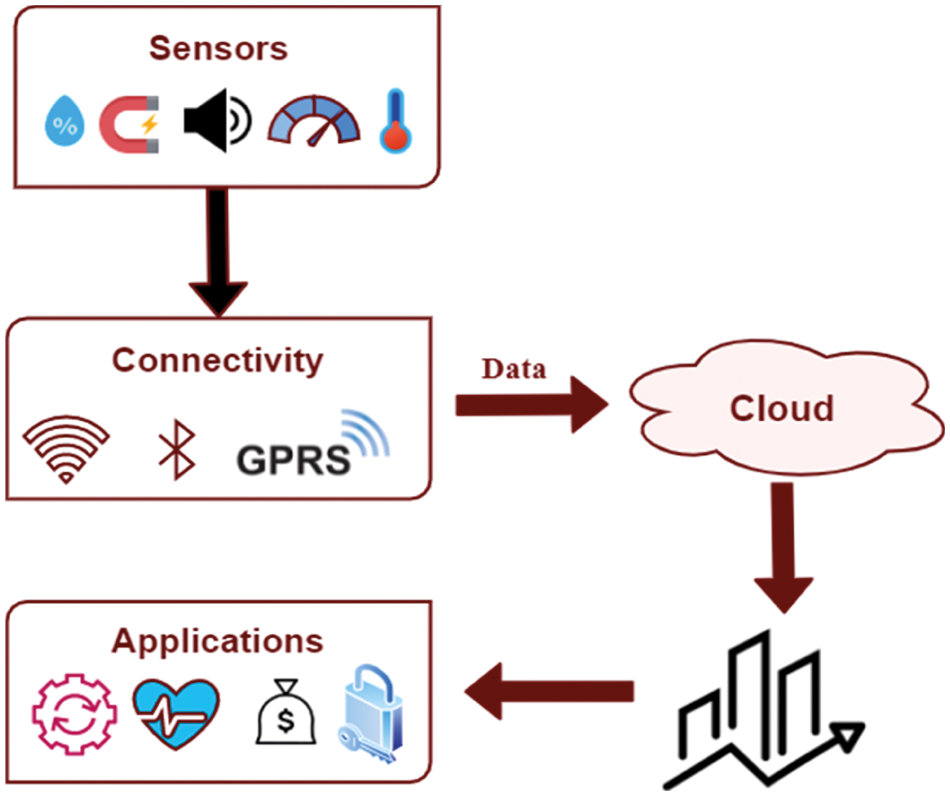
Figure 1: IoT architecture
In this paper, the above-mentioned faults can be identified using the fall curve method. The fall curve method identifies whether a sensor is connected to an IoT device and operating properly or not. The fall curve method does not require any additional hardware to detect the faulty sensor. The main objective of this paper is to predict a fault in an IoT device before its occurrence by just looking at its fall curve so that replacement or repairmen can be done beforehand.
There are 3 main sources of faults in sensor nodes that occur in IoT devices as shown in Fig. 2 below.
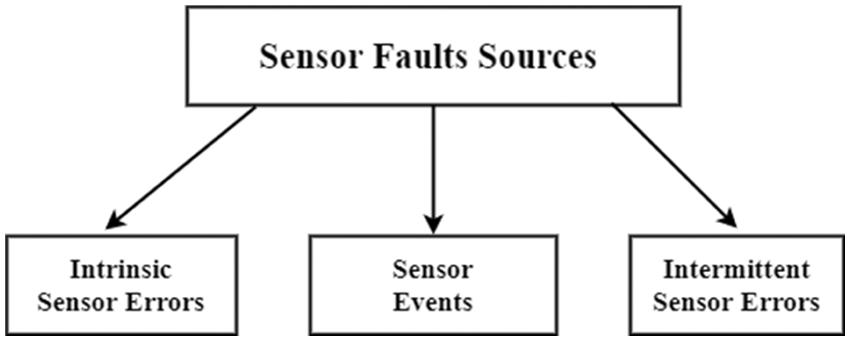
Figure 2: Sensor faults sources in IoT devices
• Intrinsic sensor errors are associated with wrong readings that came from faulty sensors embedded in an IoT device. These sensors fail suddenly and stop working which affects their performance [19]. It is also known as binary failure.
• Sensors help in collecting data from real-world devices but sometimes a probability of unusual transformation in the event is there which may be caused by some unpropitious situation that has an effect on the sensor and causes faults in it.
• Intermittent sensor errors are caused due to infrequent events like malicious attacks, tempering data from sensors or theft. When there is a loose connector or any false hardware sensing can also be the reason for the sensor to generate faulty data [20].
1.2 Fault Patterns in Sensor Nodes
A fault occurs when a device gives inconsistent data as compared to the actual value of the device. If a fault happens in a regular and repeated way, then it is called a fault pattern. Sensor data is analyzed to predict faults in various IoT devices. The most commonly observed sensor data fault patterns in IoT systems are shown in Tab. 1 [16].
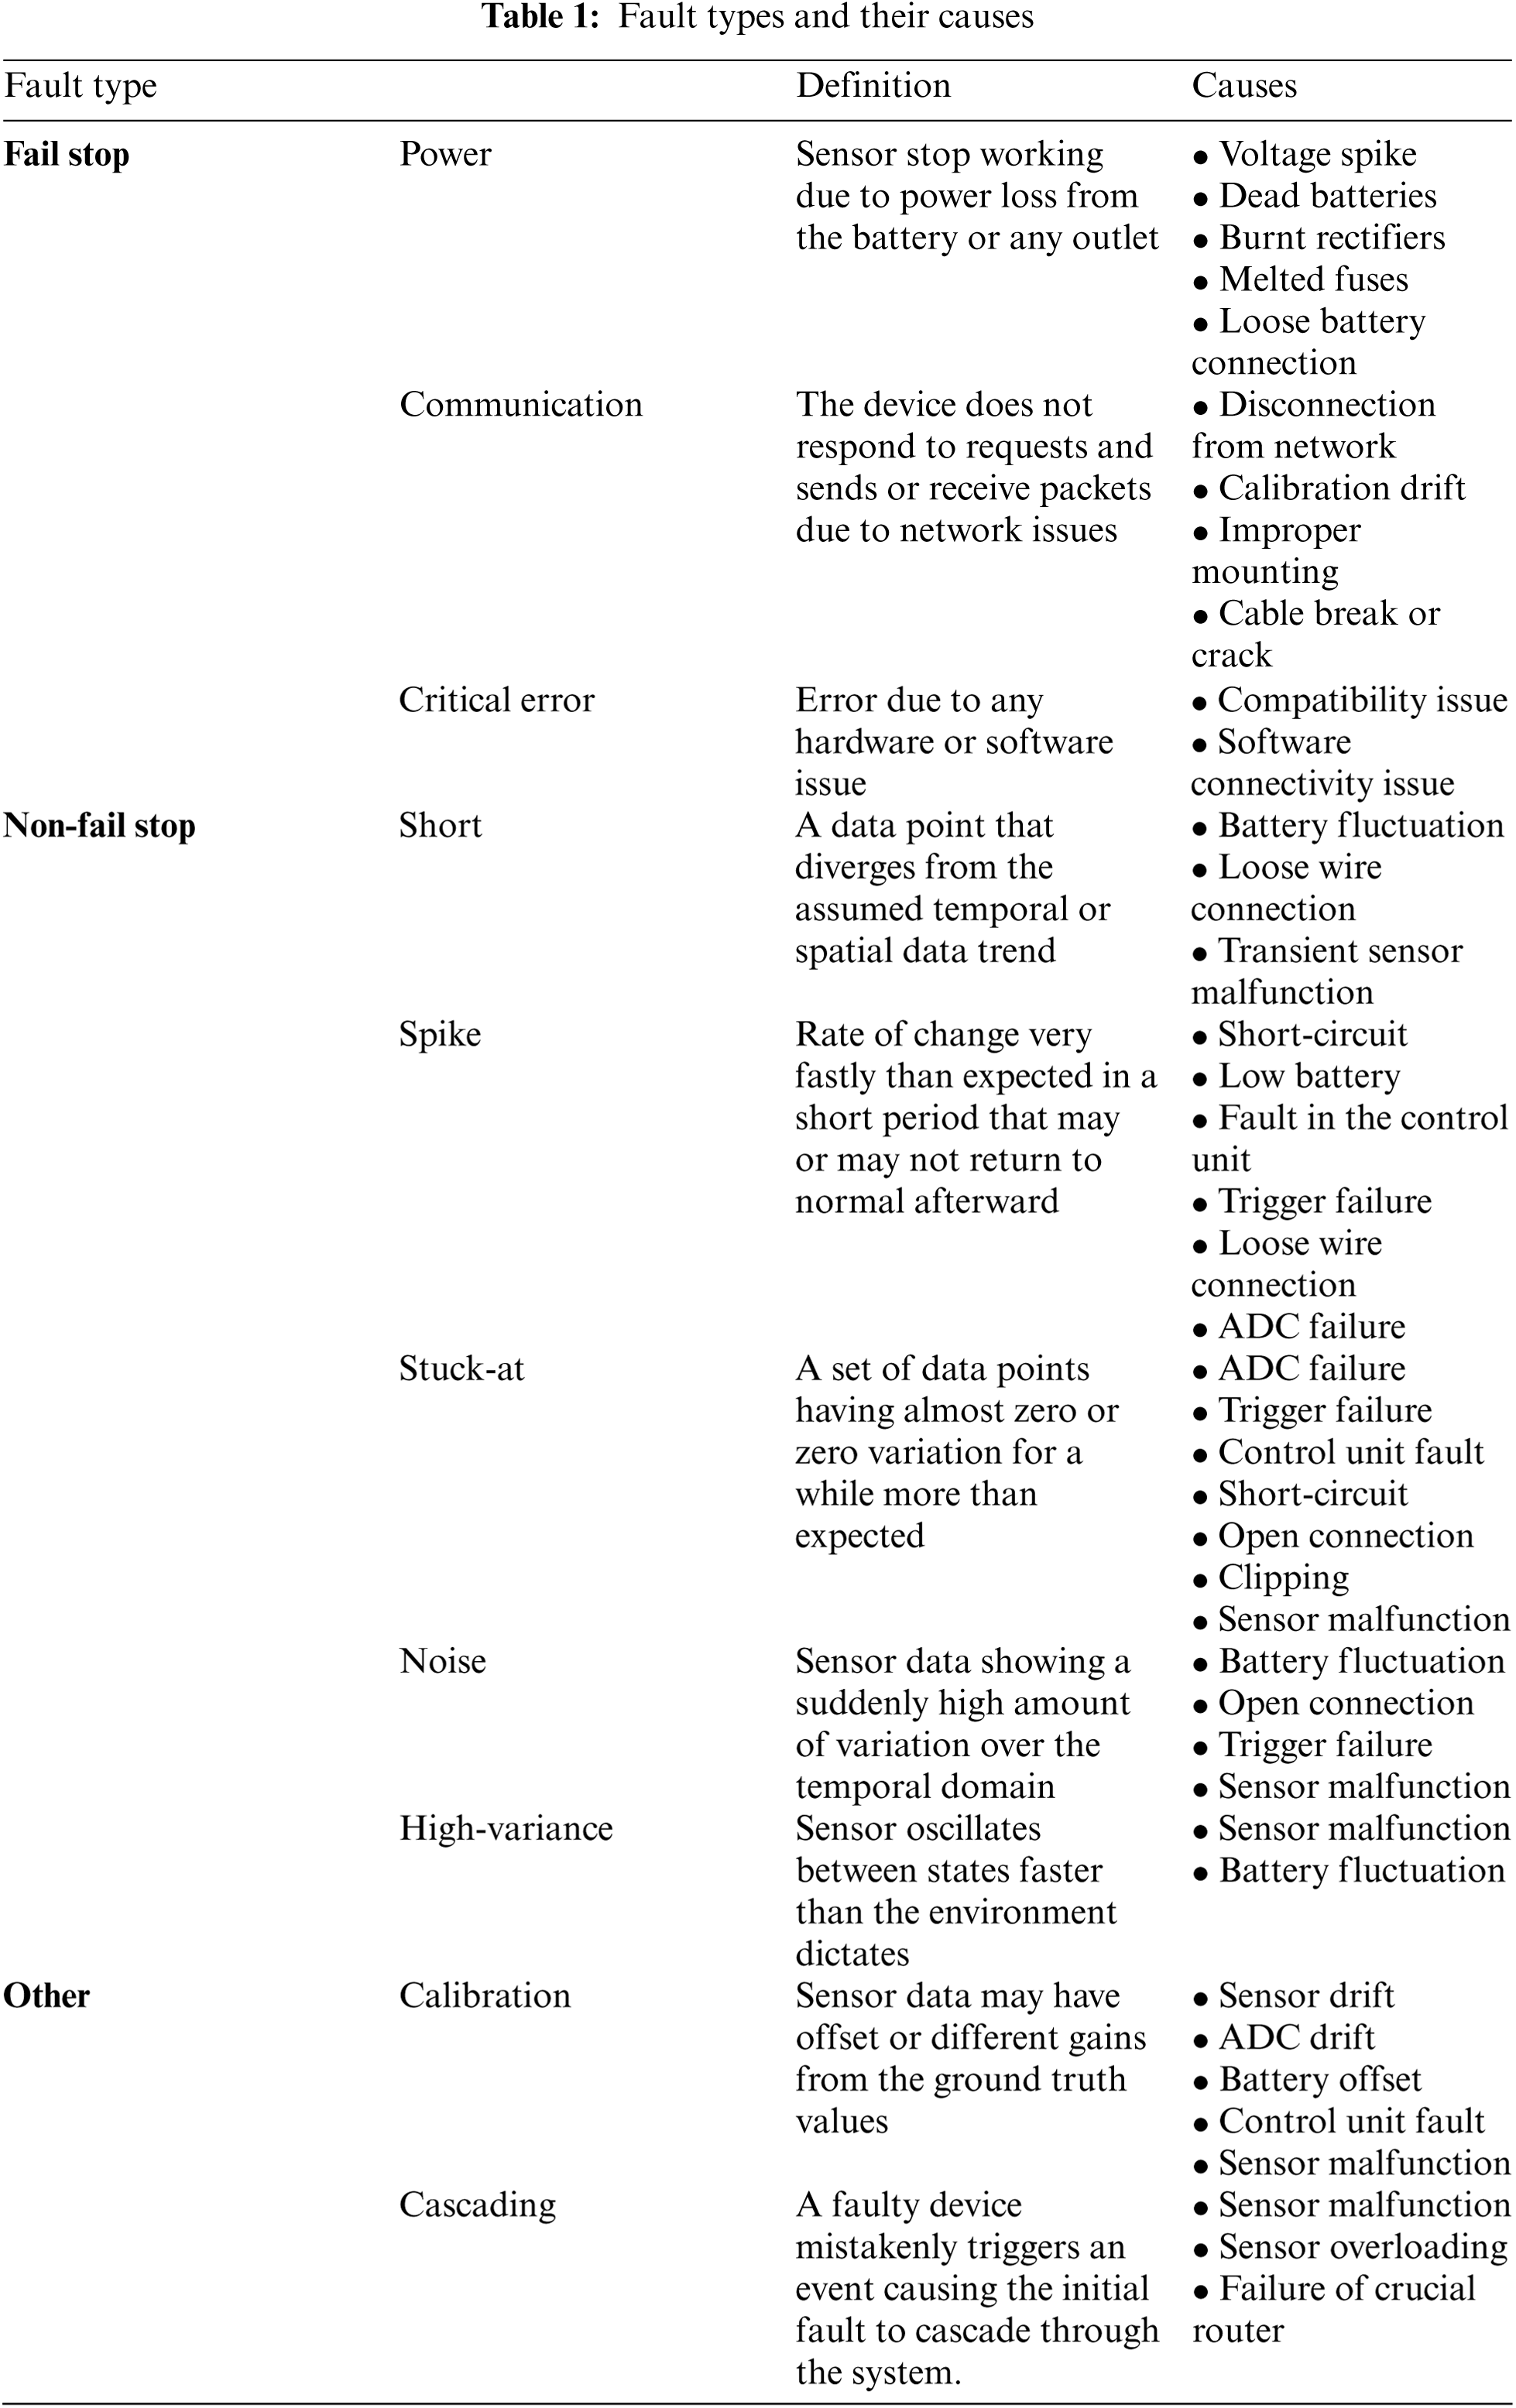
Faults can be predicted on the basis of characteristics of sensor data with respect to the expected performance of the sensor. Predicting the exact fault requires domain knowledge, historical data and sometimes human intervention [14–16]. The fault injection mechanism is used to evaluate the effectiveness of fault handling. Many factors in different scenarios of the IoT environment can lead to a fault. So, fault injection checks whether a fault can be repaired automatically or the state of other devices when a fault occurs. In this, faults are injected into IoT devices and then checked that they can be repaired through hardware/software restarts. Failure of sensors is the most popular reason for faulty sensor data. These failures can be either permanent or transient on the basis of malfunctioning of the hardware part of the sensor, physical damage to the sensor and sometimes exposure to noisy surroundings. Hence, fault prediction techniques should be robust in nature so that they can separate non-faulty information from faulty data.
1.3 Evaluation Metrics for Prediction of Faults
Metric is an indicator of quantitative evaluation of performance that helps in determining target objectives and whether goals are met or not. The performance evaluation of fault prediction over IoT data is also managed via some metrics that are generated from the confusion matrix which includes four cases. True positive (TP) is the amalgamation of the same class in the same cluster whereas False negative (FN) are data objects that are from the same class in a different cluster. True negative (TN) is the amalgamation of the different classes in the different clusters whereas False positive (FP) are data objects that are from the different classes in the same cluster [21,22]. The metrics based on the confusion matrix are:
• Recall- It calculates the completeness of data which is represented in Eq. (1):
• Accuracy: It yields a ratio between correctly classified anomalies to projected anomalies as represented in Eq. (2):
• Precision: It calculates the exactness of data which is represented in Eq. (3):
• Sensitivity: It calculates the aptness of the model to detect events in a positive class as shown in Eq. (4):
• Specificity: It calculates the exactness of the assignment to a positive class as expressed in Eq. (5):
• F-measure: It is used by classification techniques to find the effectiveness of the proposed model. It is the harmonic mean of recall and precision as depicted in Eq. (6):
In this work, the following contributions are made:
• Different sources of sensor faults in IoT devices and fault patterns in sensor nodes are presented.
• A bibliometric analysis is carried out that locate relevant research insights in this domain.
• An abstract idea of the fall curve is introduced that recognize the faulty sensor and predict faults in analog and digital sensors.
• Different methods of sensor fault prediction and their evaluation metrics are discussed.
• Fall curves of ACS712 current sensors configured on different devices are analysed for predicting faulty and non-faulty devices.
The organization of the paper is done as follows: Section 1 introduces the basics of IoT, sources of faults in IoT devices, fault patterns in sensor nodes and evaluation metrics for fault prediction. Section 2 is devoted to related work and few conclusions derived from them. Section 3 explains the sensor recognition and fault prediction in digital and analog sensors via the Fall-Curve technique and also discussed the methods for sensor fault prediction. Section 4 highlights the data of sensors in IoT nodes whereas Section 5 stresses on latest research trends and some open issues which are further followed by a conclusion and future work in Section 6.
From the last decade, researchers find interest in predicting sensor faults in IoT data. The majority of work of predicting faults depends upon analyzing the type of sensor that looks for patterns in faults. There are either specific to the type of sensor, fault or application [16]. Kokane et al. [23] investigated suspension faults and studied the techniques for detecting them with different machine learning methods and algorithms. They proposed online analytics and an IoT-based model for the detection of suspension faults. Whereas, Yang et al. [24] presented a process monitoring that combines stress wave condition monitoring to form real-time monitoring of the data set of the equipment. After that, the data fusion technique was used to combines the signals collected at the level of decision making and finally merged with neural network and principal component analysis to predict the fault type and health of the equipment.
IoT applications fail or become unstable if any failure occurs which can lead to its inappropriate behavior. So, Gaudio et al. [25] introduce an approach that improves the fault tolerance of IoT applications by adding feedback loops from modeling to retirement. Ardekani et al. [26] reduce connection faults via dispersing device communication by removing edge devices that act as a single point of failure. The major disadvantage of this approach is that it can't tolerate faults of common sensors and actuators. Sengupta et al. [27] introduced a technique named transactuations that is used for fault handling in IoT environments. This technique prevents losing of synchronization but can't correct errors or repair faults before detection of the fault. After reviewing the literature, some of the gaps that led to the design of the proposed work are interoperability, data management, training datasets, privacy, security, user-tailored IoT, fault severity and lack of knowledge.
Identification and classification of fault in IoT sensors is a challenging task. Fault prediction improves the robustness and accuracy of the model over IoT sensor data. So, the fall curve is a new technique that helps in predicting fault when faulty readings mimic actual readings of data of IoT sensors. 63 documents are shortlisted from the Scopus database using keywords “Internet of Things” with “OR” Boolean operator with “IoT” and “Fault Identification” with “OR” Boolean operator with “Fault Classification” as major research criteria. The literature search was restrained to include papers from 2016 to 2021 with variables such as publication years, sources, countries and keywords. All the documents were in the English language that was made part of this research.
After analyzing these 63 documents, the main information derived is shown in Tab. 2 and few conclusions have been derived below:
i. In the last 5 years from 2016 to 2021, the number of papers published is increasing year by year as shown in Fig. 3. The maximum numbers of papers are published in 2020 and the annual growth rate is 76.23%.
ii. Fig. 4 shows the number of articles by seven countries where China, India and USA are the leading countries.
iii. In Fig. 5, the top eight sources in which maximum papers published are shown. This figure represents the documents published in specific sources year-wise. The latest papers are published in IEEE Internet of Things Journal, IEEE Transactions on Automation Science and Engineering and Advances in Intelligent Systems and Computing having 4 papers. Constant growth is seen in Lecture Notes in Networks and Systems.
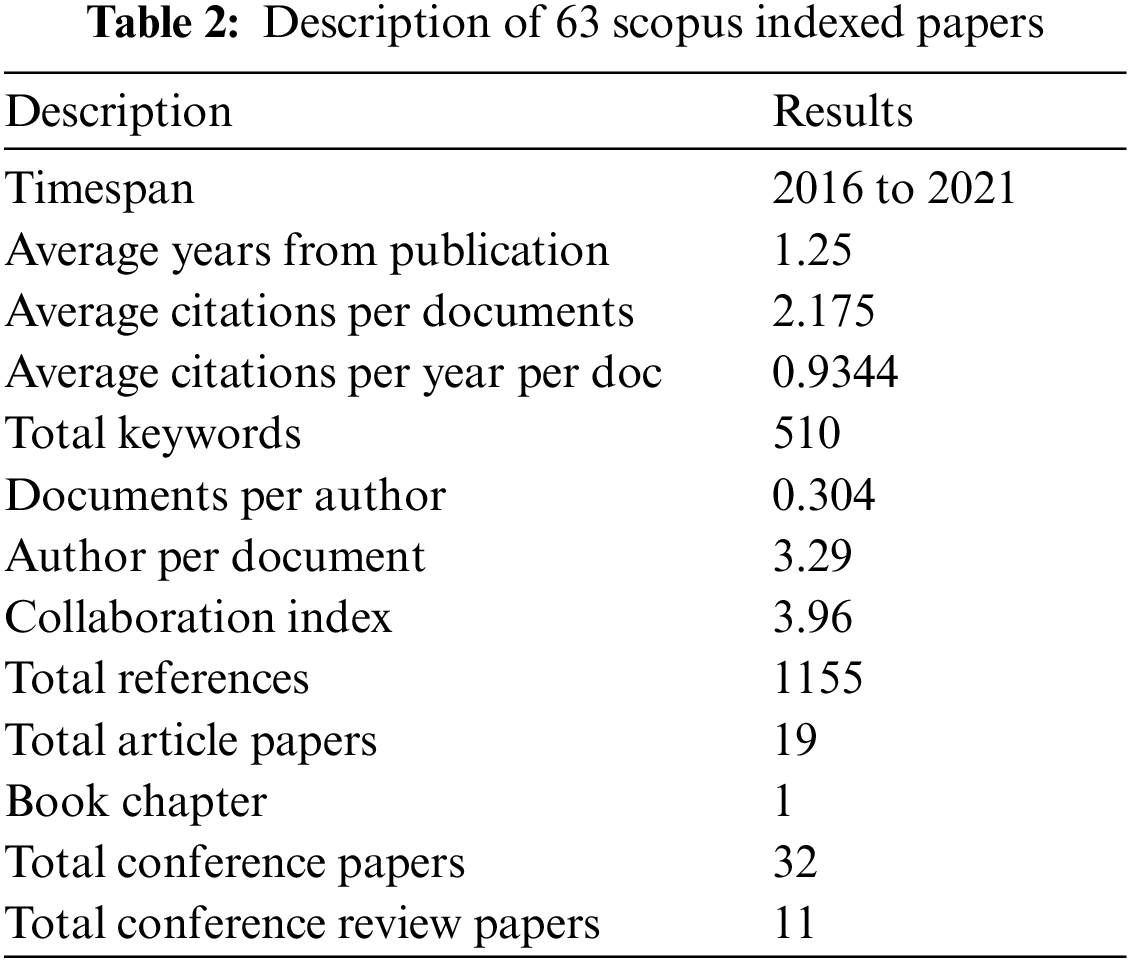
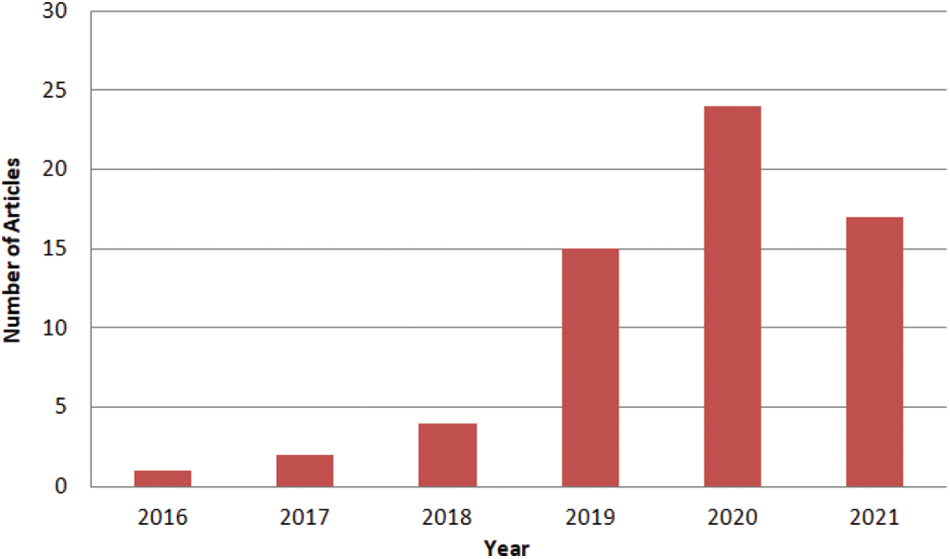
Figure 3: Number of articles (63) published in the year (2016–2021)
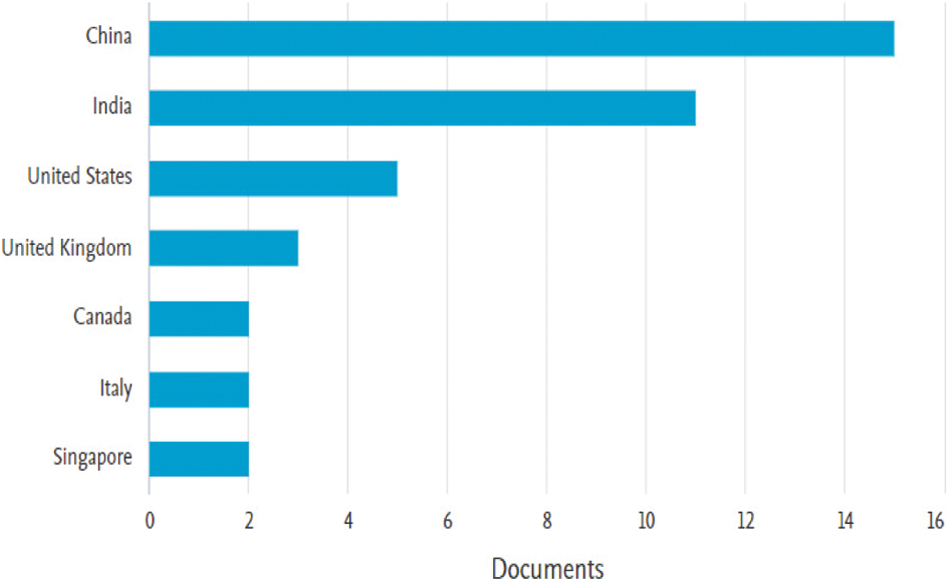
Figure 4: Number of documents (63) published by the different country
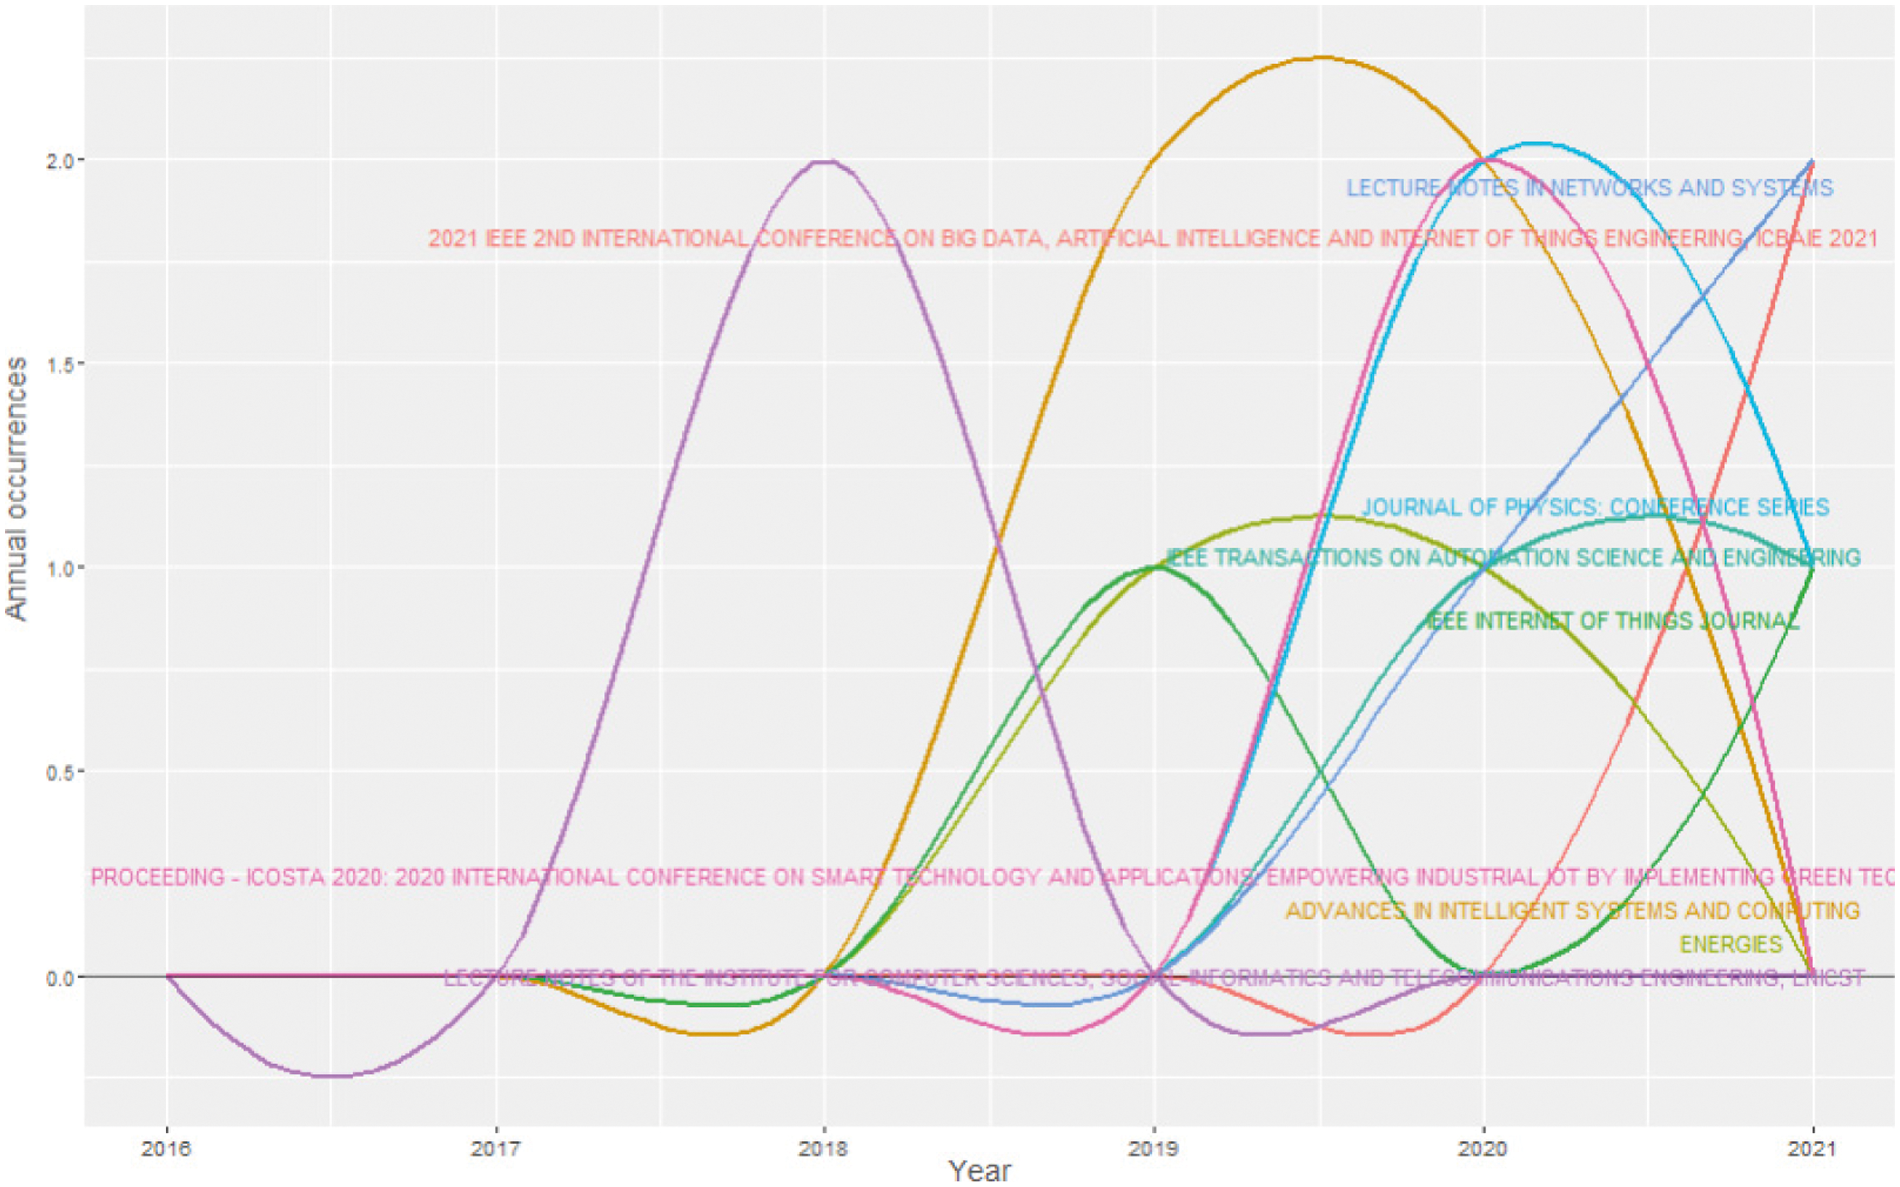
Figure 5: Annual occurrences of documents by top eight sources
3 Sensor Recognition and Fault Prediction via Fall-Curve
Fault patterns are identified while observing the repetition of the same type of faults in sensors. Identification of faulty sensors is the necessity of the hour and it is a challenging task to differentiate data received from faulty and non-faulty sensors. So, in the section, a technique named fall curve is defined that predicts faults in the digital or analog sensor. When a sensor is turned OFF, it takes some time to go down to value 0 and that time is called fall time [28]. This is due to the presence of capacitance in the sensor circuit. When the sensor is in an ON state, these capacitors start charging and when it is turned OFF, discharging starts. Fall curve characteristics are based on the circuit of the sensor. When the sensor is OFF, the accumulation of the fall curve happens which is shown in Fig. 6.
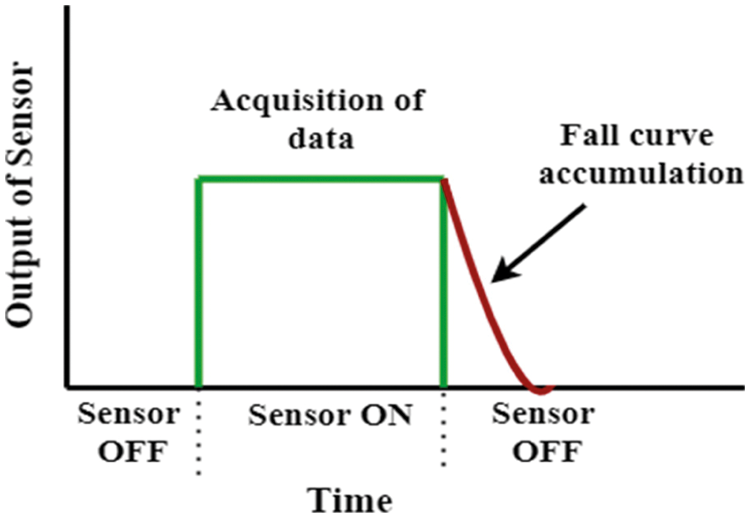
Figure 6: Accumulation in sensor fall curve
There are three characteristics of the fall curve that enable the robust identification of the sensor when connected to the microcontroller. Hence, a fall curve is used to predict sensor faults without any human or hardware intervention. The first characteristic is uniqueness and each sensor has its unique fall curve due to the different capacity or circuit of the sensor. The second characteristic of the fall curve is that it is independent of any sensing phenomena or environment. According to the third characteristic, the circuit of every sensor is different from another because the same sensor manufactured by different companies uses different components.
There are some limitations of the fall curve technique while doing the fault prediction but in this section, some solutions are provided to overcome them.
• Modification in hardware to predict fault in digital sensors: As described earlier, in digital sensors, there are two blocks named analog block and digital block. While fault prediction in the analog block, replace the old digital sensor with the new one. Modern digital sensors have an internal microcontroller on which accumulation of fall Curve data and its processing can be done to predict faults.
• Significant warm-up time required by senses: Some sensors required significant warm-up time to measure their value. MQ135 requires preheating sensing of about 24 h to accommodate fault prediction.
• Fault Prediction if the sensor value is low: When there is a low raw value produced by the sensor, the fall time is insignificant after turning OFF the sensor. A very small or no fall curve accumulation is observed in this scenario. This results in either no or a very small accumulation of fall curve. So, a higher sampling rate can help in accumulating the fall curve.
The recognition of a sensor that is connected to a microcontroller using characteristics of the fall curve is presented in this section. An IoT device has many ports through which sensors are connected. The raw data of sensors is either processed locally or send to the cloud for interpretability manually. The data required should have the information of the sensor and port for its correct processing [29]. Sensor identification mainly depends upon two characteristics, the first is uniqueness and the second is manufacturer dependent. These properties ensure that the sensor is connected to the correct port and has a unique fall curve to identify the faulty sensor.
Sensors are of two types, namely, digital sensors and analog sensors. Digital sensors produce a discrete output signal that interfaces with the microcontroller whereas analog sensors produce a continuous output signal that is directly proportional to a measured value [30–32].
3.2.1 Fault Prediction in Digital Sensors
In digital sensors, there are two primary components: analog block and digital block. In case of any fault in the digital sensor, one or both blocks may stop working. The faulty digital block can be easily identified as it stops working or respond to “out of the service” value. But in a faulty analog block, digital block resumes to work but sends wrong information from analog sensing blocks. Thus, we can predict digital sensor fault at both digital as well as analog blocks by looking at the response of sensor or fall curve accumulation.
3.2.2 Fault Prediction in Analog Sensors
The shape of the fall curve changes when any transient or permanent malfunctioning of hardware occurs in the IoT sensor. Through this phenomenon, faulty or non-faulty sensors can be predicted. Sometimes, a faulty sensor produces sensor data in a valid range or an open port also reads some data from the sensor. Thus, faults can be identified using a fall curve in analog sensors without the need for any additional hardware.
3.3 Different Methods of Sensor Fault Prediction
There can be different types of faults in a single component or the whole system. The fault can cease the functioning of any component and degrade the performance of the complete system, so, it is essential to predict faults at an early stage. A system is said to be faulty if any one of the characteristic features of the system is not in a healthy state [33]. There are three categories of sensor fault prediction methods as shown in Fig. 7.
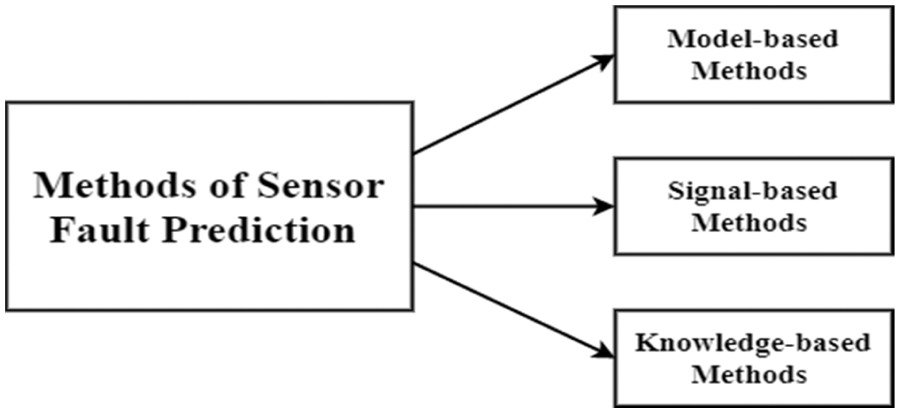
Figure 7: Sensor fault prediction methods
Model-based methods predict the output of a healthy system. The algorithms used in this method observe the output of the system continually and indicate when it varies to predict a fault [34]. Signal-based methods use signals to determine symptoms of a healthy system from symptom analysis output. In a faulty system, symptoms that appeared are different from the symptoms of the healthy system. Also, these methods analyze the signal in two domains, i.e., time domain and frequency domain. Knowledge-based methods need historical data to extract the knowledge that reflects the relationship among system variables. Real-time monitoring is done to monitor the behavior of the system and compared with the existing knowledge base to predict upcoming faults. These methods are divided into two types: qualitative methods and quantitative methods. The qualitative methods use an expert system to evaluate real-time data as per a set of rules whereas quantitative methods for diagnostics apply pattern recognition [35].
Sensor fault prediction methods have some advantages as well as disadvantages. Model-based methods can easily predict and detect unknown faults as they don't require a huge volume of real-time data. But these methods require models that can explain input-output relationships efficiently. Also, these models are not available easily and are tough to procure. Knowledge-based and signal-based methods have the advantage that they do not require a complete model. For fault prediction, signal-based methods need output signals instead of input signals. This helps in reducing the performance of fault prediction if some unfamiliar disturbance is present in the system. Knowledge-based methods need a huge set of historical data and inflict a big computational load. Both of the methods are unable to manage undiscovered faults efficiently.
Fall curve is collected for a short period of time when the sensor is turned off as shown in Fig. 6. Fall curves for each current sensor are collected and analyzed to extract key features which are matched with the previously extracted features to predict the fault. Current sensors measure alternating as well as direct current. It helps in measuring the current flow in cable wire in an unintrusive style. ACS712 current sensor is based on Hall Effect as shown in Fig. 8 that can sense up to 20 A of current [36].
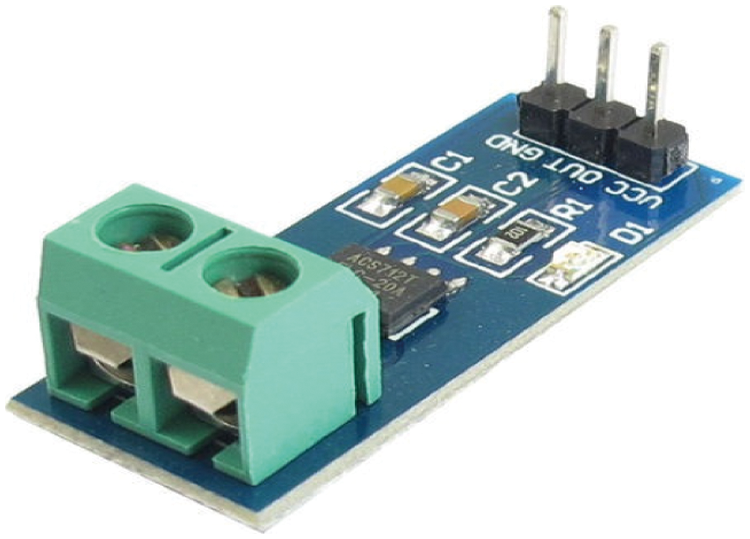
Figure 8: Snapshot of ACS712 current sensor
Sensing the flow of current is necessary for various application areas as it can prevent a major loss. Major happenings are due to over-current in circuit boards, overcharged battery chargers, switching modes in power supplies, problem in digital watt meters and programmable current sources, etc. The detailed specifications include 4.5 V∼5.5 V DC Supply Voltage, −20 A∼20 A Current Range and 100 mV/A Sensitivity. In Fig. 9, ACS712 current sensor is interfaced with Arduino to sense the current.
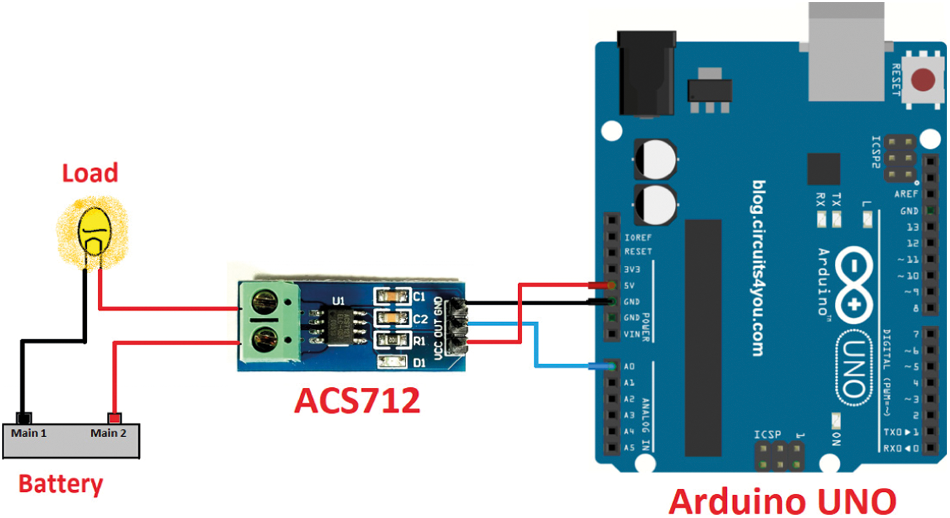
Figure 9: ACS712 interfacing with Arduino [37]
The pin diagram and its description are shown in Fig. 10 and Tab. 3. The measurement formula of ACS712 current sensor is represented in Eq. (7) [38]:
where,
ACS712 Offset = normal voltage output at VIOUT pin when no current is flowing through the circuit. By default, it is 2.5 volt.
Arduino measured reading = Analog signal value through which ACS712 output is connected.
Sensitivity of sensor = ACS712 change in current representing 1 Ampere. Its value is 185 mV/A for 5 A Sensor, 100 mV/A for 20 A Sensor and 66 mV/A for 30 A Sensor.
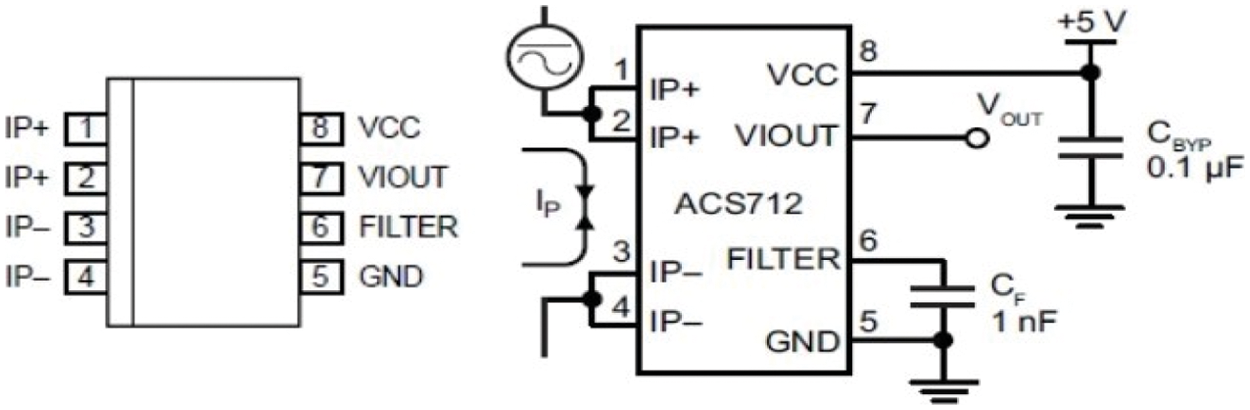
Figure 10: Pin diagram of ACS712 interfacing with Arduino [39]
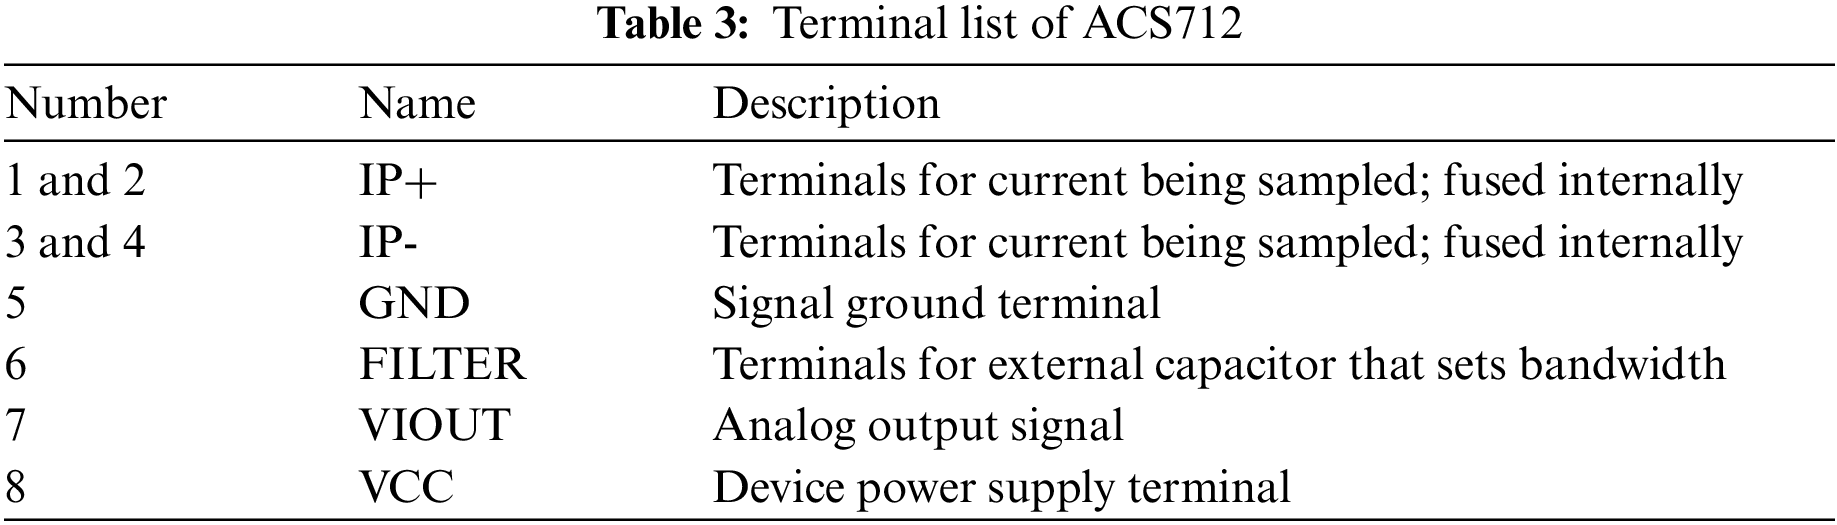
Fig. 11 shows an instance of a fall curve on the current sensor configured in different devices. Fig. 11a shows that the fall curves for the working of the current sensor in LCD (Liquid Crystal Display) TV 32” (∼ 0.8 A) and Fig. 11b shows that the fall curves for the current sensor used in Coffee Machine (∼ 3.0 A). Whereas Fig. 11c represents the fall curves of the current sensor applied in the Refrigerator (∼ 1.5 A) and Fig. 11d represents the fall curves used in working of current sensor applied in CCTV (Closed Circuit Television) Camera (∼ 0.5 A). All these fall curves of the current sensor in different devices are completely different. If any of the current sensors gets faulty, then the fall curve will differ and the value will immediately drop to zero.
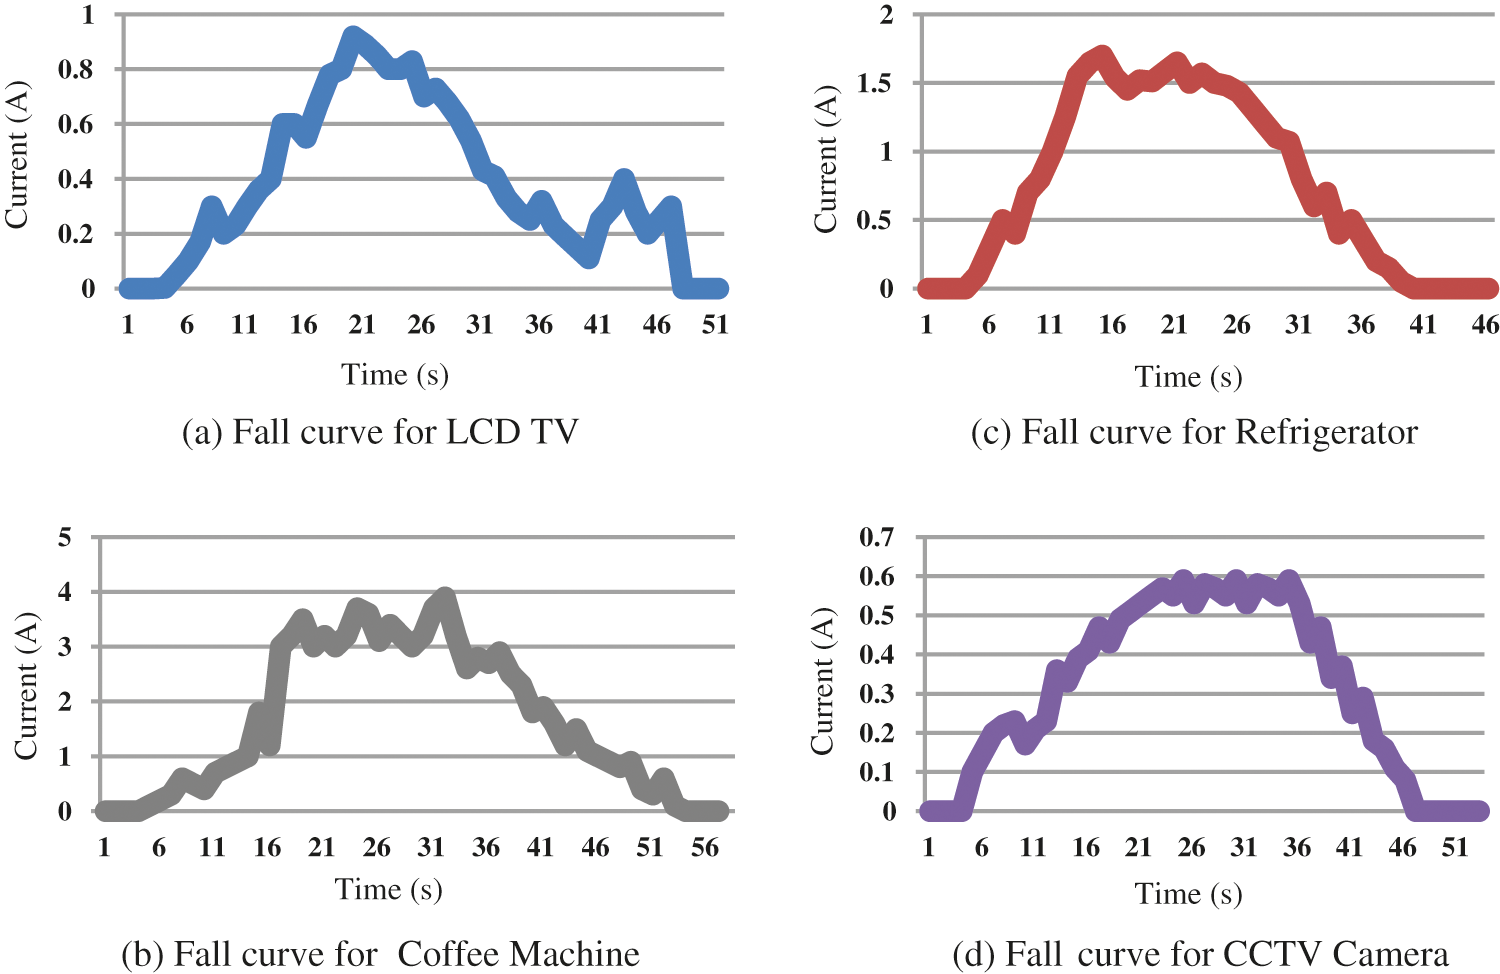
Figure 11: Fall curves for predicting faulty or non-faulty current sensor
5 Research Trends and Open Issues
IoT and sensor technologies are getting popular these days but analysis of sensor data is a tedious job. There are few research trends and open issues in this domain which are discussed below:
• Knowledge and Big Data Creation- A huge amount of data is produced from different IoT sensor devices. So, there is a need to convert this raw information into knowledge.
• Multivariate Data- IoT devices produce various variants of data. Univariate and bivariate analysis of data is easier but multivariate analysis of data that incorporates more than two attributes is tough to handle. So, to deal with this type of data, several algorithms are required which is a challenging task.
• High Dimensional Data- IoT devices produce high-dimensional data whose handling is a challenging task. It depends upon the number of attributes present in data. Various dimensionality reduction techniques play a key role in reducing features precisely.
• Massive Scaling- Scalability means the number of attributes present in a particular application. Data is of different nature and high dimensions. So, the massive scalability can be tackled with feature selection and extraction algorithms only.
IoT applications are of different categories on the basis of their features and characteristics. Some open issues dependent on their features are the privacy of data produced by different IoT devices, human activity recognition or analysis applied on traffic patterns, or weather forecasting applications. Security also plays an important role.
Identification and classification of fault patterns in IoT sensor nodes is a challenging issue in the IoT data environment. The extensive use of sensors in the IoT environment has demanded automating the prediction of sensor faults in IoT devices. Existing techniques only detect the faults not predict but predicting faults in IoT Sensor Nodes is the necessity of the hour. 63 articles published from 2016 to 2021 were thoroughly analyzed through a bibliometric analysis. With the help of this analysis, fascinating results and visualizations of the research work between different parameters were presented. Therefore, in this paper, a novel primitive technique named fall curve is used to identify a faulty sensor using its current value when a sensor is powered ON or OFF. In addition to that, fault types and their respective causes have been summarized. Sensor identification and prediction in analog and digital sensors are also pointed out. The flow of current in different devices is sensed to save from a huge loss. So, in this paper, fall curves of ACS712 current sensors are drawn to predict the faulty or non-faulty device. Different evaluation metrics for fault prediction are also explained in this paper. Also, recent open issues are addressed for handling sensor data in IoT devices. Furthermore, in the future, new techniques can be investigated which could enhance the performance of sensor nodes in IoT devices.
Acknowledgement: This research was supported by Taif University Researchers supporting Project number (TURSP-2020/347), Taif University, Taif, Saudi Arabia.
Funding Statement: This research was funded by Taif University Researchers supporting Project Number (TURSP-2020/347), Taif University, Taif, Saudi Arabia.
Conflicts of Interest: The authors declare that they have no conflicts of interest to report regarding the present study.
1. H. N. Dai, H. Wang, G. Xu, J. Wan and M. Imran, “Big data analytics for manufacturing internet of things: Opportunities, challenges and enabling technologies,” Enterprise Information Systems, vol. 14, no. 9–10, pp. 1279–1303, 2020. [Google Scholar]
2. A. Gaddam, K. O. Lundqvist, J. Citizen and D. B. Calixto, “IoT and wireless sensor network for interactive waka structure,” in 2017 Eleventh Int. Conf. on Sensing Technology (ICST), Sydney, Australia, IEEE, pp. 1–4, 2017. [Google Scholar]
3. A. Gaddam, M. Al-Hrooby and W. F. Esmael, “Designing a wireless sensors network for monitoring and predicting droughts,” International Journal on Smart Sensing and Intelligent Systems, vol. 7, no. 5, pp. 1–6, 2020. [Google Scholar]
4. A. Ukil, S. Bandyoapdhyay, C. Puri and A. Pal, “IoT healthcare analytics: The importance of anomaly detection,” in 2016 IEEE 30th Int. Conf. on Advanced Information Networking and Applications (AINA), Crans-Montana, Switzerland, IEEE, pp. 994–997, 2016. [Google Scholar]
5. L. Da Xu, W. He and S. Li, “Internet of things in industries: A survey,” IEEE Transactions on Industrial Informatics, vol. 10, no. 4, pp. 2233–2243, 2014. [Google Scholar]
6. C. Perera, C. H. Liu, S. Jayawardena and M. Chen, “A survey on internet of things from industrial market perspective,” IEEE Access, vol. 2, pp. 1660–1679, 2014. [Google Scholar]
7. J. Bughin, M. Chui and J. Manyika, “An executive's guide to the internet of things,” McKinsey Quarterly, vol. 4, pp. 92–101, 2015. [Google Scholar]
8. I. Lee and K. Lee, “The internet of things (IoTApplications, investments, and challenges for enterprises,” Business Horizons, vol. 58, no. 4, pp. 431–440, 2015. [Google Scholar]
9. B. L. R. Stojkoska and K. V. Trivodaliev, “A review of internet of things for smart home: Challenges and solutions,” Journal of Cleaner Production, vol. 140, pp. 1454–1464, 2017. [Google Scholar]
10. N. Goyal, M. Dave and A. K. Verma, “A novel fault detection and recovery technique for cluster-based underwater wireless sensor networks,” International Journal of Communication Systems, vol. 31, no. 4, pp. e3485, 2018. [Google Scholar]
11. S. M. Mahmoud, A. Lotfi and C. Langensiepen, “Behavioural pattern identification in a smart home using binary similarity and dissimilarity measures,” in 2011 Seventh Int. Conf. on Intelligent Environments, Nottingham, United Kingdom, IEEE, pp. 55–60, 2011. [Google Scholar]
12. M. Xie, S. Han, B. Tian and S. Parvin, “Anomaly detection in wireless sensor networks: A survey,” Journal of Network and Computer Applications, vol. 34, no. 4, pp. 1302–1325, 2011. [Google Scholar]
13. J. Kullaa, “Detection, identification, and quantification of sensor fault in a sensor network,” Mechanical Systems and Signal Processing, vol. 40, no. 1, pp. 208–221, 2013. [Google Scholar]
14. K. Ni, N. Ramanathan, M. N. H. Chehade, L. Balzano, S. Nair et al., “Sensor network data fault types,” ACM Transactions on Sensor Networks (TOSN), vol. 5, no. 3, pp. 1–29, 2009. [Google Scholar]
15. C. O'Reilly, A. Gluhak, M. A. Imran and S. Rajasegarar, “Anomaly detection in wireless sensor networks in a non-stationary environment,” IEEE Communications Surveys & Tutorials, vol. 16, no. 3, pp. 1413–1432, 2014. [Google Scholar]
16. A. B. Sharma, L. Golubchik and R. Govindan, “Sensor faults: Detection methods and prevalence in real-world datasets,” ACM Transactions on Sensor Networks (TOSN), vol. 6, no. 3, pp. 1–39, 2010. [Google Scholar]
17. S. Subramaniam, T. Palpanas, D. Papadopoulos, V. Kalogeraki and D. Gunopulos, “Online outlier detection in sensor data using non-parametric models,” in Proc. of the 32nd Int. Conf. on Very Large Data Bases, Seoul Korea, pp. 187–198, 2006. [Google Scholar]
18. Y. Zhang, N. Meratnia and P. J. Havinga, “Distributed online outlier detection in wireless sensor networks using ellipsoidal support vector machine,” Ad Hoc Networks, vol. 11, no. 3, pp. 1062–1074, 2013. [Google Scholar]
19. J. Ye, G. Stevenson and S. Dobson, “Detecting abnormal events on binary sensors in smart home environments,” Pervasive and Mobile Computing, vol. 33, pp. 32–49, 2016. [Google Scholar]
20. V. M. Van Zoest, A. Stein and G. Hoek, “Outlier detection in urban air quality sensor networks,” Water, Air, & Soil Pollution, vol. 229, no. 4, pp. 1–13, 2018. [Google Scholar]
21. M. Syafrudin, G. Alfian, N. L. Fitriyani and J. Rhee, “Performance analysis of IoT-based sensor, big data processing, and machine learning model for real-time monitoring system in automotive manufacturing,” Sensors, vol. 18, no. 9, pp. 2946, 2018. [Google Scholar]
22. N. E. ElHady and J. Provost, “A systematic survey on sensor failure detection and fault-tolerance in ambient assisted living,” Sensors, vol. 18, no. 7, pp. 1991, 2018. [Google Scholar]
23. P. Kokane and P. B. Sivakumar, “Online model for suspension faults diagnostics using IoT and analytics,” in Int. Conf. on Advanced Computing Networking and Informatics, pp. 145–154, Springer, Singapore, 2019. [Google Scholar]
24. L. Yang, G. Zhang and P. Wu, “Design of equipment online monitoring and fault diagnosis platform based on IoT,” in Journal of Physics: Conference Series, vol. 1575, no. 1, pp. 012221, IOP Publishing, 2020. [Google Scholar]
25. D. D. Gaudio and P. Hirmer, “Towards feedback loops in model-driven IoT applications,” in Symposium and Summer School on Service-Oriented Computing, Virtual Event, pp. 100–108, 2021. [Google Scholar]
26. M. S. Ardekani, R. P. Singh, N. Agrawal, D. B. Terry and R. O. Suminto, “Rivulet: A fault-tolerant platform for smart-home applications,” in Proc. of the 18th ACM/IFIP/USENIX Middleware Conf., Las Vegas, Nevada, 2017. [Google Scholar]
27. A. Sengupta, T. Leesatapornwongsa, M. S. Ardekani and C. A. Stuardo, “Transactuations: Where transactions meet the physical world,” in Proc. of the {USENIX} Annual Technical Conf., ({USENIX}{ATC} 19Renton, Washington, United States, pp. 91–106, 2019. [Google Scholar]
28. B. Orwiler, “Vertical amplifier circuits,” in Tektronix, Beaverton, Oregon, Inc., Beaverton, Oregon, 1969. [Google Scholar]
29. J. Koo, S. R. Oh and Y. G. Kim, “Device identification interoperability in heterogeneous IoT platforms,” Sensors, vol. 19, no. 6, pp. 1433, 2019. [Google Scholar]
30. E. Kim, H. Huh and S. Kim, “Knowledge-based powermonitoring and fault prediction system for smart factories,” Personal and Ubiquitous Computing, pp. 1–12, 2019.In Special issue: New directions in knowledge-based personal computing; Published: 18 August 2021. [Google Scholar]
31. D. Gupta, “The aspects of artificial intelligence in software engineering,” Journal of Computational and Theoretical Nanoscience, vol. 17, no. 9–10, pp. 4635–4642, 2020. [Google Scholar]
32. D. Gupta, “A comprehensive study of recommender systems for the internet of things,” Journal of Physics: Conference Series, vol. 1969, no. 1, pp. 012045, 2021. [Google Scholar]
33. D. van Schrick, “Remarks on terminology in the field of supervision, fault detection and diagnosis,” IFAC Proceedings Volumes, vol. 30, no. 18, pp. 959–964, 1997. [Google Scholar]
34. R. V. Beard, Failure accomodation in linear systems through self-reorganization, Doctoral dissertation, Massachusetts Institute of Technology, 1971. [Google Scholar]
35. C. Nan, F. Khan and M. T. Iqbal, “Real-time fault diagnosis using knowledge-based expert system,” Process Safety and Environmental Protection, vol. 86, no. 1, pp. 55–71, 2008. [Google Scholar]
36. M. S. Mohd Hafizi, N. A. Mat Leh, N. A. Kamarzaman and N. H. Ishak, “Developing a monitoring system for tripping fault detection via IoT,” in 2018 9th IEEE Control and System Graduate Research Colloquium (ICSGRC), Shah Alam, Malaysia, pp. 110–115, 2018. [Google Scholar]
37. S. Z. Nasir, “Interfacing DC current sensor with Arduino,” Available: https://www.theengineeringprojects.com/2017/05/dc-current-sensor-acs712-arduino.html, accessed on October 3, 2021. [Google Scholar]
38. R. Khwanrit, S. Kittipiyakul, J. Kudtonagngam and H. Fujita, “Accuracy comparison of present low-cost current sensors for building energy monitoring,” in 2018 Int. Conf. on Embedded Systems and Intelligent Technology & Int. Conf. on Information and Communication Technology for Embedded Systems (ICESIT-ICICTES), Khon Kaen, Thailand, IEEE, pp. 1–6, 2018. [Google Scholar]
39. E. G. Projects, “How to measure current using Arduino and ACS712 current sensor,” Available: https://www.engineersgarage.com/acs712-current-sensor-with-arduino/, accessed on October 3, 2021. [Google Scholar]
 | This work is licensed under a Creative Commons Attribution 4.0 International License, which permits unrestricted use, distribution, and reproduction in any medium, provided the original work is properly cited. |