DOI:10.32604/cmc.2022.025499
| Computers, Materials & Continua DOI:10.32604/cmc.2022.025499 | |
| Article |
Classification of Images Based on a System of Hierarchical Features
1Department of Computer Engineering and Networks, College of Engineering at Wadi Addawasir, Prince Sattam Bin Abdulaziz University, Al-Kharj, 11991, Saudi Arabia
2Department of Informatics, Kharkiv National University of Radio Electronics, Kharkiv, 61166, Ukraine
3Control and Instrumentation Engineering Department, and Interdisciplinary Research Center (IRC) for Renewable Energy and Power Systems, King Fahd University of Petroleum & Minerals, Dhahran, 31261, Saudi Arabia
*Corresponding Author: Iryna Tvoroshenko. Email: iryna.tvoroshenko@nure.ua
Received: 26 November 2021; Accepted: 14 January 2022
Abstract: The results of the development of the new fast-speed method of classification images using a structural approach are presented. The method is based on the system of hierarchical features, based on the bitwise data distribution for the set of descriptors of image description. The article also proposes the use of the spatial data processing apparatus, which simplifies and accelerates the classification process. Experiments have shown that the time of calculation of the relevance for two descriptions according to their distributions is about 1000 times less than for the traditional voting procedure, for which the sets of descriptors are compared. The introduction of the system of hierarchical features allows to further reduce the calculation time by 2–3 times while ensuring high efficiency of classification. The noise immunity of the method to additive noise has been experimentally studied. According to the results of the research, the marginal degree of the hierarchy of features for reliable classification with the standard deviation of noise less than 30 is the 8-bit distribution. Computing costs increase proportionally with decreasing bit distribution. The method can be used for application tasks where object identification time is critical.
Keywords: Bitwise distribution; computer vision; descriptor; hierarchical representation; image classification; keypoint; noise immunity; processing speed
The effective classification solutions in modern computer vision systems require solving the many urgent problems. They are related to the multidimensional nature of the analyzed data. During introduction of structural recognition methods, descriptions of visual objects are represented as the set of keypoint descriptors. Keypoints are the numeric vectors of a rather high dimension [1–4].
The binary descriptions obtained by detectors Oriented FAST and Rotated BRIEF (ORB), Binary Robust Invariant Scalable Keypoints (BRISK) [4–7], contain 256 and 512 components, respectively. The number of descriptors (description content) reaches 500–1500.
In such a situation, transformation by representing data as the system of their fragments of a significantly lower dimension contributes to the significant simplification of their application implementation [1]. In this case the key tool is the apparatus of spatial-statistical data analysis. It is based on the generalization of the values of descriptors from the description of the object by calculating new integrated features based on the entire set of fragments of the description [2,8,9].
It is also important to construct and research the distinguishable properties of the hierarchical system of the features. It can be calculated on the basis of the distributions of basic 1-bit fragments. Similarly to the pyramidal data structure [10], on the basis of such a supporting system of features, it is possible to form attributes of the higher level of the hierarchy. The application of this approach accelerates the classification process hundreds of times. This approach corresponds to the modern section of Content-Based Image Retrieval (CBIR) research [11,12] in computer vision systems. It is associated with introducing intelligent recognition technologies based on image content with the variety of levels of presentation of semantic information. Generally this approach includes the formation of the data description as the set of keypoints descriptors. The cluster representation of the description is important as one of the generalization tools for the synthesis of high-level solutions [10–15].
The purpose of the article is to improve the method of structural image recognition on the basis of the formation of the hierarchical system of features by introducing spatial-statistical processing for description blocks as part of the set of descriptors.
The task of the research is to develop the hierarchy of data models for calculating the relevance of modifications of the structural description that are efficient in terms of data processing speed. It is important to study the effectiveness of implementing these models for classification and to evaluate the proposed approaches according to the results of the analysis of the image database.
The article proposes and demonstrates:
• Formal models for constructing hierarchical features for the classification task (Section 3). The main characteristics of the description as the set of keypoint descriptors are indicated. The division of descriptors into disjoint fragments, which are the basis for constructing the system of hierarchical features, is analyzed in detail. Implementation of the proposed ideas provides the effectiveness and high speed of classification.
• The process of calculating the values of distributions and constructing the hierarchical features based on the set of the description components (Section 4). The scheme of the spatial method of data representation by adding bit values for descriptor fragments is discussed. Metrics are analyzed to calculate the relevance of hierarchical representations of different images for the fixed level of hierarchy. The scheme of the classifier construction is proposed on the basis of the obtained system of features.
• Results of computer simulation (Section 5). The software models have been developed for the implementation of the proposed methods of hierarchical data representation and construction of the classification method for computer vision systems. Testing has been performed on the basis of real images of university emblems. According to the results of experiments, the method of classification based on the hierarchical representation for statistical distributions of the components of the descriptions has confirmed its efficiency, increased processing speed and efficiency for the image classification.
The article presents the method of constructing classifiers of visual objects in the synthesized data space. The simulation results have confirmed the effectiveness of the proposed modifications of the hierarchical representation and analysis of data descriptions for given images.
The problem of recognizing images of visual objects is crucial for computer vision [1–17]. The most detailed features of its theoretical formulation are given in [13]. Recently, the researchers have focused more on the development of the methods that provide effective application. Due to the multidimensional and spatial nature of the image signal, the most popular approaches for solving this problem are the statistical approaches [1–3,13,18–20] and approaches related to spatial data analysis, which are aimed at simplifying processing [1,8,9,12].
Specialized neural network software is being developed, based on the preliminary creation and training of the classification neural network within some fixed image database [11,12,21].
However, the drawback of such systems is the need of long-term training and the dependence of the effectiveness of their application on the specific database on the base of which the training is carried out.
Despite the existence of the effective systems with the implementation of machine training, the development and evaluation of new methods of object recognition are in progress [1–3,8–12,19]. The new promising approach is associated with the use of images of visual objects in the form of the set of descriptors of keypoints [1–3,8–12,19]. This apparatus provides high-speed data analysis and allows classifying in more detail the characteristics of the visual object and ensures good performance.
One of the promising areas of research in terms of increasing the processing speed is the implementation of spatial bit processing of the set of descriptors [13] and the pyramidal principle of data presentation [10]. Such approaches, through generalized data representation, significantly simplify and accelerate classification. At the same time, it is possible to combine different methods to increase efficiency: reducing the number of descriptors in the description [15], statistical processing to identify the most informative components [1,8,9]. Additional implementation of training procedures in such systems will also further improve their performance.
3 Model of Statistical-Component Representation of the Feature Space
The composition of keypoints descriptors in space
Let us define description Z of the recognizable visual object as the finite set
Now, each row of matrix D (keypoint descriptor) is represented as m non-intersecting fragments (blocks) that follow one after another. Let's obtain new data space in the form of characteristics of blocks. The advantage of this space is the possibility to analyze the internal structure and statistical properties of the description. Based on this, we can classify it. The set of blocks can be used as the basis for making decision about the object class. This method of forming features provides additional flexibility during processing [1,22–26].
After splitting
Let us take into account the implemented equivalence of the ranges for the values of each of the fragments and reflection of the set of descriptors of the properties of the analyzed object. Let us construct data distributions on the basis of analysis of matrix D [1,27–29]. To do this, let us define the reflection
Let us define the occurrence rating (distribution)
Based on representation Eq. (1), condition
For each of the m fragments, let's construct the distribution
Matrix Q reproduces the statistical properties of description Z of the analyzed object in the form of the tuple of distributions of the values of its components. Statistical data distributions are the tool for generalizing knowledge in accordance with the fundamental concept of machine training [12,18,30].
4 Formation and Comparison of System of Hierarchical Features
Based on the basic system of one-bit distributions, let's create the integrated system of features by combining fragments. For the description matrix D, let's calculate the values of the column sums (1-bit fragment) and obtain vector
These are lowest-level integral features for the description Z, which contain the property of invariance to geometric transformations of the analyzed object that are common for keypoint descriptors.
Transformation Eq. (2) implements reflection
Based on features
where
Features Eq. (3) implement cross-correlation processing of matrix D with the rectangular mask of size
The value of vector
Despite such a simple model for calculating functions Eq. (3), all of them for the random fragment size are determined simply (logically or by adding integers) based on 1-bit values.
Based on the representation Eqs. (2) and (3), the traditional hierarchical recognition method can be applied. For comparison with etalons this method uses the system of features
The size of the fragment can directly determine the range of integer values for features
The number of values for features Eq. (3) varies from one number to the vector of size n (the number of descriptor bits) and decreases with increasing fragment size. For
Model Eq. (3) implements the procedure for reducing the information redundancy of the spatial signal due to the acceptable reduction (from the point of view of the quality of the difference) of the degree of the resolution ability of the system of features of the description presentation.
Processing of the form Eq. (3) is a kind of spatial analysis of fragment values for the set of descriptors along with coordinates. Other options for such processing are filtering or dividing the descriptor according to the system of orthogonal functions [1,32].
Based on the comparison of hierarchical representations Eq. (3), let's determine the relevance r for random descriptions A and C based on the Manhattan distance between vectors
For better taking into account the influence of components during evaluating the relevance value, you can apply normalized values for Eq. (4):
where
Let's perform classification through optimization of measures in the form Eqs. (4), (5) based on the set of etalons. The analyzed object will be related to the etalon with the shortest distance. The scheme of constructing the classifier on the basis of the calculation of the degree of relevance between the distributions of the components of the description of the object and the etalons for the fixed level of the hierarchy is shown in Fig. 1.
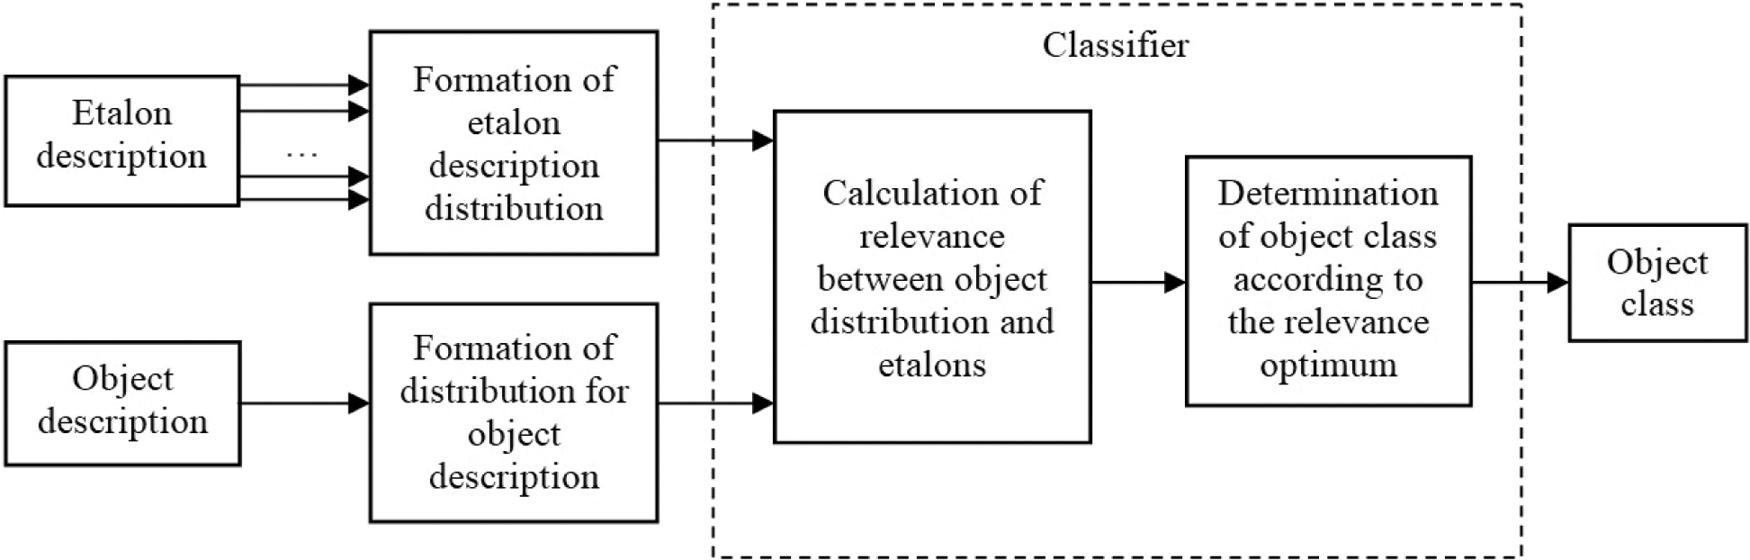
Figure 1: Classification scheme
The important point for the implementation of computer vision methods is the research of their noise immunity for various types of interference [1,13,33–35]. Among them, the most common are the effects of additive noise and local obstacles, which change the image of the object on certain areas.
It is known that structural methods provide high resistance to local interference due to implementing the local analysis of the image during determining keypoint detectors.
Let us research the influence of additive noise, which can be simulated by the following model:
where
5 Analysis of Computer Simulation Results
We have applied the developed model for constructing hierarchical features on the example of images of the emblems of universities: Oxford, Harvard, Massachusetts, Cambridge, Kyiv, and Pennsylvania. The size of the images is 600 × 600.
We use the software environment – IntelliJ IDEA 2018 and IDLE using the OpenCV library and Python and Java programming languages [37–39]. The illustration of the images is shown in Fig. 2. For modeling ORB descriptors with dimension

Figure 2: Example of analyzed images of the emblems of universities
Fig. 3 shows the example of the generated 1-bit distribution (256 bits of the ORB descriptor) for the number of zeros in 100 descriptors of the emblem given in Fig. 2.
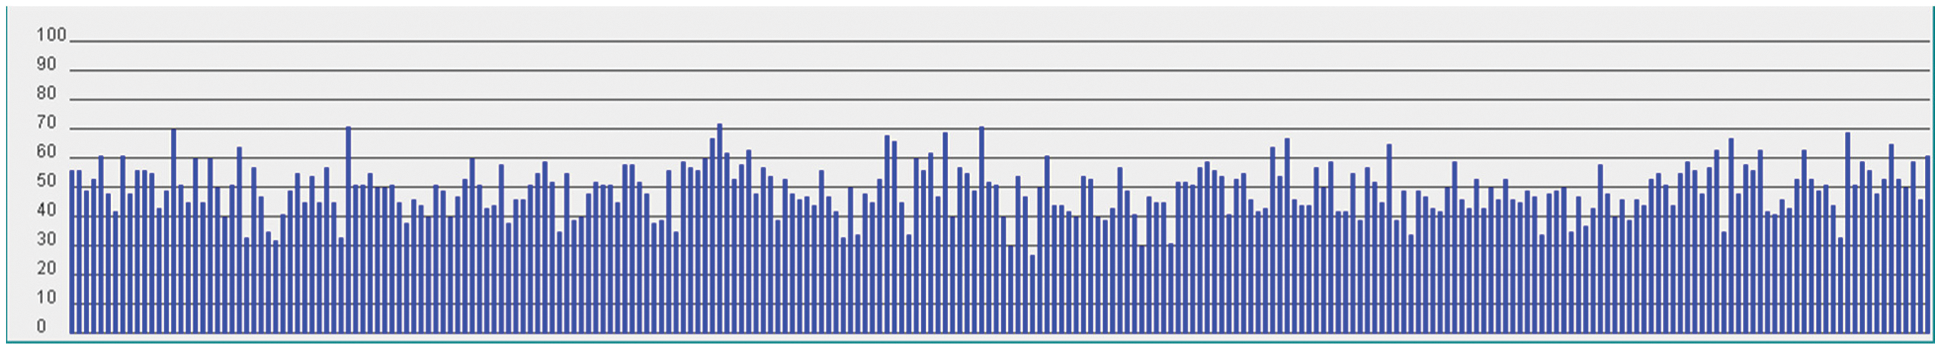
Figure 3: Example of distribution for 100 descriptors
For example Tab. 1 demonstrates the Manhattan distance values r for 1-bit distributions for 100 descriptors of four emblems.
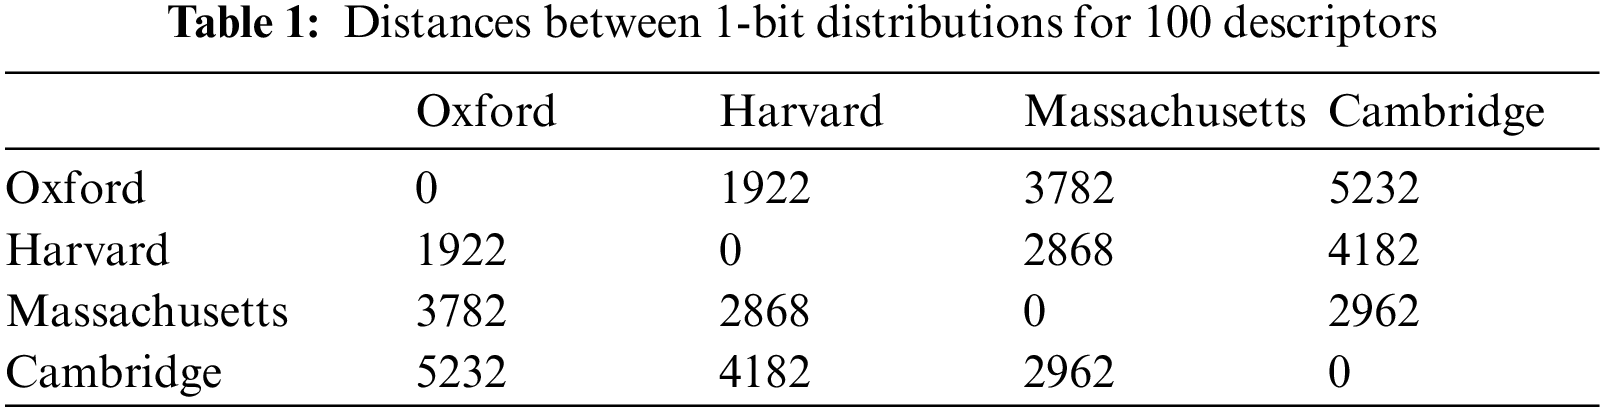
As you can see from the Tab. 1, the distances for different objects differ significantly, which provide the reliable classification.
Fig. 4 shows the values of hierarchical features in the form of diagram for the empirical description of the image of Harvard emblem (Fig. 2) which contains of 100 descriptors. The values in the lower circles correspond to the 8-bit distribution of zeros, and the upper value is equal to the total number of description zeros. The similar structure can be constructed for the random description [1,40].
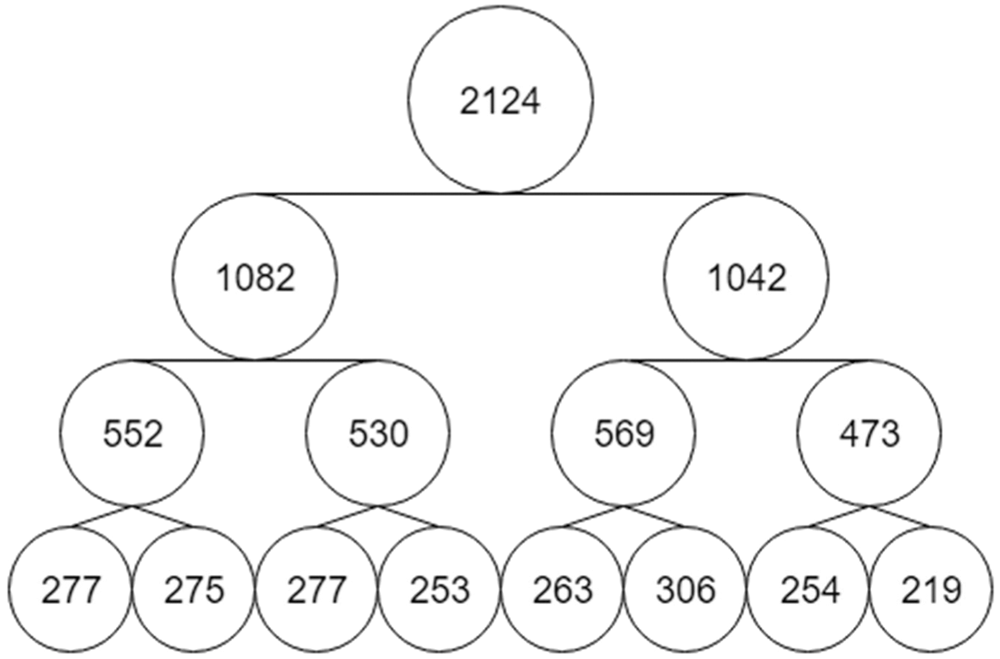
Figure 4: Scheme for calculating hierarchical data for the image of the emblem
Tab. 2 contains the values of the distance Eq. (4) between the distributions of the emblems of the Massachusetts and Oxford universities for 100, 300, 500 descriptors and the different number of bits (1, 2, 4, 8, 128, 256) in fragments.
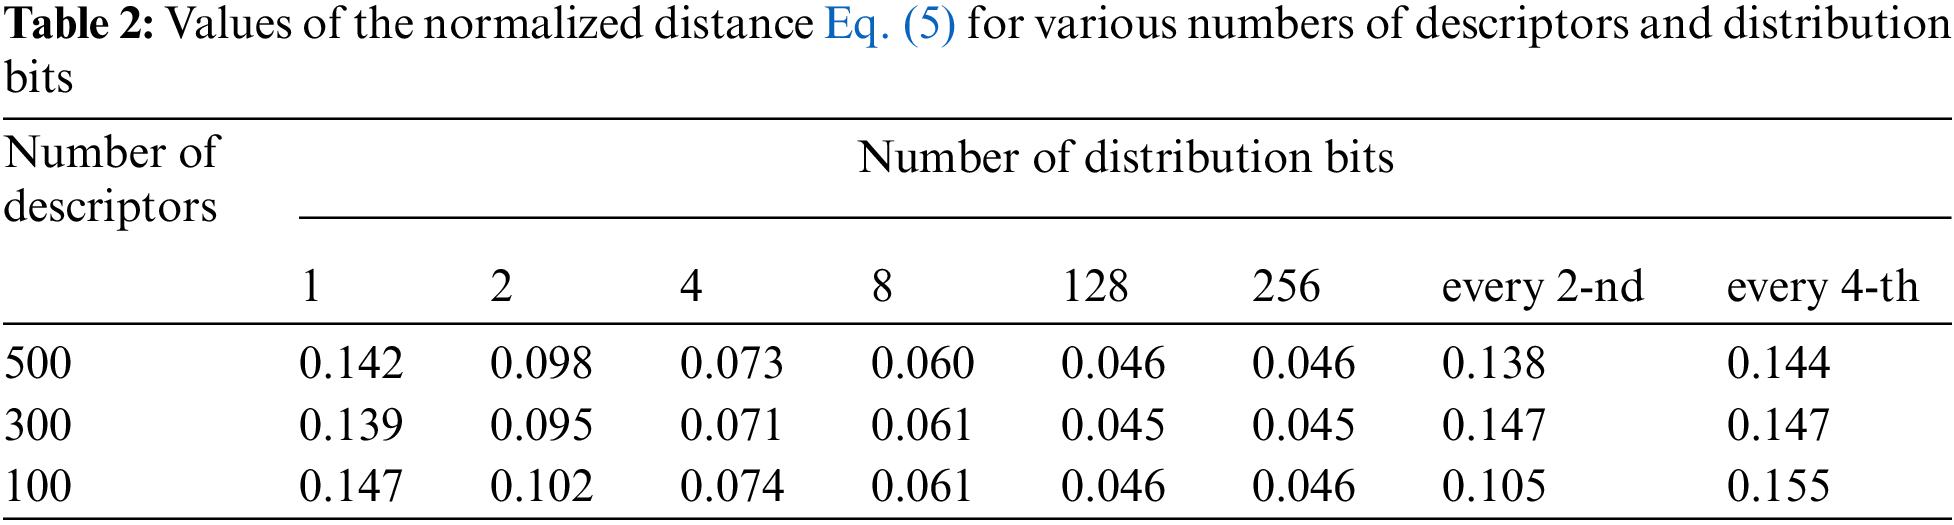
Also, Tab. 2 shows the distances for the reduced distributions of these emblems, where every second and fourth bit from the corresponding one-bit distribution is selected.
As the number of keypoints decreases, the maximum and actual distance between distributions decreases almost proportionally. It means that the increase in the number of descriptors from 100 to 300 has no significant effect on the characteristics of image recognition. This fact confirms the sufficient efficiency of using the apparatus of statistical data distributions. The values in Tab. 2 show that 100 keypoints are enough to distinguish between images of emblems. For other types of images or the number of etalons recognized, these values may differ.
Tab. 3 shows data for evaluating the processing time for implementing variants of the considered models when calculating the relevance of descriptions of images of emblems of Massachusetts and Oxford, depending on the number of bits in the fragments of the distribution.
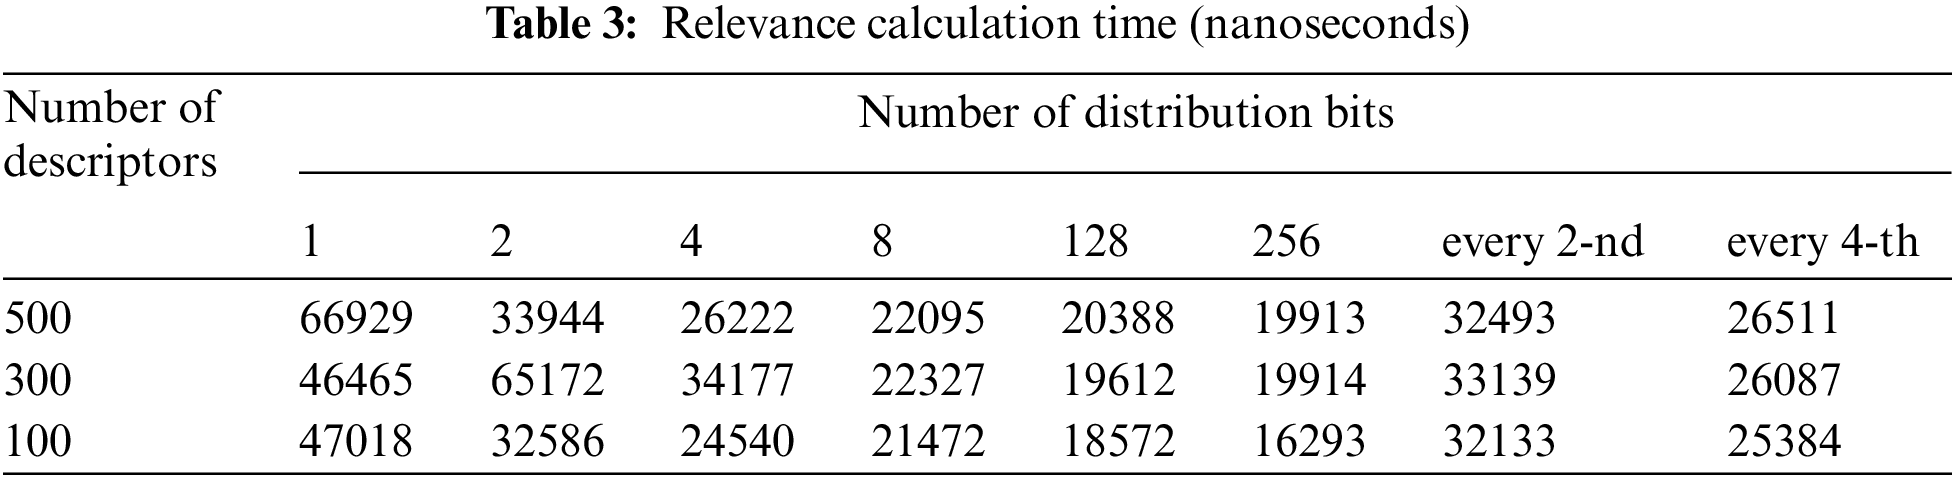
Analyzing the values of Tab. 2 and the estimation of the processing time from Tab. 3 for 100 keypoints, we can say that when calculating according to the “every second” rule, the time predictably decreases in comparison with the 1-bit distribution by about 1.5 times. The normalized distance Eq. (5) decreases from 0.147 to 0.105. When calculating according to the “every fourth” rule, the time decreases in comparison with the 1-bit distribution by 1.9 times. The normalized distance Eq. (5) practically does not change within 0.15. These indicators show sufficient distribution properties of the constructed features in terms of image classification with significantly smaller amount of data, which reduces the processing time.
Note that the estimation of time in Tab. 3 only takes into account the calculation of distance, not including the cost of calculating the distribution. This program is focused on comparison with etalon distributions constructed at the preprocessing stage. In this case, as Tab. 3 shows, the number of keypoints is not significant. Only the number of bits in the distribution fragments is important. The more bits are used, the slower the programming model works. As you can see from Tab. 3, with each increase in the number of bits in the distribution by 2 times, the processing time decreases by about 1.3 times. If to take into account time spent on calculating the distribution, then it is directly proportional to the number of descriptors of the description.
Our experiments have shown that the time for calculating relevance according to distribution is about 1000 times less than for the traditional voting procedure [1]. By implementing the system of hierarchical features, it is possible to achieve further reduction in computation time, while ensuring high efficiency of the classification.
The degree of integration results in decrease in the level of feature differences from 0.147 (for 1-bit) to 0.06 (for 8-bit). This reduces the degree of the difference of descriptions for the integrated representation. Even for 256 bits, there are sufficient differences in the relevance value between the hierarchical descriptions of the emblems. It allows them to be recognized among themselves. The time for 256 bits has decreased almost 3 times.
Let us now estimate experimentally the effect of additive noise on the result of hierarchical classification according to the model Eq. (6). The example of the formation of descriptors according to the etalon and the input image, distorted by noise, is shown in Fig. 5. The noise level

Figure 5: Demonstration of the effect of additive noise on the formation of keypoint descriptors
Modeling has shown that for images of emblems, regardless of the number of distribution bits, the normalized distance Eq. (5) between the distorted and etalon descriptions increases with increasing noise influence. At the same moment the interclass distance between the distorted image and the etalon of another class also increases. The significant distance was observed even for the high noise level
The estimation of the probability of correct classification has been carried out by counting the number of accurate classification events in the series of experiments. The research of classification, when alternately distorted images from 6 classes are arrived into the input under the influence of additive noise, have shown that for 1- and 2-bit distributions correct classification is probable at the level of 0.99 within the entire researched range
According to the results of the research, the 8-bit distribution is the limit degree of the hierarchy of features for the confident classification of images with sufficiently low noise level
Implementation and integration transformation of probability distributions for fragments of descriptors of description and comparison of images in the space of hierarchical features provide the necessary efficiency of image classification. This classification is realized much faster than directly in the space of distributions and traditional voting approaches.
Analysis and processing of data according to the values of the grouped distributions allow to form the hierarchical data structure with the variable parameter of detailing and the identification of significant properties of the image description. The method allows to analyze and choose the level of hierarchy that provides the required quality of classification for the given image database. The experimental evaluation of the efficiency of the classifier has been performed according to the parameters of the calculation time and the probability of correct classification on the basis of the results of processing of specific images.
The scientific novelty of the research lies in the improvement of the method of structural classification of images according to the description in the form of the set of keypoint descriptors based on implementing the hierarchical data structure for block representation of the description.
Practical recommendations from the research are the effective use of integrated features for groups of data bits, which is effective from the point of view of computational speed.
The practical significance of the work:
• Achievement of the significant level of processing during calculating the relevance of images and classification.
• Confirmation of the effectiveness and sufficiently high noise immunity of the proposed models of hierarchical features on the examples of images.
• Obtaining applied software models for research and implementation of classification methods in computer vision systems.
Research prospects can be associated with the optimization of the created system of hierarchical features within the analyzed database of etalons to ensure in-depth use of statistical information for classification with specified performance indicators.
Acknowledgement: The authors acknowledge the support of King Fahd University of Petroleum & Minerals, Saudi Arabia, and also highly acknowledge the Department of Informatics, Kharkiv National University of Radio Electronics, Ukraine, in numerous help and support to complete this article. The authors would like to thank Tetiana Siryk for contributing to software modeling.
Funding Statement: The authors received no specific funding for this research.
Conflicts of Interest: The authors declare that they have no conflicts of interest to report regarding the present research.
1. V. O. Gorokhovatsky and S. V. Gadetska, “Determination of relevance of visual object images by application of statistical analysis of regarding fragment representation of their descriptions,” Telecommunications and Radio Engineering, vol. 78, no. 3, pp. 211–220, 2019. [Google Scholar]
2. Y. I. Daradkeh, I. Tvoroshenko, V. Gorokhovatskyi, L. A. Latiff and N. Ahmad, “Development of effective methods for structural image recognition using the principles of data granulation and apparatus of fuzzy logic,” IEEE Access, vol. 9, pp. 13417–13428, 2021. [Google Scholar]
3. Y. I. Daradkeh, V. Gorokhovatskyi, I. Tvoroshenko, S. Gadetska and M. Al-Dhaifallah, “Methods of classification of images on the basis of the values of statistical distributions for the composition of structural description components,” IEEE Access, vol. 9, pp. 92964–92973, 2021. [Google Scholar]
4. E. Rublee, V. Rabaud, K. Konolige and G. Bradski, “ORB: An efficient alternative to SIFT or SURF,” in 2011 Int. Conf. on Computer Vision, Barcelona, Spain, pp. 2564–2571, 2011. [Google Scholar]
5. S. Walt, J. L. Schönberger, J. Nunez-Iglesias, F. Boulogne, J. D. Warner et al.,“ORB feature detector and binary descriptor,” (2021, Nov. 10). [Online]. Available: https://scikit-image.org/docs/dev/auto_examples/features_detection/plot_orb.html. [Google Scholar]
6. E. Karami, S. Prasad and M. Shehata, “Image matching using SIFT, SURF, BRIEF and ORB: Performance comparison for distorted images,” in Proc. of the 2015 Newfoundland Electrical and Computer Engineering Conf., St. John's, Canada, arXiv preprint arXiv:1710.02726, 2017. [Google Scholar]
7. S. Leutenegger, M. Chli and R. Y. Siegwart, “BRISK: Binary robust invariant scalable keypoints,” in 2011 Int. Conf. on Computer Vision, Barcelona, Spain, pp. 2548–2555, 2011. [Google Scholar]
8. V. O. Gorokhovatskyi, I. S. Tvoroshenko and O. O. Peredrii, “Image classification method modification based on model of logic processing of bit description weights vector,” Telecommunications and Radio Engineering, vol. 79, no. 1, pp. 59–69, 2020. [Google Scholar]
9. V. Gorokhovatskyi and I. Tvoroshenko, “Image classification based on the kohonen network and the data space modification,” in CEUR Workshop Proceedings: Computer Modeling and Intelligent Systems (CMIS-2020), Zaporizhzhia, Ukraine, vol. 2608, pp. 1013–1026, 2020, [Online]. Available: http://ceur-ws.org/Vol-2608/. [Google Scholar]
10. E. Adelson, C. Anderson, J. Bergen, P. Burt and J. Ogden, “Pyramid methods in image processing,” RCA Engineering, vol. 29, no. 6, pp. 33–41, 1984. [Online]. Available: http://persci.mit.edu/pub_pdfs/RCA84.pdf. [Google Scholar]
11. C. Celik and H. Sakir, “Content based image retrieval with sparse representations and local feature descriptors: A comparative study,” Pattern Recognition, vol. 68, pp. 1–13, 2017. [Google Scholar]
12. P. Flach, “Features,” in Machine Learning: The Art and Science of Algorithms that Make Sense of Data, New York, NY, USA: Cambridge University Press, pp. 298–329, 2012. [Google Scholar]
13. L. Shapiro and G. Stockman, “Pattern recognition concepts,” in Computer Vision, Upper Saddle River, NJ, USA: Prentice Hall, pp. 107–136, 2001. [Google Scholar]
14. Y. I. Daradkeh and I. Tvoroshenko, “Application of an improved formal model of the hybrid development of ontologies in complex information systems,” Applied Sciences, vol. 10, no. 19, pp. 6777, 2020. [Google Scholar]
15. V. A. Gorokhovatskiy, “Compression of descriptions in the structural image recognition,” Telecommunications and Radio Engineering, vol. 70, no. 15, pp. 1363–1371, 2011. [Google Scholar]
16. X. Guo, Z. Wu, J. Wu and Y. Cao, “Parallel BRDF-based infrared radiation simulation of aerial targets implemented on intel xeon processor and xeon Phi coprocessor,” Journal of Real-Time Image Processing, vol. 16, no. 1, pp. 49–60, 2019. [Google Scholar]
17. Y. Tang, F. Ren and W. Pedrycz, “Fuzzy C-means clustering through SSIM and patch for image segmentation,” Applied Soft Computing, vol. 87, p. 105928, 2020. [Google Scholar]
18. T. Mensink, J. Verbeek, F. Perronnin and G. Csurka, “Distance-based image classification: Generalizing to new classes at near-zero cost,” IEEE Transactions on Pattern Analysis and Machine Intelligence, vol. 35, no. 11, pp. 2624–2637, 2013. [Google Scholar]
19. S. Zhang, J. Wang, X. Tao, Y. Gong and N. Zheng, “Constructing deep sparse coding network for image classification,” Pattern Recognition, vol. 64, pp. 130–140, 2017. [Google Scholar]
20. D. Zheng, Z. Ran, Z. Liu, L. Li and L. Tian, “An efficient bar code image recognition algorithm for sorting system,” Computers, Materials & Continua, vol. 64, no. 3, pp. 1885–1895, 2020. [Google Scholar]
21. P. Viola and M. J. Jones, “Robust real-time face detection,” International Journal of Computer Vision, vol. 57, no. 2, pp. 137–154, 2004. [Google Scholar]
22. G. Sharma and B. Schiele, “Scalable nonlinear embeddings for semantic category-based image retrieval,” in 2015 IEEE Int. Conf. on Computer Vision, ICCV 2015, Santiago, Chile, pp. 1296–1304, 2015. [Google Scholar]
23. R. Chen, L. Pan, C. Li, Y. Zhou, A. Chen et al., “An improved deep fusion CNN for image recognition,” Computers, Materials & Continua, vol. 65, no. 2, pp. 1691–1706, 2020. [Google Scholar]
24. R. Szeliski, “Recognition,” in Computer Vision: Algorithms and Applications, London, Great Britain: Springer-Verlag, pp. 655–718, 2010. [Google Scholar]
25. Y. I. Daradkeh and I. Tvoroshenko, “Technologies for making reliable decisions on a variety of effective factors using fuzzy logic,” International Journal of Advanced Computer Science and Applications, vol. 11, no. 5, pp. 43–50, 2020. [Google Scholar]
26. Q. Wu, Y. Li, Y. Lin and R. Zhou, “Weighted sparse image classification based on low rank representation,” Computers, Materials & Continua, vol. 56, no. 1, pp. 91–105, 2018. [Google Scholar]
27. J. Leskovec, A. Rajaraman and J. D. Ullman, “Clustering,” in Mining of Massive Datasets, New York, NY, USA: Cambridge University Press, pp. 241–276, 2014. [Google Scholar]
28. C. B. Murthy, M. F. Hashmi, G. Muhammad and S. A. AlQahtani, “YOLOv2PD: An efficient pedestrian detection algorithm using improved YOLOv2 model,” Computers, Materials & Continua, vol. 69, no. 3, pp. 3015–3031, 2021. [Google Scholar]
29. H. Wu, Q. Liu and X. Liu, “A review on deep learning approaches to image classification and object segmentation,” Computers, Materials & Continua, vol. 60, no. 2, pp. 575–597, 2019. [Google Scholar]
30. X. Tang, M. Zhang, P. Yu, W. Liu, N. Cao et al., “A nonuniform clustering routing algorithm based on an improved k-means algorithm,” Computers, Materials & Continua, vol. 64, no. 3, pp. 1725–1739, 2020. [Google Scholar]
31. I. S. Tvoroshenko and V. O. Gorokhovatsky, “Effective tuning of membership function parameters in fuzzy systems based on multi-valued interval logic,” Telecommunications and Radio Engineering, vol. 79, no. 2, pp. 149–163, 2020. [Google Scholar]
32. M. Ghahremani, Y. Liu and B. Tiddeman, “FFD: Fast feature detector,” IEEE Transactions on Image Processing, vol. 30, pp. 1153–1168, 2021. [Google Scholar]
33. Y. Xu, Z. Jia, L. -B. Wang, Y. Ai, F. Zhang et al., “Large scale tissue histopathology image classification, segmentation, and visualization via deep convolutional activation features,” BMC Bioinformatics, vol. 18, no. 1, pp. 281, 2017. [Google Scholar]
34. A. Nasirahmadi and S. -H. M. Ashtiani, “Bag-of-feature model for sweet and bitter almond classification,” Biosystems Engineering, vol. 156, pp. 51–60, 2017. [Google Scholar]
35. D. Pathak, P. Krähenbühl, J. Donahue, T. Darrell and A. A. Efros, “Context encoders: Feature learning by inpainting,” in 2016 IEEE Conf. on Computer Vision and Pattern Recognition (CVPR), Las Vegas, NV, USA, pp. 2536–2544, 2016. [Google Scholar]
36. Y. Liu, F. Wei, J. Shao, L. Sheng, J. Yan et al., “Exploring disentangled feature representation beyond face identification,” in 2018 IEEE Conf. on Computer Vision and Pattern Recognition, CVPR 2018, Salt Lake City, UT, USA, pp. 2080–2089, 2018. [Google Scholar]
37. G. Bradski and A. Kaehler, “OpenCV Open Source Computer Vision,” (2021, Nov. 12). [Online]. Available: https://docs.opencv.org/master/index.html. [Google Scholar]
38. Y. Zheng, J. Fan, J. Zhang and X. Gao, “Exploiting related and unrelated tasks for hierarchical metric learning and image classification,” IEEE Transactions on Image Processing, vol. 29, pp. 883–896, 2019. [Google Scholar]
39. T. Grin, B. Noll and N. Chisler, “IntelliJ IDEA,” (2021, Nov. 14). [Online]. Available: https://www.jetbrains.com/idea. [Google Scholar]
40. O. Kobylin, V. Gorokhovatskyi, I. Tvoroshenko and O. Peredrii, “The application of non-parametric statistics methods in image classifiers based on structural description components,” Telecommunications and Radio Engineering, vol. 79, no. 10, pp. 855–863, 2020. [Google Scholar]
 | This work is licensed under a Creative Commons Attribution 4.0 International License, which permits unrestricted use, distribution, and reproduction in any medium, provided the original work is properly cited. |