DOI:10.32604/cmc.2022.025555
| Computers, Materials & Continua DOI:10.32604/cmc.2022.025555 | |
| Article |
An Optimal Scheme for WSN Based on Compressed Sensing
1Department of Information Systems and Networks, Faculty of Information Technology, The World Islamic Sciences & Education University, Jordan
2Computer Science Department, Community College, King Saud University, Saudi Arabia
3Department of Computer Engineering, National Technical University of Ukraine “Igor Sikorsky Kyiv Polytechnic Institute, Ukraine
*Corresponding Author: Ahmad Ali AlZubi. Email: aalzubi@ksu.edu.sa
Received: 28 November 2021; Accepted: 28 December 2021
Abstract: Wireless sensor networks (WSNs) is one of the renowned ad hoc network technology that has vast varieties of applications such as in computer networks, bio-medical engineering, agriculture, industry and many more. It has been used in the internet-of-things (IoTs) applications. A method for data collecting utilizing hybrid compressive sensing (CS) is developed in order to reduce the quantity of data transmission in the clustered sensor network and balance the network load. Candidate cluster head nodes are chosen first from each temporary cluster that is closest to the cluster centroid of the nodes, and then the cluster heads are selected in order based on the distance between the determined cluster head node and the undetermined candidate cluster head node. Then, each ordinary node joins the cluster that is nearest to it. The greedy CS is used to compress data transmission for nodes whose data transmission volume is greater than the threshold in a data transmission tree with the Sink node as the root node and linking all cluster head nodes. The simulation results demonstrate that when the compression ratio is set to ten, the data transfer volume is reduced by a factor of ten. When compared to clustering and SPT without CS, it is reduced by 75% and 65%, respectively. When compared to SPT with Hybrid CS and Clustering with hybrid CS, it is reduced by 35% and 20%, respectively. Clustering and SPT without CS are compared in terms of node data transfer volume standard deviation. SPT with Hybrid CS and clustering with Hybrid CS were both reduced by 62% and 80%, respectively. When compared to SPT with hybrid CS and clustering with hybrid CS, the latter two were reduced by 41% and 19%, respectively.
Keywords: Compressed sensing; computer networks; sensor networks; ad hoc networks
A wireless sensor network (WSN) is usually composed of several wireless sensor nodes deployed in the monitoring area. Each sensor node perceives environmental information, processes it and transmits it to the sink node in a wireless multi-hop manner [1]. Wireless sensor nodes are usually deployed in unattended field areas or complex industrial control sites, so it is extremely inconvenient to replace the battery. At the same time, the computing, storage and energy resources of the wireless sensor node are extremely limited [2,3]. Therefore, the monitoring data collected by the sensor node is compressed before proceeding and transmission can effectively extend the survival period of wireless sensor networks. At present, data compression and reconstruction techniques in wireless sensor networks have become one of the core issues in the field of research [4,5].
Wireless sensor network is generally composed of a large number of energy-constrained sensor nodes and several base stations [6]. The WSN nodes can be deployed to industrial automation products, traffic control, electronic warfare, traffic automation, electronic health and network control for scene monitoring [2]. However, with the continuous development of WSN, the bandwidth and data volume required for signal acquisition have increased geometrically, so it is necessary to establish a new mechanism to reduce energy consumption, cost, delay, communication volume and the amount of information bits tested. When a large-scale WSN is designed and deployed to cover a geographical area, the data observations of neighboring nodes have temporal and spatial correlation. The clustered network structure can effectively eliminate data redundancy, reduce data communication volume and communication distance, and has strong scalability, Load balancing, strong robustness, etc. In WSN, the communication between nodes is the main reason for node energy loss [7,8]. WSN has the situation that some nodes die prematurely due to the unbalanced data flow, which guarantees transmission under the premise of data quality, how to reduce the energy consumption of data transmission and balance the load of network nodes is of great significance to extend the life cycle of the network [9].
In recent years, the development of compressive sensing (CS) [10–14] technology has brought revolutionary breakthroughs to wireless sensor network data collection technology [15]. CS can be much lower than Nyquist sampling The collection of data information is completed under the condition of speed, thereby reducing the amount of network data transmission, reducing network energy consumption, and prolonging the life cycle of the network [16]. Assume that the network is composed of 1 Sink node and N sensing nodes. Let x be 1 with N vector elements, collection of data representing a network, each data element corresponding to a sensor node collected. The x thinning process, x = ψs, where ψ is an N × N transform group, s is the coefficient vector. If the coefficient vector s only contains k non-zero elements (k ≪ N), then x is said to be k in the ψ field-sparse when k is small, in accordance with compressive sensing, only the transmission signal vector x of M observations composed of the vector y object to sink node can be transmitting information, y =
In the tree-based data collection method, leaf nodes far away from the sink node need to transmit fewer data packets, and nodes closer to the sink node need to transmit more data packets. However, after using CS to process the node data, each node needs to transmit M data packets, that is to say, M × N data packets need to be transmitted in a network of N nodes, which is still a very large value. Literature [20–22] proposed hybrid compressed sensing method, in which the leaf node far away from the sink node transmits the original data, and the node closer to the sink node uses compressed sensing technology for data compression. The above methods use CS in the routing tree, and the clustered structure is compared with the tree structure in terms of robustness and network load balancing and other advantages [23–25]. The robustness is stronger because even if the nodes in the cluster die unexpectedly due to physical factors, it has little impact on the network topology. Balanced load is due to clustering number of nodes in the network can be balanced, which can alleviate the bottleneck effect in the tree network. However, the above methods ignore the geographical location of the network and the distribution of nodes. Research shows that in sensor networks, the collection algorithm is designed according to the distribution of nodes which can reduce the amount of data transmission [26]. Reference [27] proposes a method for data collection using hybrid CS technology in a clustered sensor network, where CS is not used for data transfer in clusters, and CS is used between clusters. The amount of data transmission is effectively reduced by minimizing the transmission consumption in the cluster. However, this method does not consider the huge load of nodes close to the cluster head and nodes with large connectivity in a large-scale network. The network load is unbalanced and ignored and the impact of the number of inter-cluster transmission hops on the data transmission volume is negligible. Reference [28] proposed a clustered data fusion algorithm based on non-uniform division, which divides the network into non-uniform grids. The farther away from the base station, the larger the grid. A node with the largest remaining energy is selected as the cluster head, and the node selects the cluster head according to the signal attenuation strength of the broadcast message of the cluster head. Simulation experiment results show that the algorithm can save energy and balance energy consumption, and significantly extend the life cycle of the network. Reference [29] proposed a hierarchical data fusion algorithm that combines wavelet support vector machine (SVM) and evidence theory. The algorithm uses wavelet transform to perform data-level denoising processing on the original signal, and establishes a SVM multi-classifier model, use feature parameters as input vectors to perform feature-level fusion of leak detection at ordinary nodes. Using improved evidence combination rules, the decision-level evidence combination is performed at the convergence node to obtain the final decision of the pipeline network state. Simulation results show that this method can effectively improve the accuracy of leak source location detection and reduce detection errors. Reference [30] studied the selection of the modulation method of wireless signal transmission in order to improve the efficiency of wireless network data transmission and reduce energy consumption, and proposed a low-power encoding method at the physical layer. Reference [31] proposed a low-energy signal sampling method in wireless networks to increase the lifetime of sampling nodes. Reference [32] uses Fourier transform, discrete cosine transform and wavelet transform to establish the signal sparse base according to the characteristics of the time sequence or space sequence of the wireless sensor network, generates the sparse representation data of the signal, and then samples the sparse data. This can greatly reduce the sampling time and space consumption. These methods use the spatial correlation of the detected data to compress and encode the data, but they cannot effectively deal with the abnormal event data, and the computational complexity is high. The compressed sensing theory proposed in recent years provides a new data acquisition method for wireless sensor networks [33–35]. According to the theory of compressed sensing, a sparse signal can be accurately reconstructed with a few sampling times, and the sampling can be done by linear projection of the detection data. In this way, sensor nodes can complete data collection in a compressed manner without additional computational overhead. For the wireless sensor network, although it has the characteristics of convenient construction, strong adaptability, and high transmission efficiency, there are some limitations in some aspects, such as energy supply, sensor life cycle, delay, bandwidth, signal distortion, and transmission cost [36–43].
In a clustered network, because the cluster head nodes need to converge and forward a large amount of data, reducing the number of topology hops and the amount of data used for inter-cluster transmission has an important impact on extending the life cycle of the network.
The main contributions of this paper are as follows:
• This paper considers the determined cluster head distance between the node and the undetermined candidate cluster head node, and the candidate cluster head node with the shortest distance from the parent cluster head node is selected in turn as the child cluster head node, thereby optimizing the cluster head selection mechanism in the network and sacrificing the transmission volume in a small number of clusters premise of quickly reducing the amount of transmission between the clusters.
• Greedily construct a data transmission tree with the sink node as the root node and connecting all cluster head nodes, and transfer the data to the sink node.
• The data transmission amount in the cluster is higher than the threshold nodes and used for inter-cluster transmission use CS compressed data transmission to achieve the purpose of balancing network load and reducing data transmission.
Simulation experiments show that it is combined with a variety of tree-based data collection algorithms and clustered hybrid CS data collection algorithms, the proposed algorithm can effectively reduce the amount of network data transmission. Compared with traditional tree-based data collection algorithms, reference [27] and clustered networks that do not use CS technology for data collection can effectively balance the network load.
2.1 Model Establishment and Examples
Assumptions: 1) All nodes in the network are independently and uniformly distributed in the sensing area; 2) All nodes in the network have the same initial energy and transmission rate; 3) All nodes in the network can pass GPS or other positioning technologies [28,29] to perceive the location information.
First, the cluster head node is obtained through the cluster head election algorithm, and then each ordinary node chooses to join the cluster head node closest to its position, and divides the network into several clusters. Each ordinary node passes the data to the cluster head node through the shortest path algorithm to obtain the cluster internal data collection model. Each cluster head node compresses the data within the cluster, and then transmits the data to the sink node through the routing tree constructed by greedy selection to obtain the inter-cluster data collection model. Fig. 1 is an example of clustered data collection based on hybrid CS method. The cluster head node performs compressed sensing sampling on the data in the cluster according to the measurement matrix
Taking Fig. 1 as an example, suppose the network is divided into five clusters. The cluster head nodes CH1, CH2, CH3, CH4, CH5 are used to transmit data through a data transmission tree constructed by greedy selection with the Sink node as the root node. The original data x is constructed from the data collected in five clusters, and the original signal matrix
The measured value y received by the sink node is the sum of the data of all cluster head nodes sampled by compressed sensing, as shown in Eq. (1). In each transmission, the cluster head node fuses its own data with the data of the sub-cluster head node, and then pass the observations to the Sink node through the greedy routing tree. The Sink node can reconstruct the original signal x based on the received observation y and the measurement matrix

Figure 1: Illustration of proposed node distribution with CS deployment
2.2 Theoretical Analysis and Proof
The clustered hybrid CS data collection method in this paper includes two aspects of data transmission: the nodes in the cluster pass the data to the cluster head node through the shortest path algorithm, and the data is passed to the sink node through the greedy routing transmission tree between the clusters. Nodes whose data transmission volume is higher than the threshold and nodes used for inter-cluster transmission use CS to compress data transmission. The communication volume of any node in the network is the sum of its own communication volume and the communication volume of all its child nodes. The node's data transmission jumps the more the number, the data of this node will be transmitted multiple times in the parent nodes at all levels, increasing the communication volume of the network. Therefore, in order to save the energy of the nodes in the network, the data collection method designed needs to reduce the transmission in the network as much as possible, that is, reduce the total number of hops of data packet transmission as much as possible.
2.2.1 The Number of Clusters of the Network
In the clustered hybrid CS data collection method, the number of divided clusters in the network has an important impact on the network transmission volume. When the number of clusters in the network is too small, the transmission volume within the cluster will increase sharply. When the number of clusters in the network is too large for a long time, the number of cluster head nodes will increase, and the amount of transmission between clusters is bound to increase. Therefore, there is an optimal number of clusters in the clustered hybrid CS data collection method to minimize the network transmission volume. The optimal number of clusters in the network is expressed as:
Among them,
2.2.2 Intra-Cluster Transmission of the Network
As shown in Fig. 2, the network is divided into

Figure 2: Intra-cluster transmission
The cluster head node in the network is located in the center of the network and close to the sink node, so that the average number of hops for the nodes in the cluster to transmit data to the cluster head node is the smallest. Nodes in the same grid as the cluster head node need to pass 1 hop data is transmitted to the cluster head node. The node of the h layer needs to pass h hops at most to pass the data to the cluster head node, and at least h − 1 hops to pass the data to the cluster head node.The number of grids in the h layer is 8(h − 1), h
due to
Therefore, the number of hops for a sensor node in a single cluster to transmit data to the cluster head node is
Therefore, the upper bound of the total number of hops in the network's cluster communication transmission is
In the same way, it can be seen that the lower bound of the total number of hops in the network's cluster communication transmission is
2.2.3 Inter-Cluster Transmission of the Network
As shown in Fig. 3, the network is divided into a cluster structure of

Figure 3: Inter-cluster transmission
When the cluster head node for sensing the data is sampled, the data is transmitted to the Sink node is greedy routing tree. Each cluster head node after transmitting the compressed data to their parent measured from the nearest cluster head node Sink nodes subject to
The theoretical value of the total number of transmission hops in the network is the sum of the number of transmission hops within a cluster and the number of transmission hops between clusters. The upper bound of the total number of network transmission hops is
The lower bound of the total number of hops in network transmission is
For a given network,

After the network selects c cluster heads by, other nodes choose to join the cluster head node closest to itself, and the network is divided into c clusters. The ordinary nodes in the cluster only need to pass the data to the cluster head node roughly located in the center of the cluster and the cluster head node needs to pass the collected data to the sink node through multiple hops. The selected c cluster head nodes are all close to the cluster centroid. Algorithm 1 does not increase the intra-cluster transmission as much as possible, so that the distance between the adjacent cluster head nodes becomes smaller and the cluster head node is as close to the sink node as possible, which can effectively reduce the number of data transmission hops in the network.
Greedy routing tree construction algorithm: With U represents a set consisting of all cluster head node Sink nodes obtained by the algorithm 1, Uin represents a cluster-head node has been added to the set of routing tree, the U-Uin is not added to the tree in the cluster-head node.

Algorithm 2 constructs a data transmission tree with the Sink node as the root node through greedy selection. Each sub-cluster head node only needs to pass the data to the nearest parent cluster head node, and the number of transmission hops between any two cluster heads. Both are the smallest, which ensures that the Sink node can reconstruct the original signal x according to the measurement matrix
This paper uses MATLAB simulation tool to simulate and compare the proposed algorithm with other data collection schemes. Clustering without CS has the same clustering structure as the algorithm in this paper but does not use CS for data compression. Short path sink node in tree (SPT) without CS collects the data of the sensing node through the shortest path tree constructed. The sink node in SPT with Hybrid CS collects the data of the sensing node through the shortest path tree constructed, and the number of child nodes in the tree (including itself) is greater than the observed value threshold. The node uses CS to compress the data. The optimal tree with hybrid CS proposed in [22] uses hybrid CS to construct the minimum spanning tree and the shortest path tree for the nodes, and then greedily choose to join the data transmission nodes of the tree construct a transmission tree with the least energy consumption. Clustering with Hybrid CS is a clustered hybrid CS data collection scheme proposed in [27]. The nodes in the cluster transmit data to the cluster head node through the shortest path [31]. The cluster head node after CS sampling the data, the observation value is passed to the sink node by constructing a backbone tree connecting all cluster head nodes and sink nodes [31–35].
Network parameter setting: the network area is set to
Four indicators are measured in the simulation:
1) The total amount of data transmitted. The amount of data received by the sink node in one collection cycle.
2) Transmission volume reduction ratio. The transmission volume reduction ratio of the algorithm in this paper compared to other algorithms. The transmission volume reduction ratio compared to clustering without CS is the difference in the data transmission volume in the same cycle between clustering without CS and the algorithm in this paper divided by clustering transmission volume of without CS in 1 cycle.
3) In-cluster and inter-cluster load balancing evaluation index. The average deviation of the number of members in the cluster and the average deviation of the average distance fromthe cluster head to other member nodes. The inter-cluster load balancing evaluation index, the difference between adjacent cluster heads average distance and the average deviation of the distance between adjacent cluster heads.
4) The standard deviation of the transmission volume of each node in one collection cycle in the network and the average standard deviation of the transmission volume of the nodes in the cluster.
Fig. 4a is the simulation result of the data transmission volume of the algorithm in this paper and the other five data collection algorithms under the condition of a compression ratio of 5. Fig. 4b is the comparison of the data transmission volume of each data collection algorithm when the compression ratio is 10.

Figure 4: Comparison of total data transmission with increasing number of nodes
As shown in Fig. 4, the proposed technique considerably decreases the transmission volume when compared to Clustering without CS and SPT without CS. The suggested approach outperforms SPT with Hybrid CS in terms of data transfer volume. This is because in the clustering structure, the sensing node only needs to transmit the data to the cluster head node roughly located in the center of the cluster, and the sensing node in SPT with Hybrid CS transfers data to the parent node that is close to the sink node, which will greatly increase the number of transmission hops and increase the amount of data transmission in the network. The proposed algorithm is more effective than clustering with hybrid CS. The amount of data transmission is reduced because it determines the cluster heads in turn based on the distance from the determined cluster head node to the undetermined candidate cluster head node, and reduces the number of data transmission hops while increasing the amount of intra-cluster transmission as little as possible and reduce the amount of inter-cluster transmission. For nodes whose data transmission amount is higher than the threshold and nodes used for inter-cluster transmission, use CS to compress data transmission to reduce the amount of data transmission. The proposed algorithm and the optimal tree scheme proposed in [22] are compared. The network transmission volume of the hybrid CS is slightly reduced, but the network based on the clustering structure has better fault tolerance. In the tree-based network structure, when some nodes in the tree are exhausted and die, the network topology changes will occur, causing the transmission tree to no longer be efficient.
4.3 Transmission Reduction Ratio Analysis
Fig. 5a shows the simulation results of the data transmission reduction ratio between the proposed and the other four data collection algorithms under the condition of a compression ratio of 5. Fig. 5b shows the compression ratio between the proposed and the other four data collection algorithms. The simulation result of the data transmission volume reduction ratio under the condition of 10. It can be seen from Fig. 5b that when the compression ratio is 10, the proposed algorithm reduces the transmission volume of clustering without CS by about 75%, and reduces the transmission volume by about 65% compared with SPT without CS. Compared with SPT with Hybrid CS, the transmission volume is reduced by about 35%. Compared with the Clustering with Hybrid CS proposed in [27], the transmission volume is reduced by about 20%. Obviously the reduction ratio does not decrease with the increase of the number of nodes, which shows that the proposed algorithm has better scalability. It can be seen from Fig. 5a that when the compression ratio is 5, compared to the case of Clustering without CS and SPT without CS with a compression ratio of 10, the transmission volume reduction ratio is only reduced by about 5% to 10%. This shows that the proposed algorithm can effectively reduce the transmission volume of the network even in the case of a large number of sampled signals. The reduction ratio of transmission volume is reduced by 2% to 5% when compared to the case where the compression ratio of SPT with Hybrid CS and Clustering with Hybrid CS is 10. Because the suggested approach focuses on lowering the transmission volume across clusters, this is the case. As the compression ratio is reduced, the total network transmission volume is reduced as well, resulting in a lower transmission volume reduction ratio when compared to SPT with Hybrid CS and Clustering with Hybrid CS.
This section compares and analyzes the network load balance between the proposed and other algorithms. Fig. 6 shows the standard deviation of the transmission volume of each node between the proposed and other five data collection algorithms under the condition of a compression ratio of 10.
Clustering without CS and SPT without CS is not used to compress and measure nodes whose transmission volume exceeds the compressed sensing threshold, the transmission volume of nodes in the backbone tree is very large, while the transmission volume of leaf nodes is very small, so the transmission volume between nodes is low. The discrepancy is significant, indicating that the load is unbalanced. As a result, the cluster network outperforms the tree network in terms of load balancing. The tree architecture is adopted by SPT with Hybrid CS and Optimal Tree with Hybrid CS, resulting in leaf nodes and fusion node transmission volume varying substantially. The suggested algorithm is better balanced than Clustering with Hybrid CS. This is because nodes in the cluster with a data transmission volume greater than the threshold, as well as nodes used for inter-cluster transmission, use CS to compress data transmission.

Figure 5: Comparison of reduction ratio of the proposed and existing algorithms

Figure 6: Comparison of standard deviation of the nodes
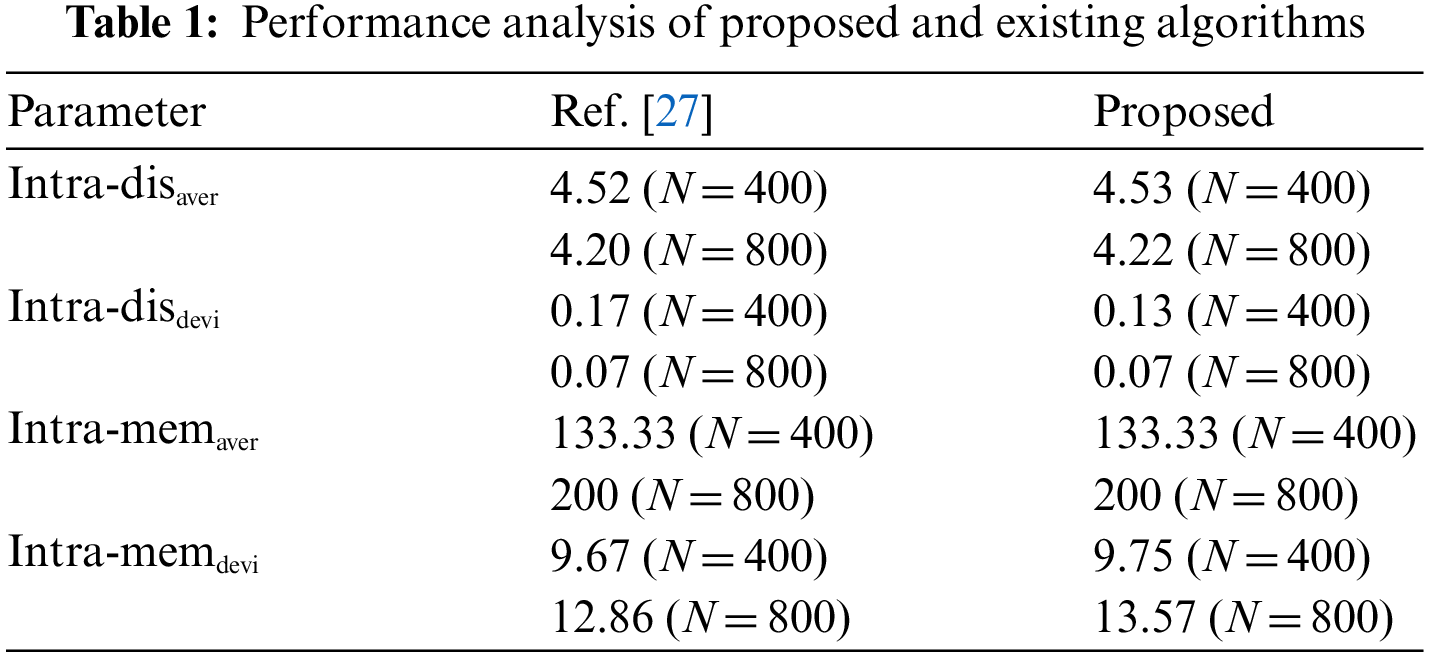
The balance of intra-cluster communication consumption is one of the important factors that affect load balancing. Intra-cluster communication consumption is proportional to the number of member nodes in the cluster and the distance between the cluster head and its members, so the proposed algorithm is verified for load balancing within the cluster. The performance mainly considers the average deviation of the number of members in the cluster Intra-memdevi and the average deviation of the average distance from the cluster head to its member nodes. The specific results of Intra-disdevi are shown in Tab. 1.
The Intra-memaver in Tab. 1 represents the average number of member nodes in the cluster, and Intra-disaver represents the average distance from the cluster head to its member nodes. The two average variables mainly reflect the average load of communication consumption within the cluster, the smaller the average load, the smaller the network energy consumption. The deviation variable mainly reflects the degree of difference between different clusters, the smaller the deviation, the smaller the difference, and the more balanced the load. From Tab. 1, the proposed algorithm is compared with reference [27] algorithm. The load balance index deviation and average difference within the cluster are slightly worse than reference [27]. This is because the proposed algorithm mainly considers the application of CS to minimize the transmission between clusters.
Tab. 2 is the average standard deviation Std-intraaver of the transmission volume of the nodes in the cluster, reflecting the average difference of the transmission volume of the nodes in the cluster. The smaller the average standard deviation, the more balanced the load of the nodes in the cluster.
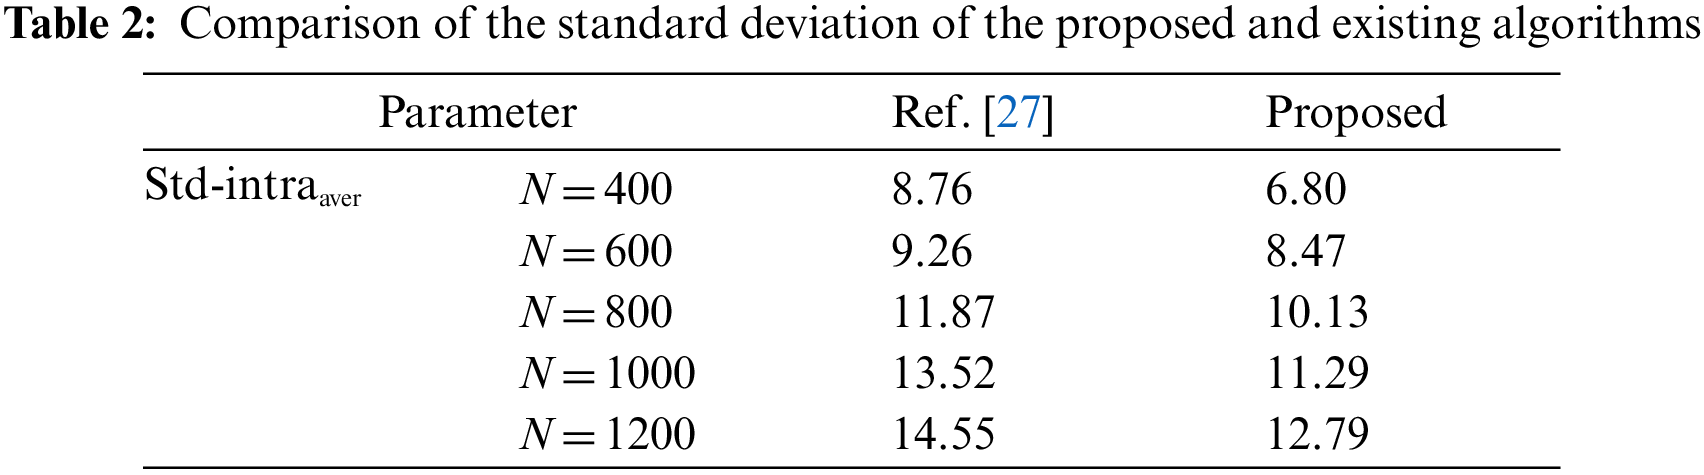
It can be seen from Tab. 2 that the average standard deviation of the transmission volume of the nodes in the cluster of the proposed algorithm is lower than that of reference [27] method under 400∼1200 nodes, which proves that the proposed algorithm performs the calculation on the nodes whose data transmission volume in the cluster is higher than the threshold. Compressed measurement reduces the difference in the amount of transmission between the nodes in the cluster and balances the load in the cluster.
Communication consumption balance between clusters is another important factor to measure load balance. The average distance and average deviation between adjacent cluster heads are tested. The specific results are shown in Tab. 3. The average distance between adjacent cluster heads Inter-disaver reflects the communication consumption between cluster heads, while the average distance deviation between adjacent cluster heads Inter-disdevi reflects the degree of difference in communication consumption. From Tab. 3, we can see that, the proposed algorithm has lower value than reference [27] in average distance and average deviation. This is because the selection of cluster head nodes considers the distance between the determined cluster head and the undetermined candidate cluster head node, and the distance from the parent cluster head is selected in turn. The shortest candidate cluster head node is the sub-cluster head node. When the inter-cluster transmission tree is greedily constructed, it can effectively reduce the transmission distance between the clusters, reduce the communication consumption, and balance the load.
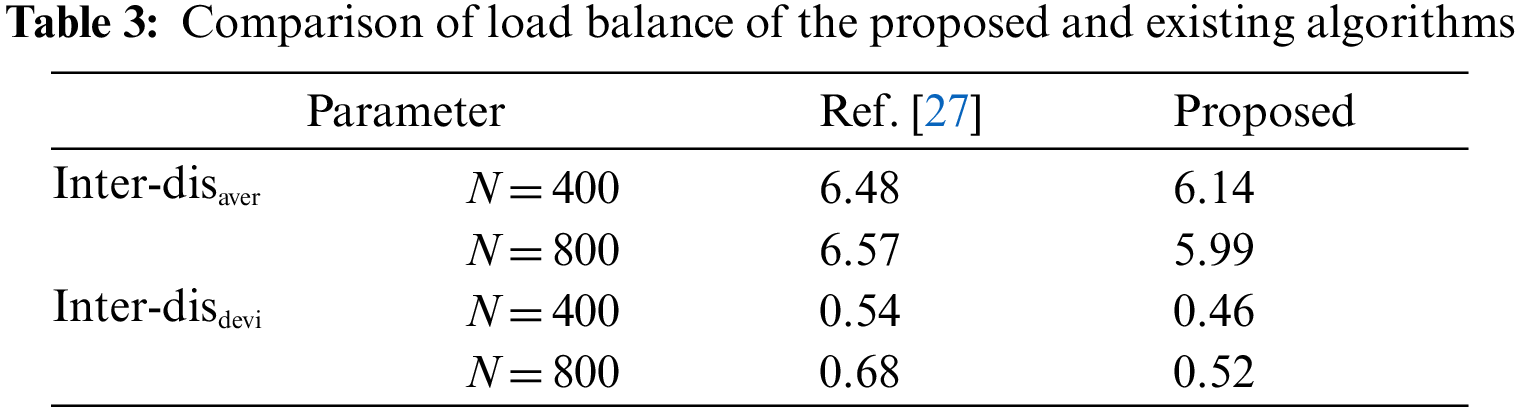
Fig. 7 compared the network lifetime of the proposed and existing algorithms under increading number of CS measurements. As can be seen from Fig. 7, the network lifetime of all the schemes is decreasing with increasing number of CS measurements. However, the network lifetime of the proposed algorithm is better than the existing algorithms. This makes the proposed algorithm superior over the existing schemes because it provides more robustness and long-time performance.

Figure 7: Comparison of the network lifetime of the proposed and existing algorithms under increasing number of CS measurements
This paper takes into account the determined cluster head distance between the node and the undetermined candidate cluster head node, and the candidate cluster head node with the shortest distance from the parent cluster head node is chosen as the child cluster head node, thereby optimizing the cluster head selection mechanism in the network and sacrificing transmission volume in a small number of clusters on the premise of quickly reducing the amount of transmission between the node and the undetermined candidate cluster head node. Clustering with hybrid CS is less successful than the suggested technique. The amount of data transmission is reduced because the cluster heads are determined in turn based on the distance between the determined cluster head node and the undetermined candidate cluster head node, and the number of data transmission hops are reduced while intra-cluster transmission is increased as little as possible and inter-cluster transmission is reduced. Use CS to compress data transfer for nodes whose data transmission amount exceeds the threshold and nodes utilized for inter-cluster transmission to lower the amount of data transmission. The proposed algorithm has more effective results than existing algorithms which makes it useful for WSN data transmission.
In a clustered sensor network, this research provides a data gathering strategy based on hybrid CS. The cluster head selection mechanism in the network has been optimised in order to lower the quantity of data transmission in the network and balance the network load. 1) Determine that the first cluster head is the candidate cluster closest to the sink head node. The candidate cluster head node with the lowest distance from the parent cluster head node is picked as the child cluster head node, and the network is partitioned into clusters, based on the distance between the determined cluster head node and the indeterminate candidate cluster head node; 2) Build a data transmission tree with the Sink node as the root node and connect all cluster head nodes as quickly as possible.; 3) The quantity of data transmission in the cluster is larger than the threshold, and the nodes utilized for inter-cluster transmission employ the CS to compress the data transmission to fulfil the goal of balancing network load and lowering data transmission. The suggested algorithm outperforms clustering without CS, SPT without CS, and SPT with Hybrid CS, according to the experimental data. Clustering using Hybrid CS can significantly cut data transmission and improve network load balancing performance. Other critical parameters such as energy efficiency and latency will be used in future study to evaluate the effectiveness of the proposed method.
Acknowledgement: The authors extend their appreciation to King Saud University for funding this work and would like to thank the editors and reviewers for their review and recommendations.
Funding Statement: This work was supported by the Researchers Supporting Project (No. RSP-2021/395), King Saud University, Riyadh, Saudi Arabia.
Conflicts of Interest: The authors declare that they have no conflicts of interest to report regarding the present study.
1. A. A. Fuqaha, M. Guizani, M. Mohammadi, M. Aledhari and M. Ayyash, “Internet of things: A survey on enabling technologies, protocols, and applications,” IEEE Communications Surveys & Tutorials, vol. 17, no. 4, pp. 2347–2376, 2015. [Google Scholar]
2. M. A. Garadi, A. Mohammed, A. K. Ali, X. Du, I. Ali et al., “A survey of machine and deep learning methods for internet of things (IoT) security,” IEEE Communications Surveys & Tutorials, vol. 22, no. 3, pp. 1646–1685, 2020. [Google Scholar]
3. A. A. AlZubi, A. Alarifi, M. Al-Maitah and O. Alheyasat, “Multi-sensor information fusion for internet of things assisted automated guided vehicles in smart city,” Sustainable Cities and Society, vol. 25, pp. 12017–12029, 2020. [Google Scholar]
4. J. Gojal, E. Monteiro and J. S. Silva, “Security for the internet of things: A survey of existing protocols and open research issues,” IEEE Communications Surveys & Tutorials, vol. 17, no. 3, pp. 1294–1312, 2015. [Google Scholar]
5. K. Tange, M. D. Donno, X. Fafoutis and N. Dragoni, “A systematic survey of industrial internet of things security: Requirements and foq computing opportunities,” IEEE Communications Surveys & Tutorials, vol. 22, no. 4, pp. 2489–2520, 2020. [Google Scholar]
6. S. Bashir, M. H. Alsharif, I. Khan, M. A. Albreem, A. Sali et al., “MIMO-Terahertz in 6G nano-communications: Channel modeling and analysis,” Computers, Materials & Continua, vol. 66, no. 1, pp. 263–274, 2020. [Google Scholar]
7. Q. Alsafasfeh, O. A. Saraereh, A. Ali, L. A. Tarawneh, I. Khan et al., “Efficient power control framework for small-cell heterogeneous networks,” Sensors, vol. 20, no. 5, pp. 1–14, 2020. [Google Scholar]
8. K. M. Awan, M. Nadeem, A. S. Sadiq, A. Alghushami, I. Khan et al., “Smart handoff technique for internet of vehicles communication using dynamic edge-backup node,” Electronics, vol. 9, no. 3, pp. 1–17, 2020. [Google Scholar]
9. W. Shahjehan, S. Bashir, S. L. Mohammed, A. B. Fakhri, A. A. Isaiah et al., “Efficient modulation scheme for intermediate relay-aided IoT networks,” Applied Sciences, vol. 10, no. 6, pp. 1–12, 2020. [Google Scholar]
10. B. M. Lee, M. Patil, P. Hunt and I. Khan, “An easy network onboarding scheme for internet of things network,” IEEE Access, vol. 7, pp. 8763–8772, 2018. [Google Scholar]
11. O. A. Saraereh, A. Alsaraira, I. Khan and B. J. Choi, “A hybrid energy harvesting design for on-body internet-of-things (IoT) networks,” Sensors, vol. 20, no. 2, pp. 1–14, 2020. [Google Scholar]
12. A. A. AlZubi, A. Alarifi and M. Al-Maitah, “Deep brain simulation wearable IoT sensor device based Parkinson brain disorder detection using heuristic tubu optimized sequence modular neural network,” Measurement, vol. 161, pp. 1–15, 2020. [Google Scholar]
13. N. Murokawa, Y. Ida, T. Mastumoto and S. Mastufuji, “Cr-qrm-mld for sd-sm hybrid mimo systems,” Transactions on Emerging Telecommunications Technologies, vol. 31, no. 8, pp. 1–19, 2020. [Google Scholar]
14. I. Shubhi and H. Murata, “A signal selection scheme for qrm-mld on mu-mimo with user collaboration,” in IEEE Int. Symp. on Wireless Communication Systems (ISWCS), Brussels, Belgium, pp. 596–600, 2015. [Google Scholar]
15. A. A. Nimrat, M. Smadi, O. A. Saraereh and I. Khan, “An efficient channel estimation scheme for mmWave massive mimo systems,” in IEEE Int. Conf. on Communications, Networks and Satellite (Comnetsat), Makassar, Indonesia, pp. 1–8, 2019. [Google Scholar]
16. S. Tanabe, A. D. Shigyo and K. Ishibashi, “Not-so-large mimo signal detection based on damped qr-decomposed belief propagation,” in IEEE Int. Symp. on Information Theory and Its Applications (ISITA), Monterey, Canada, pp. 463–467, 2016. [Google Scholar]
17. A. A. AlZubi, “An optimal sensor placement algorithm (O-SPA) for improving tracking precision of human activity in real-world healthcare systems,” Computer Communications, vol. 148, no. 8, pp. 98–105, 2019. [Google Scholar]
18. S. J. Choi, S. J. Shim, Y. H. You, J. Cha and H. K. Song, “Novel mimo detection with improved complexity for near-ML detection in mimo-ofdm systems,” IEEE Access, vol. 7, pp. 60389–60398, 2019. [Google Scholar]
19. M. S. Maharajan and T. Abirami, “Energy efficient qos aware cluster based multihop routing protocol for wsn,” Computer Systems Science and Engineering, vol. 41, no. 3, pp. 1173–1189, 2022. [Google Scholar]
20. Z. Sun, H. Wang, B. Liu, C. Li and X. Pan, “CS-FCDA: A compressed sensing-based on fault-tolerent data aggregation in sensor networks,” Sensors, vol. 18, no. 11, pp. 1–15, 2018. [Google Scholar]
21. L. Chong, W. Feng and S. Jun, “Efficient measurement generation and pervasive sparsity for compressive data gathering,” IEEE Transactions on Wireless Communications, vol. 9, no. 12, pp. 3728–3738, 2010. [Google Scholar]
22. D. Kim, J. Yun and D. Kim, “An energy-efficient secure forwarding scheme for qos guarantee in wireless sensor networks,” Electronics Journal, vol. 9, no. 9, pp. 1–14, 2020. [Google Scholar]
23. J. Chen, J. Jia, Y. Deng, X. Wang and A. Aghvami, “Adaptive compressive sensing and data recovery for periodical monitoring wireless sensor networks,” Sensors Journal, vol. 18, no. 10, pp. 1–18, 2018. [Google Scholar]
24. J. A. Tropp and A. Gilbert, “Signal recovery from random measurements via orthogonal matching pursuit,” IEEE Transactions on Information Theory, vol. 53, no. 12, pp. 4655–4666, 2007. [Google Scholar]
25. M. Youssef, A. Youssef and M. Younis, “Overlapping multihop clustering for wireless sensor networks,” IEEE Transactions on Parallel and Distributed Systems, vol. 20, no. 12, pp. 1844–1856, 2009. [Google Scholar]
26. S. Soro and W. Heinzelman, “Cluster head election techniques for coverage preservation in wireless sensor networks,” Ad Hoc Networks, vol. 7, no. 5, pp. 955–972, 2009. [Google Scholar]
27. X. Ruitao and J. Xiaohua, “Transmission-efficient clustering method for wireless sensor networks using compressive sensing,” IEEE Transactions on Parallel and Distributed Systems, vol. 25, no. 3, pp. 806–815, 2014. [Google Scholar]
28. Y. Song, Z. Liu, X. He and H. Jiang, “Research on data fusion scheme for wireless sensor networks with combined improved leach and compressed sensing,” Sensors Journal, vol. 19, no. 21, pp. 1–21, 2019. [Google Scholar]
29. G. Sahar, K. Bakar, S. Rahim, N. Khani and T. Bibi, “Recent advancement of data-driven models in wireless sensor networks: A survey,” Technologies, vol. 9, no. 4, pp. 1–17, 2021. [Google Scholar]
30. N. Naji, M. Abid, D. Benhaddou and N. Krami, “Context-aware wireless sensor networks for smart building energy management system,” Information Journal, vol. 11, no. 11, pp. 1–14, 2020. [Google Scholar]
31. X. Dong, L. Cheng, G. Zheng and T. Wang, “Deployment cost minimization for composite event detection in large-scale heterogeneous wireless sensor networks,” International Journal of Distributed Sensor Networks, vol. 13, no. 6, pp. 972–981, 2017. [Google Scholar]
32. V. Rajpoot, V. Tiwari, A. Saxena, P. Chaturvedi, D. Rajput et al., “RSS-Based selective clustering technique using master node for wsn,” Computers, Materials & Continua, vol. 69, no. 3, pp. 3917–3930, 2021. [Google Scholar]
33. D. Donoho, A. Maleka and A. Montanari, “The noise-sensitivity phase transition in compressed sensing,” IEEE Transactions on Information Theory, vol. 57, no. 10, pp. 6920–6941, 2011. [Google Scholar]
34. C. Liang, B. Shanmugan, S. Azam, A. Karim, A. Islam et al., “Intrusion detection system for the internet of things based on blockchain and multi-agent systems,” Electronics, vol. 9, no. 7, pp. 1–18, 2020. [Google Scholar]
35. F. Salahdine, N. Kaabouch and H. Ghazi, “A survey on compressive sensing techniques for cognitive radio networks,” Physical Communications, vol. 20, no. 7, pp. 61–73, 2016. [Google Scholar]
36. K. Yi, J. Wan, T. Bao and L. Yao, “A dct regularized matrix completion algorithm for energy efficient data gathering in wireless sensor networks,” International Journal of Distributed Sensor Networks, vol. 11, no. 7, pp. 627–635, 2015. [Google Scholar]
37. O. Alfarraj, A. AlZubi and A. Tolba, “Trust-based neighbor selection using activation function for secure routing in wireless sensor networks,” Journal of Ambient Intelligence and Humanized Computing, vol. 8, no. 3, pp. 963–971, 2018. [Google Scholar]
38. Q. Sun, G. Cheng, X. Wang, J. Xu, L. Wang et al., “Energy-efficient routing algorithm based on small-world characteristics,” Computers, Materials & Continua, vol. 69, no. 2, pp. 2749–2759, 2021. [Google Scholar]
39. M. R. Ghaderi, V. T. Vakili and M. Sheikhan, “Compressive sensing-based energy consumption model for data gathering techniques in wireless sensor networks,” Telecommunications Systems, vol. 77, pp. 83–108, 2021. [Google Scholar]
40. A. K. Dutta, S. Srinivasan, B. Rao, B. Hemalatha, I. Pustokhina et al., “Design of qos aware routing protocol for iot assisted clustered wsn,” Computers, Materials & Continua, vol. 71, no. 2, pp. 3785–3801, 2022. [Google Scholar]
41. D. Anuradha, R. Srivasan, T. A. Kumar, J. Banu, A. Pundir et al., “Energy aware seagull optimization-based unequal technique in wsn communication,” Intelligent Automation & Soft Computing, vol. 32, no. 3, pp. 1325–1341, 2022. [Google Scholar]
42. M. Leinonen, M. Codreanu and M. Juntti, “Distributed distortion-rate optimized compressed sensing in wireless sensor networks,” IEEE Transactions on Communications, vol. 66, no. 4, pp. 1609–1623, 2018. [Google Scholar]
43. Z. Liu, Y. Han and X. Yang, “A compressive sensing-based adaptable secure data collection scheme for distributed wireless sensor networks,” International Journal of Distributed Sensor Networks, vol. 15, no. 6, pp. 2561–2573, 2019. [Google Scholar]
 | This work is licensed under a Creative Commons Attribution 4.0 International License, which permits unrestricted use, distribution, and reproduction in any medium, provided the original work is properly cited. |