DOI:10.32604/cmc.2022.023387
| Computers, Materials & Continua DOI:10.32604/cmc.2022.023387 | |
| Article |
Medical Image Analysis Using Deep Learning and Distribution Pattern Matching Algorithm
1Institute of Informatics and Computing in Energy, Universiti Tenaga Nasional, Malaysia
2Department of Computer Science, Dijlah University Collage, Baghdad, 10021, Iraq
3Biomedical Informatics College, University of Information Technology and Communications, Baghdad, Iraq
4Faculty of Information Technology, Duy Tan University, Da Nang, 550000, Viet Nam
5Graduate School, Duy Tan University, Da Nang, 550000, Viet Nam
6Department of Computer Science, Al-turath University College, Baghdad, Iraq
*Corresponding Author: Mustafa Musa Jaber. Email: Mustafa.musa@duc.edu.iq
Received: 06 September 2021; Accepted: 31 December 2021
Abstract: Artificial intelligence plays an essential role in the medical and health industries. Deep convolution networks offer valuable services and help create automated systems to perform medical image analysis. However, convolution networks examine medical images effectively; such systems require high computational complexity when recognizing the same disease-affected region. Therefore, an optimized deep convolution network is utilized for analyzing disease-affected regions in this work. Different disease-related medical images are selected and examined pixel by pixel; this analysis uses the gray wolf optimized deep learning network. This method identifies affected pixels by the gray wolf hunting process. The convolution network uses an automatic learning function that predicts the disease affected by previous imaging analysis. The optimized algorithm-based selected regions are further examined using the distribution pattern-matching rule. The pattern-matching process recognizes the disease effectively, and the system's efficiency is evaluated using the MATLAB implementation process. This process ensures high accuracy of up to 99.02% to 99.37% and reduces computational complexity.
Keywords: Artificial intelligence; medical field; gray wolf-optimized deep convolution networks; distribution pattern-matching rule
Medical image computing (MIC) [1–3] is interdisciplinary research widely utilized in different computing fields, such as medicine, information engineering, and computer science. MIC analysis helps resolve computational problems during medical image analysis and aids in performing biomedical research. MIC involves examining medical images using image registration, segmentation, and physiological modeling to reveal relevant clinical information [4]. MIC uses different sampled data typically represented in the x-y-z spatial spacing. The imaging process may use different images, such as computed tomography (CT) and magnetic resonance imaging (MRI), collected in various forms. For example, CT images are collected based onradiodensity values, while MRI images are collected in the form of T1 or T2 weighted images [5]. In addition, data modalities, such as curved-array ultrasound, are applied to obtain tetrahedral and hexahedral images. These medical images are utilized to perform progressive biomechanical analyses, such as bone implants, vascular transport, and tissue deformations [6].
Medical imaging helps address the structural fusion and quantification problem while analyzing physical and anatomical processes. From the medical research roadmap, the virtual physiological human framework [7] uses the medical imaging concept to investigate the human body's complex systems. As discussed earlier, this medical imaging model analyzes and explores the regulatory networks of genes, integrative cell functions, protein pathways, and organ tissue details [8]. Then, medical imaging processes, such as MRI and ultrasound, based on earlier disease analysis processes help avoid surgical intervention [9]. MIC recognizes different diseases, including brain injuries, internal bleeding, cancer, and pneumonia. During such analysis, an automatic system is created by applying image processing and artificial intelligence (AI) techniques [10,11]. These techniques have several frameworks that examine a medical image pixel by pixel to predict changes. Conventional machine learning algorithms [12] depend entirely on the crafted features of medical experts; they are labor-intensive processes that require medical experts to analyze images.
Moreover, the k-nearest neighbors, support vector machine (SVM), logistic regression, and decision tree algorithms [13,14] directly process raw medical images without any hidden learning representations. The entire process requires a long computation time. Researchers are turning to medical imaging as an important component of the medical research plan to improve the understanding of the human body as a complex system. Simultaneously, they analyze physical and anatomical processes and medical imaging aids in structural fusion and quantification.
A deep learning algorithm [15] is a more special concept in medical imaging computation because it can analyze and develop hidden representations and derive features from medical images effectively. A deep learning technique provides various solutions to different health problems, making treatment-related suggestions. Different types of deep learning models [16] include convolution networks, recurrent networks, long short-term memory, and generative adversarial networks (GANs), which have been proposed to handle clinical data. A convolution network is utilized to analyze radiological images to generate good clinical information in the current work. Although these methods provide insufficient valuable data while examining the affected region, their computational complexity increases when patients experience certain symptoms. An optimized deep convolution network is applied to examine medical images to overcome the computation above difficulty in the current work. Here, tumor-related medical images are utilized to predict tumor regions. This system uses the gray wolf hunting process [17] to predict the tumor-affected region [18]. The convolution network uses an automatic learning function that shows the disease affected by a previous imaging analysis [19]. The selected areas are further examined using a distribution pattern matching rule [20]. The proposed system uses a MATLAB simulation to ensure a minimum error rate and high medical imaging analysis accuracy [21].
The major contributions of our study can be summarized as follows:
• To improve tumor region prediction accuracy with a minimum error rate,
• To minimize computational complexity while examining image patterns, and
• To maximize disease detection accuracy by applying automatic feature learning functions.
The remainder of this paper is organized as follows. Section 2 discusses the opinions of various researchers regarding medical imaging analysis. Section 3 analyzes the working process of an optimized deep learning algorithm-based medical image analysis. The system's efficiency is evaluated in Section 4. The conclusions drawn from this work are summarized in Section 5.
Fourcade et al. [22] analyzed the importance of convolution neural network techniques in medical imaging. The process investigated how effectively deep learning visually diagnoses a disease. During the analysis, approximately 352 articles from the PubMed database were examined. In these articles, most researchers used a convolutional neural network (CNN) in network training. This previous study clearly showed that GoogleNet and AlexNet were widely utilized in performing medical image analysis. Alom et al. [23] developed a medical image segmentation system by applying U-Net. U-Net was operated by a recurrent, residual CNN (RRCNN). Lung medical images were initially collected, and residual units were applied to train the deep network. Then, a recurrent convolution layer was applied to extract the features related to the segmentation process. Finally, U-net architecture was used to segment the disease-affected region. The system's efficiency was evaluated using the lung lesion, skin cancer, and blood vessel segmentation benchmark dataset. Zheng et al. [24] applied the 3D deep learning concept to detect the robust landmark from volumetric data. The collected images were examined continuously, and Haar features were extracted and processed further using a deep learning network. This strategy resolved the issues of data overfitting and computation time while analyzing multi-resolution images. The system's efficiency was determined using a CT dataset that consisted of 455 patient details. The introduced system resolved the issues with a minimum error rate and maximum detection accuracy.
Feng et al. [25] developed a medical image analysis system using a genetic optimized backpropagation neural network (GBNN). The proposed system utilized the optimized segmentation algorithm to resolve background extraction complexity and minimize the loss part of boundary details. The trained genetic network processed the medical images, deriving the image features by the threshold value. Characteristics that identified the affected region with a minimum error rate were further examined. Anwar et al. [26] reviewed the medical image analysis process that used CNNs. The system aimed to improve clinical diagnosis accuracy by resolving the feature selection and calculation tasks. This process was achieved with the aid of the deep learning concept, which had been effectively applied to disease classification, abnormality detection, medical image analysis, and computer aide disease detection. This study developed an effective medical image analysis system that used GANs. This network utilized the probability density function to examine changes in features. The network processed the input by dividing the characteristics into testing and training samples. The GAN can resolve the overfitting problem and alleviate the data scarcity when analyzing medical images. The medical and health industries have benefited considerably from the use of AI. Deep convolution networks are important because they provide useful services and aid in developing an automated system for performing medical picture analysis. Convolution networks assess medical images effectively, and the system exhibits computational complexity when identifying the same disease-affected area. Yi et al. [27] performed GAN-based image synthesis. Here, brain MRI images were collected to complete the data augmentation and synthesis processes. The images were examined in terms of the leveraging approach for segmenting tumors. Then, the generative models were applied to the anonymization process. This process effectively identified the pathological findings of small incidence. Liu et al. [28] developed federated semi-supervised learning to learn a federated model using labeled and unlabeled customer data (i.e., hospitals). The proposed learning system explicitly connected learning to labeled and unlabeled customers by aligning their relationships with an extracted disease, mitigating the lack of task knowledge for unlabeled customers, and promoting discrimination against unlabeled customers. Their proposed method was validated on two large-scale clustering datasets.
Considering the preceding overall analysis, medical imaging analysis plays an essential role in diagnosing diseases. Although deep learning models effectively analyze diseases, their computational complexity is high when segmenting the tumor-affected region. To overcome this issue, and optimized deep learning model and pattern recognition algorithm were utilized in the current work to identify the disease-affected region with minimum complexity. The detailed working process is explained in the succeeding section.
3 Medical Image Pattern Analysis
This section explains medical image pattern analysis using a pattern matching algorithm's optimized deep learning network. This system utilizes various medical images, such as the brain, breasts, and lungs, and CT and MRI images are related for further clinical analysis. The collected medical radiological images are examined using image processing steps, such as preprocessing and segmentation. The segmented locations are further evaluated to analyze disease-related patterns. This pattern matching process successfully identifies normal and tumor-affected regions. The working process of medical image pattern analysis is illustrated in Fig. 1.

Figure 1: Medical image pattern analysis structure
Fig. 1 illustrates the medical image pattern analysis structure consisting of image preprocessing and segmentation steps. The preprocessing step collects medical images by filtering to eliminate unwanted information from a radiological image. Then, the disease-affected regions are analyzed pixel by pixel by using a convolution layer [29]. The segmented regions are further evaluated using a distribution pattern-matching rule that effectively detects diseases. The detailed working process of medical image pattern analysis is discussed in the subsequent section.
The first step of this work is noise removal. Clinical, radiological images are examined to eliminate unwanted details in this step. This preprocessing step helps preserve important features from CT and MRI images. Most medical images are influenced by Gaussian noise, which minimizes overall clinical analysis accuracy. Therefore, the noise present in the images is eliminated by applying an adaptive filtering technique that effectively eliminates noise without reducing the quality of the image. In addition, the algorithm manages the image edges, inner details, and highly informative parts. The noise removal process is performed by applying Eq. (1).
From Eq. (1), the noise involved in a medical image is denoted as
Condition 1: The image pixel values have
Condition 2: The high local variance related pixel values are maintained when the image has
Condition 3: The arithmetic mean value (
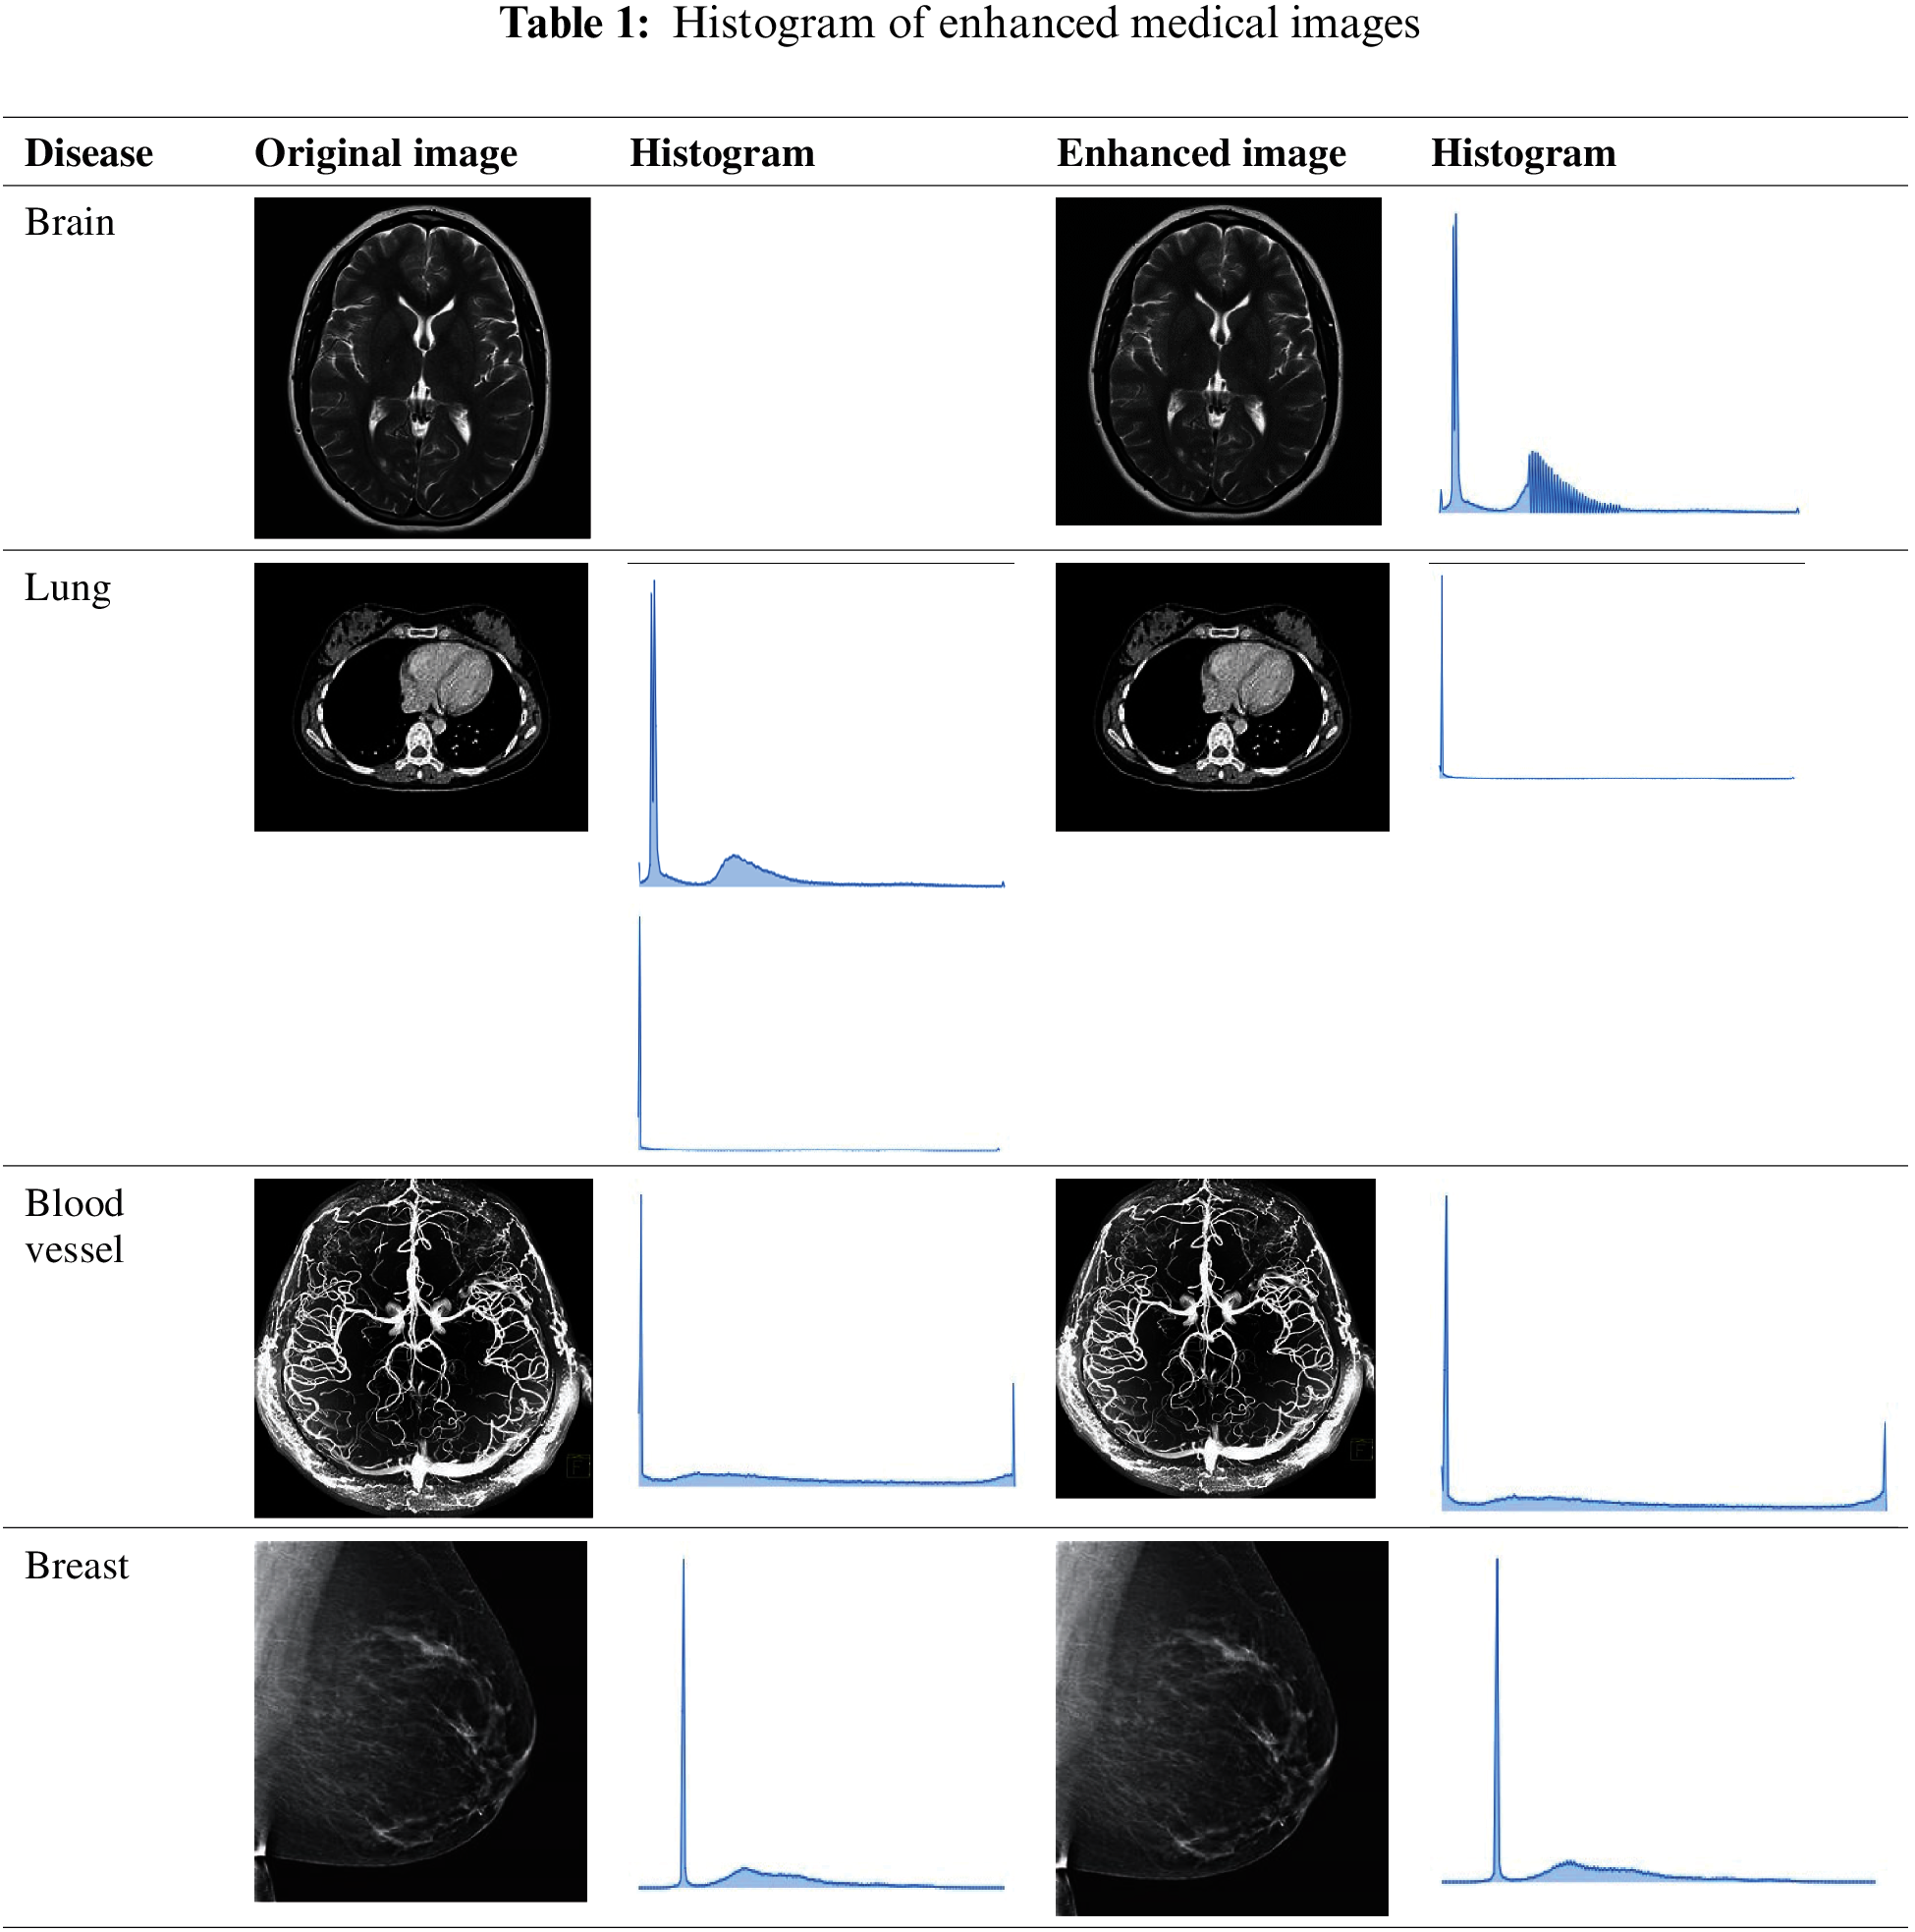
These conditions help maintain the important edges, lines, and disease-related biomarker information. After eliminating noise from the image, image quality is enhanced to improve the clinical diagnosis process. Here, the histogram equalization process is applied to improve the quality of radiological images. The adaptive histogram approach examines medical images pixel by pixel and enhances image quality by adopting the redistribution of lightness process. Then, image quality is enhanced by eliminating the noise, adding the new voxel row, and subtracting the left row. This image histogram equalization process reduces the computational complexity of the entire medical image pattern analysis from
Tab. 1 presents the quality-enhanced sample medical images and the original images with their respective histogram values. After performing the histogram equalization process, the disease-affected region must be examined to make clinical decisions.
The second stage is image segmentation [26], in which meaningful regions are extracted from the noise-removed medical images. Here, an optimized deep CNN is utilized to perform the region segmentation process. The segmentation technique extracts the affected region by examining an image's spatial details. This process is achieved in three steps, i.e., by an encoder, U-net, and decoder. The working process of image segmentation is illustrated in Fig. 2.

Figure 2: Convolution network-based image segmentation
The convolution network extracts the affected region from the collected medical images shown in Fig. 2. The convolution network has small and large kernels for extracting local and global information. Different convolution kernels lead to difficulties when segmenting regions. Therefore, three convolution layers, namely, 1 * 1, 3 * 3, and 5 * 5, are used in the current work to identify disease-affected region-related features. As discussed earlier, the image enhancement process reduces computational complexity.
Furthermore, computation is minimized using asymmetric convolution kernels. This process decomposes 2D (N * N) convolution into two 1D convolutions (1 * N and N * 1) [30]. The convolution receptive field expands after decomposing the images with the kernel without maximizing parameter size. Here, parameters 2 and 4 are utilized as expansion coefficients. The convolution layer generally has 3 * 3 receptive fields, but parameter sizes remain unchanged due to the dilated convolution. Therefore, the receptive fields of the convolution kernel utilized in this work are 7 * 7 and 15 * 15. The defined receptive field and convolution layer expansion coefficients help identify pathological regions from the quality-enhanced medical images. After that, the cascading process should be performed from different convolution layers, achieved using 3 * 3. Here, 16 channels are utilized while reduced feature maps are connected with the maximum pooling layer. Then, batch normalization is performed with the rectified linear unit (ReLu) layer using the activation function to estimate the affected region.
Then U-Net architecture is utilized to examine the region parts. This architecture consists of two phases: the contractile encoder (processes the incoming medical images) and the decoder part (produces the output value). Finally, the skip connection cascades the features obtained from the deconvolution operations of the encoder blocks. By the discussion, the structure of the U-Net architecture model is illustrated in Fig. 3.

Figure 3: U-Net model
As shown in Fig. 3, the U-net model has 28 convolution layers, and among which 24 convolution layers are spread over the 4 convolution and deconvolution blocks. Every convolution block has 2 convolution layers with a 3 * 3 convolution kernel. During this process, the step size is 1; it undergoes batch normalization with the ReLu layer to enhance network performance. The utilized activation function has a learning capability that plays an essential role in feature decoupling. Here, Step 2 is utilized with a 2 * 2 convolution kernel to perform the maximum pooling process. In this process, feature graph size is reduced iteratively from 128 * 128 layers to 8 * 8 layers. Then, the last deconvolution block retrieves the features from the input medical image. The deconvolution operations-based extracted features are cascaded with a 3 * 3 convolution kernel. Then, the final output is obtained using Eq. (2).
where the input and output images are denoted as
The convolution kernel, which has 3 * 3 layers, is represented as F.
Fill size, which has a 1 * 1 layer, is computed as P. S denotes the step size equal to 1.
The computed output is estimated from the sigmoid activation function. This value belongs to the pixel value distribution varied from 0 and 1. The lesion area is distributed throughout the part once any tumor affects the patient. Therefore, the output obtained from the probability distribution value and the pixel belonging to this probability value is considered the affected region.
Finally, the decoder part is applied to upsample the feature graph. The decoder process has one convolution layer and one deconvolution layer. Both layers have ReLu and undergo batch normalization, effectively targeting the affected region using the softmax classifier. During the region segmentation process [27], the loss function that reduces tumor detection accuracy may occur. Then, the loss function is minimized by selecting the optimized parameter utilized in the convolution network. Here, the gray wolf algorithm is utilized to select the best parameters. This algorithm is one of the metaheuristic optimization algorithms that work by the hunting behavior and social structure of gray wolves. Gray wolves live in a group with a leader accountable for the sleeping and hunting processes. The alpha wolf makes the hunting decision with the help of the beta wolf and, finally, the omega wolf, which helps collect the hunting information provided to the other wolves [31]. These three wolves operate based on chasing prey for tracking, pursuing and encircling prey, and attacking prey. These three gray wolves are defined using Eq. (3).
In Eq. (3), the target value distance vector is denoted as
In Eqs. (3)–(5), A and B denote the coefficient vector.
The target value position vector is denoted as
The last step in this work is to perform the pattern-matching process by applying the distribution pattern-matching rule. The segmented tumor-related regions are applied to the pattern-matching process to identify the abnormal region-related patterns. A database is constructed from a previous medical image analysis performed in convolution networks for this process. This pattern-matching process extracts the exact tumor-related region by medical characteristics. Here, different features, such as similarity expressions, medical data concentration, and medical data dispersion values, are analyzed to identify the exact patterns.
The score value is computed from the extracted segmented region's related pixels a and
In addition, medical data concentration must be computed through the pixel degree value [32]. If the pixel value is closed toward the center value, the center value is estimated using the median value. After that, medical data dispersion is computed via the statistical description of the extracted region. Quartile range, variance, standard deviation, mean difference, and dispersion coefficients are extracted from the region. The derived details are stored as a template in the database. If this information matches existing information, it is considered tumor-related regions. Thus, the optimized convolution network-based extracted medical regions can derive the tumor region more accurately. The system's efficiency is evaluated using the simulation results [33].
This section discusses the excellent performance of the optimized deep convolution network with the distribution pattern-matching rule (ODCNDPM) algorithm-based medical image analysis process. This work uses different medical images to examine the efficiency of the medical image pattern analysis process. Here, two datasets, namely, the Alzheimer's Disease Neuroimaging Initiative (ADNI) [27] and the ELCAP Public Lung Image Database [28], are utilized to determine the efficiency of the system. The ADNI dataset has 100 brain MRI images utilized to extract the hippocampal regions effectively. The lung dataset consists of 50 low-dose documented lung CT images. The CT scans cover nearly 1.25 mm slice thickness, which helps locate the radiologist's nodules [29]. The discussions present the samples of Alzheimer's disease and lung images in Figs. 4a and 4b.
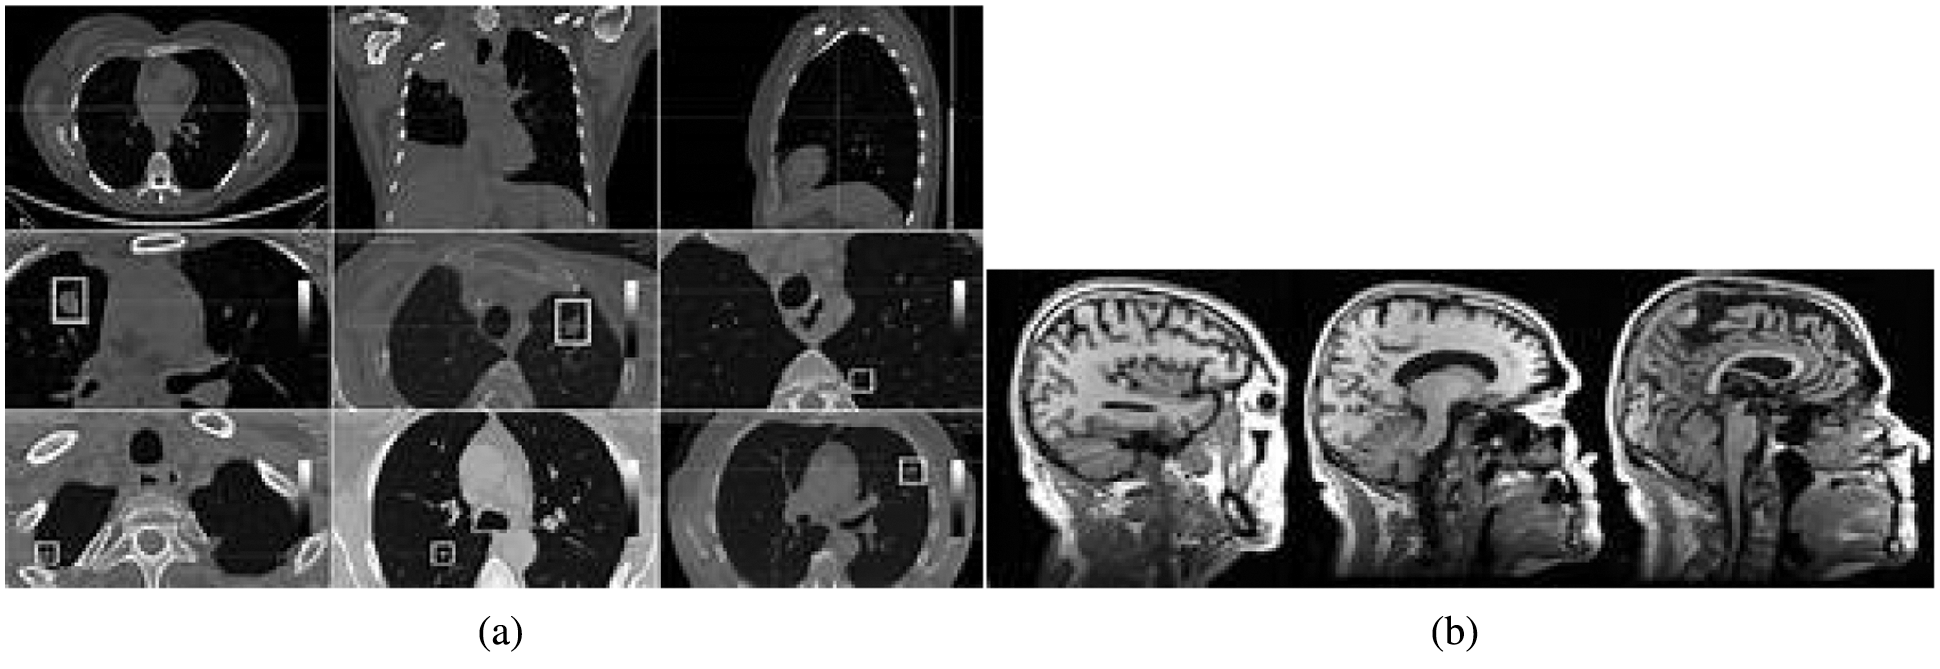
Figure 4: Sample medical images. (a) ADNI dataset (b) ELCAP public lung image database
From Fig. 4, we can gather any medical images to examine the tumor-affected region. In particular, 80% of the data from the collected regions are utilized for training, and 20% are used for testing. After gathering the medical images, they are processed through the steps above, and the methods are implemented using the uniform platform [34]. Here, NVIDIA GTX1060Ti, Intel i7 Core processors, and MATLAB are utilized to develop the system. A learning rate of 0.001, a batch size of 8, and L2 regularizations of 0.0001 are utilized to segment the affected region during the implementation process. The excellence of the defined system is evaluated using the Dice similarity coefficient (DSC), the predictive positivity value (PPV), and sensitivity metrics. These metrics are used to examine the efficiency of the medical image segmentation process. The values are computed as follows:
where T is denoted as the ground truth region, P is the segmented region that uses the defined algorithm, and
These metrics are used to analyze the medical images in both datasets. This part creates a medical picture classification algorithm using a weight initialization/sliding window fusion CNN based on the previously presented information (Fig. 5). First, a method for CNN weight initialization is developed, enhancing the model's convergence and generalizability while preventing issues, such as gradients in the CNN caused by weight initialization issues [35]. The obtained values for the ADNI dataset are provided in Tab. 2.

Figure 5: Flowchart for the classification algorithm

Tab. 2 depicts the performance analysis of the ODCNDPM algorithm on the ADNI dataset. The analysis clearly shows that the ODCNDPM method achieves high values on the three metrics: DSC, sensitivity, and PPV. The high values are obtained for different images, indicating that the introduced algorithm extracts meaningful regions from the brain MRI images. Similarly, the system's effectiveness is evaluated using the lung image dataset. The results are provided in Tab. 3.

The introduced algorithm ensures high results on the ELCAP Public Lung Image Database. By the analysis, a graphical illustration is provided in Figs. 6a and 6b.

Figure 6: Performance analysis in terms of efficiency (a) ADNI dataset (b) ELCAP public lung image database
Fig. 6 clearly illustrates that the ODCNDPM algorithm ensures high DSC, sensitivity, and PPV values. This method examines medical imaging pixels by using the 7 * 7 and 15 * 15 sizes of the receptive field of a convolution kernel. These kernels values effectively extract the pathological-related regions. In addition, receptive fields, feature mapping, and max pooling help extract the relation between each pixel [36]. The overall process effectively enhances the output region by

Figure 7: Performance analysis on the error rate (a) ADNI dataset (b) ELCAP public lung image database
Fig. 7 presents the minimum error rates of the ODCNDPM algorithm, such as the mean absolute and mean squared errors. The introduced method examines the incoming medical images using two different kernel values to obtain the output by applying different step sizes. During the output estimation process, parameters are selected based on the gray wolf hunting process defined in Eq. (3), and

Figure 8: Performance analysis on segmentation accuracy (a) ADNI dataset (b) ELCAP public lung image database
The introduced method ensures approximately 99.48% segmentation accuracy while segmenting the region from the medical analysis. By comparing the segmented region, the tumor-related patterns that use similarity expressions, medical data concentration, and medical data dispersion values are analyzed to identify the exact patterns. These characteristics help determine that the introduced method extracts the medical regions with maximum accuracy. Furthermore, the excellence of the system is compared with existing methodologies, such as RRCNN [20], the 3D deep learning concept (3DNN) [21,30], and GBNN [22,31]. Overall efficiency is examined with different diseases, and the obtained results are presented in Tab. 4.

From Tab. 4, the ODCNDPM method attains a high-efficiency value when analyzing different medical images [32,33]. Thus, the introduced system recognizes the tumor-affected region with 99% accuracy. The limitations of this study can be resolved by applying the optimized deep convolution technique that examines biomarker details [34,35]. The disease-affected region is effectively derived from the detected biomarker information by the automatic learning function.
This study presents the ODCNDPM algorithm-based medical image pattern analysis process. First, different medical images are collected and processed using an adaptive filtering technique. This technique eliminates Gaussian noise from the image without affecting biomarkers details. Thus, the quality of images is improved by computing the histogram value, which further analyzes the optimized convolution networks. This method uses various convolution layers and kernel values to analyze the pixels presented in the medical images. During this process, the gray wolf optimized algorithm selects the best feature that minimizes the error rate while segmenting the affected region. The extracted region's efficiency is determined using the distribution pattern-matching rule that nearly covers all the medical image characteristics, helping improve the overall medical image pattern analysis process. This process minimizes computational complexity and extracts accuracy of disease-affected regionswith up to 99%. Image processing in the future will involve monitoring the skies for extraterrestrial intelligent life. Image processing breakthroughs will be included in new intelligent digital species developed by researchers from various countries worldwide.
Funding Statement: The authors received no specific funding for this study.
Conflicts of Interest: The authors declare that they have no conflicts of interest to report regarding the present study.
1. L. Lu, Y. Zheng, G. Carneiro and L. Yang, “Deep learning and convolutional neural networks for medical image computing,” Advances in Computer Vision and Pattern Recognition, vol. 10, pp. 978–983, 2017. [Google Scholar]
2. H. Zhang, Z. Gao, L. Xu, X. Yu, K. Wong et al., “A meshfree representation for cardiac medical image computing,” IEEE Journal of Translational Engineering in Health and Medicine, vol. 6, pp. 1–12, 2018. [Google Scholar]
3. D. Nie, R. Trullo, J. Lian, C. Petitjean, S. Ruan et al., “Medical image synthesis with context-aware generative adversarial networks,” in Int. Conf. on Medical Image Computing and Computer-Assisted Intervention, Quebec City, Canada, pp. 417–425, 2017. [Google Scholar]
4. M. Gheisari, H. Najafabadi, A. Alzubi, J. Gao, G. Wang et al., “OBPP: An ontology-based framework for privacy-preserving in IoT-based smart city,” Future Generation Computer Systems, vol. 123, no. 10, pp. 1–13, 2021. [Google Scholar]
5. M. Abdel-Basset, G. Manogaran, D. El-Shahat and S. Mirjalili, “A hybrid whale optimization algorithm based on local search strategy for the permutation flow shop scheduling problem,” Future Generation Computer Systems, vol. 85, pp. 129–145, 2018. [Google Scholar]
6. H. Liu, N. Nguyen, T. Pham and H. Yeh, “A Maximum-weight-independent-set-based algorithm for reader-coverage collision avoidance arrangement in RFID networks,” IEEE Sensors Journal, vol. 16, no. 5, pp. 1342–1350, 2015. [Google Scholar]
7. M. Kuthadi, R. Selvaraj, S. Baskar, M. Shakeel and A. Ranjan, “Optimized energy management model on data distributing framework of wireless sensor network in IoT system,” Wireless Personal Communications, pp. 1–27, 2021. https://doi.org/10.1007/s11277-021-08583-0. [Google Scholar]
8. D. Shen, W. Guorong and H. Suk, “Deep learning in medical image analysis,” Annual Review of Biomedical Engineering, vol. 19, pp. 221–248, 2017. [Google Scholar]
9. M. Rubessa, K. Polkoff, M. Bionaz, E. Monaco, D. Milner et al., “Use of pig as a model for mesenchymal stem cell therapies for bone regeneration,” Animal Biotechnology, vol. 28, no. 4, pp. 275–287, 2017. [Google Scholar]
10. N. Wilson, K. Wang, R. Duttonand and C. Taylor, “A software framework for creating patient-specific geometric models from medical imaging data for simulation-based medical planning of vascular surgery,” in Proc. of Int. Conf. on Medical Image Computing and Computer-Assisted Intervention, Berlin, Gemany, pp. 449–456, 2001. [Google Scholar]
11. G. Iacono, R. Badosa and H. Heyn, “Single-cell transcriptomics unveils gene regulatory network plasticity,” Genome Biology, vol. 20, no. 1, pp. 1–20, 2019. [Google Scholar]
12. F. Alam, S. Rahman, S. Ullah and K. Gulati, “Medical image registration in image-guided surgery: Issues, challenges, and research opportunities,” Biocybernetics and Biomedical Engineering, vol. 38, no. 1, pp. 71–89, 2018. [Google Scholar]
13. J. Gao, H. Wang and H. Shen, “Smartly handling renewable energy instability in supporting a cloud datacenter,” in 2020 IEEE Int. Parallel and Distributed Processing Symposium (IPDPS), New Orleans, USA, pp. 769–778, 2020. [Google Scholar]
14. M. Abdel-Basset, G. Manogaran, A. Gamal and F. Smarandache, “A group decision-making framework based on neutrosophic TOPSIS approach for smart medical device selection,” Journal of Medical Systems, vol. 43, no. 2, 2019. https://doi.org/10.1007/s10916-019-1156-1. [Google Scholar]
15. T. Le, W. Wang, H. Le, C. Wang and T. Nguyen, “Fingerprint enhancement based on the tensor of wavelet subbands for classification,” IEEE Access, vol. 8, pp. 6602–6615, 2020. [Google Scholar]
16. P. MeenaakshiSundhari, L. Murali, S. Baskar and M. Shakeel, “MDRP: Message dissemination with re-route planning method for emergency vehicle information exchange,” Peer-to-Peer Networking and Applications, vol. 14, pp. 2285–22941, 2021. [Google Scholar]
17. G. Carneiro, Y. Zheng, F. Xing and L. Yang, “Review of deep learning methods in mammography, cardiovascular, and microscopy image analysis,” in Deep Learning and Convolutional Neural Networks for Medical Image Computing, Cham: Springer, pp. 11–32, 2017. [Google Scholar]
18. M. Mohammed, K. Abdulkareem, B. Zapirain, S. Mostafa, M. Maashi et al., “A comprehensive investigation of machine learning feature extraction and classification methods for automated diagnosis of covid-19 based on x-ray images,” Computers, Materials & Continua, vol. 66, no. 3, pp. 3289–3310, 2021. [Google Scholar]
19. J. Ker, L. Wang, J. Rao and T. Lim, “Deep learning applications in medical image analysis,” IEEE Access, vol. 6, pp. 9375–9389, 2017. [Google Scholar]
20. Z. Teng, J. Lv and L. Guo, “An improved hybrid grey wolf optimization algorithm,” Soft Computing, vol. 23, no. 15, pp. 6617–6631, 2019. [Google Scholar]
21. A. Fard, M. Nisar, L. Ramaswamy, J. Millerand and M. Saltz, “A distributed vertex-centric approach for pattern matching in massive graphs,” in Proc. of IEEE Int. Conf. on Big Data, Silicon Valley, USA, pp. 403–411, 2013. [Google Scholar]
22. A. Fourcade and R. Khonsari, “Deep learning in medical image analysis: The third eye for doctors,” Journal of Stomatology, Oral and Maxillofacial Surgery, vol. 120, no. 4, pp. 279–288, 2019. [Google Scholar]
23. M. Z. Alom, C. Yakopcic, M. Hasan, T. M. Taha and V. K. Asari, “Recurrent, residual U-Net for medical image segmentation,” Journal of Medical Imaging, vol. 6, no. 1, pp. 014006, 2019. [Google Scholar]
24. Y. Zheng, D. Liu, B. Georgescu, H. Nguyenand and D. Comaniciu, “Robust landmark detection in volumetric data with efficient 3D deep learning,” Advances in Computer Vision and Pattern Recognition, pp. 49–61, 2017. https://doi.org/10.1007/978-3-319-42999-1_4. [Google Scholar]
25. Z. Feng and S. Peiyan, “Medical image segmentation based on GA optimized BP neural network,” Investigación Clínica, vol. 60, no. 1, pp. 233–240, 2019. [Google Scholar]
26. S. Anwar, M. Majid, A. Qayyum, M. Awais, M. Alnowami et al., “Medical image analysis using convolutional neural networks: A review,” Journal of Medical Systems, vol. 42, no. 11, pp. 226, 2018. [Google Scholar]
27. X. Yi, E. Walia and P. Babyn, “Generative adversarial network in medical imaging: A review,” Medical Image Analysis, vol. 58, pp. 101552, 2019. [Google Scholar]
28. Q. Liu, H. Yang, Q. Dou and A. Heng, “Federated Semi-supervised medical image classification via inter-client relation matching,” arXiv preprint arXiv:2106.08600. Computer Vision and Pattern Recognition (cs.CV). Computer Vision and Pattern Recognition (cs.CV). [Google Scholar]
29. H. Shin, N. Tenenholtz, J. Rogers, C. Schwarz, M. Senjem et al., “Medical image synthesis for data augmentation and anonymization using generative adversarial networks,” in Int. Workshop on Simulation and Synthesis in Medical Imaging, Granada, Spain, pp. 1–11, 2018. [Google Scholar]
30. I. Hussein, M. Burhanuddin, M. Mohammed, M. Elhoseny, B. Zapirain et al., “Fully automatic segmentation of gynecological abnormality using a new viola–jones model,” Computers, Materials & Continua, vol. 66, no. 3, pp. 3161–3182, 2021. [Google Scholar]
31. Alzheimer's Disease Neuroimaging Initiative, 2021. (Accessed on 15th August 2021) [Online]. https://adni.loni.usc.edu/. [Google Scholar]
32. VIA/I-ELCAP Public Access Research Database, 2021. (Accessed on 15th August 2021) [Online]. http://www.via.cornell.edu/databases/lungdb.html. [Google Scholar]
33. J. Chen, S. Sun, N. Bao, Z. Zhu and L. Zhang, “Improved reconstruction for CS-based ECG acquisition on internet of medical things,” IEEE Sensors Journal, vol. 21, no. 22, 2021.https://doi.org/10.1109/JSEN.2021.3055635. [Google Scholar]
34. M. Soni, S. Gomathi, P. Kumar, P. Churi, M. Mohammed et al., “Hybridizing convolutional neural network for classification of lung diseases,” International Journal of Swarm Intelligence Research, vol. 13, no. 2, pp. 1–15, 2022. [Google Scholar]
35. A. Abdulsahib, M. Mahmoud, M. Mohammed, H. Rasheed, S. Mostafa et al., “Comprehensive review of retinal blood vessel segmentation and classification techniques: Intelligent solutions for green computing in medical images, current challenges, open issues, and knowledge gaps in fundus medical images,” Networking Model and Analysis in Health Informatics and Bioinformtics, vol. 10, no. 1, pp. 1–32, 2021. [Google Scholar]
36. M. Elhoseny, M. Mohammed, S. Mostafa, K. Abdulkareem, M. Maashi et al., “A new multi-agent feature wrapper machine learning approach for heart disease diagnosis,” Computers, Materials and Continua, vol. 67, pp. 51–71, 2021. [Google Scholar]
 | This work is licensed under a Creative Commons Attribution 4.0 International License, which permits unrestricted use, distribution, and reproduction in any medium, provided the original work is properly cited. |