DOI:10.32604/cmc.2022.024355
| Computers, Materials & Continua DOI:10.32604/cmc.2022.024355 | |
| Article |
Analysis and Assessment of Wind Energy Potential of Almukalla in Yemen
1Department of Electrical Engineering–Communication Engineering, Sana'a University, Yemen
2Department of Computer Science, King Khalid University, Muhayel, Aseer, Saudi Arabia
3Faculty of Computer and IT, Sana'a University, Sana'a, Yemen
4Department of Information Systems, King Khalid University, Muhayel, Aseer, Saudi Arabia
5Department of Computer and Self Development, Preparatory Year Deanship, Prince Sattam bin Abdulaziz University, AlKharj, Saudi Arabia
6Electronic Department, Faculty of Engineering, University of Science and Technology, Sana'a, Yemen
*Corresponding Author: Manar Ahmed Hamza. Email: ma.hamza@psau.edu.sa
Received: 14 October 2021; Accepted: 29 November 2021
Abstract: Energy is an essential element for any civilized country's social and economic development, but the use of fossil fuels and nonrenewable energy forms has many negative impacts on the environment and the ecosystem. The Republic of Yemen has very good potential to use renewable energy. Unfortunately, we find few studies on renewable wind energy in Yemen. Given the lack of a similar analysis for the coastal city, this research newly investigates wind energy's potential near the Almukalla area by analyzing wind characteristics. Thus, evaluation, model identification, determination of available energy density, computing the capacity factors for several wind turbines and calculation of wind energy were extracted at three heights of 15, 30, and 50 meters. Average wind speeds were obtained only for the currently available data of five recent years, 2005–2009. This study involves a preliminary assessment of Almukalla's wind energy potential to provide a primary base and useful insights for wind engineers and experts. This research aims to provide useful assessment of the potential of wind energy in Almukalla for developing wind energy and an efficient wind approach. The Weibull distribution shows a perfect approximation for estimating the intensity of Yemen's wind energy. Depending on both the Weibull model and the results of the annual wind speed data analysis for the study site in Mukalla, the capacity factor for many turbines was also calculated, and the best suitable turbine was selected. According to the International Wind Energy Rating criteria, Almukalla falls under Category 7, which is, rated “Superb” most of the year.
Keywords: Almukalla; energy potential; Rayleigh distribution; Weibull distribution; wind power density; wind speed
In any civilized country, energy is a basic element of social and economic development, and over the past several decades, demand for fossil fuels has increased, particularly with the increasing population, number of factories, and so on. In fact, global demand exceeds limited available resources, but the use of fossil fuels and other nonrenewable energy has many negative effects on the environment and our ecosystem [1,2]. The conflict that raged in the Republic of Yemen in early 2015 has had a devastating impact on its infrastructure. Energy supply shortages in Yemen escalated at the beginning of the conflict. Even so, energy supply had already been a major developmental dilemma that plagued Yemen for decades. Sana'a, Yemen's largest city of about two million, completely lacks an electricity network. As part of the second phase of Yemen's damage and needs assessment report, six of every ten cities surveyed in mid-2017 by the World Bank had no access to public electricity. In comparison, in the remaining four cities, electricity is available only a few hours a day. Fuel shortages and high prices caused a 77% drop in electricity generation from fuel in 2014 and 2015 [3,4]. In the same period, emissions of night lights from Yemen decreased by two-thirds. Critical infrastructure facilities, including hospitals, water wells, sewage treatment plants, banking systems, and telephone networks were severely affected. People lost their livelihoods, including in the agriculture and irrigation that constitute about 80% of the Yemeni economy.
Although prioritizing food, health, and water is essential, careful attention must be paid to a stable, clean energy supply for Yemen. This would contribute vitally to raising the population's standard of living and is necessary for economic development and the implementation of humanitarian aid.
International funding dedicated to improving the solar energy sector can simultaneously pave the way for poverty reduction and socioeconomic development and climate protection. Otherwise, the power system threatens to revert to earlier-used energy sources (coal, oil derivatives) that are not financially advantageous and often increase global difficulties in combating climate change [4]. For example, losing this opportunity of using new energy sources could permanently damage people's confidence in renewable energy. In this respect, long-term sustainable development goals can be easily linked to short-term goals.
Geographically, Yemen is situated between 13–16 N latitude and 43.2–53.2 longitude in southwest Asia, surrounded by the ocean, that is, the Red Sea on the west and the Indian Ocean (the Arab Sea) on the south. Yemen's area is 527,970 km2, and its population was 26,687,000 million in 2016. Yemen has a high potential for renewable energy sources, namely solar, wind, and geothermal.
The literature [5–9] and other countries and regions of the world highly emphasize the Weibull function as suitable for wind speed data, that is, useful for distributing much statistical data and presented as continuous distribution for further analysis. Some publications cited here [10–15] and others are related to renewable energy in Yemen, despite their general scarcity in the field.
The literature [16–19] have been presented some studies of renewable energy solutions in the Republic of Yemen. The presented studies involved a hybrid energy solution of many renewable energy sources such as solar, wind, and geothermal energy. Solar irradiance ranges between 5.2–6.8 kWh/m2/day, and the average annual sunshine is between 7.3 and 9.1 h/day, even in winter. The average daily solar hours are between 8 and 16 h per day [20].
Since no similar studies have been conducted for this area. This study examined the potential of installing turbines for harvesting wind energy in the city of Mukalla by analyzing and evaluating wind features, determining density of the total energy, calculating the capacity factor to compare several famous turbines, and calculating the extracted wind energy at different altitudes (10, 30, 50 m).
The basic elements of the proposed model are shown in Fig. 1. Two common functions were used to fit the probability distribution of the measured wind velocity at a given location over a given time, namely Weibull and Rayleigh distributions. Weibull distribution parameters and wind speed characteristics of several well-known wind turbines have also been used in calculating the capacity factor for each of these turbines.

Figure 1: Overall structure of the proposed model
This section uses statistical analysis of distributions to find an appropriate model for application in the second section, which analyzes wind energy evaluation to extrapolate wind speed, wind power density, and energy density for three heights (10, 30, and 50 m).
The location of Almukalla area has been studied to support the calculations of the proposed system model. As the third most important Yemeni city (after Sana'a and Aden), Almukalla is located in southern Hadramaut, at longitude 49.10 degrees and latitude 14.33 degrees, with an area of 1963.05 km² as illustrated in Fig. 2. The weather is hot in summer and mild in winter, and it has semi-monsoon rains. It is surrounded by medium-rise mountains, and several valleys run along its coasts. The city overlooks the Arab Sea, and its population is more than half a million, according to the latest statistics (2005). With unique characteristics that appeal to tourists, Almukalla is an excellent draw for investments. Its people's sophistication and attendance were the most crucial factors enabling it to emerge as a stable, secure cultural and tourist destination.

Figure 2: Location of Almukalla
3.2 Frequency Distribution of Wind Speed
The probability of density function for Weibull distribution is given by Eq. (1) [8,9].
where f(v) refers to the probability of wind speed; v and k are the dimensionless Weibull shape parameter; c refers to the Weibull scale parameter with units equal to wind speed unit.
The consistent cumulative probability function of the Weibull distribution [8] is given by Eq. (2).
The Rayleigh distribution is a distinct case of the Weibull distribution in which k parameter takes the value 2.0. From Eq. (1), the Rayleigh distribution can be computed as shown in Eq. (3).
The two k and c parameters can be related to mean wind speed Vm and standard deviation σ by Eqs. (4) and (5) [8,9].
The k parameter carries the value 2.0. From Eq. (1), the probability density function can be computed as shown in Eq. (6) [8,9].
where C refers to Rayleigh distribution value.
The mean value Vm and standard deviation σ of the Weibull distribution can then be calculated as shown in Eqs. (7) and (8) [8] and [9].
where Γ is the gamma function and using the stirling approximation the gamma function of (x) can be formulated by Eq. (9) below.
3.3 Statistical Analysis of the Distributions
The square of the correlation coefficient (R2), chi-square (x2), and root mean square error analysis (RMSE) are used to evaluate performances of Weibull and Rayleigh distributions [19]. These parameters can be calculated by Eqs. (10), (11), and (12) below.
3.4 Wind Speed Variation with Height
The variation of wind speed was calculated by Eq. (13) [9].
where Ws1 is the real wind speed documented at height h1 (m), (m/s); Ws2 is the wind speed at the targeted height h2 (m), (m/s); and exponent
3.5 Wind Power Density Function
The power of wind at speed Ws (m/s) through a blade sweep area A (m2) increases as the cube of its velocity and is given by Eq. (14) below [8] and [9].
The wind power density predictable annually or monthly per unit area of a site based on function of Weibull probability density can be computed as shown in Eq. (15).
The density of total wind power P/A can be given by Eq. (16).
where n refers to the days in a month.
The electrical energy produced by a turbine over the year is expressed by Eq. (17) [8]:
The available mean wind power density Pd, and the overall density of wind energy Ed, of a wind turbine for a while T can be computed as shown in Eqs. (18), and (19) [8] and [9].
Wind turbine manufacturers are keen to include power curves in their technical notes. This makes it easy to estimate the power output of any wind turbine when a series of measurements are made at the site studied. The power output of wind turbines can be expressed as shown in Eq. (20) [20].
where
The curve can be divided into two areas, the first is confined between
Fig. 3 shows a curve of the relationship between electrical power and the wind speed of a wind turbine.

Figure 3: Wind turbine electric power/wind speed relationship curve
Note that the curve increases quasi-linearly, starting with the cut speed
Substituting Eqs. (1) and (21) into Eq. (20) yields Eq. (22) below [20] and [21].
3.8 Capacity Factor of Turbine (CF)
The capacity factor of wind turbines describes the gap between nominal and realistic power production of a wind turbine at a certain location over some time. It is the ratio of the wind turbine's actual power output to its nominal or maximum power output as shown in Eq. (23).
From Eq. (22), we can calculate the capacity factor as given by Eq. (24) below.
It is observed that the amplitude factor is proportional to scale parameter C and inversely to shape parameter k and when the values of C and k are fixed, we see that CF is proportional to the slope of the quasi-linear portion of the curve.
In conclusion, that it is preferable to choose a turbine with a lower cut-in speed
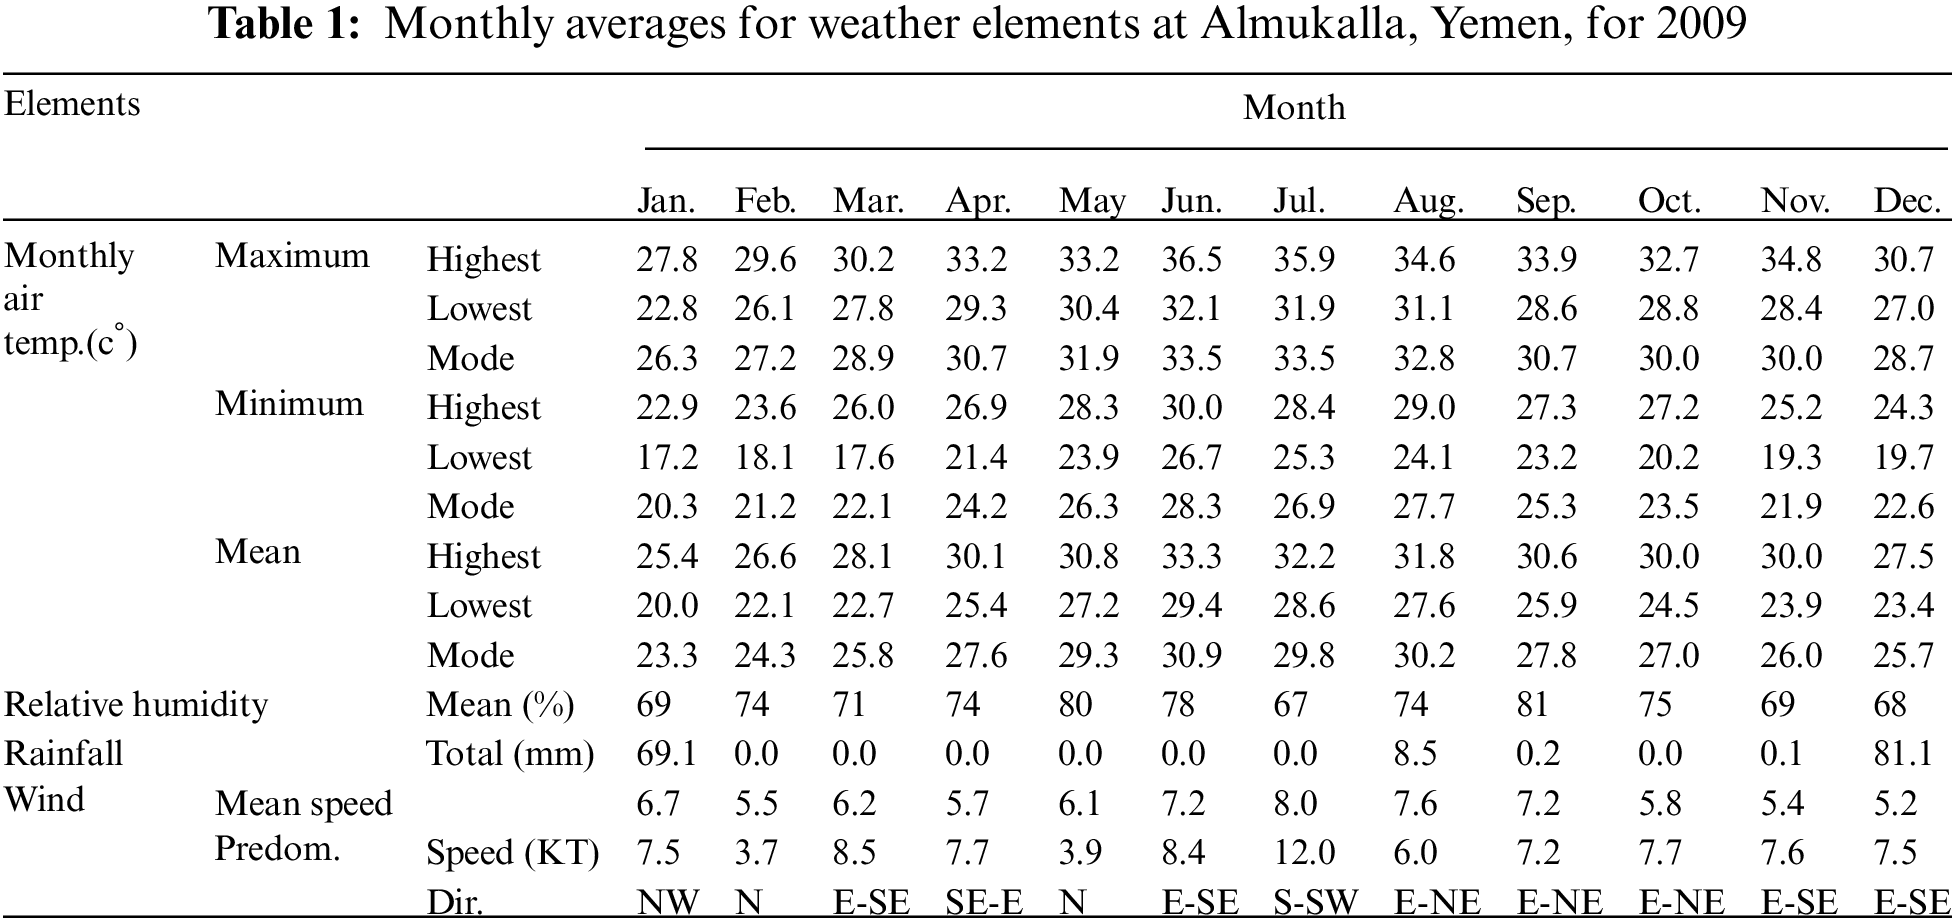
4.1 Monthly Mean for Weather Elements
We obtained recorded wind speed data for our current research from the Civil Aviation and Meteorological Authority only for the five years 2005–2009, due to war and the political situation in Yemen's capital, Sana'a. Tab. 1 shows a sample of data we obtained for Almukalla for 2009.
A rotating cup type of anemometer was used, and stations were positioned at 10 m above ground in open spaces free of obstacles. Wind speeds taken every 10 s were averaged over 5 min and stored in a data logger. The 5-min averaged data were further averaged over 1 h. Based on these data, wind speeds were analyzed using statistical and computer software. Wind speed trends were also obtained for each month for five years as shown in tabular form in Tab. 2 and illustrated graphicly in Fig. 4.
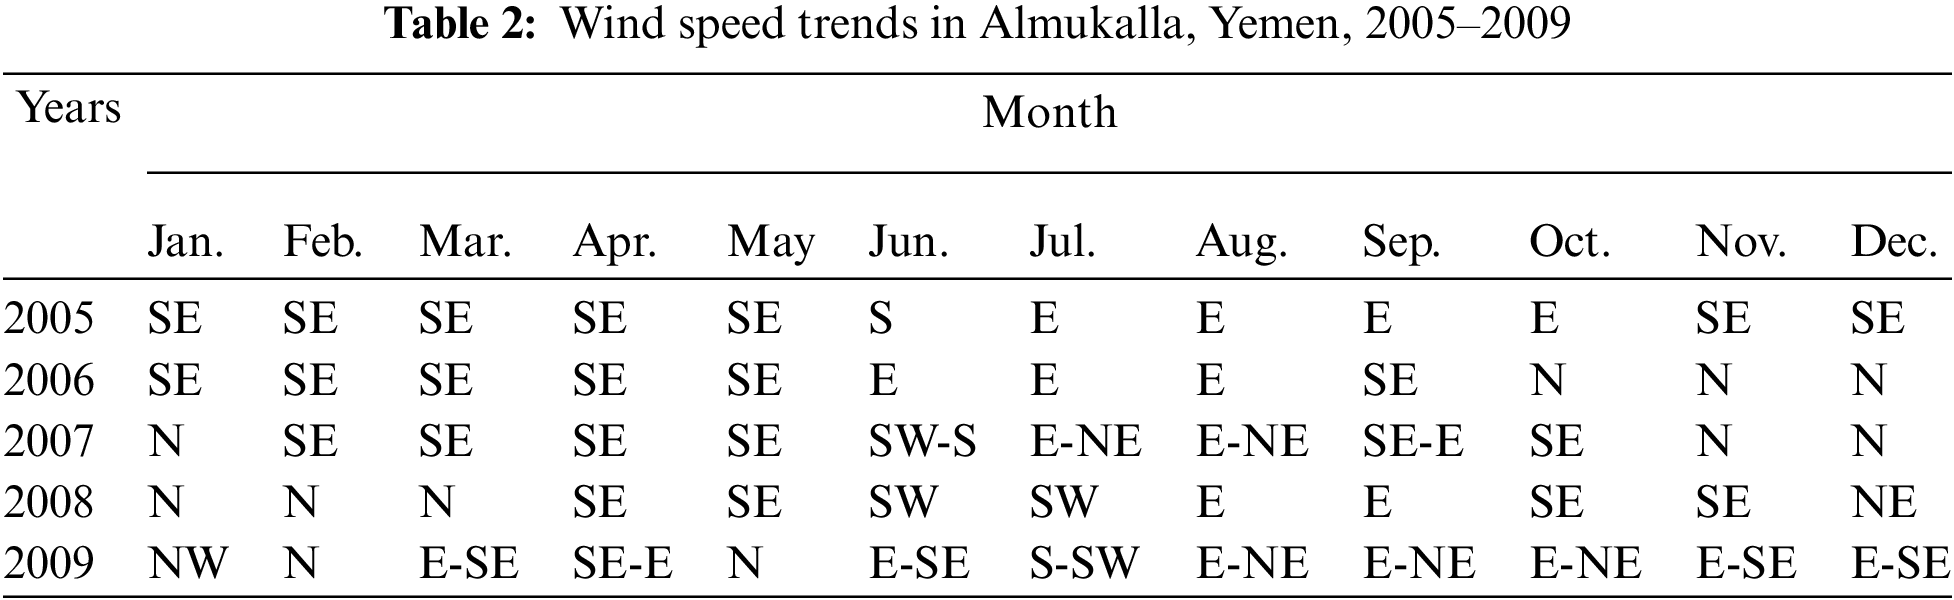

Figure 4: Windrows of Almukalla (2005–2009)
From five-year monthly mean wind speeds as shown in Tab. 3, the average was 6.62 m/s. Wind speed for the whole year had the maximum monthly value of 8.15 m/s, which appears in July, while the minimum value was 5.67 m/s, which occurs in April. Fig. 5 clearly shows the average wind speed each month for five years. We find that the maximum wind speed occurs in May, June, July, and August, and the minimum in October, November, March, and February. Note that the smaller the value's standard deviation, the smaller the velocity samples. This indicates that the current region is very suitable for wind power.
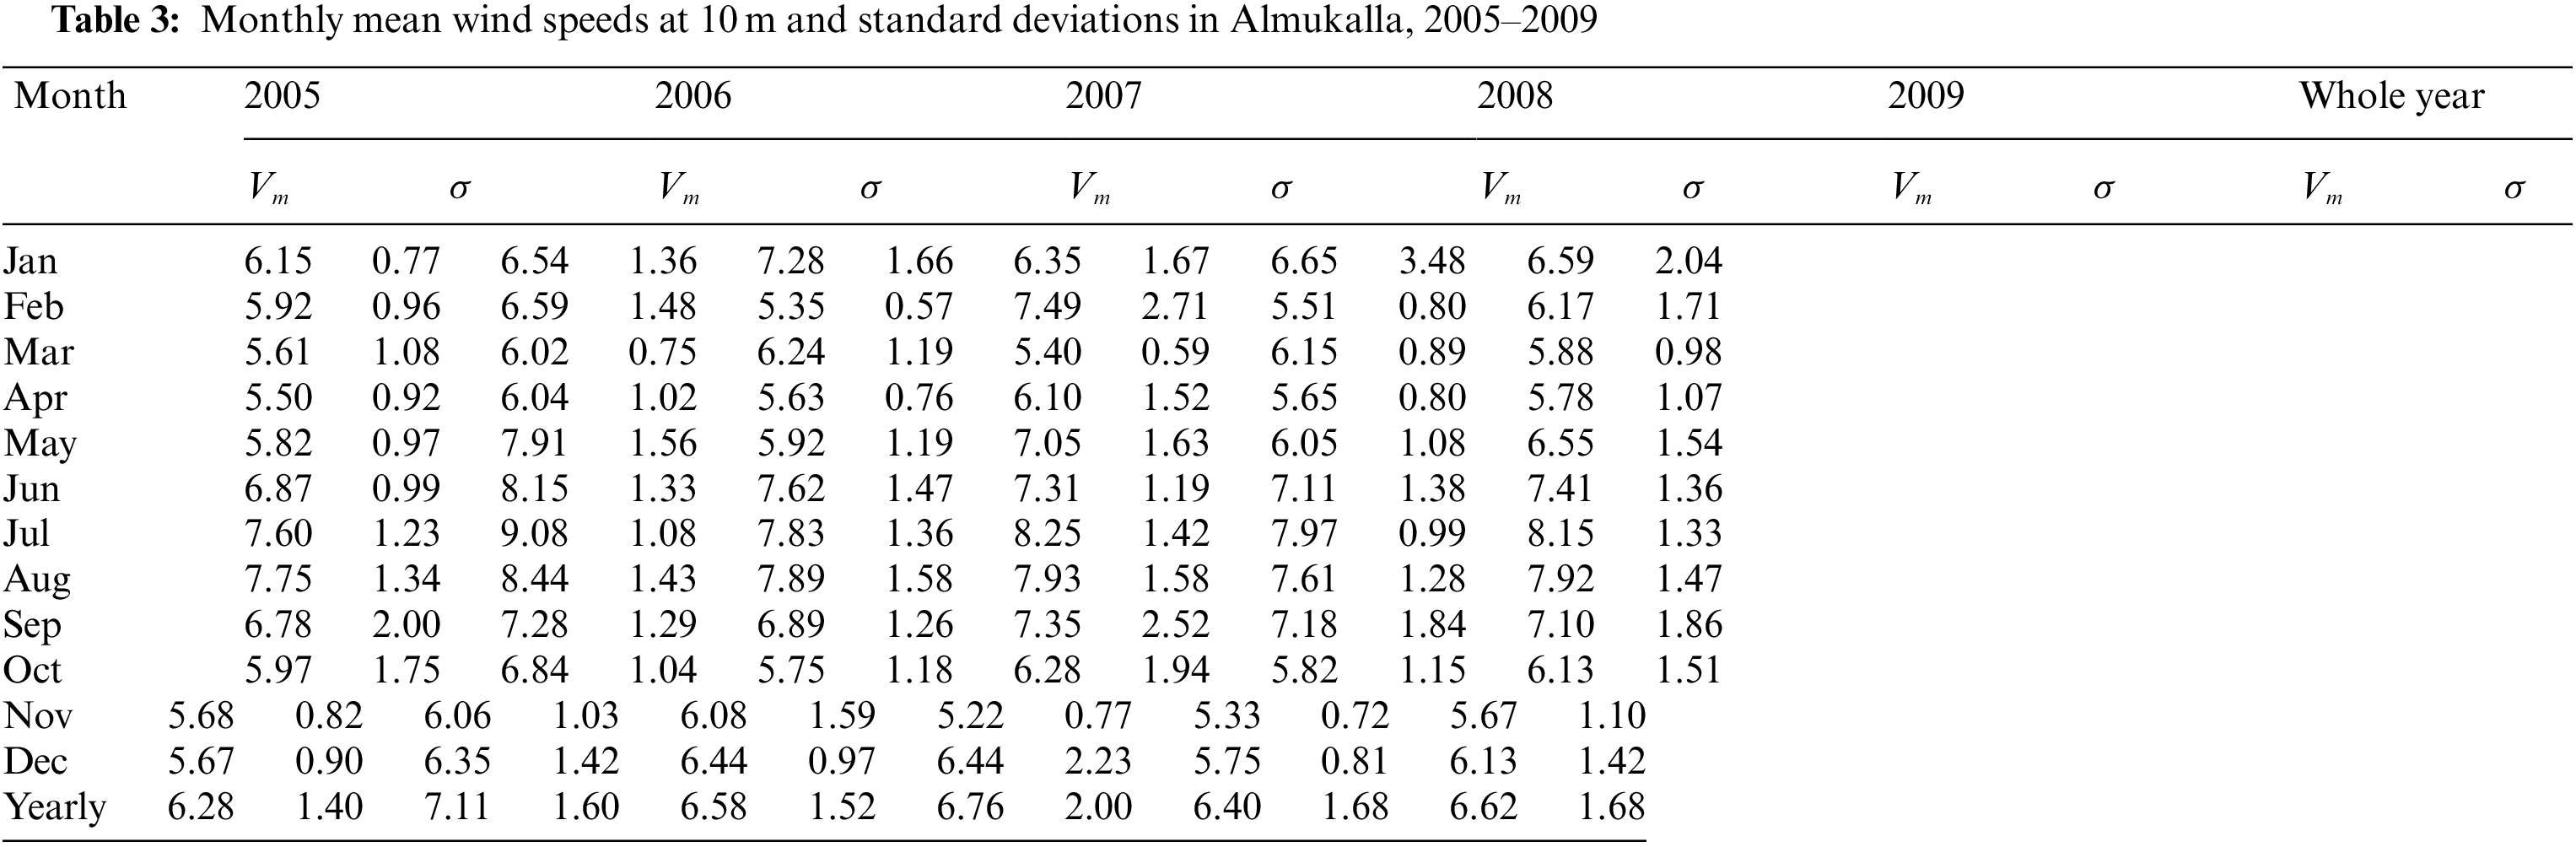

Figure 5: Monthly mean wind speed in Almukalla, Yemen, 2005–2009
The wind log for one full year can specify parameters that can be used as a Weibull probability distribution function to evaluate wind energy potential. Previous studies show wind characteristics’ statistical results [5,8] and [9].
4.3 Probability Density and Cumulative Distributions
Using Eqs. (4) and (5), Weibull parameters can be computed for the available data as shown in Tab. 4. Statistically, wind velocities can be described using the Weibull intensity function as a widely recognized standard approach for evaluating local wind probabilities.
Tab. 4 displays annual and mean Weibull parameters calculated analytically from data available for five years. The table clearly shows that while scale parameters differ from 6.83 (2005) to 7.03 (2009), shape parameters range from 5.1 (2005) to 4.27 (2009). The mean five-year values for scale and shape parameters are 7.27 and 4.43, respectively. As is well known, several functions of distribution describe the wind speed frequency curve. Fig. 6 shows the annual wind velocity probability density and cumulative probability distributions derived from Almukalla's measured data for whole years.


Figure 6: Yearly probability density and cumulative distributions derived from measured data of Almukalla, Yemen, for whole years
The Weibull approximation of probability density distribution of wind speeds is shown in Fig. 7.

Figure 7: Weibull and Rayleigh approximations of the actual probability distribution of wind speeds for Almukalla, Yemen, 2005–2009
4.4 Statistical Analysis of Distributions
Because the RMSE method is considered the most accurate monitoring, since it is a fast method of obtaining minimum values, it was selected for our study's analysis. Fig. 8 shows correlation coefficient values from fitting actual probability density distributions with Weibull and Rayleigh functions.

Figure 8: Correlation coefficient actual probability density distributions with Weibull and Rayleigh functions
When comparing the Weibull distribution and the Rayleigh distribution through the previous analysis, we find that the Weibull distribution fits the domain data better than the five-year Rayleigh distribution when the most-distributed function has the highest value of R2 and the lowest RMSE and x2. The Weibull distribution shows a very good approximation for estimating wind energy density in Yemen. Moreover, the monthly distribution of wind velocity probability density and cumulative probability derived from Almukalla area data measured for a full five years is shown in Figs. 9 and 10.

Figure 9: The density distribution probability of wind speed given monthly of Almukalla, Yemen, for all years

Figure 10: The cumulative distribution probability of wind speed given monthly of Almukalla, Yemen, for all years
Results in Fig. 11 show the Weibull probability density distributions analysis for each of the five years.

Figure 11: Yearly Weibull probability density distributions for Almukalla, Yemen, 2005–2009
For results in Figs. 9–11, the wind velocity slope is proportional to all curves concerning cumulative density and probability density. Fig. 8 for the Almukalla region corresponds to annual probability density distributions obtained from the Weibull model, with yearly measured data distributions.
Wind speed changes with altitude, so actual wind turbines are commonly placed at variable heights, more than 10 meters from ground cover, including the appropriate height for the wind turbine and the monthly average wind speed. Annual wind speeds are equal to various heights (10, 30, and 50 meters) using Eq. (13). This is the first step for using this data to calculate and evaluate wind energy within the specified location. At these heights, the average annual wind velocity became 6.6 m/s at 10 m, 10.3 m/s at 30 m, and 12.6 m/s at 50 m, respectively as illustrated in Fig. 12.

Figure 12: Monthly average mean wind speeds (m/s) at 10, 30, and 50 meters
Calculations of the average monthly wind power per unit of the turbine's cross-section, where the air density of 1.225 kg/m3 energy density is calculated at different heights (10, 30, and 50 m) as shown in Tab. 5 and illustrated in Fig. 13.


Figure 13: Average wind power density profile at 10 m and extrapolation to 30 and 50 m
Wind energy density is proportional to the wind speed cube, which means that a slight difference in wind speed leads to the massive difference in wind energy density as shown in Tab. 6.

According to the standard of international wind power classification, Almukalla falls into class 7, that is, “Superb” for most of the year. The city has an average wind power density of 1283.1 W/m2 at 50 m height and an average wind speed of 12.6 m/s at 50 m height. The research area (Al-Mukalla) is a coastal area where the amount of wind is abundant with the lack of solar frequently. Therefore, the option of using wind in this area represents an effective option for generating energy as an alternative or supportive option to generate it using solar energy.
Using Eqs. (17) and (18), we can calculate the average monthly and annual wind energy per unit of the turbine's cross-section. Thus, Almukalla wind energy was estimated at different heights: 10, 30, and 50 m as shown in Tab. 7 and illustrated Fig. 14.


Figure 14: Average annual energy density profile at 10 m and extrapolation to 30 and 50 m
Since wind power is proportional to the axis's height, the average annual wind energy density is 1629.4 KWh/m2/year at 10 m, 6080.3 KWh/m2/year at 30 m, and 11240 KWh/m2/year at 50 m, respectively. Obviously, variation of the wind energy intensity pattern follows average wind velocity.
In this study, the wind energy potential of Almukalla, Yemen, was analyzed based on sequential wind speed data, currently available only for the five years 2005–2009 due to war and the political situation. Data and Weibull and Rayleigh distribution functions were also calculated compared to five-year field data probability distributions. The analysis found that the Weibull distribution fits domain data better than the Rayleigh distribution for the entire period. Wind energy intensity from the site was studied based on Weibull and Rayleigh's functions. The Weibull distribution shows a perfect approximation for estimating the intensity of Yemen's wind energy. Depending on both the Weibull model and the results of the annual wind speed data analysis for the study site in Mukalla, the capacity factor for many turbines was also calculated, and the best suitable turbine was selected.
The city of Almukalla falls into “Class 7” or “Superb” wind power for most of the year. The current work is a preliminary study to assess only the potential of wind energy to provide useful insights to engineers and experts dealing with wind energy. For the future, we will present a new hybrid investigation of solar and wind energy's potential in Almukalla area in order to improve the living conditions and powering services of local residents.
Funding Statement: The authors extend their appreciation to the Deanship of Scientific Researchat King Khalid University for funding this work under Grant Number (RGP.1/172/42).https://www.kku.edu.sa.
Conflicts of Interest: The authors declare that they have no conflicts of interest to report regarding the present study.
1. S. Kutty, M. Khan and M. Ahmed, “Wind energy resource assessment for Suva, Fiji, with accurate Weibull parameters,” Energy Exploration & Exploitation, vol. 37, pp. 1009–1038, 2019. [Google Scholar]
2. L. Paraschiv, S. Paraschiv and I. Ion, “Investigation of wind power density distribution using Rayleigh probability density function,” Energy Procedia, vol. 157, pp. 1546–1552, 2019. [Google Scholar]
3. A. Liu, Y. Ma, J. Gunawardena, P. Egodawatta, G. Ayoko et al., “Heavy metals transport pathways: The importance of atmospheric pollution contributing to stormwater pollution,” Ecotoxicology and Environmental Safety, vol. 164, pp. 696–703, 2018. [Google Scholar]
4. A. Alkholidi, “Renewable energy solution for electrical power sector in Yemen,” International Journal of Renewable Energy Research, vol. 3, pp. 803–811, 2013. [Google Scholar]
5. Y. Li, W. Xiao-Peng, L. Qiu-Sheng and K. Fah, “Assessment of onshore wind energy potential under different geographical climate conditions in China,” Energy, vol. 152, pp. 498–511, 2018. [Google Scholar]
6. M. Salah, I. Supérieur and S. Ben, “Assessment of wind energy potential and optimal electricity generation in Borj-Cedria,” Renewable and Sustainable Energy Reviews, vol. 15, pp. 815–820, 2017. [Google Scholar]
7. I. Fyrippis, P. Axaopoulos and G. Panayiotou, “Wind energy potential assessment in Naxos Island, Greece,” Applied Energy, vol. 87, pp. 577–586, 2017. [Google Scholar]
8. S. Haralambos, G. Mihalakakou and L. Al-Hadhrami, “Wind power potential assessment for seven buoys data collection stations in Aegean Sea using Weibull distribution function,” Journal of Renewable and Sustainable Energy, vol. 4, pp. 1–17, 2012. [Google Scholar]
9. M. Baseer, J. Meyer, S. Rehman and M. Alam, “Wind power characteristics of seven data collection sites in Jubail, Saudi Arabia using weibull parameters,” Renewable. Energy, vol. 102, pp. 35–49, 2017. [Google Scholar]
10. M. A. A. Almekhlafi, “Justification of the advisability of using solar energy for the example of the Yemen Republic,” Scientific and Technical Journal, vol. 4, pp. 51–50, 2018. [Google Scholar]
11. A. Rawea and S. Urooj, “Strategies, current status, problems of energy and perspectives of Yemen's renewable energy solutions,” Renewable and Sustainable Energy Reviews, vol. 82, pp. 1655–1663, 2018. [Google Scholar]
12. M. Al-Buhairi and A. Al-Haydari, “Monthly and seasonal investigation of wind characteristics and assessment of wind energy potential in Al-Mokha, Yemen,” Energy and Power Engineering, vol. 4, pp. 125–131, 2012. [Google Scholar]
13. M. Al-Buhairi, “Analysis of monthly, seasonal and annual air temperature variability and trends in Taiz city-Republic of Yemen,” Journal of Environmental Protection, vol. 1, pp. 401–409, 2010. [Google Scholar]
14. M. Al-Buhairi, “A statistical analysis of wind speed data and an assessment of wind energy potential in Taiz-Yemen,” Assiut University Bulletin for Environmental Researches, vol. 9, pp. 21–33, 2006. [Google Scholar]
15. A. AL-Ashwal, “All renewable energy applications in Yemen are best practice,” ISECO Science and Technology Vision, vol. 1, pp. 45–50, 2005. [Google Scholar]
16. A. Almakaleh, “Monthly design values for solar energy collectors and concentrators systems in Yemen,” Journal of Science & Technology, vol. 4, pp. 27–44, 1999. [Google Scholar]
17. B. Gadhi and M. Mukbel, “A review of renewable energy activities in Yemen,” Renewable Energy, vol. 14, pp. 459–465, 1998. [Google Scholar]
18. A. Algifri, “Wind energy potential in Aden-Yemen,” Renewable Energy, vol. 13, pp. 255–260, 1998. [Google Scholar]
19. T. Chang, “Estimation of wind energy potential using different probability density functions,” Applied Energy, vol. 88, pp. 1848-1856, 2011. [Google Scholar]
20. UNDP, Policy Note 2014. Prospects of Solar Energy in Yemen. UNDP-Yemen, Sana'a, 2014. [Online]. Available: http://www.undp.org/content/dam/yemen/E&E/Docs/UNDP-YEM-Prospects/SolarEnergyinYemen-PolicyNote.pdf. [Google Scholar]
21. M. Hadwan and A. Alkholidi, “Solar power energy solutions for Yemeni rural villages and desert communities,” Renewable and Sustainable Energy Reviews, vol. 57, pp. 838–849, 2016. [Google Scholar]
22. M. A. A. Almekhlafi, “Justification of the advisability of using solar energy for the example of the Yemen Republic.” Scientific and Technical Journal-Technogenic and Ecological Safety, vol. 4, pp. 41–50, 2018. https://doi.org/10.5281/zenodo.1313470. http://jteb.nuczu.edu.ua/uk/potochnyi-nomer. [Google Scholar]
 | This work is licensed under a Creative Commons Attribution 4.0 International License, which permits unrestricted use, distribution, and reproduction in any medium, provided the original work is properly cited. |