DOI:10.32604/cmc.2022.024583
| Computers, Materials & Continua DOI:10.32604/cmc.2022.024583 | |
| Article |
Detection of Lung Tumor Using ASPP-Unet with Whale Optimization Algorithm
1Department of Computer Science, College of Computer and Information Sciences, Prince Sultan University, 11564,Saudi Arabia
2Department of Computer Science, College of Science and Arts, King Khalid University, Mahayil, Asir, 61913, Saudi Arabia
3Department of Biomedical Engineering, College of Engineering, Princess Nourah Bint Abdulrahman University, Riyadh, 11671, Saudi Arabia
4Department of Computer and Self Development, Preparatory Year Deanship, Prince Sattam bin Abdulaziz University, AlKharj, 16278, Saudi Arabia
5Department of Natural and Applied Sciences, College of Community-Aflaj, Prince Sattam bin Abdulaziz University, 16278, Saudi Arabia
*Corresponding Author: Anwer Mustafa Hilal. Email: a.hilal@psau.edu.sa
Received: 23 October 2021; Accepted: 17 January 2022
Abstract: The unstructured growth of abnormal cells in the lung tissue creates tumor. The early detection of lung tumor helps the patients avoiding the death rate and gives better treatment. Various medical image modalities can help the physicians in the diagnosis of disease. Many research works have been proposed for the early detection of lung tumor. High computation time and misidentification of tumor are the prevailing issues. In order to overcome these issues, this paper has proposed a hybrid classifier of Atrous Spatial Pyramid Pooling (ASPP)-Unet architecture with Whale Optimization Algorithm (ASPP-Unet -WOA). To get a fine tuning detection of tumor in the Computed Tomography (CT) of lung image, this model needs pre-processing using Gabor filter. Secondly, feature segmentation is done using Guaranteed Convergence Particle Swarm Optimization. Thirdly, feature selection is done using Binary Grasshopper Optimization Algorithm. This proposed (ASPP-Unet -WOA) is implemented in the dataset of National Cancer Institute (NCI) Lung Cancer Database Consortium. Various performance metric measures are evaluated and compared to the existing classifiers. The accuracy of Deep Convolutional Neural Network (DCNN) is 93.45%, Convolutional Neural Network (CNN) is 91.67%, UNet obtains 95.75% and ASPP-UNet-WOA obtains 98.68%. compared to the other techniques.
Keywords: Classifier; whale optimization; ASPP-unet; gabor filter; lung tumor
In the medical diagnostics, digital image processing plays a vital role [1]. Biomedical image processing is used to process the digital image in the field of biomedical science [2]. For the diagnosis of disease at the early stage, bio-medical field needs an accurate detection using computing intelligent approach [3]. It could provide more precise and active treatment for the disease. There are various medical image modalities like Magnetic Resonance Imaging (MRI), ultrasound, Computed Tomography (CT) scanners that are used in the diagnosis of image in a greater way. CT is the most effective approach of lung tumor detection and tumor pathology [4].
The analysis of tumor is a tedious and time consumption task. CT plays a vital role and more sensitive in the determination of tumor size. Computer Aided Diagnosis (CAD) has been used for the early prediction of lung cancer [5]. As far as CAD model is concerned, sensitivity, specificity, cost effectiveness and accuracy are achieved in the analysis of lung cancer [6]. For enhancing the affected region of the disease, CAD uses the digital images [7]. The prediction of diseases is done through the information gathered from the image modalities and as well as the clinical analysis is carried out by the radiologist for the final decision [8].
The use of multimodal medical images will lead the physician to take more time to diagnosis and provides a better treatment. Therefore, in order to get an accurate and an effective treatment, the bio-medical field needs an automatic segmentation of tumor which relieves the physicians by increasing the consistency and efficiency [9–11].
The issues in the existing techniques have high consumption of energy, inaccurate detection, and high time complexity. To overcome these problems, the proposed work gives more accurate detection of tumor in the lung and similarly, it detects the tumor at the earlier stage in an effective manner.
The contributions of the proposed work are:
1. To implement an enhanced version of feature selection by applying binary grasshopper optimization algorithm.
2. Proposed work (ASPP-UNet-WOA) is applied for the detection of tumor in the lung image by optimizing the features subset.
The rest of the research article is written as follows: Section 2 discusses the related work on various classification techniques of lung tumor image processing and methods. Section 3 shows the algorithm process and general working methodology of proposed work. Section 4 evaluates the implementation and results of the proposed method. Section 5 concludes the work and discusses the result evaluation.
The abnormal growth of cells in the lung tissue is considered as tumor. Early detection and prevention of high risk in the treatment of the disease are the essential things. In medical image diagnosis of disease, the accuracy and consistency are very important things for the survival of human beings. In the training of CT lung image data set, Feed Forward Neural Network (FFNN), Feed Forward Back Propagation (FWBP) were used. For providing better classification of tumor, Feed Forward Back Propagation (FWBP) was applied [12].
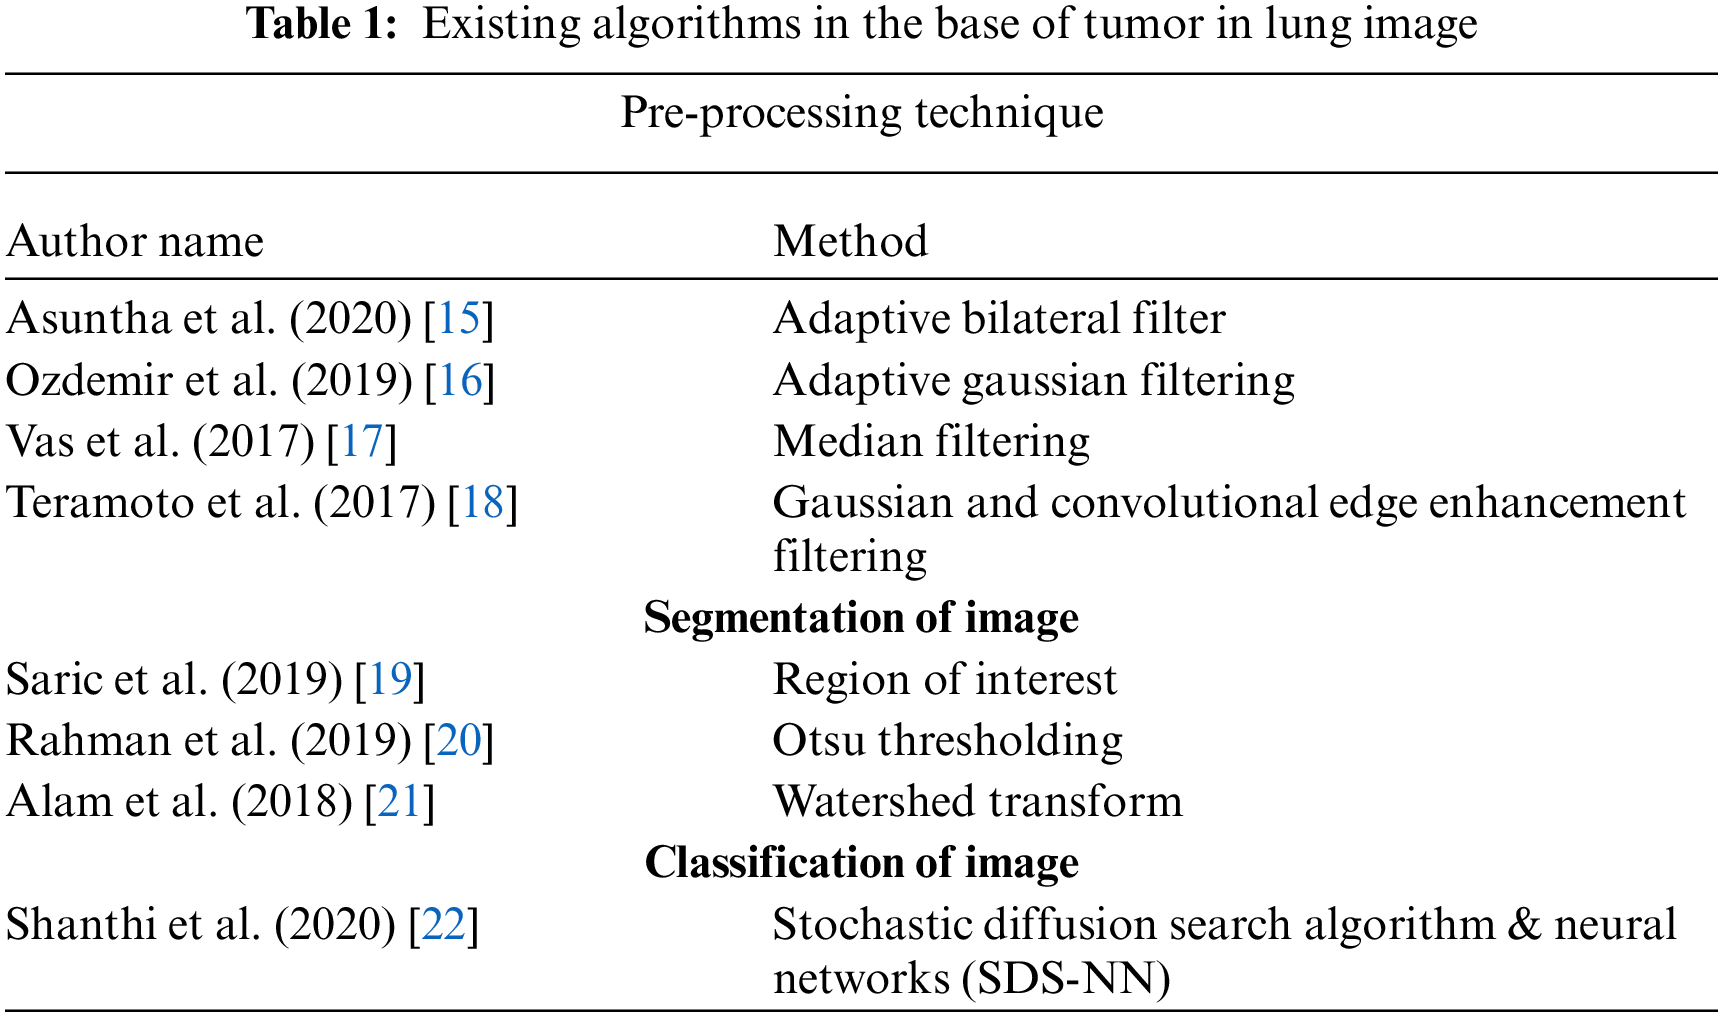
It is difficult to diagnosis using CNN and sometimes it detects falsely. Moreover, 3D CNN has handled this type of lung pathology. In order to produce better result, it combines the max pooling layer and convolutional layer which were applied to produce each CNN. ReLU is applied here as activation function along with Softmax layer which is applied fully to connect the layer and finally it produces the result [13]. This paper [14] proposed an automatic detection of lung tumor using public dataset of LIDC-IRDI. It uses MultiScene Deep Learning Framework which provides CT lung images as input and obtains probability distribution of distinct gray levels using threshold segmentation. Tab. 1 shows the survey on existing algorithms in the base of tumor in lung image.
One of the high risky diseases is lung tumor. But early prediction can save the life of a patient. But it is undeniable that the prediction of tumor is a challenging task. This proposed work consists of following phases: pre-processing, segmentation, extraction of the feature, feature selection, and classifying of tumor from the CT lung image. These phases are shown in Fig. 1.
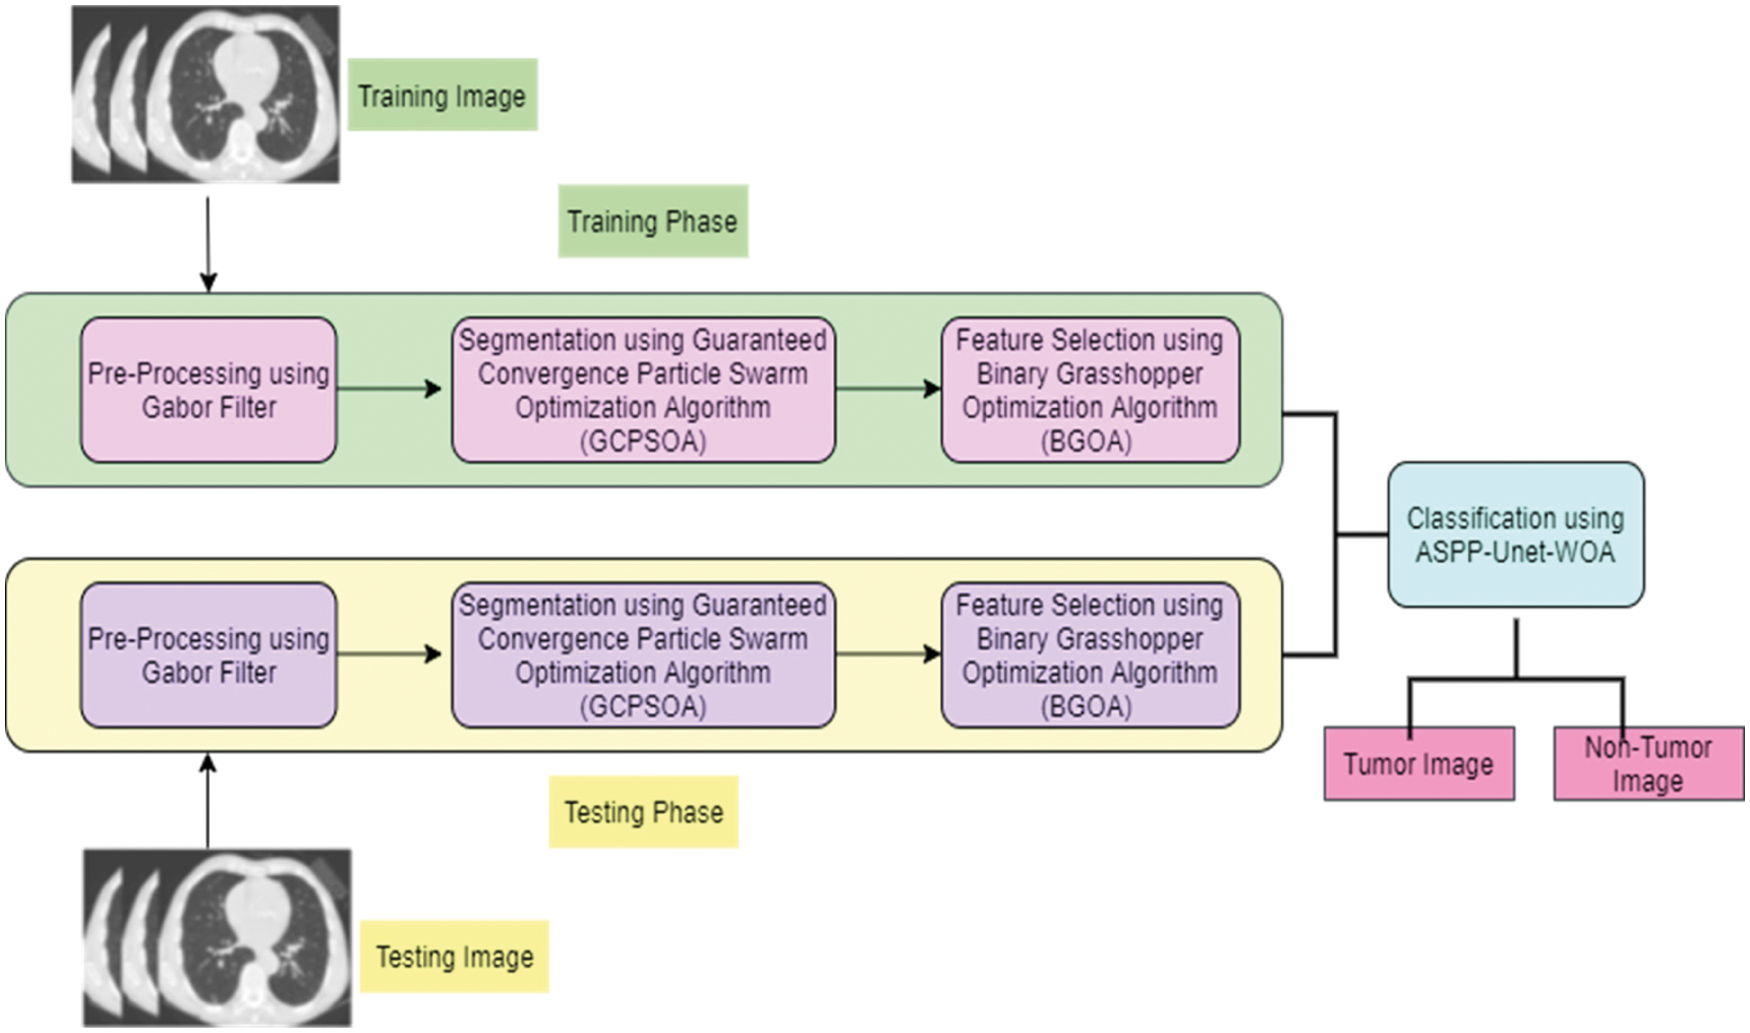
Figure 1: Architecture of proposed work
Fig. 1 shows the two phases namely, training phase and testing phase. In the segmentation phase, using Guaranteed Convergence Particle Swarm Optimization Algorithm is applied in the filtered input lung tumor image (GCPSOA). The feature extraction is done using GLCM and in the feature selection, binary grasshopper optimization algorithm (BGOA) is used. From the selected features, tumor lung image is classified using Atrous Spatial Pyramid Pooling (ASPP)-Unet architecture with whale optimization algorithm (ASPP-Unet -WOA).
Pre-processing is the most significant step in the detection of lung tumor. To enhance the accuracy in the detection of tumor, removal of unnecessary signals in the image pre-processing are needed. In this work Gabor filter is used to remove the noise in the lung tumor image.
Gabor is a multi-scale, multi resolution filter [23,24]. Gabor filter can be applied in four different orientations and five different frequency values. The steps involved in Gabor filter using Gaussian rule can be referred in the article [25].
Apply the Gaussian function of standard deviation to the lung tumor image (img)_(i, j) with different angles like 0°, 20°, 40°, 60°, 120° and various orientations such as 60, 80,120 and 140 using Eq. (1).
where,
Step 4: Substitute the Eq. (1) in Eq. (2).
To get better quality of classification, data augmentation process is done in the Lung image. It involves transformation of CT lung image performing rotation at 90 degrees and flipping the image horizontal operation [26–29].
3.1.3 Normalization of the Image Using Min-Max Normalization Technique
To normalize the input CT lung image of size
Here,
3.2 Segmentation of Lung Tumor Image
Segmentation is a process of dividing the filtered lung tumor image into sub-regions. To detect the tumor easily, segmentation process is applied. In this work, Guaranteed Convergence Particle Swarm Optimization Algorithm is applied (GCPSOA). Let assume that population of the swarm is
where,
The convergence of particles is determined by implementing the Eqs. (6) and (7). Then transformed into the dynamic form as described in Eq. (9).
where,
where, num_successes and num_failures are represented as number of successes and failures, suc and fac are defined as threshold parameter values.
In order to get fine tuning classification of image, feature selection task is required by which reducing the features quantity by means of removing redundant and irrelevant information is possible. In this work, Binary Grasshopper Optimization Algorithm (BGOA) is implemented. Grasshoppers are treated as a pest. The key feature of these pests is connected to their movements. At their larval state, it has a slow movement when compared to its adult state. Since at the adult state, its movement is rapid. The movement of the grasshoppers can be represented as in Eq. (11).
where,
Here,
Transfer Function (TF) has two types of functions based on their shapes such as Sigmoidal (S-shaped) and Hyperbolic tan (V-shaped). The Sigmoidal (S-shaped) function is represented in Eq. (14)
where
where the
Hyperbolic tan (V-shaped) is represented as (16)
Then the improved version of current location grasshopper is represented in Eq. (16):
Here
For every iteration, fitness function is calculated. It is carried out because the aim of the feature selection is to enhance the accuracy and decrease the number of selected features. For the best solution, the nominated features are to be selected. For these nominated features, the classification rate is also reduced. The fitness function for the selected features is defined in Eq. (18):
where the taxonomy error rate of the classifier is represented as
3.4 Classification Using ASPP-Unet-WOA
The selected features are provided to the ASPP-Unet (Atrous spatial pyramid pooling) architectures as the input. ASPP-Unet model is similar to the U-Net model in the aspects of contracting the path with CNN model. The architecture of ASPP-Unet model is given in the Fig. 2.
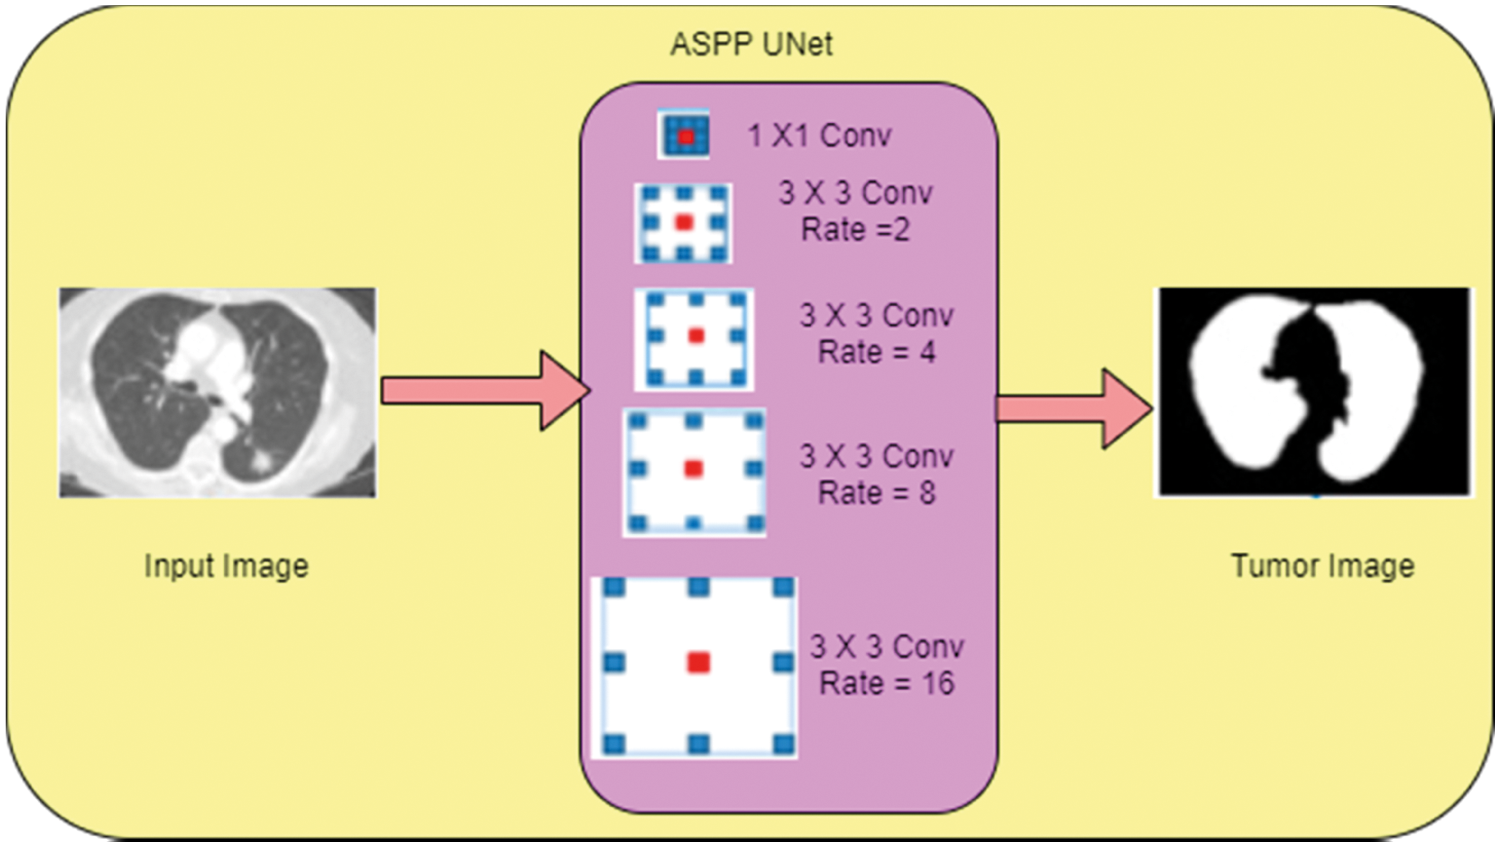
Figure 2: Architecture of ASPP Unet
Fig. 2 shows a pyramid-like structure and each down layer consists of two sequential unpadded 3 × 3 convolutions. Each convolution operation is executed by an activation function in the basis of element-wise. After the convolution execution, the feature maps get doubled. In this work Exponential linear unit (Elu) function is applied to perform the activation function and it is given in Eq. (19):
where α is a parameter value between 0 and 1. To reduce the resolution of feature maps, 2 × 2 max pooling operation is applied in the contracting path between the lower and the upper layers. The size of the feature maps gets reduced to
where
where, C and P are the coefficient vector values, j is the iteration.
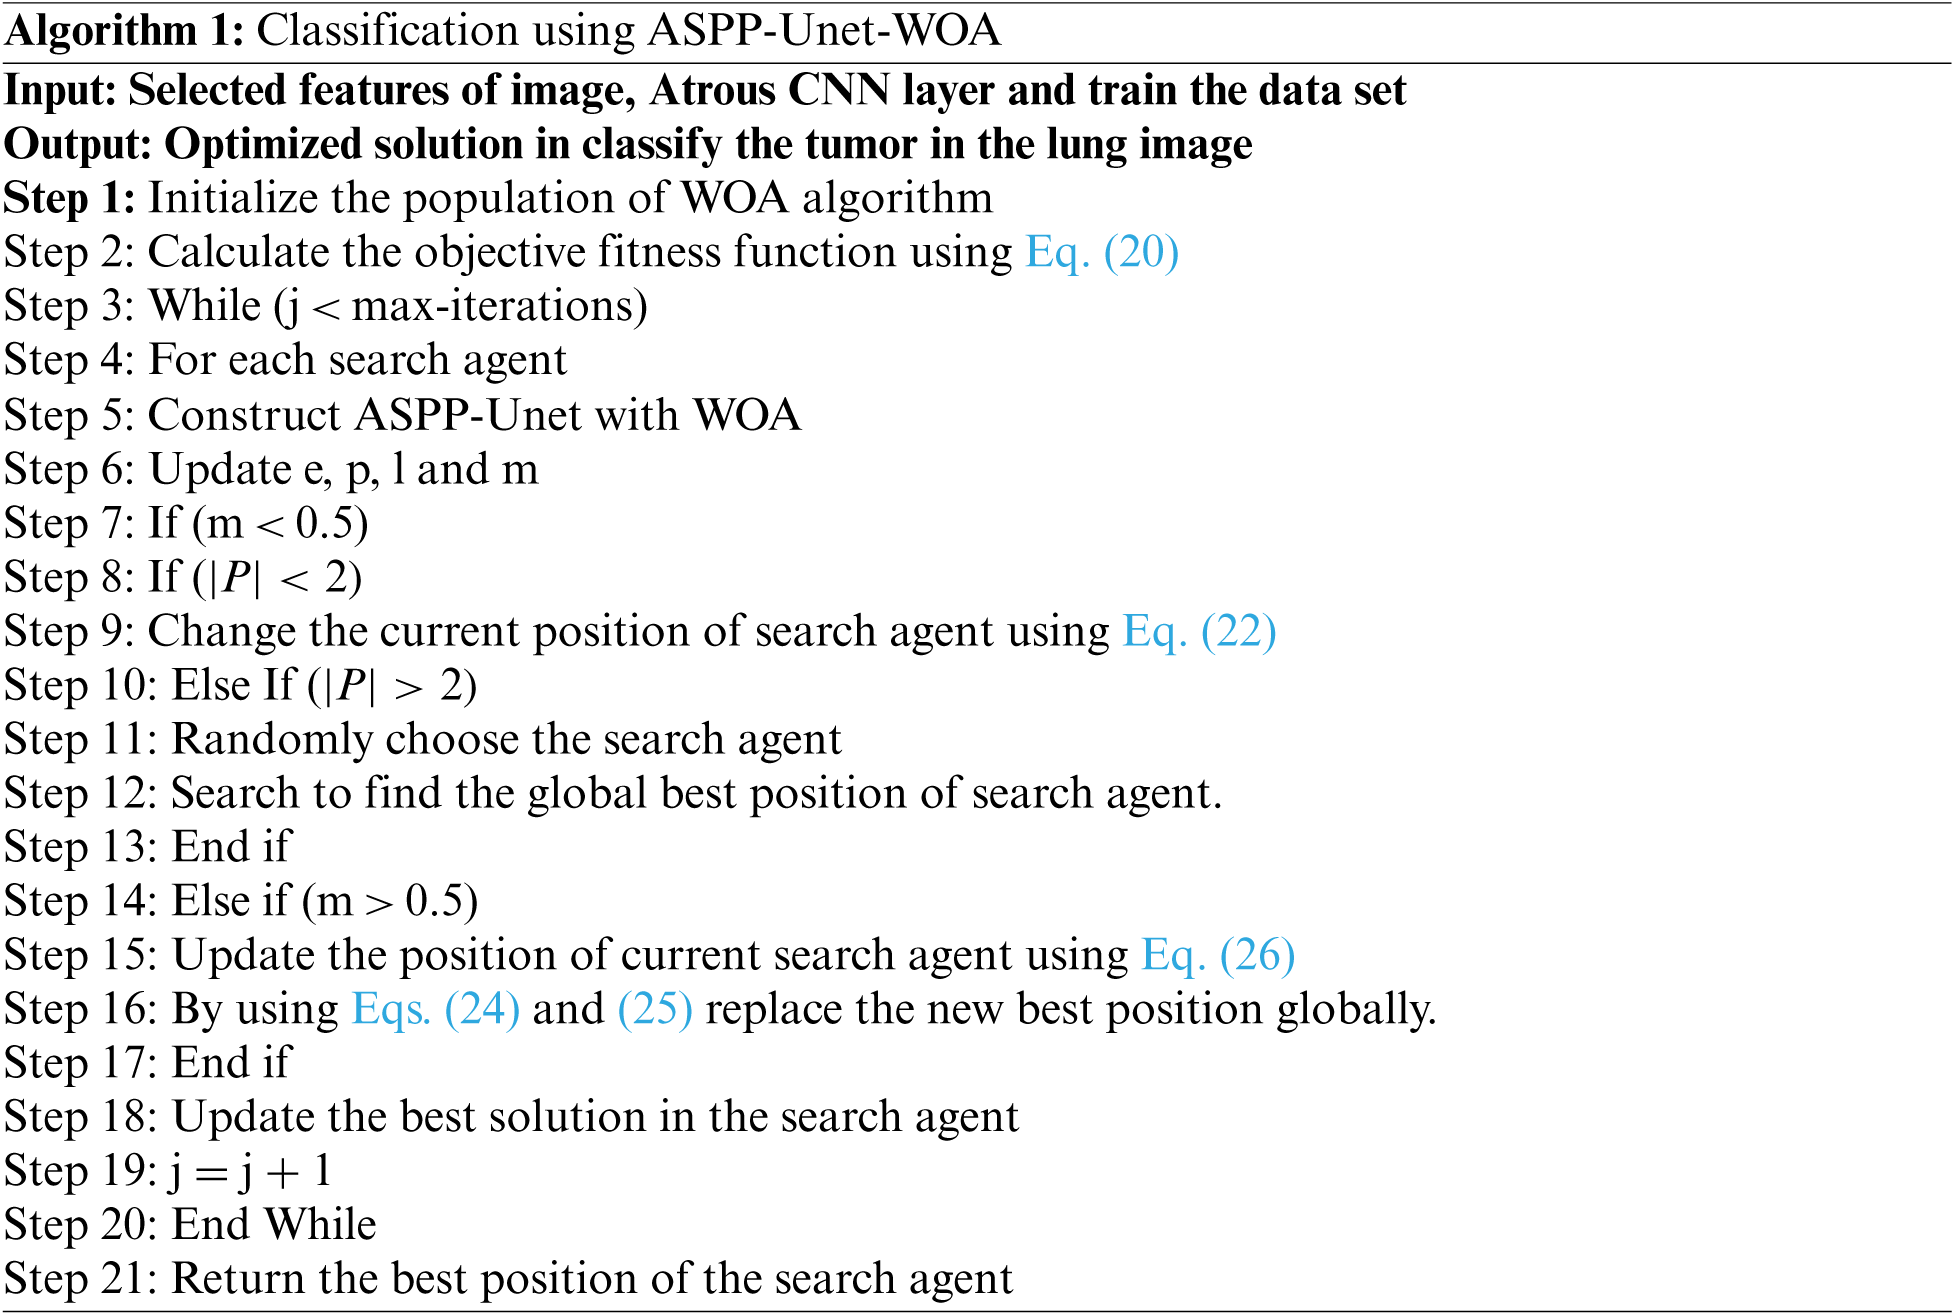
The humpback whales chase around the prey within the spiral-shaped and the shrinking circle simultaneously to catch the prey. The algorithm of the proposed work using ASPP-Unet-WOA is given below:
For the early detection of lung tumor, this work has implemented using 150 samples of lung CT images. The images are obtained from the NCI Lung Cancer Database Consortium. Computed Tomography (CT) scan images are used in this study in order to detect the tumor in the lung image in an effective and accurate way.
The statistical performance of metric measures are given below:
Accuracy
It is used to evaluate the classification of correct lung tumor images accurately. See Eq. (27).
Sensitivity
It is used in the evaluation of sensitivity to measure how far the lung tumor images are identified. See Eq. (28).
Specificity
It is used to evaluate the rate between True Negative (TN) and True Positive (TP). See Eq. (29).
Dice Similarity Coefficient
It is used to evaluate the ratio between tumor lung images and non-tumor lung images. See Eq. (30)
Precision
See Eq. (31).
Recall
See Eq. (32).
JACCARD Similarity Index (JSI)
It is used to evaluate the similarity between the actual tumor image pixels and the predicted tumor image pixels using Eq. (33):
False Positive Rate (FPR)
It is used to evaluate the ratio between correctly identified pixels of brain image to wrongly identified pixels of brain image using Eq. (34):
False Negative Rate (FNR)
It is used to evaluate the positive proportion value but negative pixel value is identified using
Performance metric based on error rate of the Root Mean Square Error (RMSE), Signal-to-Noise-Ratio (SNR), Peak Signal-to-Noise-Ratio (PSNR), and Mean Absolute Error (MAE). The error rate value is calculated as fro Eqs. (36) to (37).
:
Speckle Suppression Index Value (SSI)
Speckle Suppression and Mean Preservation Index (SMPI)
where,
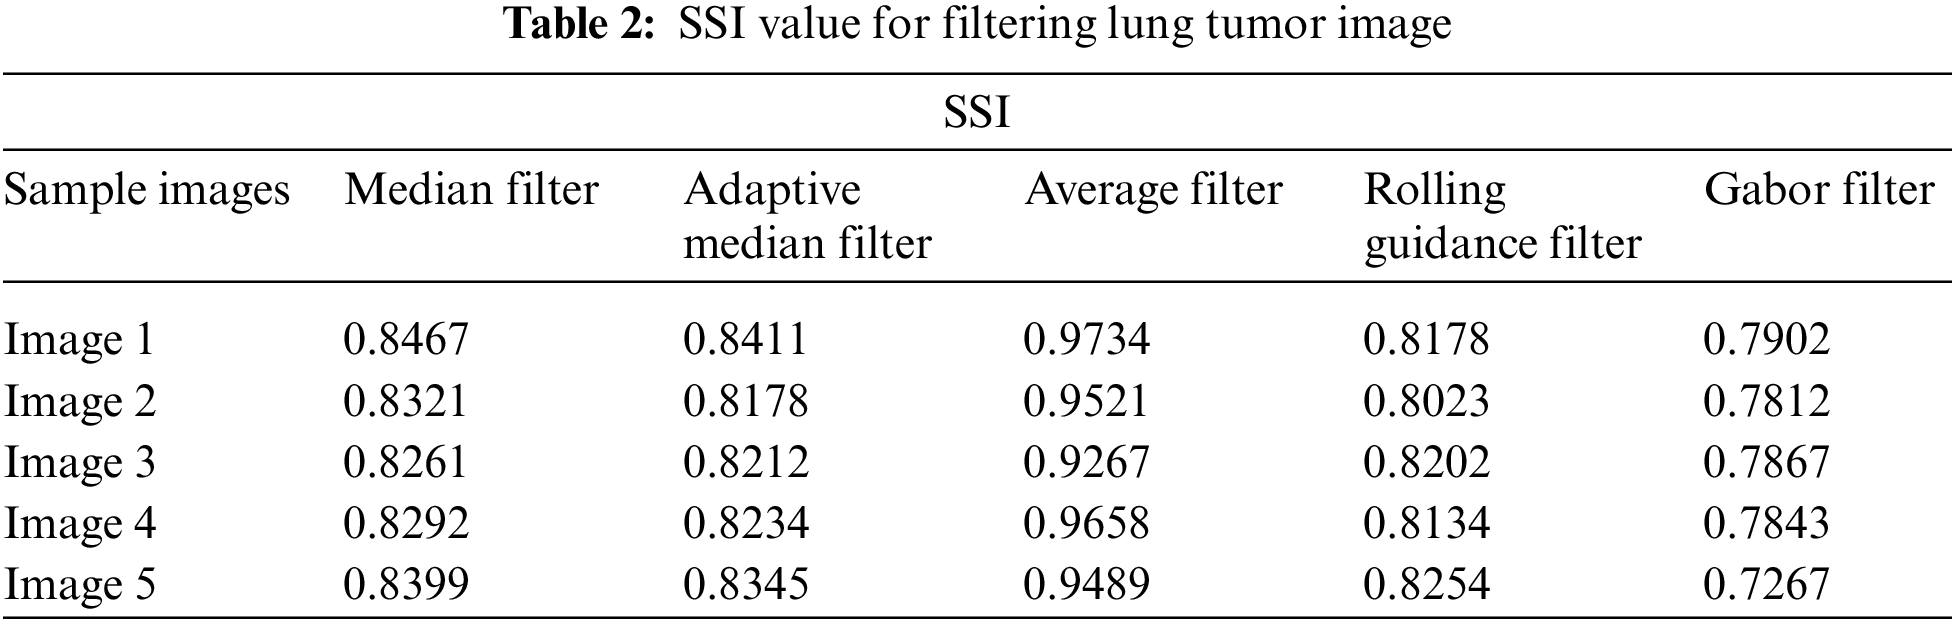
Tab. 2 shows the performance of median filter, adaptive median filter, average filter, rolling guidance filter and Gabor filter with gaussian rule that are applied. Here Gabor filter shows very good performance in suppressing the noise of speckle over the other filters. Gabor filter undergoes various frequency and orientation which enhance the image for the further process. Tab. 3 shows the SMPI index value for the filtering image.
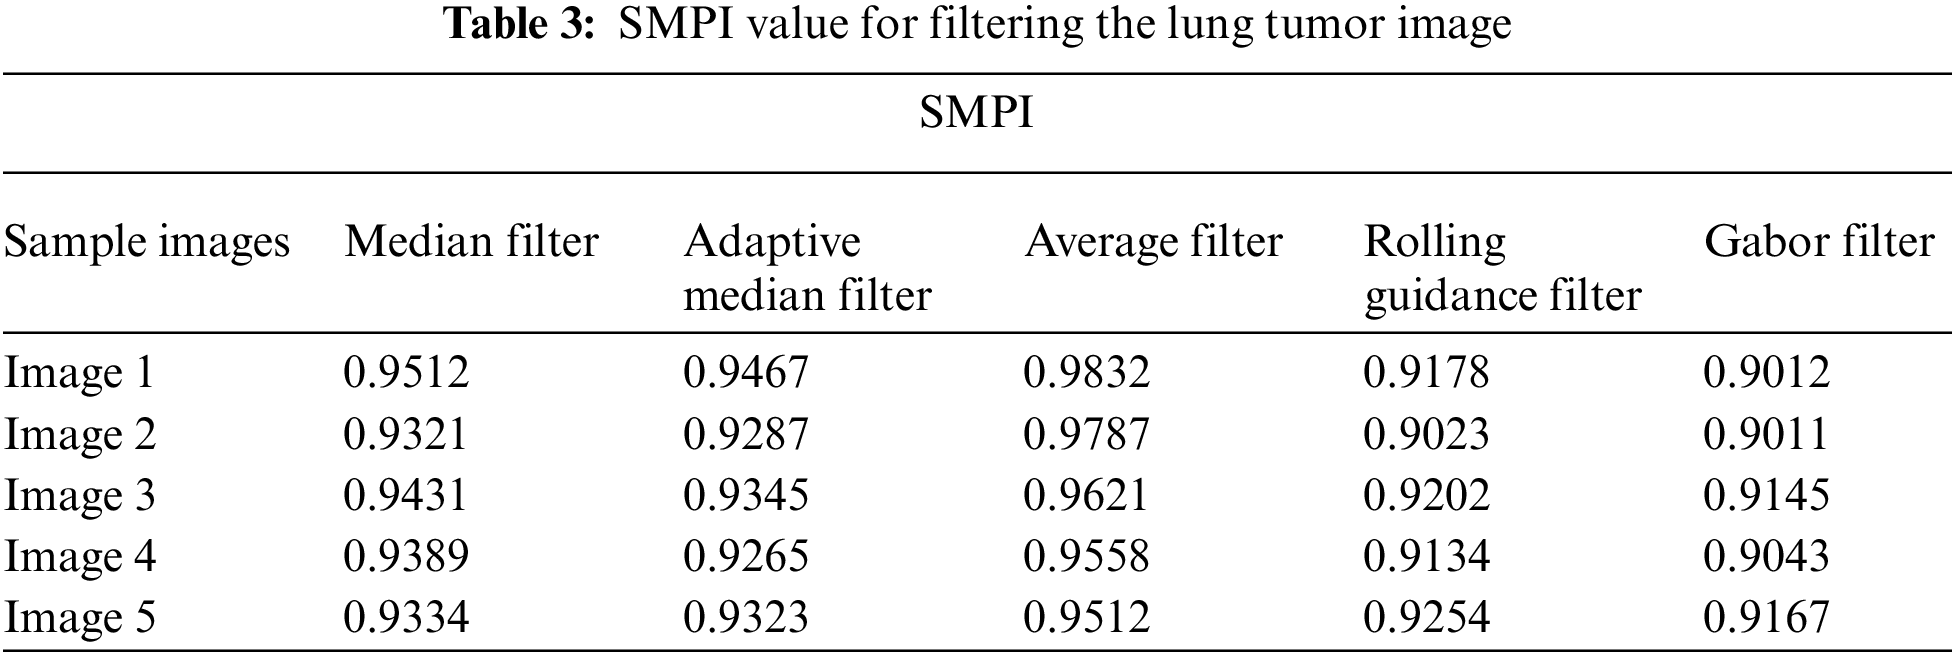
Tab. 3 shows the performance of median filter, adaptive median filter, average filter rolling guidance filter and Gabor filter with gaussian rule that are applied. Gabor filter got good performance in filtering the noise in the image as well as it enhances the contrast of the image. Fig. 3 shows the sample images after applying the filtering.
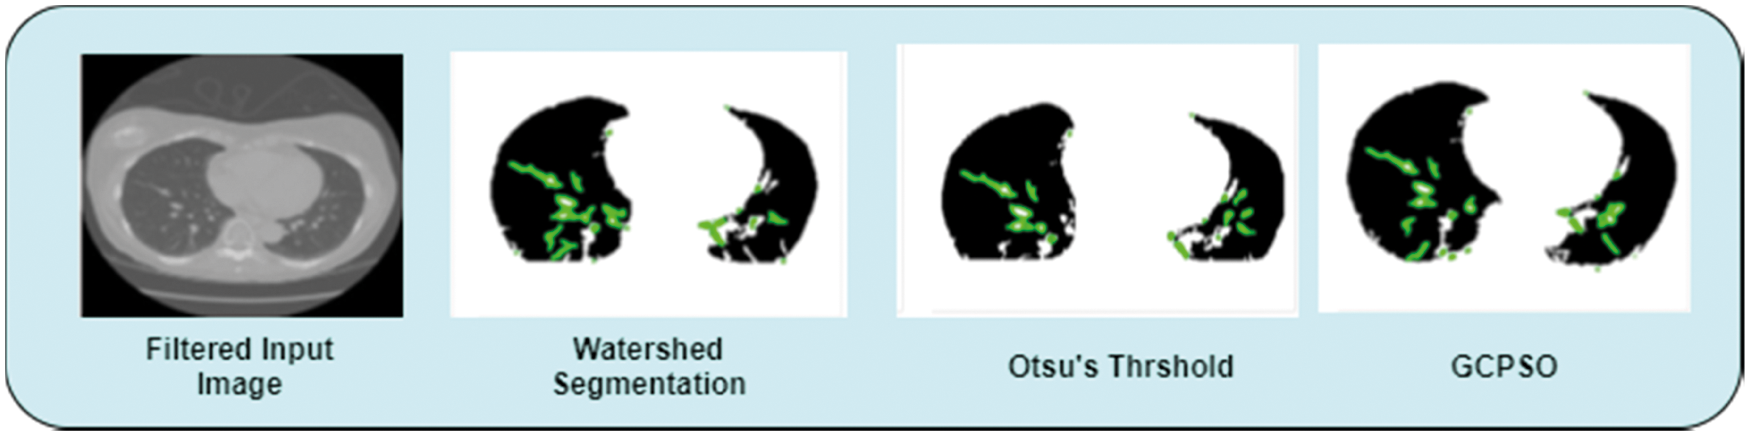
Figure 3: Segmentation
In the segmentation process, this work has implemented the Guaranteed Convergence Particle Swarm Optimization Algorithm (GCPSOA). This work is compared with the existing segmentation techniques of the watershed, Otsu threshold algorithm [32,33]. Moreover, GCPSO algorithm is based on the population and searching for the best solution. It uses the velocity as an impartial value of the function. Update its velocity value when the particle comes closer to the best solution. Fig. 3 shows the segmentation of the lung tumor detection output using GCPSO algorithm.
This work has implemented the Binary Grasshopper Optimization Algorithm (BGOA) for feature selection of lung tumor image. Tab. 4 shows the sensitivity, specificity and precision performance comparison using various feature of selection techniques such as Particle Swarm Optimization Algorithm (PSOA), K-means Clustering (KmC) and BGOA.
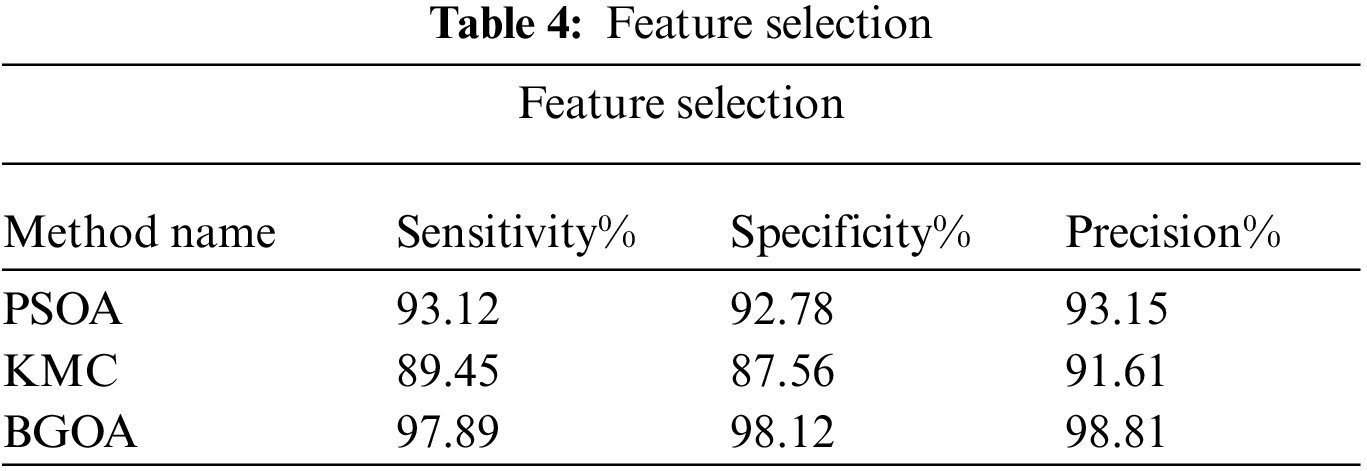
Tab. 4 shows sensitivity, specificity and precision which provide the best performances for BGO algorithm compared to the existing algorithms. BGOA provides the optimized features selection of the lung tumor image.
Fig. 4 shows the accuracy rate of BGOA that outperforms when compared to the other existing algorithms in the selection of features from the lung tumor images.
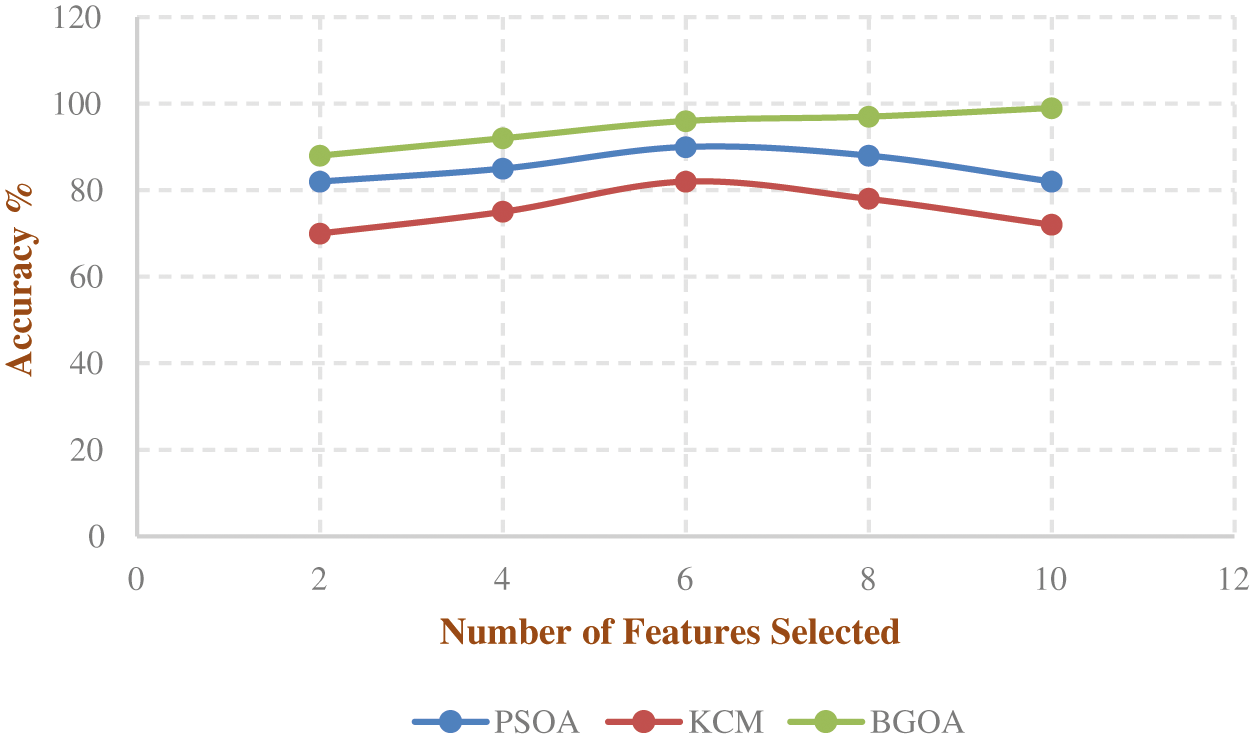
Figure 4: Accuracy rate of feature selection
The proposed ASPP-Unet-WOA technique is accurately identified from the lung tumor image. Gabor filter with Gaussian rule is used to remove the noise from the images. Using Guaranteed Convergence Particle Swarm Optimization Algorithm (GCPSOA) is used to segment the lung tumor from the pre-processed image. After segmentation, BGOA is used to select the relevant features from the CT lung image, and it enhances the classification accuracy. After feature selection process, the selected features are provided to the ASPP-Unet-WOA classifier to detect the lung tumor.
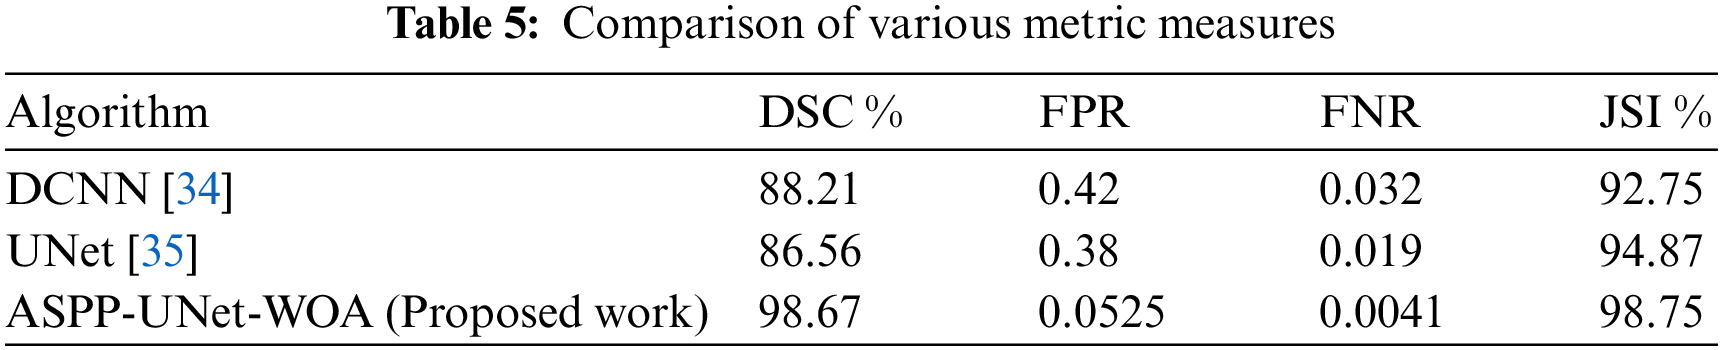
The proposed work is compared with the existing classifiers of DCNN, CNN, UNet. Tab. 4 shows the performance metric measures of DSC, FPR, FNR and JSI using Eqs. (30) to (35).
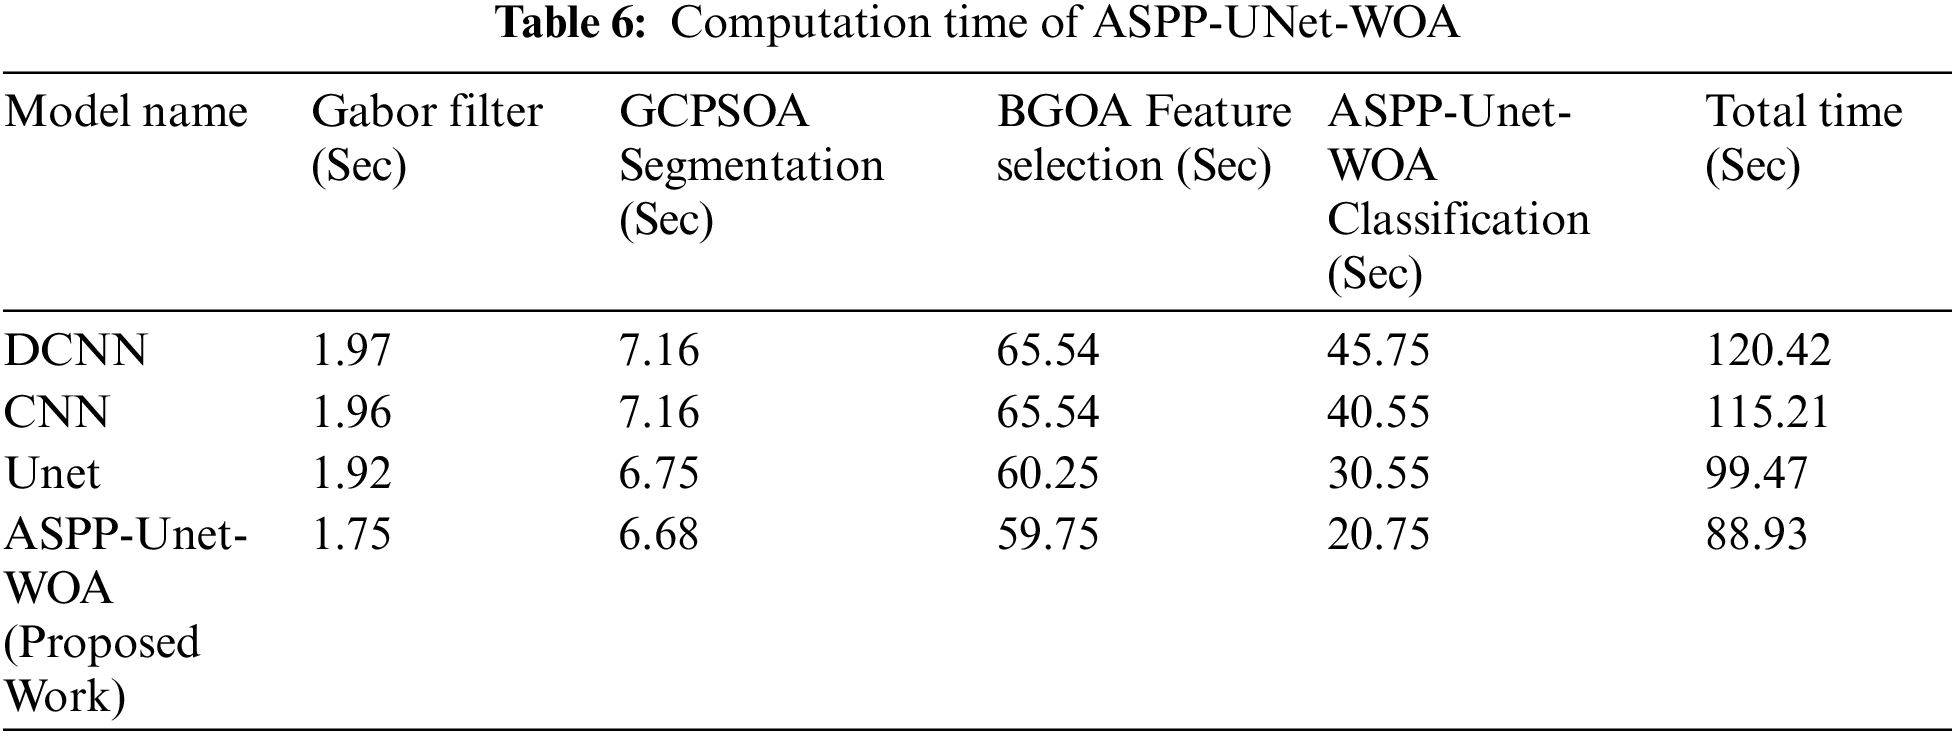
Tab. 5 shows the analysis of various metric measures that produce the best performance compared to the other existing approach. The metric measure of DSC value is highly achieved as 98.67% compared with DCNN of 88.21%, CNN of 84.78%, and UNet is 86.56%. FPR rate proposed algorithm has secured 0.0525 rate and FNR rate is 0.0041 compared to the existing model. JACCARD Similarity Index (JSI) measure has got 98.75%. Tab. 5 shows the computation time of the proposed work ASPP-UNet-WOA at various stages.
From the Tab. 5. it is observed that the computation times on running the detection of tumor program in DCNN, CNN, UNet and ASPP-UNet-WOA approaches are provided. The robustness of ASPP-UNet-WOA performs well better in both the aspects of accuracy and the time taken for computation. Fig. 5 shows the accuracy rate of classifier model.
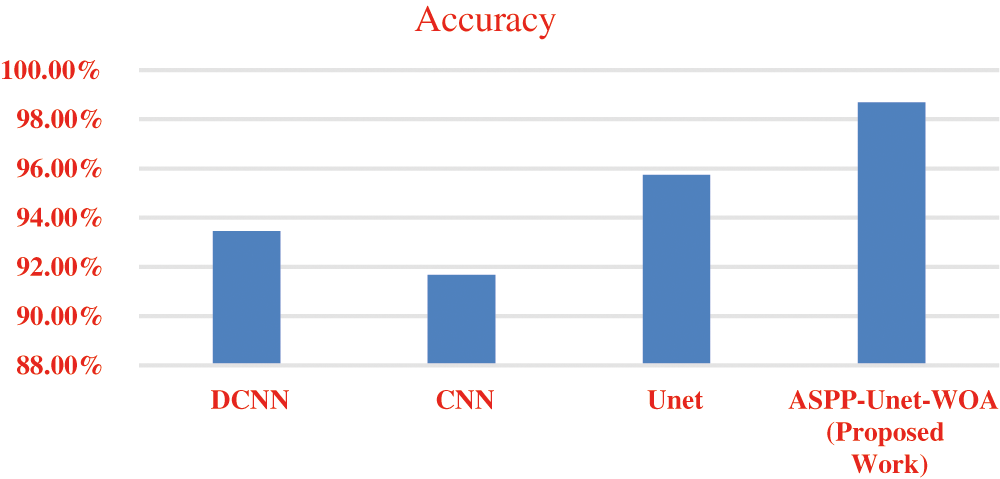
Figure 5: Accuracy
Fig. 5 shows the accuracy rate of proposed work ASPP-UNet-WOA technique Tab. 6. This proposed study outperforms with the other existing algorithms in the early detection of lung tumor. Tab. 7 shows the comparison of the proposed work with the existing scheme.
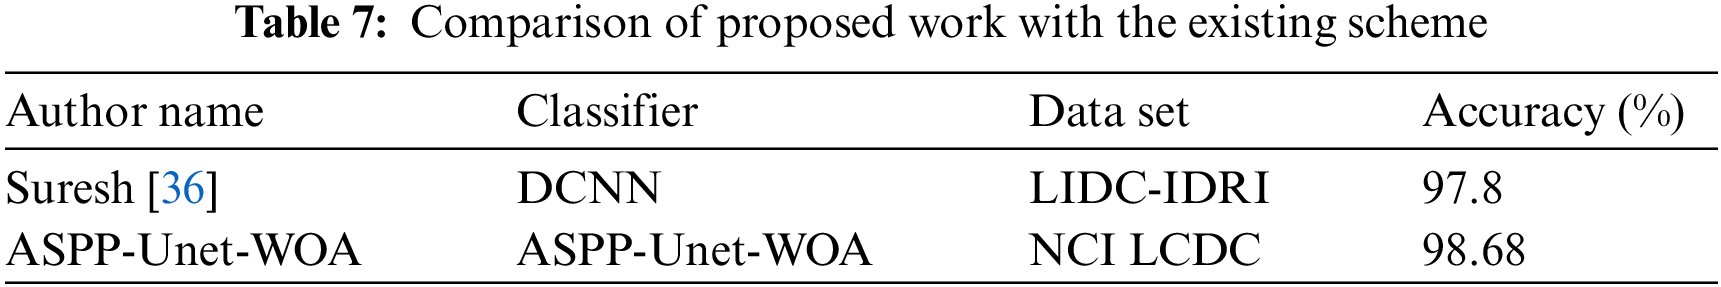
From the Tab. 7. it is observed that the proposed scheme has obtained the best accuracy for NCI LCDC dataset compared to the existing methods. The comparison performance metrics of accuracy, sensitivity, specificity, FPR, and FNR are better for the proposed method compared to the existing techniques. From these results, it is stated that the proposed ASPP-Unet-WOA method is the best selection for the early diagnosis of lung tumor.
From the Fig. 6. it is observed that PSNR value must be increased and MAE value must be decreased for the best detection of tumor image. The proposed approach gives the better error rate value on the basis of accuracy. In the proposed work, the value of PSNR gets increased and the value of MAE gets decreased compared to the other existing techniques.
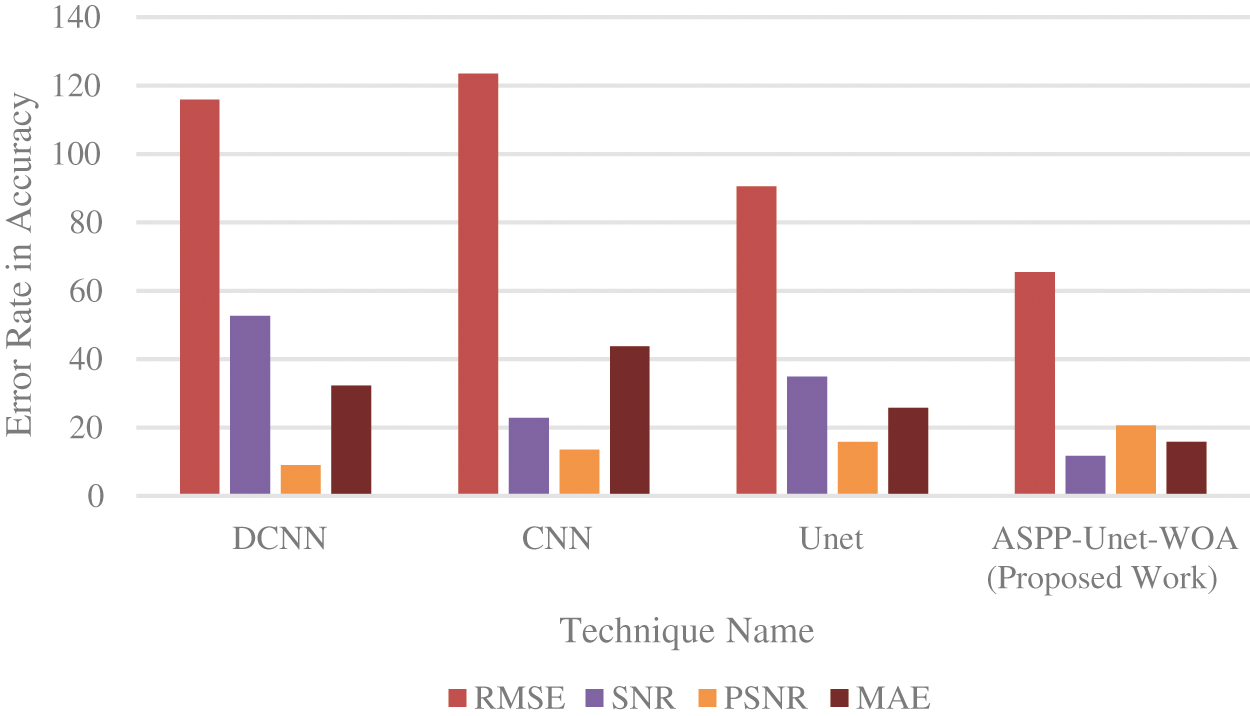
Figure 6: Error rate in accuracy
This paper presents the detection of lung tumor using ASPP-UNet with whale optimization algorithm. Diagnosis at the early stage can decrease the death rate. In this paper, ASPP-UNet-WOA has proposed various processes like pre-processing, segmentation, feature selection and classification or detection of tumor in the CT lung image. In the pre-processing stage, Gabor filter with Gaussian rule is used. Then Guaranteed Convergence Particle Swarm Optimization Algorithm (GCPSOA) is used for the segment of tumor part in the CT lung image. After the segmentation process, the relevant features are selected using BGOA technique. These optimized features are provided to the classifier of ASPP-UNet-WOA and lung tumor is effectively detected. This paper collected the dataset from NCI lung cancer database consortium. The accuracy of DCNN is 93.45%, CNN is 91.67%, UNet obtains 95.75% and ASPP-UNet-WOA obtains 98.68%. For the future studies, the proposed work can be extended to the diagnosis strategies.
Acknowledgement: The authors would like to acknowledge the support of Prince Sultan University for paying the Article Processing Charges (APC) of this publication.
Funding Statement: The authors extend their appreciation to the Deanship of Scientific Research at King Khalid University for funding this work under Grant Number (GRP/303/42). https://www.kku.edu.sa Princess Nourah bint Abdulrahman University Researchers Supporting Project Number (PNURSP2022R203), Princess Nourah bint Abdulrahman University, Riyadh, Saudi Arabia.
Conflicts of Interest: The authors declare that they have no conflicts of interest to report regarding the present study.
1. S. N. Mazhir, A. H. Ali, F. W. Hadi and A. N. Mazher, “Studying the effect of dielectric barrier discharges on the leukemia blood cells using digital image processing,” IOSR Journal of Pharmacy & Biological Sciences, vol. 12, no. 2, pp. 6–12, 2017. [Google Scholar]
2. M. P. Beham and A. Gurulakshmi, “Morphological image processing approach on the detection of tumor and cancer cells,” in Proc. Int. Conf. on Distributed Computing Systems(ICDCS), Coimbatore, India, pp. 350–354, 2012. [Google Scholar]
3. D. Gutman, N. Codella, E. Celebi, B. Helba, M. Marchetti et al., “Skin lesion analysis toward melanoma detection,” in Proc. Int. Symp. on Biomedical Imaging(ISBI), IEEE, Prague, Czech Republic, pp. 96–109, 2016. [Google Scholar]
4. Q. Song, L. Zhao, X. Luo and X. Dou, “Using deep learning for classification of lung nodules on computed tomography images,” Journal of Healthcare Engineering, vol. 2017, 2017. [Google Scholar]
5. T. Paulraj and K. S. Chellliah, “Computer aided diagnosis of lung cancer in computed tomography scans: A review,” Current Medical Imaging, vol. 14, no. 3, pp. 374–388, 2018. [Google Scholar]
6. N. Petrick, B. Sahiner, S. G. Armato, A. Bert, L. Correale et al., “Evaluation of computer-aided detection and diagnosis systems,” Medical Physics, vol. 40, no. 8, pp. 087001, 2013. [Google Scholar]
7. E. L. Henriksen, J. F. Carlsen, I. M. Vejborg, M. B. Nielsen and C. A. Lauridsen, “The efficacy of using computer-aided detection (CAD) for detection of breast cancer in mammography screening: A systematic review,” Acta Radiologica, vol. 60, no. 1, pp. 13–18, 2019. [Google Scholar]
8. T. Manikandan, N. Bharathi, M. Sathish and V. Asokan, “Hybrid neuro-fuzzy system for prediction of lung diseases based on the observed symptom values,” Journal of Chemical and Pharmaceutical Sciences, vol. 974, pp. 2115, 2017. [Google Scholar]
9. L. Caravatta, G. Macchia, G. C. Mattiucci, A. Sainato, N. L. Cernusco et al., “Inter-observer variability of clinical target volume delineation in radiotherapy treatment of pancreatic cancer: A multi-institutional contouring experience,” Radiation Oncology, vol. 9, no. 1, pp. 1–9, 2014. [Google Scholar]
10. K. Kavin Kumar, M. Devi and S. Maheswaran, “An efficient method for brain tumor detection using texture features and SVM classifier in MR images,” Asian Pacific Journal of Cancer Prevention: APJCP, vol. 19, no. 10, pp. 2789, 2018. [Google Scholar]
11. M. Shanmugam, S. Nehru and S. Shanmugam, “A wearable embedded device for chronic low back patients to track lumbar spine position,” Biomedical Research, pp. 1–12, 2018. [Google Scholar]
12. R. Arulmurugan and H. Anandakumar, “Early detection of lung cancer using wavelet feature descriptor and feed forward back propagation neural networks classifier,” in Proc. Computational Vision and Bio Inspired Computing, Springer, Champ, India, pp. 103–110, 2018. [Google Scholar]
13. P. Moradi and M. Jamzad, “Detecting lung cancer lesions in CT images using 3D convolutional neural networks,” in Proc. 2019 4th Int. Conf. on Pattern Recognition and Image Analysis (IPRIA), IEEE, Tehran, Iran, pp. 114–118, 2019. [Google Scholar]
14. Q. Zhang and X. Kong, “Design of automatic lung nodule detection system based on multi-scene deep learning framework,” IEEE Access, vol. 8, pp. 90380–90389, 2020. [Google Scholar]
15. A. Asuntha and A. Srinivasan, “Deep learning for lung cancer detection and classification,” Multimedia Tools and Applications, vol. 79, no. 11, pp. 7731–7762, 2020. [Google Scholar]
16. O. Ozdemir, R. L. Russell and A. A. Berlin, “A 3D probabilistic deep learning system for detection and diagnosis of lung cancer using low-dose CT scans,” IEEE Transactions on Medical Imaging, vol. 39, no. 5, pp. 1419–1429, 2019. [Google Scholar]
17. M. Vas and A. Dessai, “Lung cancer detection system using lung CT image processing,” in Proc. 2017 Int. Conf. on Computing, Communication, Control and Automation (ICCUBEA), IEEE, Pune, India, pp. 1–5, 2017. [Google Scholar]
18. A. Teramoto, T. Tsukamoto, Y. Kiriyama and H. Fujita, “Automated classification of lung cancer types from cytological images using deep convolutional neural networks,” BioMed Research International, vol. 2017, 2017. [Google Scholar]
19. M. Šarić, M. Russo, M. Stella and M. Sikora, “CNN-Based method for lung cancer detection in whole slide histopathology images,” in Proc. 2019 4th Int. Conf. on Smart and Sustainable Technologies, IEEE, Split, Croatia, pp. 1–4, 2019. [Google Scholar]
20. M. S. Rahman, P. C. Shill and Z. Homayra, “A new method for lung nodule detection using deep neural networks for CT images,” in Int. Conf. on Electrical, Computer and Communication Engineering (ECCE), pp. 1–6, 2019, 2019. [Google Scholar]
21. J. Alam, S. Alam and A. Hossan, “Multi-stage lung cancer detection and prediction using multi-class svm classifie,” in Proc. Int. Conf. on Computer, Communication, Chemical, Material and Electronic Engineering(IC4ME2), Rajshahi, Bangladesh, pp. 1–4, 2018. [Google Scholar]
22. S. Shanthi and N. Rajkumar, “Lung cancer prediction using stochastic diffusion search (SDS) based feature selection and machine learning methods,” Neural Processing Letters, vol. 53, no. 4, pp. 2617–2630, 2021. [Google Scholar]
23. Y. Xie, Y. Xia, J. Zhang, Y. Song, D. Feng et al., “Knowledge-based collaborative deep learning for benign-malignant lung nodule classification on chest CT,” IEEE Transactions on Medical Imaging, vol. 38, no. 4, pp. 991–1004, 2018. [Google Scholar]
24. J. Esther and M. Mohamed Sathik, “An analytical study on query integration in image retrieval system,” International Journal of Advanced Research in Computer Science, vol. 3, no. 2, 2012. [Google Scholar]
25. M. Sajjad, S. Khan, K. Muhammad, W. Wu, A. Ullah et al., “Multi-grade brain tumor classification using deep CNN with extensive data augmentation,” Journal of Computational Science, vol. 30, pp. 174–182, 2019. [Google Scholar]
26. P. Surendar, “Diagnosis of lung cancer using hybrid deep neural network with adaptive sine cosine crow search algorithm,” Journal of Computational Science, vol. 53, pp. 101374, 2021. [Google Scholar]
27. K. Senthil Kumar, K. Venkatalakshmi and K. Karthikeyan, “Lung cancer detection using image segmentation by means of various evolutionary algorithms,” Computational and Mathematical Methods in Medicine, vol. 2019, 2019. [Google Scholar]
28. V. A. Devi, “Detection of novel coronavirus (nCov-2019) using lung CT scan by marker-based watershed segmentation method,” International Journal of Innovative Research in Applied Sciences and Engineering, vol. 4, no. 5, pp. 766–780, 2020. [Google Scholar]
29. S. Uzelaltinbulat and B. Ugur, “Lung tumor segmentation algorithm,” Procedia Computer Science, vol. 120, pp. 140–147, 2017. [Google Scholar]
30. M. F. Serj, B. Lavi, G. Hoff and D. P. Valls, “A deep convolutional neural network for lung cancer diagnostic,” Arxiv Preprint Arxiv:1804.08170, 2018. [Google Scholar]
31. B. A. Skourt, A. ElHassani and A. Majda, “Lung CT image segmentation using deep neural networks,” Procedia Computer Science, vol. 127, pp. 109–113, 2018. [Google Scholar]
32. S. Suresh and S. Mohan, “NROI based feature learning for automated tumor stage classification of pulmonary lung nodules using deep convolutional neural networks,” Journal of King Saud University-Computer and Information Sciences, 2019. [Google Scholar]
33. S. Lakshmanaprabu, S. N. Mohanty, K. Shankar, N. Arunkumar and G. Ramirez, “Optimal deep learning model for classification of lung cancer on CT images,” Future Generation Computer Systems, vol. 92, pp. 374–382, 2019. [Google Scholar]
34. A. O. Carvalho Filho, A. C. Silva, A. C. de Paiva, R. A. Nunes and M. Gattass, “Classification of patterns of benignity and malignancy based on CT using topology-based phylogenetic diversity index and convolutional neural network,” Pattern Recognition, vol. 81, pp. 200–212, 2018. [Google Scholar]
35. Y. Xie, J. Zhang, Y. Xia, M. Fulham and Y. Zhang, “Fusing texture, shape and deep model-learned information at decision level for automated classification of lung nodules on chest CT,” Information Fusion, vol. 42, pp. 102–110, 2018. [Google Scholar]
36. W. Shen, M. Zhou, F. Yang, C. Yang and J. Tian, “Multi-scale convolutional neural networks for lung nodule classification,” in Proc. Information Processing in Medical Imaging(IPMI), Sabhal Mor Ostaig, Isle of Skye, United Kingdom, pp. 588–599, 2015. [Google Scholar]
 | This work is licensed under a Creative Commons Attribution 4.0 International License, which permits unrestricted use, distribution, and reproduction in any medium, provided the original work is properly cited. |