DOI:10.32604/cmc.2022.024676
| Computers, Materials & Continua DOI:10.32604/cmc.2022.024676 | |
| Article |
An Integrated Framework for Cloud Service Selection Based on BOM and TOPSIS
Computer and Systems Engineering Department, Faculty of Engineering at Helwan, Helwan University, Cairo, 11795, Egypt
*Corresponding Author: Ahmed M. Mostafa. Email: AHMED_YOUSSEF01@h-eng.helwan.edu.eg
Received: 27 October 2021; Accepted: 12 January 2022
Abstract: Many businesses have experienced difficulties in selecting a cloud service provider (CSP) due to the rapid advancement of cloud computing services and the proliferation of CSPs. Many independent criteria should be considered when evaluating the services provided by different CSPs. It is a case of multi-criteria decision-making (MCDM). This paper presents an integrated MCDM cloud service selection framework for determining the most appropriate service provider based on the best only method (BOM) and technique for order of preference by similarity to ideal solution (TOPSIS). To obtain the weights of criteria and the relative importance of CSPs based on each criterion, BOM performs pairwise comparisons of criteria and also for alternatives on each criterion, and TOPSIS uses these weights to rank cloud alternatives. An evaluation and validation of the proposed framework have been carried out through a use-case model to prove its efficiency and accuracy. Moreover, the developed framework was compared with the analytical hierarchical process (AHP), a popular MCDM approach, based on two perspectives: efficiency and consistency. According to the research results, the proposed framework only requires 25% of the comparisons needed for the AHP approach. Furthermore, the proposed framework has a CR of 0%, whereas AHP has 38%. Thus, the proposed framework performs better than AHP when it comes to computation complexity and consistency, implying that it is more efficient and trustworthy.
Keywords: Cloud computing (CC); multiple-criteria decision-making (MCDM); cloud service providers (CSPs); analytical hierarchical process (AHP); the best only method (BOM); technique for order of preference by similarity to ideal solution (TOPSIS)
Cloud computing [1] is critical for start-ups and small businesses that want to launch a low-cost business model. The concept describes a novel utility computing type for providing customers with storage, computing resources, platforms, software, etc., on a pay-per-use basis through the Internet [2]. Its primary goal is to deliver services ranging from computing resources to applications through the Internet that is accessible at any time and from any location. The advantages of cloud hosting, such as scalability, flexibility, and dependability, have driven businesses to rely on it for their enterprises, resulting in an exponential increase in cloud customers [3]. Cloud computing consists of three parts: (i) cloud service providers (CSPs), (ii) data owners, and (iii) users. CSP acts as the central authority in a cloud environment by controlling all operations. The cloud server holds data stored by data owners, while users can access this data and services [4,5]. Numerous CSPs have made it challenging for customers to the most appropriate CSP that meets their functional and non-functional needs [6]. CSPs should be assessed against a set of quality-of-service (QoS) metrics, along with a method for ranking them based on those metrics to select the best provider [7]. Consequently, the world’s largest organizations have formed the cloud services measurement initiative consortium (CSMIC) [8], which aims to standardize the QoS metrics used to evaluate the quality of service offered by CSPs. The CSMIC developed a model known as the service measurement index (SMI), which includes seven primary criteria such as usability and security. Each criterion was subdivided into several sub-criteria. Cloud customers use these criteria to evaluate different CSPs. Thus, choosing a cloud service provider requires multiple-criteria decision-making (MCDM). The goal of MCDM is to evaluate and rank alternatives (CSPs) based on the selected criteria [9]. Cloud customers will find it incredibly challenging to select the most appropriate CSP based on their preferences due to many existing CSPs and the wide range of evaluating criteria. The selection of cloud services has been the subject of several recent studies [10–12]. Even though these studies have been validated thoroughly, they still have flaws, including low comparison consistency and increased processing complexity, which remain major issues in the selection of cloud services. A consistent, robust, and computationally efficient MCDM framework is presented in this paper. In order to rank the available CSPs, the proposed framework combines the TOPSIS technique and our developed BOM method. The BOM is used to determine the relative weights of alternatives and the weights of criteria. These weights are used by TOPSIS to rank cloud alternatives. Fig. 1 shows the structure of the proposed integrated framework and its interaction with cloud customers and decision-makers.
The proposed integrated framework was validated using a use-case model, demonstrating its efficiency and consistency. In addition, it was compared with the AHP method. Results clearly demonstrate that the proposed framework is robust, efficient, and entirely consistent compared to the AHP method.
The rest of the paper is organized as follows: AHP and TOPSIS methods are discussed in Section 2, and related work is presented in Section 3. A detailed description of the proposed integrated framework is provided in Section 4. In Section 5, experimental results using a use-case model are presented. Section 6 provides an evaluation of our proposed framework and compares it to AHP. Section 7 concludes the paper.
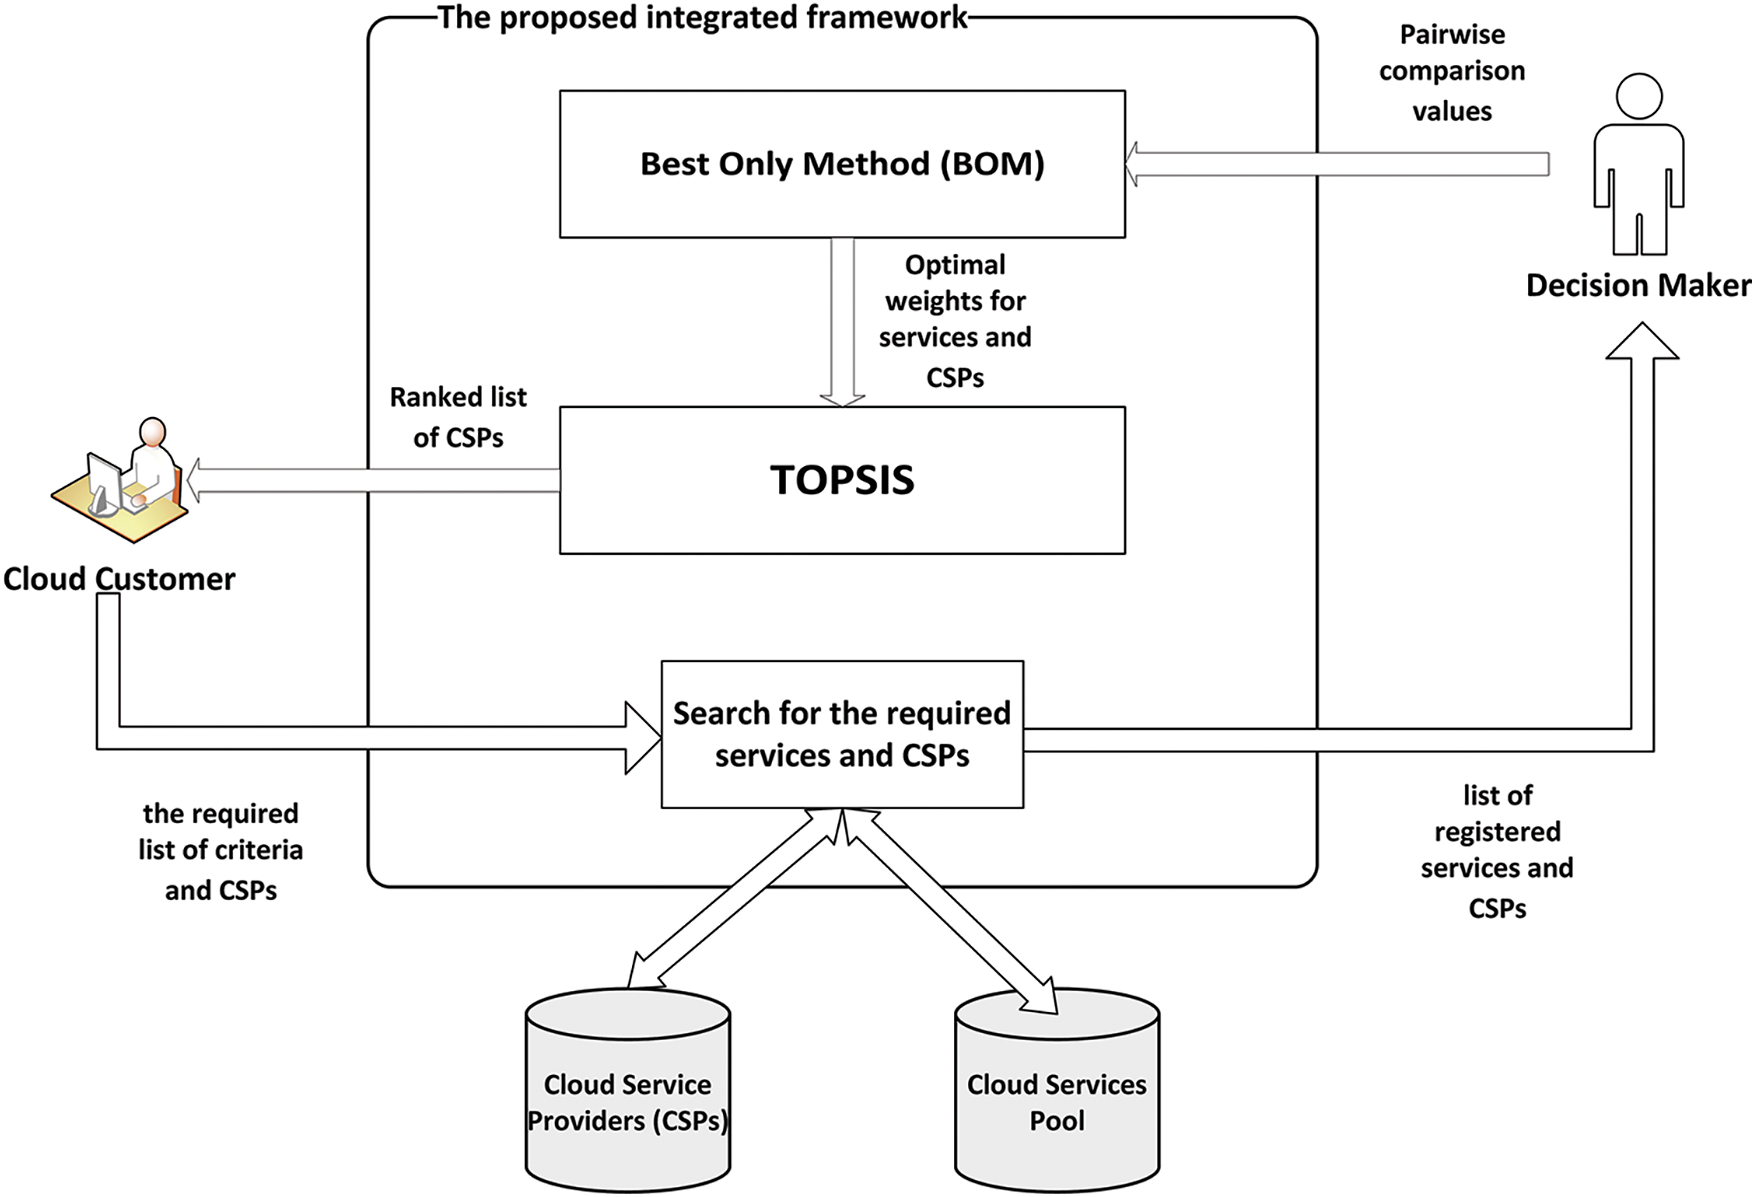
Figure 1: The proposed framework
For solving complex decisions, Saaty’s AHP is one of the most commonly used methods [13–15]. Specifically, it identifies the goals, the criteria, the subcriteria, and the alternatives for solving a problem. In choosing the best alternative, the AHP allows both objective and subjective factors to be considered, mainly when the subjective preferences of decision-makers play a significant role [16,17]. Three components underlie the AHP method: decomposition, comparative judgments, and prioritization. Based on the principle of decomposition, a problem may be viewed as a hierarchical system. The first level represents the overall objective, while the subsequent levels represent the criteria and alternatives. A comparative judgment is made by comparing elements at each level relative to one element at the next upper level, beginning at the first level of the hierarchy and proceeding downward. A set of preference matrices are produced due to comparing elements at each level [18]. Saaty’s scale of relative preference provides the decision-maker with the basis for their judgments [19].
Let us suppose that we have n criteria
where:
The decision-maker is presumed to be consistent in his/her judgments concerning any pair of alternatives. Furthermore, when compared with themselves, all alternatives are ranked equally. Thus, we have
As demonstrated in [13], if matrix “A” is perfectly consistent, Eq. (1) can be rewritten as follows:
where
Accordingly, n is referred to as the principal eigenvalue of matrix “A”, and its eigenvector is
When making real-world decisions, we are unable to specify the precise values of
Here, matrix “A” is inconsistent although still reciprocal, and its principal eigenvalue is
The weight values of the criteria may now be determined by solving Eqs. (4) and (5). After calculating the overall score value for each alternative, the next step is to determine the ranking of these alternatives according to this score. Based on the following formula on (6), final alternative scores were obtained:
where
The consistency index (CI) is calculated as the negative average of the other roots of the characteristic polynomial of matrix “A” using the following formula [13]:
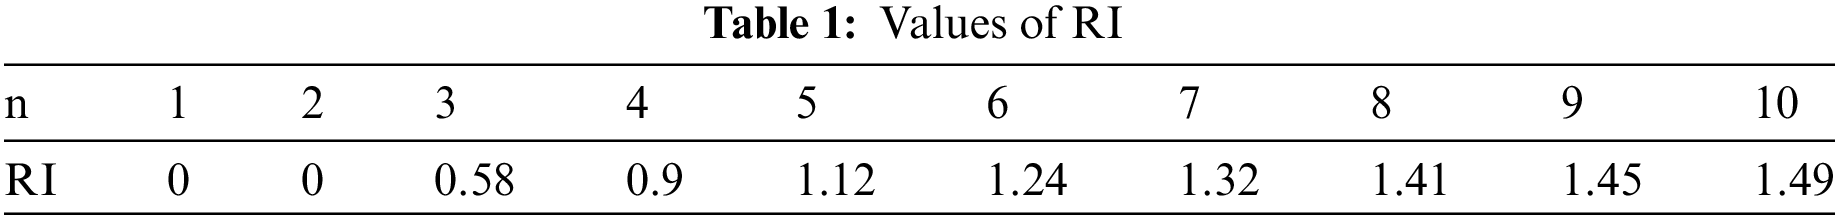
A random index (RI) is similar to CI, except it is calculated as an average over many matrices of the same order that are reciprocal and constructed with random entries. The RI values corresponding to each value of n are given in Tab. 1 [20].
According to the AHP method, consistency ratio (CR), a measure of the reliability of an MCDM method’s output, can be computed as follows:
According to [13], if the consistency ratio of matrix “A” is less than or equal to 10%, the estimate is considered valid. Otherwise, consistency should be improved. If CR = 0, then values in matrix “A” are entirely consistent, and the following property is met for all of its elements [21]:
Compared with other multi-criteria approaches, AHP provides flexibility, simplicity, and the capability to detect inconsistencies. However, the disadvantage of AHP is that it requires a substantial number of pairwise comparisons equal to
TOPSIS [24] is commonly regarded as one of the popular techniques used to solve MCDM problems. A basic idea of TOPSIS is that the optimal solution should be at the shortest Euclidian distance from the ideal positive solution. At the same time, it needs to be at the longest Euclidian distance from the ideal negative solution [25]. Accordingly, the best alternative is determined based on the Euclidian distance between each alternative and the ideal and the worst alternatives. The TOPSIS steps are outlined below.
Step 1: Construct the decision matrix “D” of size
where
Step 2: As each criterion is of a different type and thus has a different scale, calculate the normalized decision matrix “
where
Step 3: Calculate the weighted matrix “H” based on Eq. (12) by multiplying the
where
Step 4: Utilize the following equations to determine the positive ideal solution (PIS) and the negative ideal solution (NIS):
for beneficial criterion:
and for non-beneficial criterion:
Then:
Step 5: For each alternative, calculate the Euclidian distance
Step 6: Calculate the closeness value for each alternative (
Step 7: Rank the alternatives according to the closeness value. The best alternative is the one with the highest closeness value, which will be the first in the ranked list.
A significant challenge associated with cloud computing has been selecting cloud services due to the large number of providers who offer similar services. For selecting cloud services, MCDM-based methods are the most straightforward and effective. In the literature, there are various MCDM-based cloud service selection frameworks. TOPSIS [25], AHP [26], ANP [27], MAUT [28], ELECTRE [29], SAW [30], and rank voting method [31] are the most common MCDM approaches for cloud service selection in the literature. Kumar et al. [25] developed a cloud service selection framework based on AHP and TOPSIS. They adopted a real-time dataset from CloudHarmony and made extensive sensitivity analyses to validate the model’s efficacy. They conclude that the proposed model is effective when compared to other MCDM techniques. Garg et al. [26] created an AHP-based framework to evaluate cloud services based on various applications depending on QoS requirements. Such a framework can create healthy competition among Cloud providers to satisfy their Service Level Agreement (SLA) and improve their QoS. Tripathi et al. [27] incorporated the analytic network process (ANP) into the ranking component of the SMI framework. The interactions among the criteria in this method are used to rank cloud services. The proposed model’s limitation is the number of selection criteria; if this number grows too large, it becomes difficult to keep track of all the interactions between them. Dyer [28] presents a summary of multiattribute utility theory and discusses the problem of multiattribute decisions. Dyer explores the use of multiattribute preference functions under uncertain and risky conditions to decompose them into additive and multiplicative forms. Various forms of multi-attribute preference functions are studied in relation to one another. The relationships between these various types of multi-attribute preference functions are investigated. Govindan et al. [29] thoroughly reviewed English scholarly articles on ELECTRE and ELECTRE-based approaches. This comprises application areas, method modifications, comparisons with other methods, and general research of the ELECTRE methods. The review includes 686 publications in all. Afshari et al. [30] presented an MCDM methodology for Personnel selection. It considers a real application of personnel selection with using the opinion of an expert by one of the decision-making models; it is called the SAW method. The limitation is that it ignores the fuzziness of the executive’s judgment during the decision-making process. Baranwal et al. [31] identified several new QoS measures and described them to allow both the user and the provider to quantify their expectations and offers. They also proposed a dynamic and adaptable methodology that uses a form of the ranked voting method to analyze customers’ needs and recommend the best cloud service provider. Case studies validate the suggested model’s validity and effectiveness. Recent studies have used AHP to evaluate a variety of SaaS services [32,33], IaaS services [34,35], and general cloud services [36,37]. Saaty’s basic 1-9 scale is commonly used to aid users in comparing and evaluating cloud service alternatives. The SMICLOUD framework was developed by Garg et al. [26] to compare and rank three IaaS cloud services using the SMI criteria [38]. According to this paper, the Cloud Service Measurement Initiative Consortium (CSMIC) has determined a set of metrics for measuring the QoS criteria, using which several CSPs are compared. Based on user preferences values, AHP is utilized to compute the weights for criteria, and then these weights are used to compare the three IaaS cloud services. CSPs were only selected based on the quantitative CSMIC criteria without recognizing the non-quantifiable QoS trustworthiness. Godse et al. [39] developed an AHP methodology to rank SaaS services, considering functionality, architecture, usability, vendor reputation, and pricing. Despite the usefulness of AHP, it fails to account for uncertainty in decisions when determining pairwise comparisons. A fuzzy AHP was developed to handle this issue, allowing decision-makers to use fuzzy ranking instead of precise ranking [40]. TOPSIS was used to rank alternatives according to the weights of criteria and alternatives determined by pairwise comparisons applied by AHP. They used the proposed method to assess the trustworthiness of 15 CSPs from several perspectives based on 9 QoS criteria (cost, speed, storage capacity, availability, response time, features, technical support, and ease of use). As a result of our analysis of these papers, we discovered that CSPs were evaluated based on several criteria, which led to more complex pairwise comparisons. Furthermore, most of these criteria are qualitative, resulting in inconsistent results in comparisons and, therefore, less reliable conclusions. This paper proposes a cloud service selection framework based on integrating BOM and TOPSIS methods for selecting the best CSP. In terms of computational complexity and consistency, the proposed framework outperformed AHP, making it more computationally efficient and perfectly consistent.
This paper presents an integrated MCDM framework for selecting cloud computing services. The proposed framework incorporates the BOM method, which is used to calculate criteria weights and the relative weights of alternatives relative to each criterion, and TOPSIS, which uses these weights to produce the ranking for cloud alternatives (CSPs). Using the BOM approach, the decision-maker only determines the best criterion before evaluating that criterion against other criteria through pairwise comparisons. By doing so, all of the matrix’s elements meet the property in (9), and all of its judgments are perfectly consistent. Fig. 2 depicts a flow chart summarizing the steps of the integrated framework.
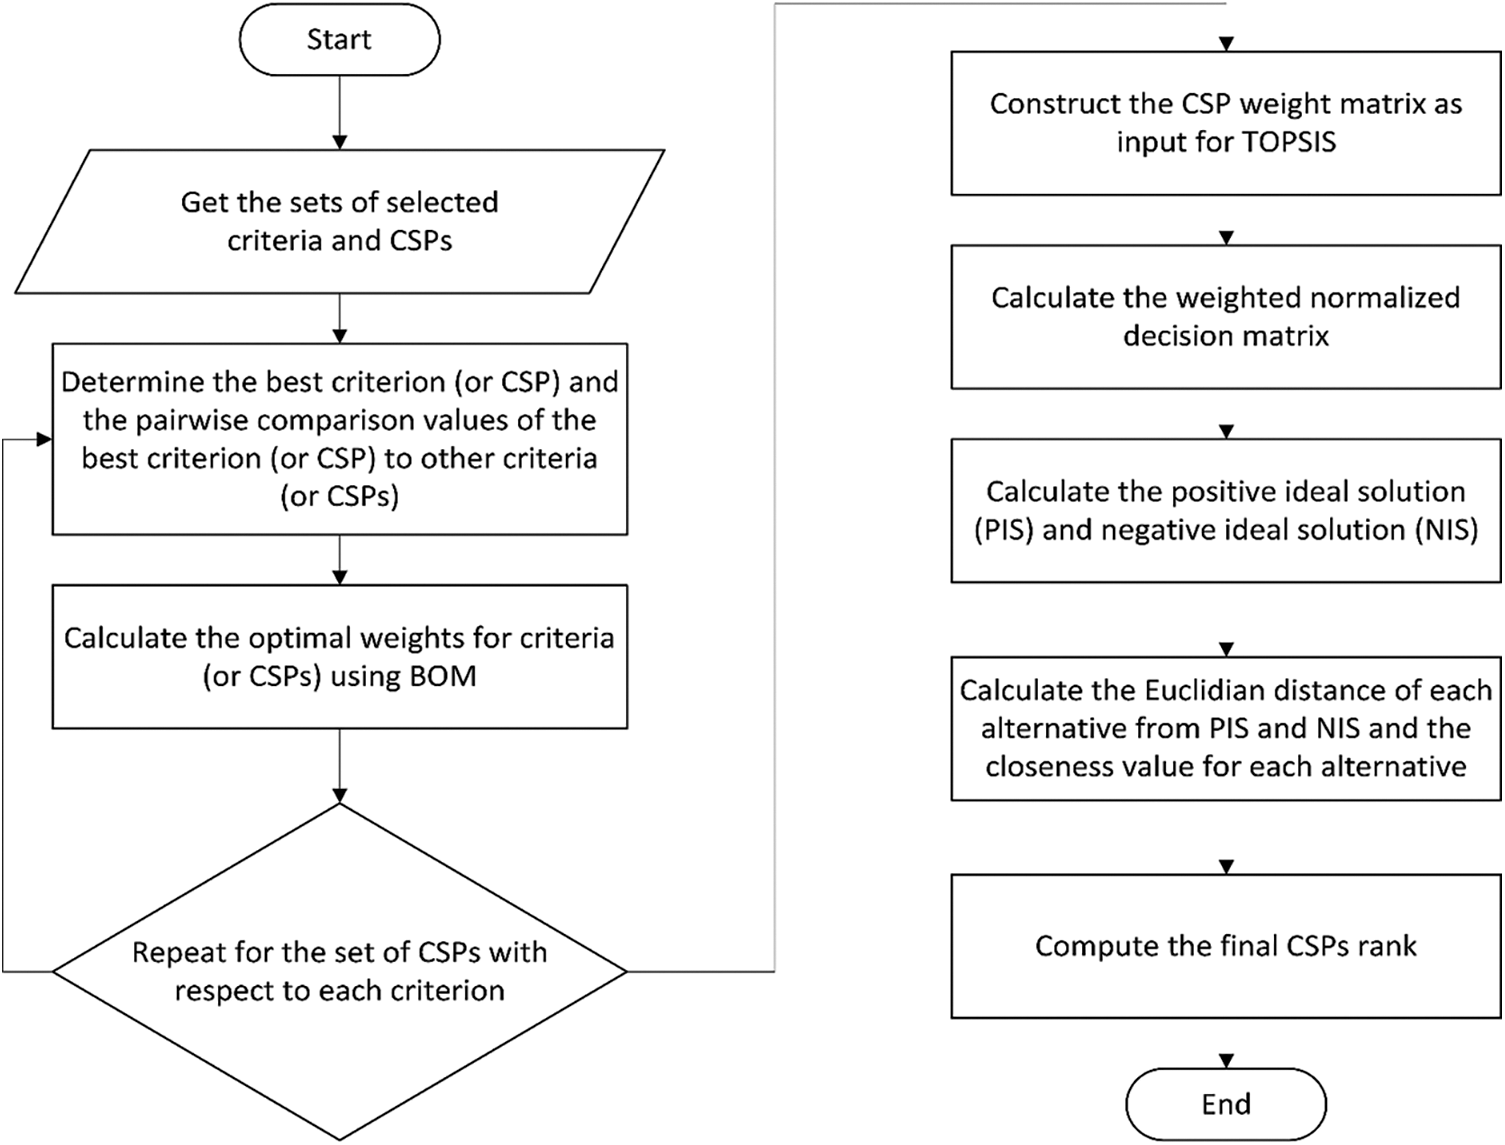
Figure 2: A flowchart showing the stages of the proposed framework
Step 1: (Identify criteria that meet the business needs): Assume that the set of criteria considered is
Step 2: (Identify the appropriate set of CSPs): Assume that the set of CSPs considered is
Step 3: (Identify the best criterion in the set of criteria): Assume that the best criterion selected by the decision-maker is
Step 4: (Estimate the values of the pairwise comparison of the best criterion to the others): Assume that the vector
Step 5: (Calculate the appropriate weights for each criterion): Assume that
Step 6: (Determine the first criterion): Suppose that the first criterion is
Step 7: (Select the best CSP relative to
Step 8: (Set the values of pairwise comparisons of the best CSP relative to
Step 9: (Calculate the weight values of the CSPs w.r.t.
Step 10: (Calculate the weights of CSPs concerning all other remaining criteria): For all remaining criteria, repeat steps 7 through 9.
Step 11: (Develop the matrix of CSP weights): The matrix
Step 12: (Compute the weighted normalized decision matrix H): H is calculated using Eq. (12) by multiplying the weight values of the criteria
Step 13:(Calculate the positive ideal solution (PIS) and negative ideal solution (NIS)): For every criterion
Then, compute the PIS and NIS values using Eqs. (17) and (18).
Step 14: (Calculate the Euclidian distance
Step 15: (Calculate the closeness value for each alternative (
Step 16: (Rank the alternatives in descending order of the closeness value). The best alternative is the one with the highest closeness value.
A use-case model was employed to analyze and validate the proposed framework, which proved its validity and efficacy.
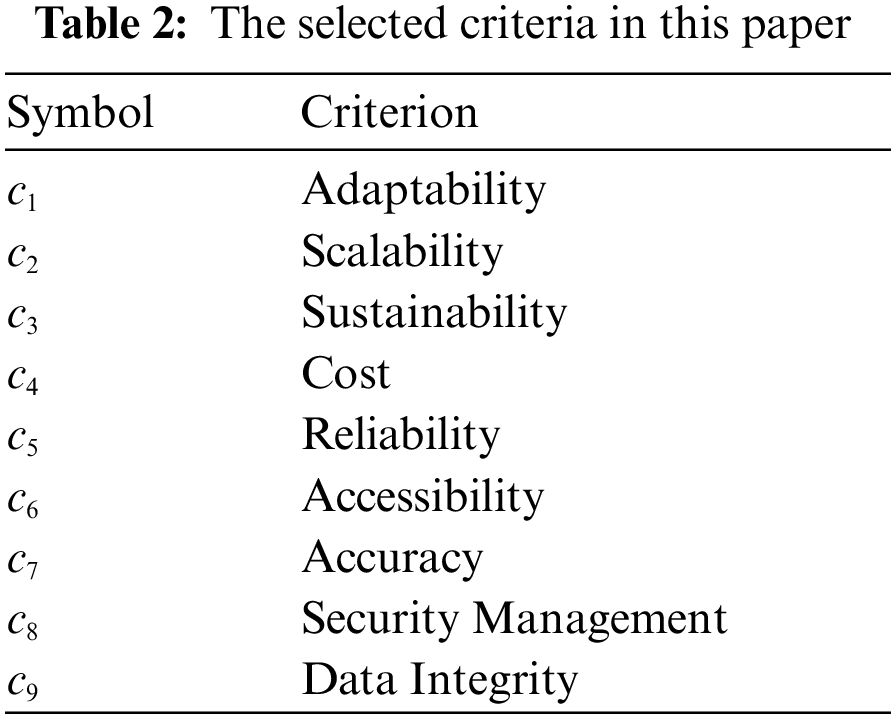
Step 1. (Identify criteria that meet the business needs): Nine criteria were selected based on the SMI model, where
Step 2. (Identify the appropriate set of CSPs): For our use-case model, eight hypothetical CSPs were chosen, where
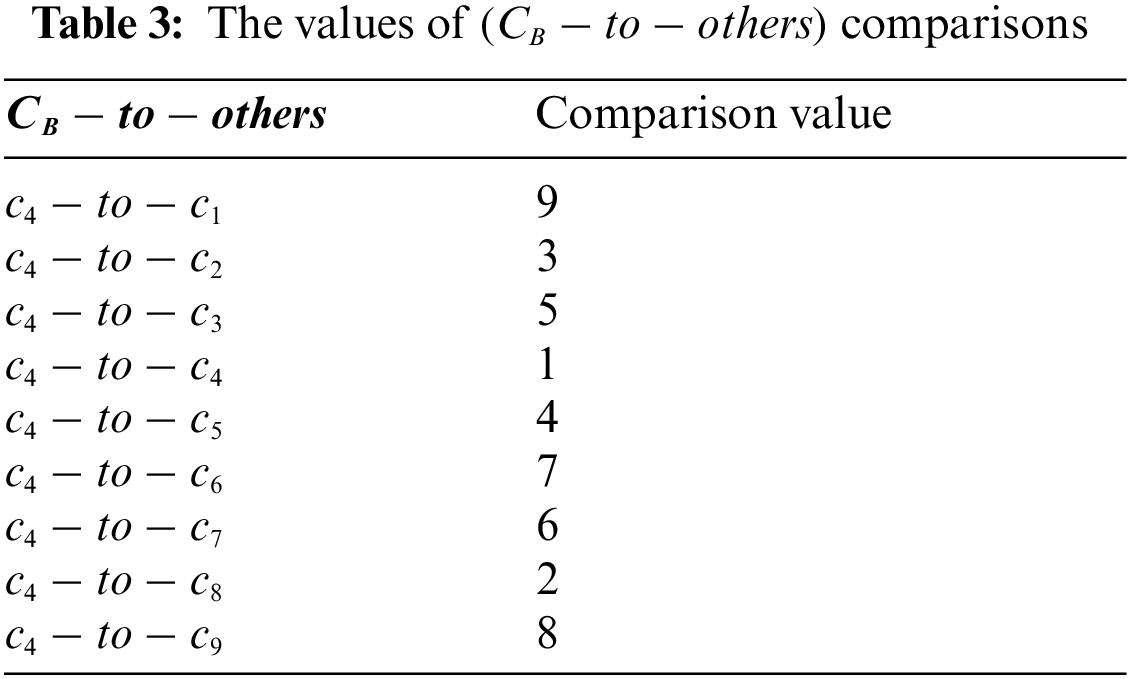
Step 3. (Identify the best criterion in the set of criteria): Assume that the best criterion chosen by the decision-maker is the cost. So,
Step 4. (Estimate the values of the pairwise comparison of the best criterion to the others): It is the responsibility of the decision-maker to determine the pairwise comparison values between each of the criteria in the set and the selected best criterion
Step 5. (Calculate the appropriate weights for each criterion). Tab. 4 shows the weight values of the set of criteria, which are computed using Eqs. (22) and (23), respectively.
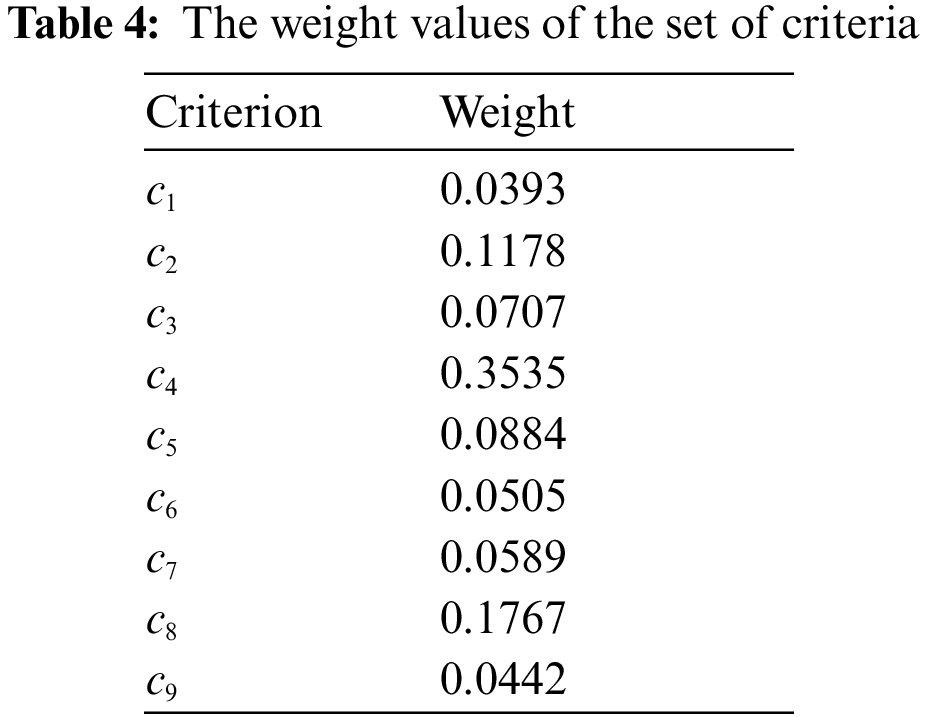
The values from Tab. 4 are stored in the vector (
Step 6. (Determine the first criterion).
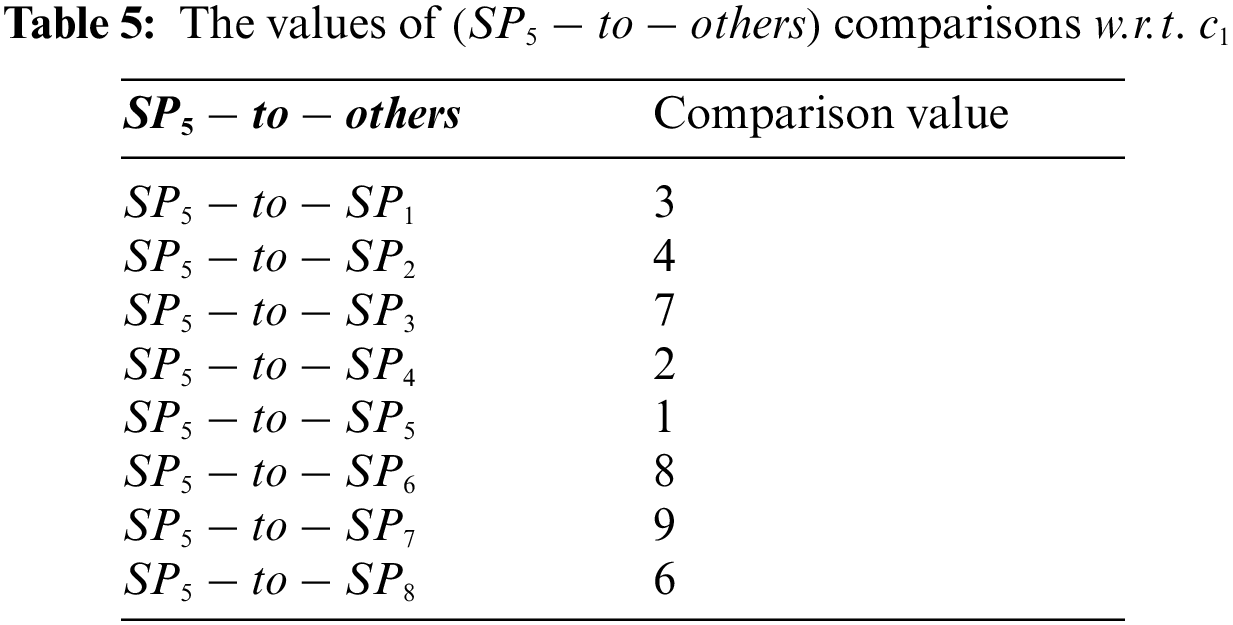
Step 7. (Select the best CSPrelative to
Step 8. (Set the values of pairwise comparisons of the best CSP relative to
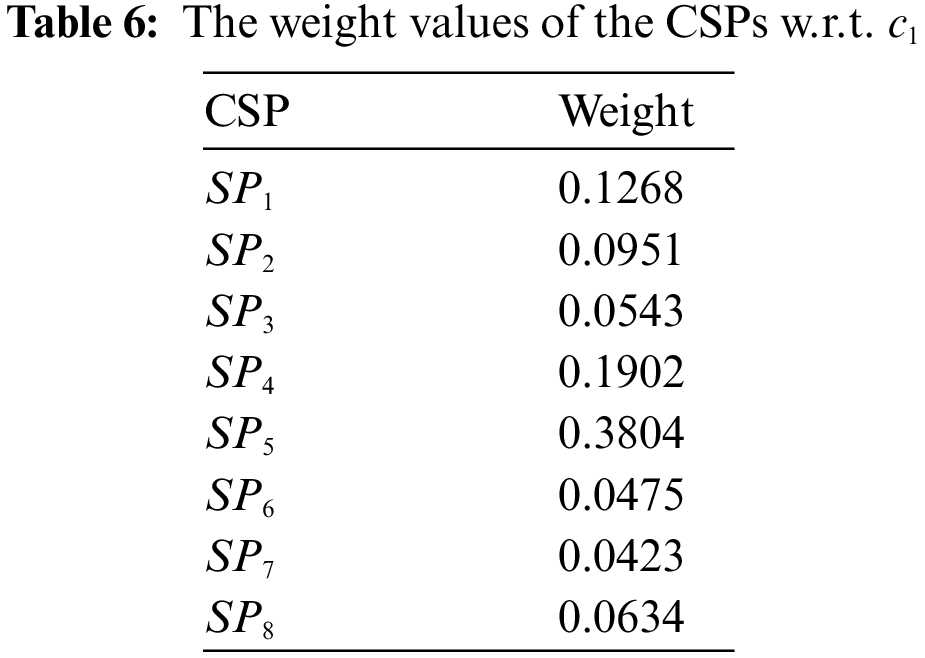
Step 9. (Calculate the weight values of the CSPs w.r.t.
Tab. 6 shows the weight values of the CSPs w.r.t.
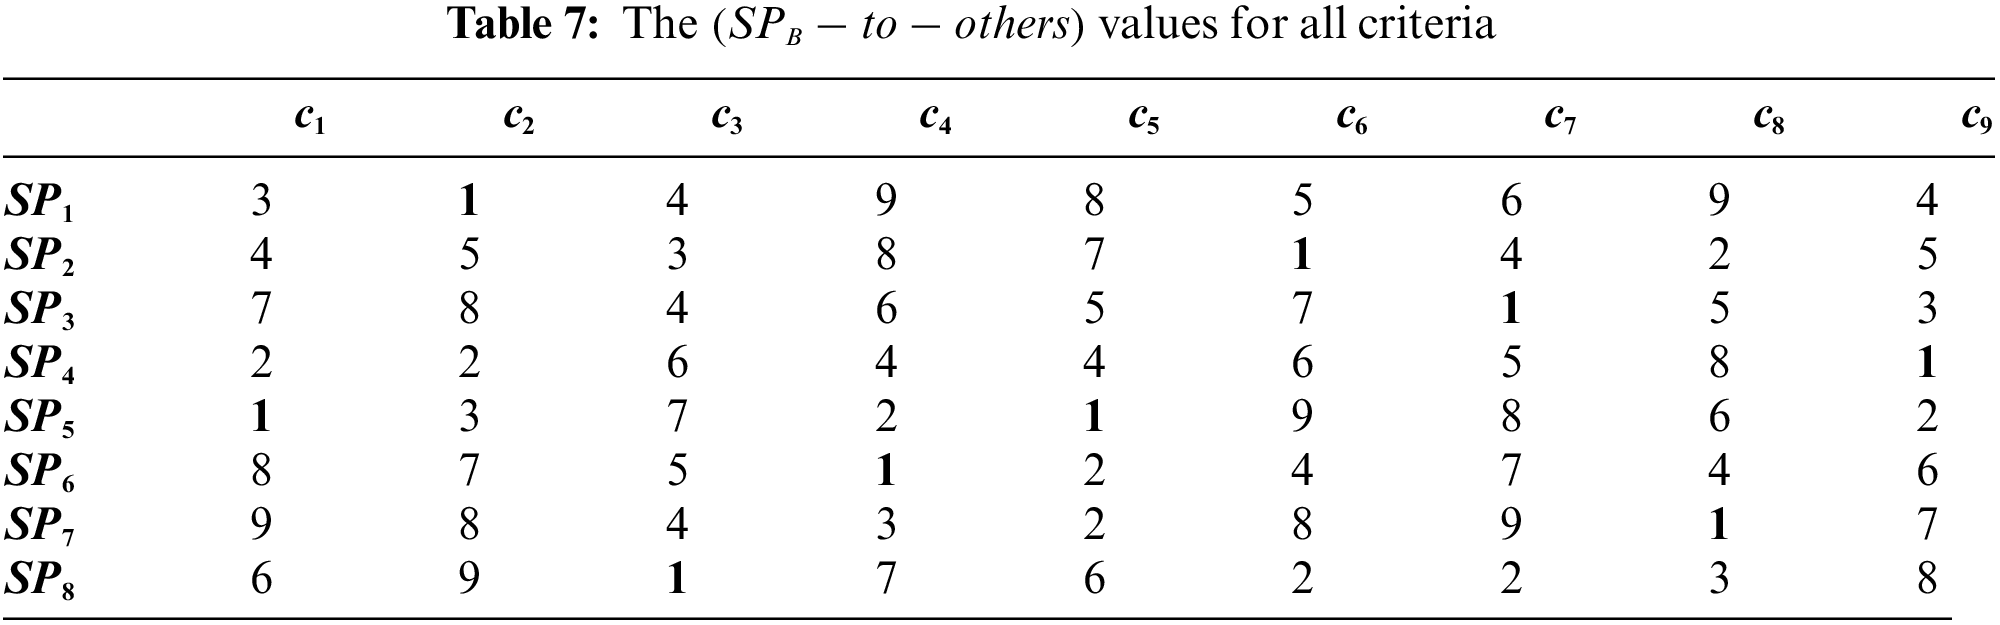
Step 10. (Calculate the weights of CSPs concerning all other remaining criteria): For all remaining criteria, repeat steps 7 through 9. In Tab. 7, the The
Step 11. (Develop the matrix of CSP weights): In Tab. 8, each column contains the CSPs weights for each criterion.
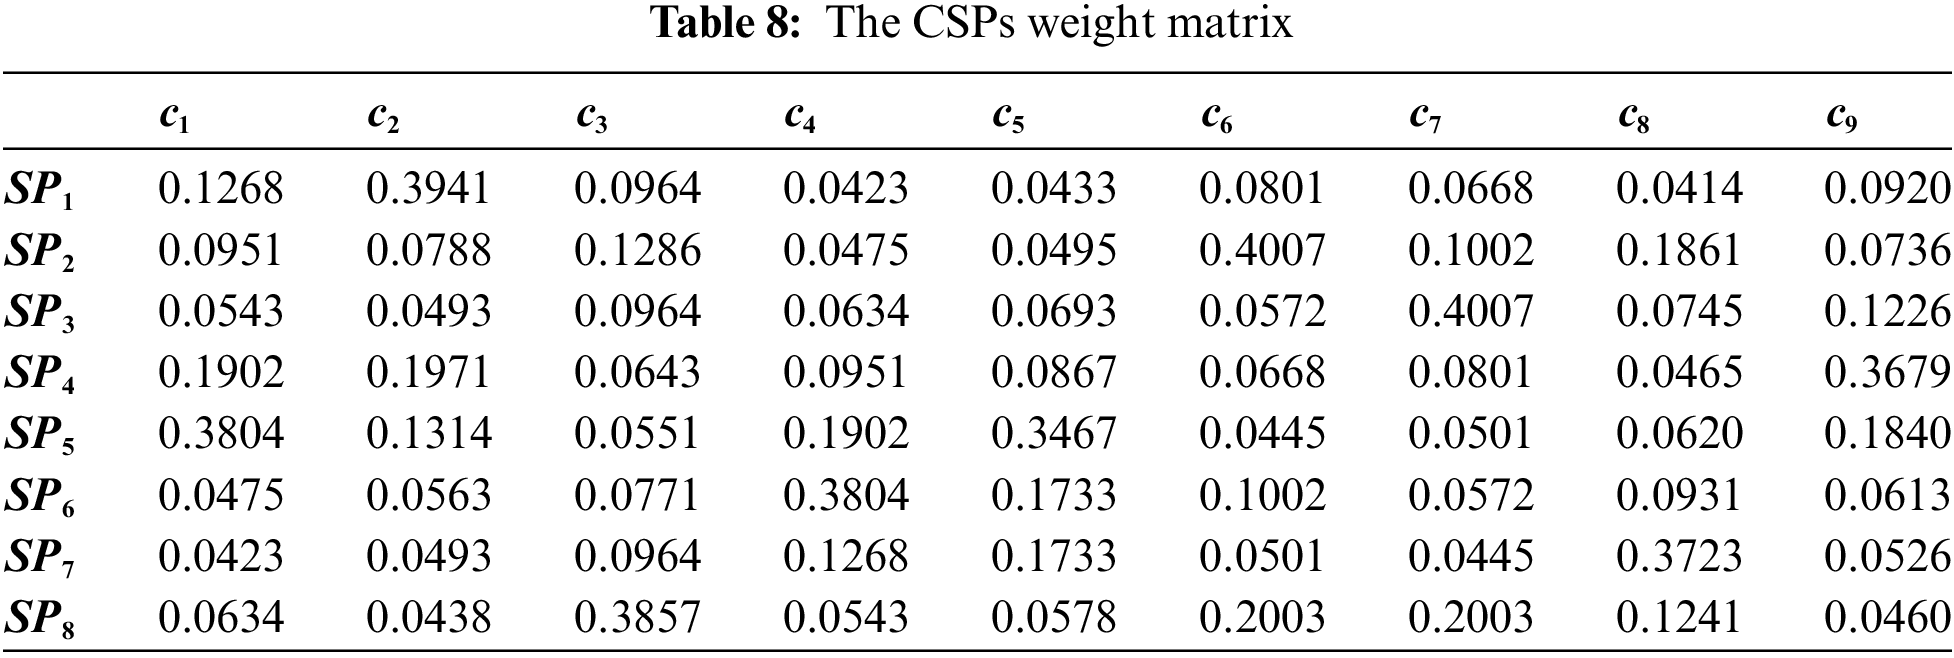
The values from Tab. 8 are represented in the normalized decision matrix (
Step 12: (Compute the weighted normalized decision matrix H ): H is calculated using Eq. (12) by multiplying the weight values of the criteria
Step 13:(Calculate the positive ideal solution (PIS) and negative ideal solution (NIS)): The vectors PIS and MIS are calculated using equations 13 through 18, and the results are as follow:
Step 14:(Calculate the Euclidian distance
Step 15: (Calculate the closeness value for each alternative (
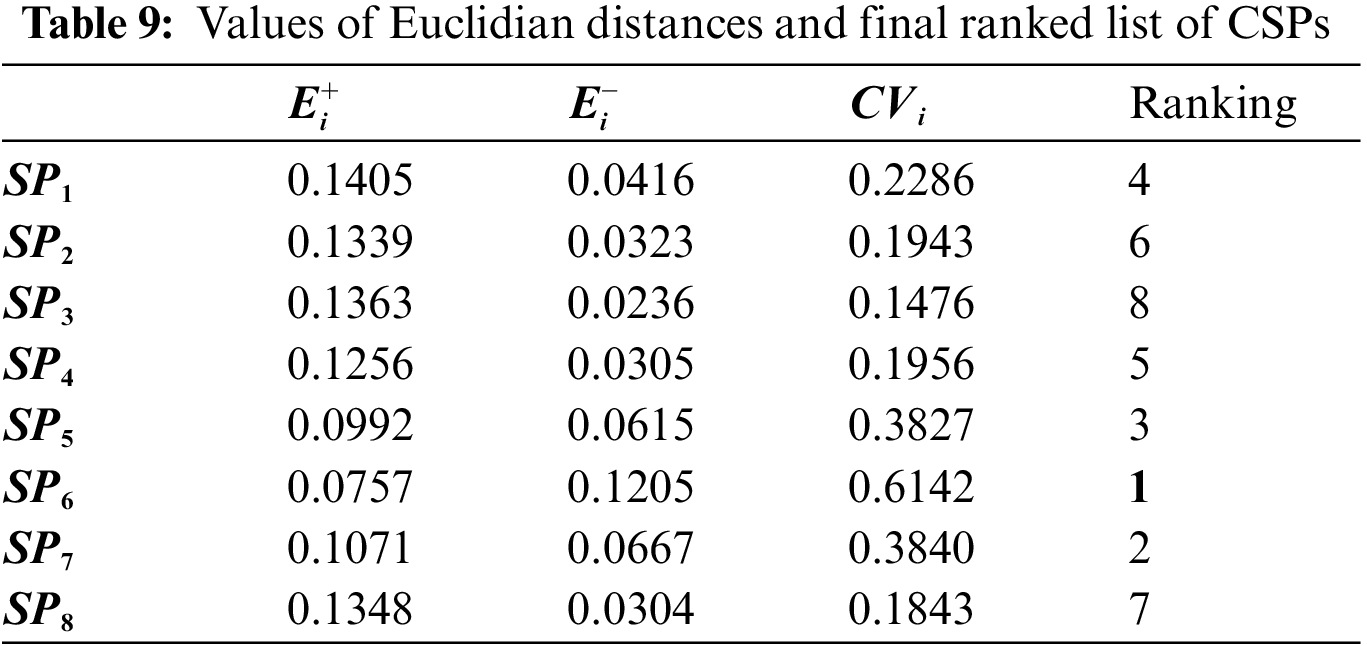
Step 16: (Rank the alternatives in descending order of the closeness value). Tab. 9 shows the final CSP ranking.
Several measures of the viability of the proposed framework have been considered: computing efficiency (In terms of the number of comparisons made between all pairs) and consistency ratio (CR). Validation was achieved by comparing it with the AHP technique. The exact configuration was used in our comparison experiments for the developed framework and the AHP technique. The AHP computations were carried out using the method presented in [41].
We calculated the number of pairwise comparisons given by the decision-maker to assess the efficiency of the proposed framework. Nine criteria and eight CSPs were used in all of our experiments. In Tab. 10, we compare the number of comparisons in AHP with those in the developed framework. In contrast with AHP, our proposed framework does not require as many comparisons, thus making it more efficient. It is in part because the proposed framework uses a vector-based approach rather than a matrix-based approach such as AHP, which requires fewer comparisons. For AHP,
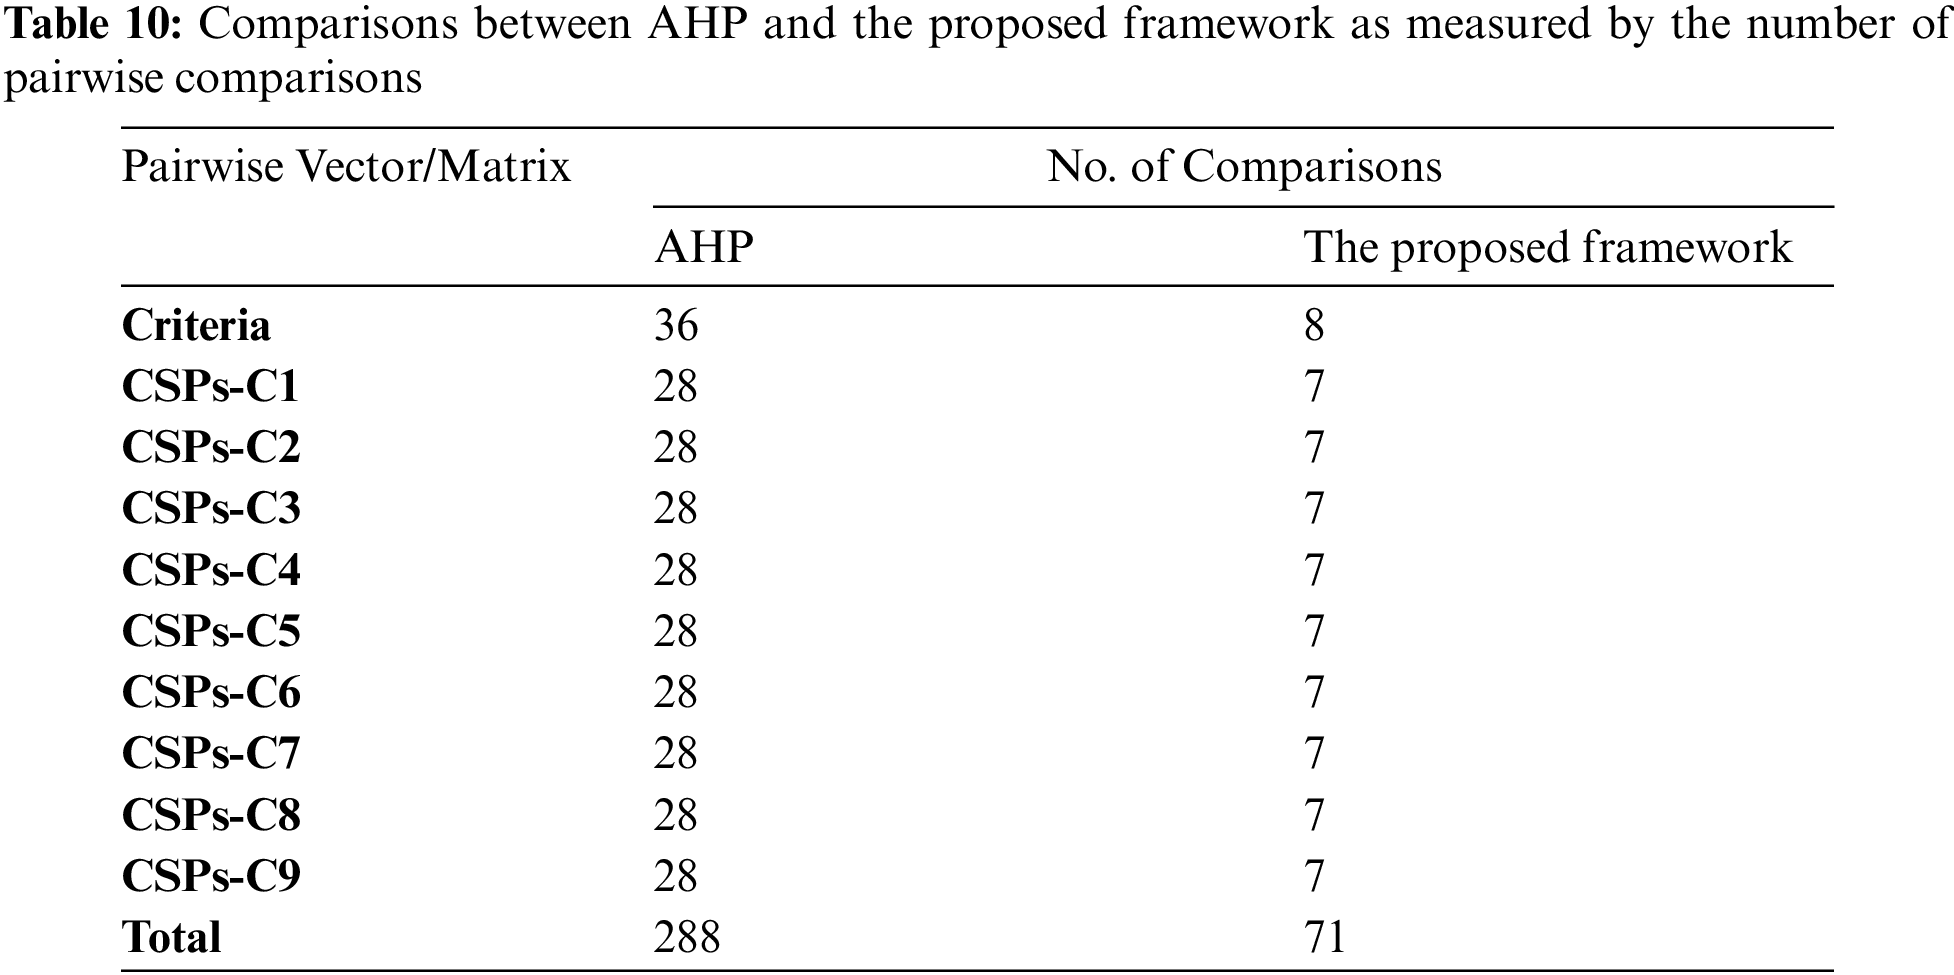
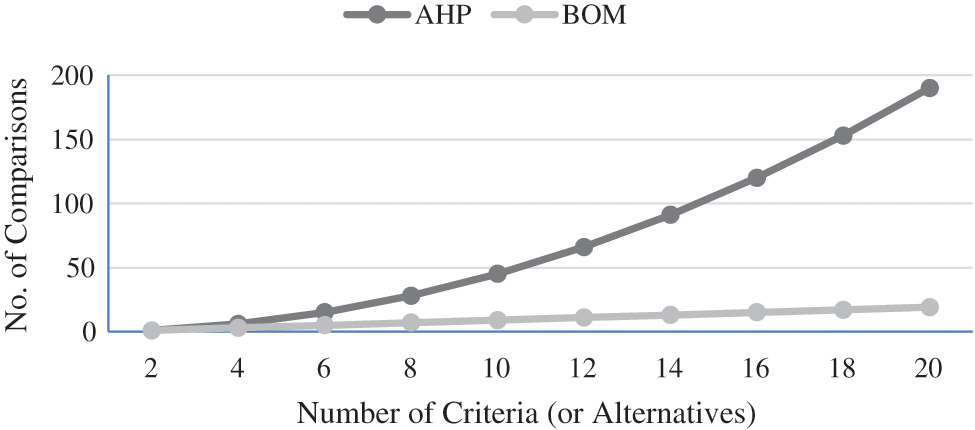
Figure 3: Computational complexity of AHP, BWM, and BOM
The reliability of MCDM results is based on the value of the consistency ratio. In our experiment, the CR is calculated using the AHP technique and the proposed framework to evaluate consistency. Tab. 11 compares the CR results of the proposed framework and the AHP technique. For AHP, CR is calculated using Eq. (8). According to the AHP technique, if the comparisons have consistency ratio values greater than or equal to 0.1, they are considered inconsistent.
Based on the eigenvalue theory, if the value of
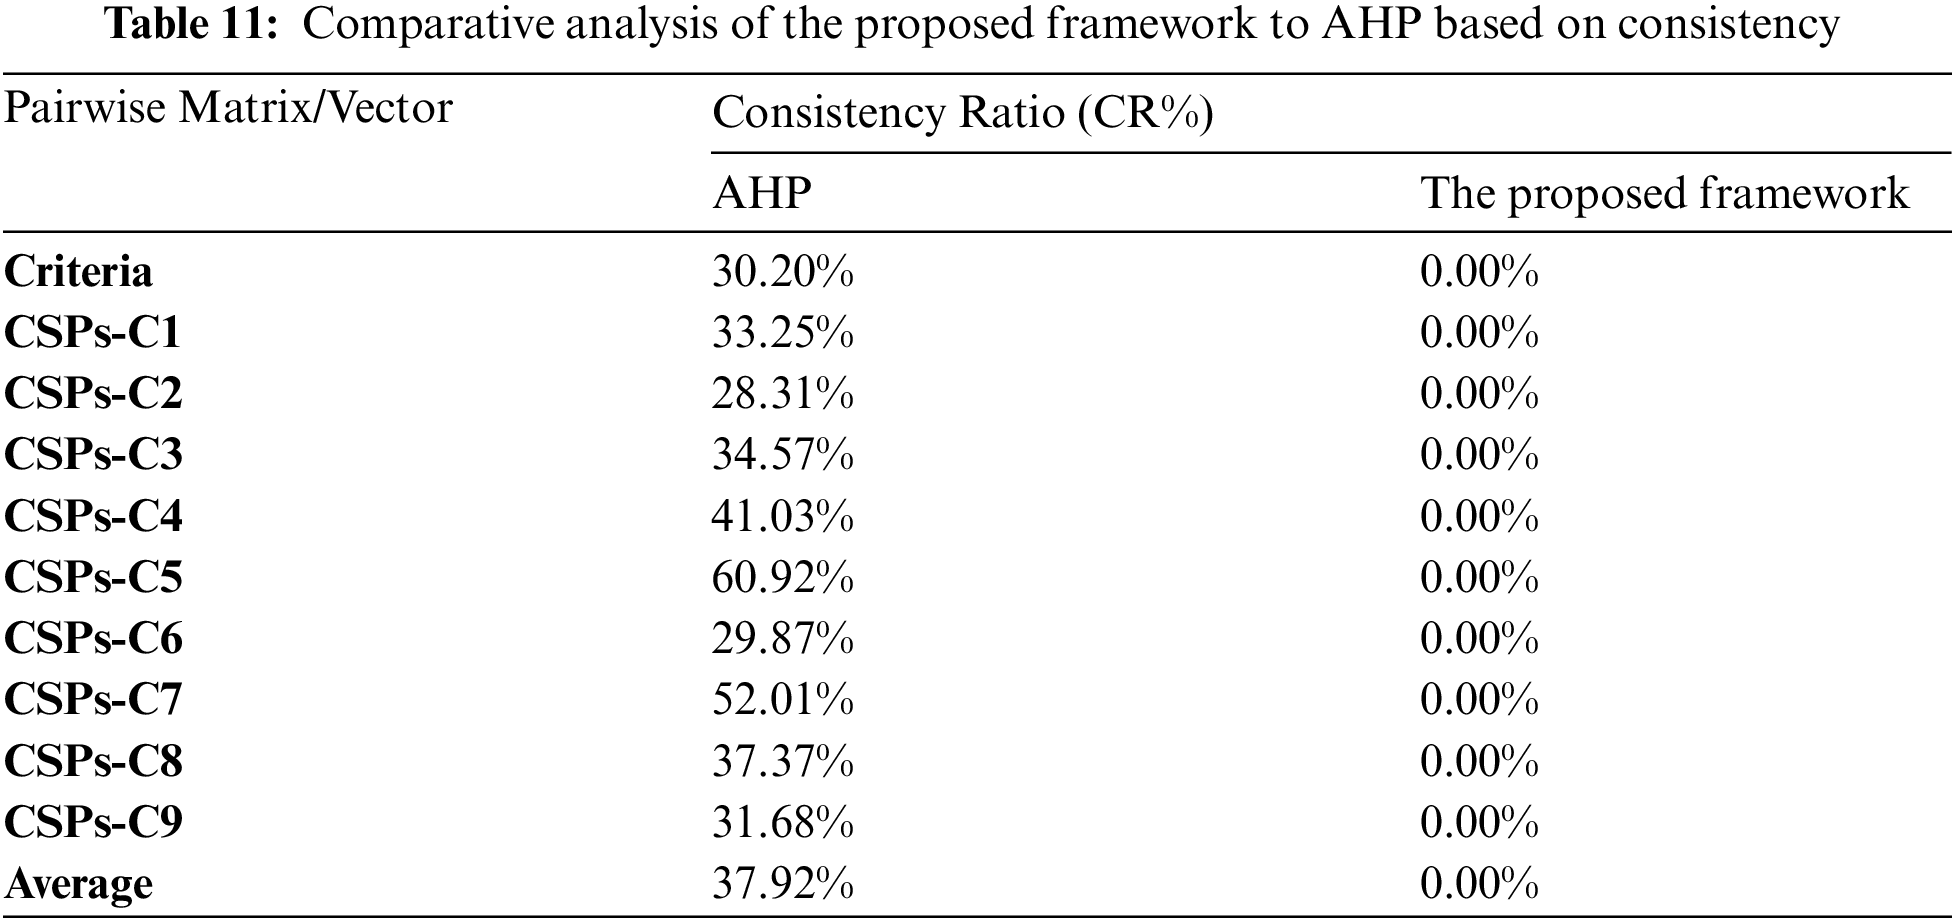
We have evaluated and ranked eight CSPs (m = 8) based on nine criteria (n = 9), driven by the decision-makers preferences. The proposed framework was compared to a well-known MCDM method, AHP, using the same configurations to validate the proposed framework’s efficiency and consistency. AHP requires ten matrices: one of size
This paper proposed an integrated MCDM framework to enable cloud service customers to select the most appropriate CSP by utilizing the BOM and the TOPSIS methods. A formal evaluation and verification of the proposed framework were conducted utilizing a use-case model to validate its effectiveness and consistency. A comparison was made between the proposed framework and AHP. In terms of computing complexity and consistency, our proposed framework performs superior to AHP. Similar to AHP, the proposed framework has the drawback that it relies on decision-makers’ judgments of the pairwise comparison values for qualitative criteria to reach the final ranking list of CSPs. In the future, this work can be extended to include group decision-making.
Funding Statement: The author received no specific funding for this study.
Conflicts of Interest: The authors declare that they have no conflicts of interest to report regarding the present study.
1. A. Nayyar, Handbook of Cloud Computing: Basic to Advance Research on the Concepts and Design of Cloud Computing, 1st ed., New Delhi, India: BPB Publications, 2019. [Google Scholar]
2. R. K. Tiwari and R. Kumar, “A robust and efficient MCDM-based framework for cloud service selection using modified TOPSIS,” International Journal of Cloud Applications and Computing, vol. 11, no. 1, pp. 21–51, 2020. [Google Scholar]
3. R. Buyya, C. S. Yeo, S. Venugopal, J. Broberg and I. Brandic, “Cloud computing and emerging IT platforms: Vision, hype, and reality for delivering computing as the 5th utility,” Future Generation Computer Systems, vol. 25, no. 6, pp. 599–616, 2009. [Google Scholar]
4. S. Li, G. Wang and J. Yang, “Survey on cloud model based similarity measure of uncertain concepts,” CAAI Transactions on Intelligence Technology, vol. 4, no. 4, pp. 223–230, 2019. [Google Scholar]
5. S. Namasudra and P. Roy, “A new table based protocol for data accessing in cloud computing,” Journal of Information Science and Engineering, vol. 33, no. 3, pp. 585–609, 2017. [Google Scholar]
6. S. Ahmad, S. Mehfuz and J. Beg, “Fuzzy TOPSIS-based cloud model to evaluate cloud computing services,” in Lecture Notes in Mechanical Engineering, pp. 37–52, 2021. [Google Scholar]
7. D. Ardagna, G. Casale, M. Ciavotta, J. F. Pérez and W. Wang, “Quality-of-service in cloud computing: Modeling techniques and their applications,” Journal of Internet Services and Applications, vol. 5, no. 1, pp. 1–17, 2014. [Google Scholar]
8. J. Siegel and J. Perdue, “Cloud services measures for global use: The Service Measurement Index (SMI),” in Annual SRII Global Conf., San Jose, California, USA, pp. 411–415, 2012. [Google Scholar]
9. I. Grgurević and G. Kordić, “Multi-criteria decision-making in cloud service selection and adoption,” in Proc. of the 5th Int. Virtual Research Conf. in Technical Disciplines, Žilina, Slovak Republic, vol. 5, 2017. [Google Scholar]
10. L. Sun, “An influence diagram based cloud service selection approach in dynamic cloud marketplaces,” Cluster Computing, vol. 22, no. 3, pp. 7369–7378, 2019. [Google Scholar]
11. N. Gobi and A. Rathinavelu, “Analyzing cloud based reviews for product ranking using feature based clustering algorithm,” Cluster Computing, vol. 22, no. 3, pp. 6977–6984, 2019. [Google Scholar]
12. H. M. Alabool and A. K. bin Mahmood, “A novel evaluation framework for improving trust level of Infrastructure as a Service,” Cluster Computing, vol. 19, no. 1, pp. 389–410, 2016. [Google Scholar]
13. T. L. Saaty, “How to make a decision: The analytic hierarchy process,” European Journal of Operational Research, vol. 48, no. 1, pp. 9–26, 1990. [Google Scholar]
14. T. L. Saaty, “A scaling method for priorities in hierarchical structures,” Journal of Mathematical Psychology, vol. 15, no. 3, pp. 234–281, 1977. [Google Scholar]
15. T. L. Saaty, “Axiomatic foundation of the analytic hierarchy process,” Management Science, vol. 32, no. 7, pp. 841–855, 1986. [Google Scholar]
16. A. Jadhav and R. Sonar, “Analytic hierarchy process (AHPweighted scoring method (WSMand hybrid knowledge based system (HKBS) for software selection: A comparative study,” in Second Int. Conf. on Emerging Trends in Engineering & Technology, Nagpur, Maharashtra, India, pp. 991–997, 2009. [Google Scholar]
17. R. V. Rao, “Introduction to multiple attribute decision-making (MADM) methods,” in Decision Making in the Manufacturing Environment, pp. 27–41, 2007. [Google Scholar]
18. M. W. Herman and W. W. Koczkodaj, “A Monte Carlo study of pairwise comparison,” Information Processing Letters, vol. 57, no. 1, pp. 25–29, 1996. [Google Scholar]
19. R. W. Saaty, “The analytic hierarchy process-what it is and how it is used,” Mathematical Modelling, vol. 9, no. 3–5, pp. 161–176, 1987. [Google Scholar]
20. R. H. Ansah, S. Sorooshian and S. bin Mustafa, “Analytic hierarchy process decision making algorithm,” Global Journal of Pure and Applied Mathematics, vol. 11, no. 4, pp. 2403–2410, 2015. [Google Scholar]
21. A. E. Youssef, “An integrated MCDM approach for cloud service selection based on TOPSIS and BWM,” IEEE Access, vol. 8, pp. 71851–71865, 2020. [Google Scholar]
22. R. Gavade, “Multi-Criteria Decision Making: An overview of different selection problems and methods,” International Journal of Computer Science and Information Technologies, vol. 5, no. 4, pp. 5643–5646, 2014. [Google Scholar]
23. A. Bahurmoz, “The analytic hierarchy process: A methodology for win-win management,” Journal of King Abdulaziz University-Economics and Administration, vol. 20, no. 1, pp. 3–16, 2006. [Google Scholar]
24. C.-L. Hwang and K. Yoon, “Methods for multiple attribute decision making,” in Multiple Attribute Decision Making. Berlin, Heidelberg: Springer, pp. 58–191, 1981. [Google Scholar]
25. R. R. Kumar, S. Mishra and C. Kumar, “A novel framework for cloud service evaluation and selection using hybrid MCDM methods,” Arabian Journal for Science and Engineering, vol. 43, no. 12, pp. 7015–7030, 2018. [Google Scholar]
26. S. K. Garg, S. Versteeg and R. Buyya, “A framework for ranking of cloud computing services,” Future Generation Computer Systems, vol. 29, no. 4, pp. 1012–1023, 2013. [Google Scholar]
27. A. Tripathi, I. Pathak and D. P. Vidyarthi, “Integration of analytic network process with service measurement index framework for cloud service provider selection,” Concurrency and Computation: Practice and Experience, vol. 29, no. 12, pp. 1–16, 2017. [Google Scholar]
28. J. S. Dyer, “MAUT-multiattribute utility theory,” in International Series in Operations Research and Management Science. Vol. 78. New York, NY, USA: Springer, pp. 265–292, 2005. [Google Scholar]
29. K. Govindan and M. B. Jepsen, “ELECTRE: A comprehensive literature review on methodologies and applications,” European Journal of Operational Research, vol. 250, no. 1, pp. 1–29, 2016. [Google Scholar]
30. A. Afshari, M. Mojahed and R. Yusuff, “Simple additive weighting approach to personnel selection problem,” International Journal of Innovation, Management and Technology, vol. 1, no. 5, pp. 511–515, 2010. [Google Scholar]
31. G. Baranwal and D. P. Vidyarthi, “A cloud service selection model using improved ranked voting method, Concurrency and Computation,” Practice and Experience, vol. 28, no. 13, pp. 3540–3567, 2016. [Google Scholar]
32. R. Karim, C. Ding and A. Miri, “An end-to-end QoS mapping approach for cloud service selection,” in IEEE Ninth World Congress on Services, pp. 341–348, 2013. [Google Scholar]
33. N. Boussoualim and Y. Aklouf, “Evaluation and selection of SaaS product based on user preferences,” in Third Int. Conf. on Technological Advances in Electrical, Electronics and Computer Engineering (TAEECE), Lebanon, pp. 299–308, 2015. [Google Scholar]
34. Z. U. Rehman, O. K. Hussain and F. K. Hussain, “Multi-Criteria IaaS service selection based on QoS history,” in IEEE 27th Int. Conf. on Advanced Information Networking and Applications (AINA), Barcelona, Spain, pp. 1129–1135, 2013. [Google Scholar]
35. Z. U. Rehman, O. K. Hussain and F. K. Hussain, “Iaas cloud selection using MCDM methods,” in IEEE Ninth Int. Conf. on E-business Engineering, Hangzhou, China, pp. 246–251, 2012. [Google Scholar]
36. R. R. Kumar, M. Shameem, R. Khanam and C. Kumar, “A hybrid evaluation framework for QoS based service selection and ranking in cloud environment,” in 15th IEEE India Council Int. Conf. (INDICON), Coimbatore, India, pp. 1–6, 2018. [Google Scholar]
37. A. Hussain, J. Chun and M. Khan, “A novel framework towards viable Cloud Service Selection as a Service (CSSaaS) under a fuzzy environment,” Future Generation Computer Systems, vol. 104, pp. 74–91, 2020. [Google Scholar]
38. S. K. Garg, S. Versteeg and R. Buyya, “SMICloud: A framework for comparing and ranking cloud services,” in Fourth IEEE Int. Conf. on Utility and Cloud Computing, Melbourne, Australia, pp. 210–218, 2011. [Google Scholar]
39. M. Godse and S. Mulik, “An approach for selecting Software-as-a-Service (SaaS) product,” in IEEE Int. Conf. on Cloud Computing, Bangalore, India, pp. 155–158, 2009. [Google Scholar]
40. M. Enea and T. Piazza, “Project selection by constrained fuzzy AHP,” Fuzzy Optimization and Decision Making, vol. 3, no. 1, pp. 39–62, 2004. [Google Scholar]
41. K. Goepel, “Implementation of an Online software tool for the Analytic Hierarchy Process (AHP-OS),” International Journal of the Analytic Hierarchy Process, vol. 10, no. 3, pp. 469–487, 2018. [Google Scholar]
 | This work is licensed under a Creative Commons Attribution 4.0 International License, which permits unrestricted use, distribution, and reproduction in any medium, provided the original work is properly cited. |