DOI:10.32604/cmc.2022.024704
| Computers, Materials & Continua DOI:10.32604/cmc.2022.024704 | |
| Article |
Machine Learning Based Psychotic Behaviors Prediction from Facebook Status Updates
1Department of Management, Information and Production Engineering, University of Bergamo, Bergamo, 24129, Italy
2Department of Environmental Sciences, Informatics and Statistics, Ca’ Foscari University of Venice, Venice, 30123, Italy
3School of Computing and Engineering, University of West London, London, W5 5RF, UK
4Department of Engineering and Applied Sciences, University of Bergamo, Bergamo, 24129, Italy
5Durma College of Science and Humanities, Shaqra University, Shaqra, 11961, Saudi Arabia
6School of Engineering, University of Glasgow, Glasgow, G12 8QQ, UK
*Corresponding Author: Hafiz Husnain Raza Sherazi. Email: sherazi@uwl.ac.uk
Received: 28 October 2021; Accepted: 25 January 2022
Abstract: With the advent of technological advancements and the widespread Internet connectivity during the last couple of decades, social media platforms (such as Facebook, Twitter, and Instagram) have consumed a large proportion of time in our daily lives. People tend to stay alive on their social media with recent updates, as it has become the primary source of interaction within social circles. Although social media platforms offer several remarkable features but are simultaneously prone to various critical vulnerabilities. Recent studies have revealed a strong correlation between the usage of social media and associated mental health issues consequently leading to depression, anxiety, suicide commitment, and mental disorder, particularly in the young adults who have excessively spent time on social media which necessitates a thorough psychological analysis of all these platforms. This study aims to exploit machine learning techniques for the classification of psychotic issues based on Facebook status updates. In this paper, we start with depression detection in the first instance and then expand on analyzing six other psychotic issues (e.g., depression, anxiety, psychopathic deviate, hypochondria, unrealistic, and hypomania) commonly found in adults due to extreme use of social media networks. To classify the psychotic issues with the user's mental state, we have employed different Machine Learning (ML) classifiers i.e., Random Forest (RF), Support Vector Machine (SVM), Naïve Bayes (NB), and K-Nearest Neighbor (KNN). The used ML models are trained and tested by using different combinations of features selection techniques. To observe the most suitable classifiers for psychotic issue classification, a cost-benefit function (sometimes termed as ‘Suitability’) has been used which combines the accuracy of the model with its execution time. The experimental evidence argues that RF outperforms its competitor classifiers with the unigram feature set.
Keywords: Psychotic behaviors; mental health; social media; machine learning
The proliferation of the internet and communication technologies, especially online social networks have changed human lives. Social networking sites have gained a lot of popularity and have become collaborating tools where not only the latest news is trending but also a medium for sharing emotions and personal thoughts against a particular event or incident. As of April 2017, Twitter and Facebook have more than 319 million and 1968 million monthly active users respectively [1]. A lot of people are using these social media networks to stay connected with their friends, make new connections, disseminate important content, and convey their point of view on diversified subjects in a different way e.g., commenting on a post, status updates, uploading videos and pictures, etc. The excessive use of social media networks has given birth to different psychological issues in youngsters. Besides normal people, psychotic people normally spend more time on the internet by playing games or chatting with friends [2]. Such people use social networking sites not only to make new connections but also to reconnect and maintain existing relationships [3].
In recent years, various research efforts have been invested in the development of novel methods for the detection and identification of human emotions, psychotic behaviors, or mental states from textual data. Human mental states can be observed through verbal communication such as (speech, textual data) on non-verbal communication (gestures, facial expressions, etc.) [4]. Nowadays, more and more people are using messaging services of social media networks to communicate with their friends, so textual data is a very important source for the analysis of psychotic behavior. In this study, we have chosen the Facebook textual data for the analysis of psychotic behavior. Quantifying user behavior is difficult due to the complexities in the conveyed text. We have explored the Facebook user behavior by using user status update as status describes user feelings more strongly. We have considered the following psychotic issues (mental problems) discussed by [5] in our study.
Somatic Disorder: It usually means uneasiness in the physical state, and people suffering from somatic disorder always explain their psychological problems as a physical problem to acquire sympathies from others. Such people find a confiding way of communication by taking part in group topics, publishing journals, and online shopping. These people may be more worried about physical diseases, and thus they may choose or prefer to browse horrible web wages to overcome their bad mood and relieve the discomfort in mind.
Depression: Depression is a state which can adversely affect the feelings, thoughts, behavior, and physical well-being of a person. It may also include anxiety, feeling of sadness, hopelessness, emptiness, guilt, worthlessness, irritability, or restlessness. Depressed people may find difficulties and lose interest in the daily activities that were delightful, or they also suffer cognitive deficiencies e.g., difficulty concentrating, remembering, deciding [6].
Anxiety: Anxiety represents the state of nervousness, anxiousness, and lack of confidence. This mental state creates difficulties for people to focus on one thing in the long term i.e., they can't concentrate on their academic activities, avoid browsing friends’ profiles, and reply to their messages. A strong state of anxiety may push the people to visit the dreadful or horrible web pages or take part in topic groups to get relief and relax their minds.
Psychopathic Deviate (Psychosis): It usually refers to superficial communication and less tolerance to frustrations. Psychosis is a disturbance in thoughts that makes people difficult to distinguish what is the reality of the object. This mental state also has features like antisocial and counter moral. The people with psychopathic deviate are usually not interested to read the positive contents on the websites and hence express more interests to participate in topic groups, random suffering, and non-familiar way of information retrieval to know about the non-mainstream culture.
Hypochondria: Hypochondria usually refer to sensitive, argumentative, and quarrelsome behavior. Due to the sensitivity, people may be more defensive and fluctuate emotionally very easily, for example, they are inclined towards the web pages with angry affection and avoid pages with pity affection. These People are more curious about authentication while visiting the web pages, they are reluctant to browse web pages with less security. Furthermore, such people may also lose interest in social networks activities (for example do not care about the profiles of their friends), as they are argumentative, and thus, they may be more interested to participate in the topic groups.
Unrealistic: Unrealistic refer to isolation with the disordered mind and unconventional experience. In clinical terminologies, it is described as a deviation from reality. In the case of social media, this feature may turn into passive and negative progress of collaboration with social networking sites to avoid attaining surrounding information e.g., casual surfing, minimum interaction with the internet, pay attention to news feeds. More preference given to browse web pages having violent and annoying content may reflect disordered or broken from the inside.
Hypomania: Hypomania refers to being enthusiastic about communication, energetic, active mind, self-motivated, and low control of behavior. Youngsters may be the major source of promotion for this status. Some people are more enthusiastic about their social communication, and they interact with more people on social media, and some people may have a shortage in behavioral control and their social interaction is not ideal. Furthermore, enthusiastic people pay high vigor and a lot of attention to news and magazine and care less about information that is not instant like email.
The main contributions of this study are as follows:
1. Building a Facebook status dataset associated with the pre-defined psychotic behavior categories.
2. Detecting and analyzing the psychotic behavior expressed in the Facebook status updates. However, the methodology developed herein could be applied to any dataset collected by other social media platforms. To the best of the author's knowledge, this is the first study on the psychotic behavior classification.
3. Developing a baseline system based on supervised Machine Learning algorithms and comparing their results. Several ML classifiers are employed for psychotic behavior classification to observe the one that achieves the results with the highest accuracy.
4. Proposing a suitability metric to rank the used ML classifiers to observe the one that was suitable for the psychotic behavior classification problem.
The rest of the paper is organized as follows. Section 2 discusses the related work on depression, anxiety, and mental disorder classification on social media. The proposed methodology for psychotic behavior classification is presented in Section 3. Section 4 reports the experimental results of our proposed classification system. In Section 5, suitability analysis is presented. Finally, concluding remarks are provided in Section 6.
Due to the sheer easily accessible user-generated text data, social media has long been employed as a data source for depression and anxiety diagnosis. The social network users’ shared text data and social behavior are expected to contain indicators for diagnosing depressed and mentally disordered people. Many efforts have been made to apply classic machine learning models for depression classification and detection based on diverse feature engineering strategies to find the depression pattern for social media users. In an interesting study [7], authors proposed a depression classification model based on multimodal features from Twitter tweets written in English language, and term frequency-inverse document frequency (TF-IDF) is used for feature weighting. Emotional, cognitive, and domain-specific depression indicators are captured via multimodal features. The employed algorithm was Liner Discriminant Analysis (LDA), Linear Regression (LR) and Gaussian Naïve Bayes (GNB) and the authors attained the highest accuracy i.e., 90% with LDA. In another study [8], a neural network-based Suicide Artificial Intelligence Prediction Heuristic, a mental disorder-based algorithm (SAIPH) was proposed to analyze publicly available Twitter tweets posted in English language. The proposed algorithm can predict the future risk of suicide ideation based on psychological ailments with 88% accuracy. Ultimately, algorithmic techniques such as SAIPH could forecast individuals’ potential SI risk and could be effectively implemented as clinical decision resources to help with suicide assessment and vulnerability assessments.
In [9], a model with the name Suicidality assessment Time-Aware Temporal Network (STATENet) is proposed, which is a time-aware transformer-based model for preliminary suicidal risk assessment on Twitter tweets while focusing on detecting suicidal intent by incorporating historical context into linguistic models. Moreover, STATENet surpasses other techniques such as Random Forest and convolutional neural network with highest accuracy of 85%, revealing the value of emotional and cognitive contextual clues in the assessment of suicide risk. STATENet for suicide ideation detection is discussed in terms of its empirical, qualitative, practical, and ethical implications. Zhang et al. [10] employed a transformer-based depression classification model with deep learning for a Twitter dataset. They only consider the tweets that were written in English language Moreover, among BERT, RoBERTa and XLnet invariably outperform BiLSTM and CNN with accuracy of 84.4%. Saifullah et al. [11] applied machine learning techniques such as KNN, SVM, Decision Tree Classifier, Random Forest, and XG-boost for anxiety based on comments posted under the YouTube videos in Indonesian language and Tv programs. K-NN has the best precision accuracy, while XG-Boost has the best recall score at the end. While Random Forest is the most accurate with 84.99% accuracy method for detecting someone's anxiety based on social media data. A new method in [12] discussed the creation of KAREN, a system that uses a mix of machine learning (SVM) classification and rule-based classification with rules collected from experts to identify individuals who blog about their emotional distress in the text based on Chinese language. The results demonstrate that the SVM algorithm outperformed the standard techniques with highest F-measure (0.7216) in terms of classifying and that experts thought the system was more effective for recognizing bloggers with depressed moods than the baseline methods. In another study [13], authors proposed a probabilistic approach to classify the Urdu short text and they attained the highest accuracy i.e., 87.4%. Wang et al. [14] used Twitter tweets written in English language and proposed a deep learning based approach and three additional machine learning models to automatically predict persons who may attempt suicide within range of one to six months. Moreover, the proposed deep learning approach beats the baseline with an F1 score of 0.737 and an F2 score of 0.843, outperforming the baseline (prediction of suicide 6 months prior).
In another interesting study [15] authors applied three transformer-based depression classification techniques on the data set collected from Twitter. Afterward, it was assessed that how anxiety and depression affect someone's language while writing something online. In addition, the study explored the fusion classifier that integrates deep learning model scores with psychological text elements and users’ demographic information to find depression in people. The results for the fusion model showed 78.9% accuracy where people have depression. Chen et al. [16] came up with another approach and proposed a unique method for detecting users who are depressed or at risk of becoming depressed by using measurements of eight fundamental emotions as characteristics in Twitter messages in written in English across time, as well as a temporal investigation of these variables. Moreover, among all deep learning algorithm employed random forest outperform others with accuracy of 93.06%. Authors employed the applications of supervised machine learning algorithms such as Random Forest, Hidden Markov Model (HMM) to predict the onset of depression and post-traumatic stress disorder (PTSD) in Twitter users [17]. However among the applied algorithms HMM showed better accuracy that is 95%.
Islam et al. [18] used machine learning models with several psycholinguistic parameters to do depression analysis by using the data obtained from Facebook. Following that, an improved classification error rate with increased accuracy was reported, with the result revealing that the Decision Tree (DT) approach was more accurate with 71% accuracy in comparison to other machine learning (ML) methods. Based on linguistic cues and user writing patterns, Kumar et al. [19] proposed a new prediction model for real-time tweets data for anxious depression. Authors only consider the tweets that are posted by using English script. The results revealed that above 85% classification accuracy was attained using three distinct classifiers (multinomial naïve bayes, gradient boosting, and random forest). In another study, a deep learning-based model such as CNN and XGBoost is used to determine a user's mental state (depression, anxiety) based on the information user posted on Reddit's which is online mental health community [20]. Authors consider the textual information available in English language. Additionally, the proposed approach could accurately determine whether a user's post is related to a certain mental illness or not with accuracy of 96.96%. Peng et al. [21] presented a multi-kernel SVM-based model to recognize people with mental health problems. To describe users’ conditions, three groups of features are retrieved from Sina Weibo chinese languages platform: user microblog content, user profile, and user actions. Furthermore, when compared to state-of-the-art approaches, the proposed method demonstrated the lowest error rate of 16.54 percent. As a result, multi-kernel SVM is appropriate for spotting depressed persons using social media data.
Benton et al. [22] came up with an approach to measure the suicide risk and mental health of a Twitter user by using a deep learning-based framework. By modeling numerous parameters that are modeled as tasks in a multi-task learning (MTL) framework, the algorithm learns to predict suicide risk and mental health with a low false-positive rate. MTL model predicts a probable suicide attempt as well as the presence of abnormal mental health with 80% accuracy. In [23], authors proposed a machine learning-based approach (one-class SVM) to automatically identify a user from Anxiety disorder scale questionnaires with a social anxiety disorder by analyzing his/her posted content on social networks and one-class SVM achieves 0.794 F1-score. Saha et al. [24] organized depression-related posts and comments from Facebook and Twitter into a concise word database and calculated sentiment levels for each instance. Sentiment detection and machine learning approaches are also used to examine the ability to determine sentiment from such a unique category of text. To detect sentiment levels, authors used machine learning techniques such as NB, Decision Tree, RF, SVM, Sequential Minimal Optimization, Logistic Regression, Adaboost, Bagging, Stacking, and Multilayer Perceptron. RF, on the other hand, surpassed other classifiers, with an accuracy of 60.54 percent. Alhuzali et al. [25] employed pre-trained language model to extract data from user posts on Reddit before submitting them to a machine learning-based random forest classifier, which produced a 32.96 percent forecasting accuracy rate for asperity of depression.
From a preliminary state-of-the-art review, it has been observed that most of the work reported in the literature is related to depression and anxiety analysis, emotions classifications, and suicide commitment analysis by using the social network's data. It also seems that there does not exist a study to detect and classify the user's psychotic behavior into the defined classes (depression, anxiety, psychopathic deviate, hypochondria, unrealistic, hypomania) by using the social network (Facebook) data.
3 Proposed Psychotic Behavior Classification Methodology
In this section, we have discussed our proposed psychotic behavior classification system. For any text classification problem, classification steps remain the same i.e., pre-processing, feature extraction, feature weighting, and classification. The difference which makes any study unique is which pre-processing technique is used which method is used for feature extraction and depending upon their study type which classification algorithm is chosen. Based on the rigorous analysis of literature so far done on the user behavior analysis, depression, and anxiety classification, we propose a classification framework that is shown in Fig. 1. Our proposed psychotic behavior classification system is based on different stages i.e., data collection and annotation, data preprocessing and splitting, feature extraction and weighting, ML models training and evaluation.

Figure 1: Proposed framework for psychotic behavior classification
3.1 Data Collection and Annotation
This module is responsible for the data collection and annotation process. In this study, we have selected Facebook for our analysis because of its widespread usage and popularity. Facebook status updates are collected from the publicly accessible accounts and then manual labeling is performed by considering the symptoms associated with each psychotic category.
Pre-processing of Facebook status dataset encompasses the following steps:
1. A defined psychotic behavior category is selected from training data.
2. Then status of the selected category is split into tokens based on delimiters i.e., white-space, comma, semi-colon, etc.
3. After having tokenized status, it is further sanitized to remove non-letter characters, including punctuations, quotations, numbers, special characters, etc.
4. A defined psychotic behavior category is selected from training data.
5. Then status of the selected category is split into tokens based on delimiters i.e., white-space, comma, semi-colon, etc.
6. After having tokenized status, it is further sanitized to remove non-letter characters, including punctuations, quotations, numbers, special characters, etc.
7. After this, all the stop words (known as less informative words) are filtered from the dataset. This is done by using the applications of NLTK based stop words list and self-generated stop word list.
8. After the applications of step four, text stemming is performed by using the Porter stemmer. This is a very important step to reduce the dimensionality of the features. In natural language, a single word exists in different forms but with the same meaning (for example singular and plural); stemming reduces the words to their root form.
9. For all the defined classes 1–5 steps are repeated.
3.3 Feature Selection and Feature Weighting
After the applications of the pre-processing module, feature selection and feature weighting are performed. To do this, a natural language-based n-gram and TF-IDF-based technique are employed. The output of the pre-processing modules is forward as an input to produce different combinations of n-grams for feature selection and weighting. We then generated the n-gram based TF-IDF metric for all the selected categories and less informative words are filtered out by considering their frequencies across all the classes. Then training of the machine learning models is performed over the vector space of TF-IDF values of n-grams using the following equation.
By changing the n-gram range (i.e., values of n, m) in the Eq. (1), we can get the unigram, bigram, trigram, and quad-gram values. TF-IDF value for every single term/word is calculated by using the following equation.
We discuss the text classification techniques that we have used in our experiments.
Random Forest: Random forest (RF), developed by Ho [26] is a supervised ensemble-based learning classification method that can be used to solve challenges involving data classification. Prediction in RF is accomplished through the use of decision trees. Several decision trees are built during the training phase and subsequently used for class prediction. This is accomplished by taking into account the voted classes of all individual trees and selecting the class which got the highest votes as output, as compared to other classes. In the literature, the RF approach has also been utilized to solve similar problems, such as in [25–27].
Support Vector Machine: Support Vector Machine (SVM) classifiers are extensively used for brief text categorization. This categorization approach is based on the structured risk minimization concept [28–31]. Given a feature hyper-space in which each point represents a document, it generates a hyperplane that divides the data into two sets, i.e., the hyper-place divides hyperspace into two semi-spaces. The method attempts to find the hyper-plane that maximizes the margin from each point, because the bigger the margin, the less likely it is that a point will fall into the incorrect semi-space. During the testing phase, a data point is classified based on the semi-space it falls into. The technique has been improved and expanded to accommodate multi-label categorization.
Naïve Bayes: The Naïve Bayes (NB) [29] classifier is a common text classification approach that is simple, fast, efficient, and straightforward to implement: in reality, this technique is highly efficient in terms of computing time; nevertheless, it works well when features behave as statistically independent variables. It's a probabilistic classification approach that relies only on feature probabilistic values [32]. The likelihood that a feature belongs to a specific class is computed for each individual feature. It's extensively utilized to solve a variety of issues, including forecasting social events, describing personality features, evaluating social crime, and so on.
K Nearest Neighbor: K Nearest Neighbor (kNN), an instance-based simple machine learning classifier that uses the Euclidean equation and the value of K to determine the similarity of a class for a feature [28–35]. It determines the similarity of a feature across all documents in the training corpus. It allocates the class to the desired characteristic based on the adjacent classes’ highest likelihood. In the event of a large value of K, the finding of the most suited class becomes extremely computational and difficult.
Our proposed framework consists of four different classifiers because of comparison purposes and to find out the effective and efficient classifier best suitable for our problem. We used python as a programming language and a scikit-learn (sklearn) library for implementing our classifiers. Since our framework doesn't only rely on accuracy as an evaluation metric, but we consider its efficiency to perform the classification in minimal time as an important aspect of it. Therefore, in the following section, we discuss our evaluation metrics, and later we will discuss our suitability metric as well to better understand which of the classifier is more effective and efficient in terms of classification accuracy and computational cost.
4.1 Data Preparation and Evaluation Metrics
To perform the experimentation evaluation through the proposed methodology, we have performed data collection and annotation. Data collection is the process of collecting Facebook status messages that are relevant to the psychotic behavior (Depression, Anxiety, Psychopathic Deviate (Psychosis), Hypochondria, Unrealistic, and Hypomania). Status categorization is one of the toughest parts of this work. This phase was done under the supervision of psychiatrists. A total of 2100 Facebook status updates were collected from different publicly accessible accounts. We consider only consider status messages that are written in English language. A detailed questioner is prepared which is then circulated into the targeted hospitals. This questioner has potential symptoms for each category. After carefully surveying symptoms associated with each category many symptoms were added and removed as per the psychiatrist's suggestions. Fig. 2 shows the outcomes of the questioner. As shown in Fig. 2, 61% of psychiatrists endorsed that we have targeted the accurate symptoms relevant to each category, 22% recommended adding more symptoms, whereas 11% suggested that some symptoms are irrelevant that should be removed, and 6% point out some symptoms are overlapping in each category that should be mitigated before preceding toward the categorization. Here we have provided each category with the associated symptoms.

Figure 2: Psychotic symptoms questioner outcome
Depression: Associated symptoms are anxious, empty, hopeless, helpless, worthless, guilty, irritable, angry, ashamed, or restless.
Anxiety: Simple states are agoraphobia, a fear of crowds, claustrophobia, fear of enclosed spaces e.g., lifts, and stage fright.
Psychopathic Deviate (Psychosis): This includes persecutory or self-blaming delusions or hallucinations, antisocial behavior, impaired empathy and remorse, and bold, disinhibited, egotistical traits.
Hypochondria: Symptoms are panic, sensitivity, defensive, disappointment, fear.
Unrealistic: Associated symptoms are angry, violence, disordered, worthless, invaluable.
Hypomania: Symptoms associated with this are energetic, talkative, and confident commonly exhibited with a flight of creative ideas. productivity and excitement, inadvisable behaviors, troublesome, bipolar.
To have a homogeneous distribution among the psychotic behavior classes, the training dataset is composed of 210 status updates for each category, and the test set contained 90 status updates for each category.
To evaluate the performance of classifiers in terms of how well they performed to classify the text into its respective class, we computed accuracy, precision, recall, and F-Measure. These metrics are usually utilized in text classification and information retrieval. Since the nature of our problem is multi-label classification, we considered the definitions of these metrics mentioned in [35].
Considering a set of class labels as CL = {cl1, cl2, cl3,…, cln}, where each cli corresponds to one of our classes under discussion, we may define the following counts:
▪ True positives (TPi) are the number of accurately allocated messages to class label cli
▪ False positives (FPi) are the number of wrongly allocated messages to class label cli
▪ True negatives (TNi) are the number of accurately not allocated to class label cli
▪ False negatives (FNi) are the number of wrongly not allocated to class label cli
Based on the above counts for each class label cli, we can define our following metrics:
▪ Accuracyi is the total number of messages correctly allocated with class label cli and diviedby the total number of messages such as
▪ Precisioni is the percentage of messages successfully identified with class label cli divied bythe total number of messages with class label cli;
▪ Recalliis the percentage of messages successfully identified with class label cli divided by thetotal number of messages that are supposed to be labeled with clithat is
▪ F1-Measurei is a measure that combines Precisioni and Recalliin such a way that
Because we are aiming for a multilabel classification problem, the global version of each measure must be computed which can be accomplished by taking the average of all values computed for each class in a way that
4.2 Experiments and Results Comparison of Classifiers
As a part of our experiments, we considered different n-gram based feature extraction techniques as parameters for each algorithm to identify more accurate and cost-effective classifiers. Therefore, we considered different feature patterns mentioned in Tab. 1 along with their abbreviations.

We performed our experiments for classifiers i.e., RF, SVM, NB, and kNN using the above-mentioned feature patterns. The results of RF, SVM, NB, and kNN are reported in Tabs. 2–5 respectively.
Among all classifiers understudy, RF outperformed the others with 63.02% accuracy followed by SVM, NB, and kNN respectively. It is worth noting that each of the classifiers performed better with either U as a feature pattern or with another feature pattern when U is forming a cartesian product with it. Similarly, T and Q are the worst-performing feature patterns either individually or when making a cartesian product with themselves or with B. But, when combined with U, they perform significantly better. The results are visualized in Fig. 3 below.


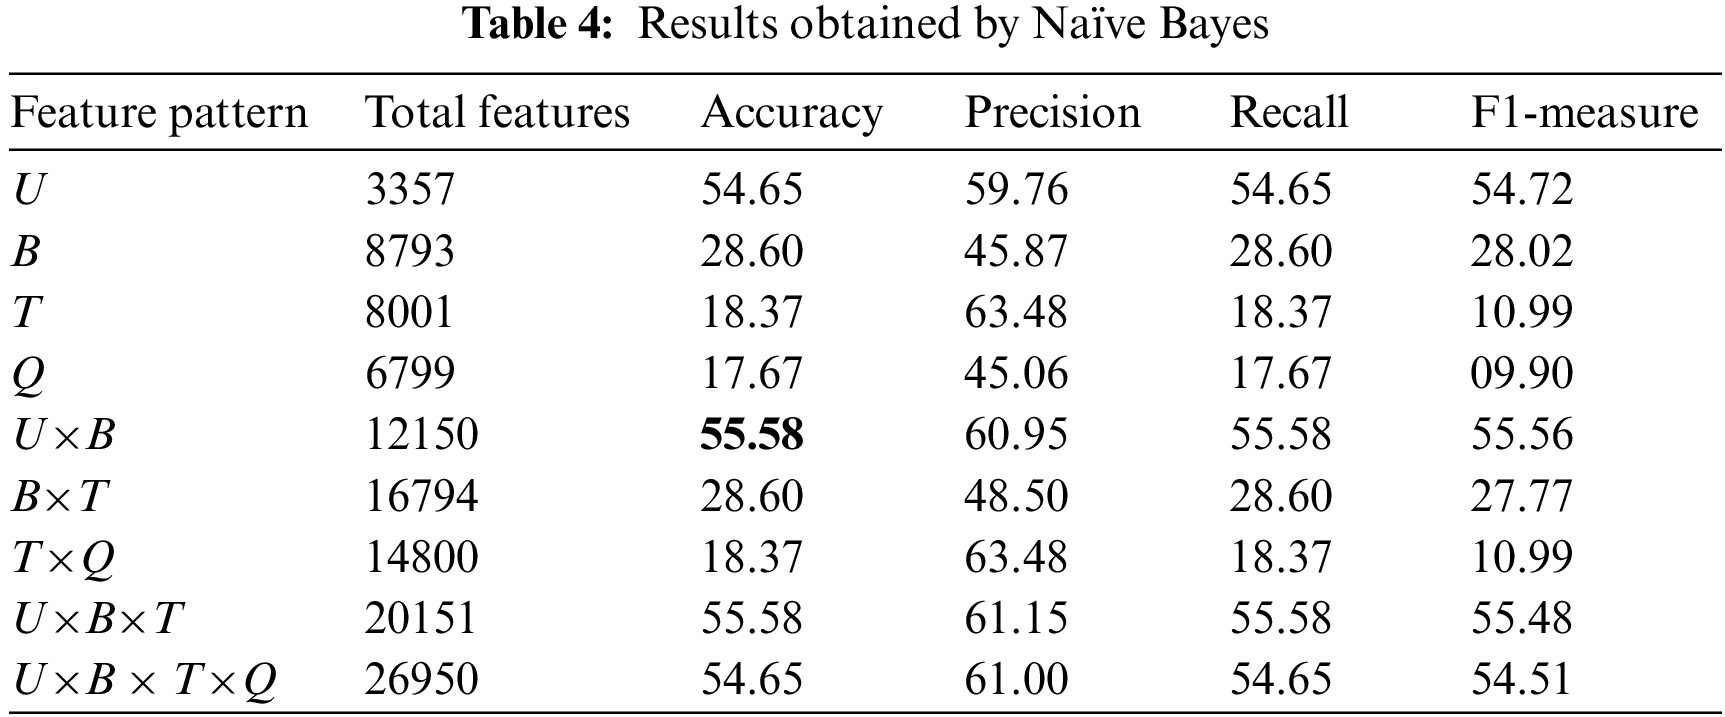


Figure 3: Accuracy comparison of all classifiers
Another disadvantage to be considered of these feature patterns is that since they are large in size especially when compared with U which only considers unique features, hence comparatively less in number, while the rest considers the cartesian product, they are computationally costly especially when the dataset is considerably large. We discuss this part of our results in the following section.
As we discussed in the last subsection that feature patterns can have different results in terms of accuracy and we insist that they have different computational costs as well. Therefore, to find the best possible parameters, we need to consider both accuracy and the cost of selected feature patterns. To do that, consider a pool of experiments Ex = {ex1, ex2, ex3, … , exn}, whereas existands for an experiment and its accuracy is denoted as ei.Accuracy. Meanwhile, ei.trtime and ei.tetime represents the time taken to perform training and testing exi respectively. Therefore, we can define TrainingSuitability of exi as:
whereas
whereas

We see that from all feature patterns mentioned in the table above, training and execution time is minimum with U for all classifiers, and it keeps increasing with every feature pattern when forming a cartesian product, even if the difference is not that significant, it is understood that the U has a lowest computational cost because of least number of features. Now, using
which is the weighted average of our

It is evident from the results that like accuracy, RF outperformed the other classifiers in suitability as well on all feature patterns. However, even though SVM performed better than kNN in terms of accuracy, but kNN got more suitability than SVM because of the high computational cost of the later on all feature patterns except U

Figure 4: Suitability analysis for the most promising features
In this paper, we have proposed a machine learning-based approach for psychotic issues classification associated with the excessive use of social networks. The proposed system helped the psychiatrist and other people who are working in the healthcare sector to get an insight into what might be happening with someone's mental state who posted the content on the social network. For this analysis, we have chosen Facebook as a primary source of investigation because of its widespread usage and popularity. Our proposed approach is based on different modules i.e., data collection and annotation, data pre-processing and splitting, feature selection and feature weighting, and machine learning models training and testing. To demonstrate the effectiveness of the proposed system, we have performed different experiments with ML classifiers by using the applications of different feature selection techniques. We have observed that RF classifier outperformed the competitor classifiers (SVM, KNN, NB) with the uni-gram-based feature set. We also performed a suitability analysis by using a cost-benefit function, to discover the best solution (classifier) that is suitable for the psychotic behavior classification problem. By using the applications of suitability analysis, we observed that the best solution to address the given problem is to apply RF classifier to a unigram-based feature set, both to train and test the model on unlabeled post updates. As future work, we will continue working on psychotic behavior classification towards psychotic behavior mining from social media text which is still in its infancy and yet to cover a long way moving forward. Furthermore, we will keep working on extracting more data of interest and plan to apply deep learning-based approaches to improve the classification results.
Funding Statement: The authors received no specific funding for this study.
Conflicts of Interest: The authors declare that they have no conflicts of interest to report regarding the present study.
1. Y. Li, Z. Zhang, Y. Peng, H. Yin and Q. Xu, “Matching user accounts based on user generated content across social networks,” Future Generation Computer Systems, vol. 83, pp. 104–115, 2018. [Google Scholar]
2. A. Noureen, U. Qamar and M. Ali, “Semantic analysis of social media and associated psychotic behavior,” in 2017 13th Int. Conf. on Natural Computation, Fuzzy Systems and Knowledge Discovery (ICNC-FSKD), Guilin, China, pp. 1621–1630, 2017. [Google Scholar]
3. E. Highton-Williamson, S. Priebe and D. Giacco, “Online social networking in people with psychosis: A systematic review,” International Journal of Social Psychiatry, vol. 61, no. 1, pp. 92–101, 2015. [Google Scholar]
4. F. M. Plaza-del-Arco, M. T. Mart'in-Valdivia, L. A. Ureña-López and R. Mitkov, “Improved emotion recognition in spanish social media through incorporation of lexical knowledge,” Future Generation Computer Systems, vol. 110, pp. 1000–1008, 2020. [Google Scholar]
5. T. Zhu, Y. Ning, A. Li and X. Xu, “Using decision tree to predict mental health status based on web behavior,” in 2011 3rd Symp. on Web Society, Port Elizabeth, South Africa, pp. 27–31, 2011. [Google Scholar]
6. “Depression (mood) - Wikipedia.” https://en.wikipedia.org/wiki/Depression_(mood) (Accessed Oct. 25, 2021). [Google Scholar]
7. J. Zhou, H. Zogan, S. Yang, S. Jameel, G. Xu et al., “Detecting community depression dynamics due to covid-19 pandemic in Australia,” IEEE Transactions on Computational Social Systems, vol. 8, no. 4, pp. 958–967, 2021. [Google Scholar]
8. A. Roy, K. Nikolitch, R. McGinn, S. Jinah, W. Klement et al., “A machine learning approach predicts future risk to suicidal ideation from social media data,” NPJ Digital Medicine, vol. 3, no. 1, pp. 1–12, 2020. [Google Scholar]
9. R. Sawhney, H. Joshi, S. Gandhi and R. Shah, “A Time-aware transformer based model for suicide ideation detection on social media,” in Proc. of the 2020 Conf. on Empirical Methods in Natural Language Processing (EMNLP), Punta Cana, Dominican Republic, pp. 7685–7697, 2020. [Google Scholar]
10. Y. Zhang, H. Lyu, Y. Liu, X. Zhang, Y. Wang et al., “Monitoring depression trend on twitter during the COVID-19 pandemic,” JMIR Infodemiology, vol. 1, no. 1, pp. e26769, 2020. [Google Scholar]
11. S. Saifullah, Y. Fauziah and A. S. Aribowo, “Comparison of machine learning for sentiment analysis in detecting anxiety based on social media data,” Jurnal Informatika, vol. 15, no. 1, pp. 45–55, 2021. [Google Scholar]
12. M. Chau, T. M. H. Li, P. W. C. Wong, J. J. Xu, P. S. F. Yip et al., “Finding people with emotional distress in online social media: A design combining machine learning and rule-based classification,” MIS Quarterly, vol. 44, no. 2, pp. 933–955, 2020. [Google Scholar]
13. M. Ali, S. Khalid and M. H. Aslam, “Pattern based comprehensive urdu stemmer and short text classification,” IEEE Access, vol. 6, pp. 7374–7389, 2017. [Google Scholar]
14. N. Wang, F. Luo, Y. Shivtare, V. D. Badal, K. P. Subbalakshmi et al., “Learning models for suicide prediction from social media posts,” in Proc. of the Seventh Workshop on Computational Linguistics and Clinical Psychology: Improving Access, Online, pp. 87–92, 2021. [Google Scholar]
15. Y. Zhang, H. Lyu, Y. Liu, X. Zhang, Y.Wang et al., “Monitoring depression trends on twitter during the COVID-19 pandemic: Observational study,” JMIR Infodemiology, vol. 1, no. 1, pp. e26769, 2021. [Google Scholar]
16. X. Chen, M. D. Sykora, T. W. Jackson and S. Elayan, “What about mood swings: Identifying depression on twitter with temporal measures of emotions,” in Companion Proc. of the the Web Conf. 2018, Lyon, France, pp. 1653–1660, 2018. [Google Scholar]
17. A. G. Reece, A. J. Reagan, K. L. M. Lix, P. S. Dodds, C. M. Danforth et al., “Forecasting the onset and course of mental illness with twitter data,” Scientific Reports, vol. 7, no. 1, pp. 1–11, 2017. [Google Scholar]
18. M. R. Islam, M. A. Kabir, A. Ahmed, A. R. M. Kamal, H. Wang et al., “Depression detection from social network data using machine learning techniques,” Health Information Science and Systems, vol. 6, no. 1, pp. 1–12, 2018. [Google Scholar]
19. A. Kumar, A. Sharma and A. Arora, “Anxious depression prediction in real-time social data,” in Int. Conf. on Advances in Engineering Science Management & Technology (ICAESMT), Dehradun, India, 2019. [Google Scholar]
20. J. Kim, J. Lee, E. Park and J. Han, “A deep learning model for detecting mental illness from user content on social media,” Scientific Reports, vol. 10, no. 1, pp. 1–6, 2020. [Google Scholar]
21. Z. Peng, Q. Hu and J. Dang, “Multi-kernel SVM based depression recognition using social media data,” International Journal of Machine Learning and Cybernetics, vol. 10, no. 1, pp. 43–57, 2019. [Google Scholar]
22. A. Benton, M. Mitchell and D. Hovy, “Multi-task learning for mental health using social media text,” in Proc. of the 15th Conf. of the European Chapter of the Association for Computational Linguistics: Volume 1, Long Papers, Valencia, Spain, pp. 152–162, 2017. [Google Scholar]
23. M. -Y. Chang and C. -Y. Tseng, “Detecting social anxiety with online social network data,” in 2020 21st IEEE Int. Conf. on Mobile Data Management (MDM), Versailles, France, pp. 333–336, 2020. [Google Scholar]
24. A. Saha, A. Al Marouf and R. Hossain, “Sentiment analysis from depression-related user-generated contents from social media,” in 2021 8th Int. Conf. on Computer and Communication Engineering (ICCCE), Kuala Lumpur, Malaysia, pp. 259–264, 2021. [Google Scholar]
25. H. Alhuzali, T. Zhang and S. Ananiadou, “Predicting sign of depression via using frozen pre-trained models and random forest classifier,” Working Notes of CLEF, Bucharest, Romania, pp. 21–24, 2021. [Google Scholar]
26. T. K. Ho, “Random decision forests,” in Proc. of 3rd Int. Conf. on Document Analysis and Recognition, Montreal, QC, Canada, pp. 278–282, 1995. [Google Scholar]
27. M. Ali, A. Baqir, G. Psaila and S. Malik, “Towards the discovery of influencers to follow in micro-blogs (Twitter) by detecting topics in posted messages (Tweets),” Applied Sciences, vol. 10, no. 16, pp. 5715, 2020. [Google Scholar]
28. M. Ali, H. Mushtaq, M. B. Rasheed, A. Baqir and T. Alquthami, “Mining software architecture knowledge: Classifying stack overflow posts using machine learning,” Concurrency and Computation: Practice and Experience, pp. e6277, 2021. [Google Scholar]
29. Z. Nabeel, M. Mehmood, A. Baqir and A. Amjad, “Classifying emotions in roman urdu posts using machine learning,” in 2021 Mohammad Ali Jinnah University Int. Conf. on Computing (MAJICC), Karachi, Pakistan, pp. 1–7, 2021. [Google Scholar]
30. S. Alsaleem, “Automated arabic text categorization using SVM and NB.,” The International Arab Journal of Information Technology, vol. 2, no. 2, pp. 124–128, 2011. [Google Scholar]
31. F. U. Mustafa, I. Ashraf, A. Baqir, U. Ahmad, S. Malik et al., “Prediction of user's interest based on urdu tweets,” in 2020 Int. Symp. on Recent Advances in Electrical Engineering & Computer Sciences (RAEE & CS), Islamabad, Pakistan, vol. 5, pp. 1–6, 2020. [Google Scholar]
32. K. Ahmed, M. Ali, S. Khalid and M. Kamran, “Framework for urdu news headlines classification,” Journal of Applied Computer Science & Mathematics, vol. 21, no. 21, pp. 17–21, 2016. [Google Scholar]
33. M. Ali, S. Khalid, M. I. Rana and F. Azhar, “A probabilistic framework for short text classification,” in 2018 IEEE 8th Annual Computing and Communication Workshop and Conf. (CCWC), Las Vegas, USA, pp. 742–747, 2018. [Google Scholar]
34. Z. Abbass, Z. Ali, M. Ali, B. Akbar and A. Saleem, “A framework to predict social crime through twitter tweets by using machine learning,” in 2020 IEEE 14th Int. Conf. on Semantic Computing (ICSC), San Diego, USA, pp. 363–368, 2020. [Google Scholar]
35. M. -L. Zhang and Z. -H. Zhou, “A review on multi-label learning algorithms,” IEEE Transactions on Knowledge and Data Engineering, vol. 26, no. 8, pp. 1819–1837, 2013. [Google Scholar]
 | This work is licensed under a Creative Commons Attribution 4.0 International License, which permits unrestricted use, distribution, and reproduction in any medium, provided the original work is properly cited. |