DOI:10.32604/cmc.2022.024843
| Computers, Materials & Continua DOI:10.32604/cmc.2022.024843 | |
| Article |
Deep Learning Framework for Classification of Emoji Based Sentiments
Shah Abdul Latif University, Khairpur, 77150, Pakistan
*Corresponding Author: Nighat Parveen Shaikh. Email: nighat.salu.edu@gmail.com
Received: 01 November 2021; Accepted: 25 January 2022
Abstract: Recent patterns of human sentiments are highly influenced by emoji based sentiments (EBS). Social media users are widely using emoji based sentiments (EBS) in between text messages, tweets and posts. Although tiny pictures of emoji contains sufficient information to be considered for construction of classification model; but due to the wide range of dissimilar, heterogynous and complex patterns of emoji with similar meanings (SM) have become one of the significant research areas of machine vision. This paper proposes an approach to provide meticulous assistance to social media application (SMA) users to classify the EBS sentiments. Proposed methodology consists upon three layers where first layer deals with data cleaning and feature selection techniques to detect dissimilar emoji patterns (DEP) with similar meanings (SM). In first sub step we input set of emoji, in second sub step every emoji has to qualify user defined threshold, in third sub step algorithm detects every emoji by considering as objects and in fourth step emoji images are cropped, after data cleaning these tiny images are saved as emoji images. In second step we build classification model by using convolutional neural networks (CNN) to explore hidden knowledge of emoji datasets. In third step we present results visualization by using confusion matrix and other estimations. This paper contributes (1) data cleaning method to detect EBS; (2) highest classification accuracy for emoji classification measured as 97.63%.
Keywords: Deep learning; machine vision; convolutional neural networks; social media; emoji based sentiments
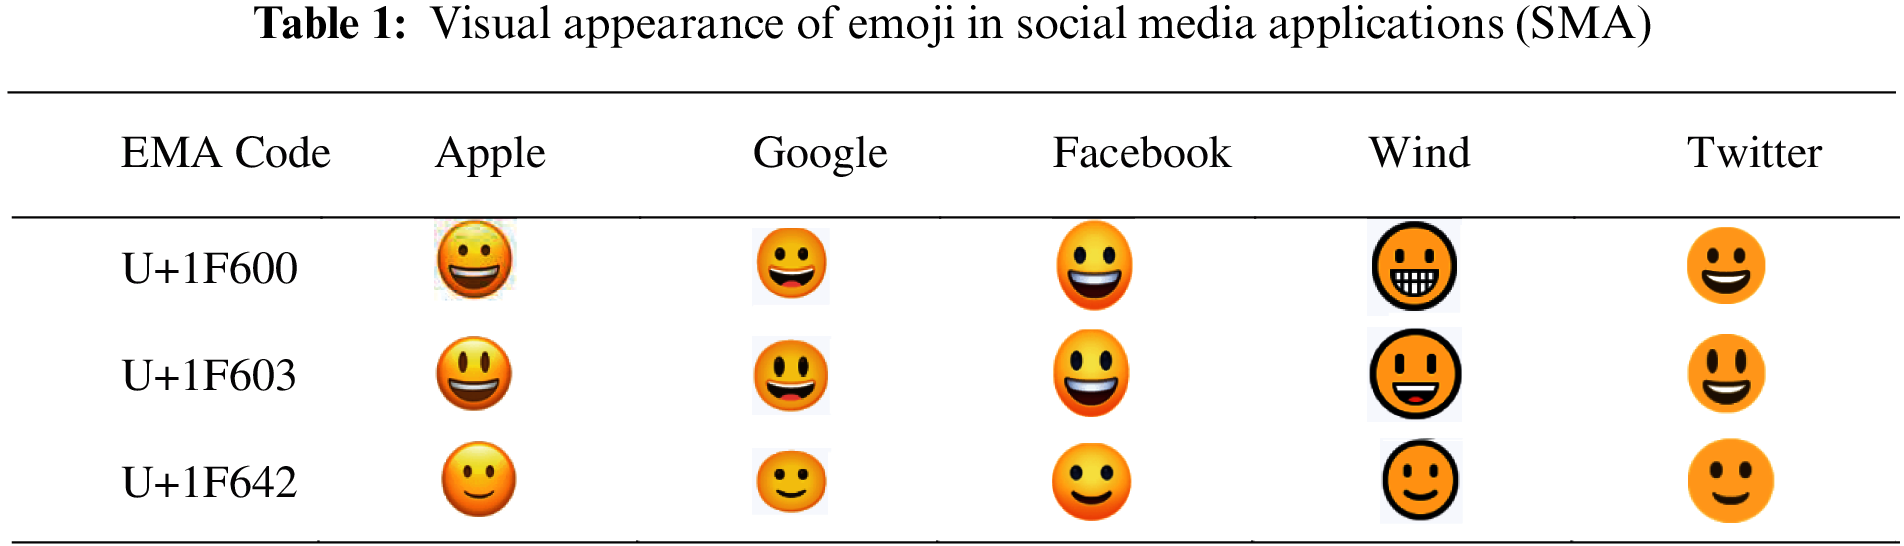
Although; every emoji based sentiment (EBS) contains very high amount of information that carries a very rich knowledge about the human feelings, emotions and intuitions. However the use of efficient machine learning techniques would provide more meticulous assistance to social media application (SMA) users to find the deepest hidden knowledge of EBS emotions [1–3]. A single emoji based sentiment (EBS) itself is a complete message if decrypted properly [4,5]. Every emoji of similar group interprets dissimilar meaning (DSM) in the text message services of various SMA applications, because emoji consists upon complex features, heterogynous morphologies and dissimilar appearances. As shown in Tab. 1 that U+1F600 Unicode has dissimilar appearance and morphology in the text messages of WhatsApp, Facebook, Google, twitter and other SMA [6]. For example shape of grinning smile in WhatsApp appears like  and grinning smile shape in Facebook appears
  like with same Unicode U+1F600, there is strong variation in emoji symbols (ES) [7–9]. Thus classification of EBS have become one of the significant research problems and it needs significant methods to be solved with higher accuracies [10]. In order to resolve all above stated problems, this paper offers an approach to classify the EBS and to find out the deepest knowledge of emoji based sentiments (EBS). First layer of our proposed method performs data cleaning operations and selects dissimilar emoji patterns (DEP). In first sub step we input set of emoji, in second sub step every emoji has to qualify user defined threshold.
In third sub-step proposed method performs auto detection of emoji on the basis of associated properties to activate the auto crop function as a region of interest (ROI). At final sub-step a user defined class label attribute is added and data is converted into tensor flow data format in a  ST-02
ST-02  , ST-03
  , ST-04
  , ST-05
  , ST-06
  , ST-07
  , ST-08
  , ST-09
  , ST-010
  .
.
This paper is organized into several sections where section one presents introduction and section two describes literature review; whereas methodology is described in section three. The section four is dedicated to demonstrate the results of this research article; whereas final section is devoted to describe the conclusion of this paper.
Classification of emoji based sentiments (EBS) is one of the significant research problems and fall into predictive mining domain where identification of emoji patterns would provide more precise results to social media (SMA) users. Our proposed approach offers a data cleaning method and highest classification accuracy to classify the dissimilar emoji patterns (DEP) with similar meaning (SM). Following related literature review is presented in three sub-sections where development of emoji based sentiments (EBS) is discussed in sub Section 2.1, machine vision techniques are described in sub Section 2.2; whereas related research approaches are presented in sub-Section 2.3.
2.1 Emoji Based Sentiments (EBS)
Emoji based sentiment (EBS) itself considered as fully communicable language and emoji are small pictogram, logograms or smiley symbols that can be used instated of text messages. Emoji has reshaped the nonverbal conversation by introducing symbols which not only to represents the smiley face with thousands of moods but also it can cover a wide range of events, situations and sentiments. For example; weather, food, school, transport, animals and etc. [11]. The concept of graphical representation of emotions was presented by Russian professor Vladimir Nabokov in 1960 during his interview with The New York Times, however the ideas of using emotions in mobile based IMSs was proposed by Scott Fahlman in 1990 and Japanese mobiles introduce basic smileys in 1997 [12]. Emoji were comprising over12 × 12 pixel and can easily be used independently or within the text. EBS were developed by using Unicode approved by International standard organization (ISO) standardized emoji vide ISO-15924 script code which is supported by all operating system including android operating systems. In recent years emoji EBS most attractive option for conversation worldwide and animated emoji.
Recent advancements in computer vision has enabled computers to identify, recognize and predict various objects of real-world objects. EBS Images are comprising over finite set of pixels. A two dimensional array of numerical quantities represents the images as per existence of internal memory of the computer but due to the development of efficient algorithms of artificial intelligence, computers are increasing their capability to recognize the objects by analyzing various dimensions of EBS. Detection of sets of pixels is considered as object detection. Object detection can be done by using various algorithms, where threshold segmentation [13], canny edge detection [14], super pixels [15] and graph cut segmentation could be used [16]. Detection of Emoji is unique problem because it lies in between the text messages in SMAs. Seed approximation is quit helpful to detect the emoji and estimated cropping could be done by finding the circles around the emoji. Random walk algorithm (RWA) is useful for seed approximation (SA) in an image. RWA is very efficient algorithm which visits each pixel of the image and detects the object and background separately [17]. RWA takes probability by considering nodes, arcs and weights where each pixel is denoted as node and connected set of similar nodes on the basis of pixel intensity (assigned to each pixel as weight) [18]. Assume that each emoji is a connected graph where node
2.3 Related Research Approaches
First: A sentiment [19] analysis using EBS data was proposed and textures, bag of words features were extracted and deep learning models were used to predict the sentiments. Texture matching, RNN, CNN and CBOW machine learning techniques were compared for classify the EBS sentiments and highest classification accuracy was reported as 90% by authors, whereas we propose a data cleaning method to detect the emoji images from the set of complex patterns of Facebook posts and WhatsApp messages and our approach received 97.63% accuracy.
Second: Tweet based EBS datasets [20] were classified to predict the sentiments. In their methodology Emoji were loaded into vector data on 0.5 threshold similarity index to detect similar patterns of emoji based sentiments and estimated classification accuracy was recorded as 85.5%, whereas our method auto-detect EBS and convert them into
Third: Emoji based sentiments (EBS) were collected from the tweets to perform sentiment analysis [21]. Two machine learning techniques Random Forest and Support vector machine were used to build models. Best classification accuracy approximated as 65.2%. Emoji images are complex, heterogeneous and found dissimilar appearance in social media applications, therefore, needs significant effort to preprocess and we consider morphometric features and tensor flow based features to classify the EBS and to train the classifier.
A comparison [22] of neural network classifier was presented and EBS sentiments’ datasets were trained to find the deepest hidden knowledge of datasets. The best classification accuracy was approximated as 80.56%. Whereas we obtained 97.63% overall classification accuracy for EBS sentiments’ datasets.
An emoji classification technique [23] was proposed where text scores were evaluated using bag of words to identify the emoji. The feature of Bag of words and CNN architecture was used to build the classification model. Reported classification accuracy remained 35.50%, whereas our approach proposes a preprocessing method with highest classification accuracy.
An unsupervised classification [24] approach was proposed to classify the emoji with similar meaning. AI base K-means clustering technique was used and the accuracy is not shown by authors, whereas we follow supervised classification method.
Emoji unsupervised [25] classification techniques was proposed to find out the pattern of happy, fun, love on the basis of similarity. K-means clustering technique was used whereas classification accuracy is not reported, whereas we obtained 97.63% classification accuracy.
Emoji sentiment analysis [26] was proposed. SMO classifier was used to build model. Classification accuracy was recorded as 90.10%, we consider emoji as an image and offer a preprocessing method.
Emoji based sentiment data [27] was classified by using Bayesian network, perceptron neural network machine learning algorithms and best accuracy was recorded as 97.23%, whereas we obtained highest classification accuracy for emoji datasets.
Our proposed approach investigates to extract the patterns of EBS sentiments recorded from the students’ text messages, tweets and posts on social media applications (SMA). Since appearance of every emoji based sentiment is dissimilar in appearance among the SMA applications i.e., WhatsApp, Facebook, twitter, google and others. Due to this reason we consider emoji as image data. We propose a methodology to prepare EBS sentiments posted under the umbrella of SMA. Overall classification accuracy of our proposed approach was recorded as approximately 97.63%.
The proposed methodology of this article deals with the classification problem of emoji based sentiments (EBS) and falls into the category of predictive mining. Since dissimilar emoji patterns (DEP) with similar meanings (SM) from social media applications (SMA) are very hard to detect as object in set of images of WhatsApp, Facebook and other SMA applications. This paper contributes (1) a data cleaning method to auto-detect emoji based sentiments (EBS) from text messages, tweets and posts and (2) our proposed approach proposes highest classification accuracy as 97.63% approx. The methodology is divided into three layers where first layer prepares data by applying data cleaning operations and second layer constructs classification model and third layer presents results visualization as shown in Fig. 1.
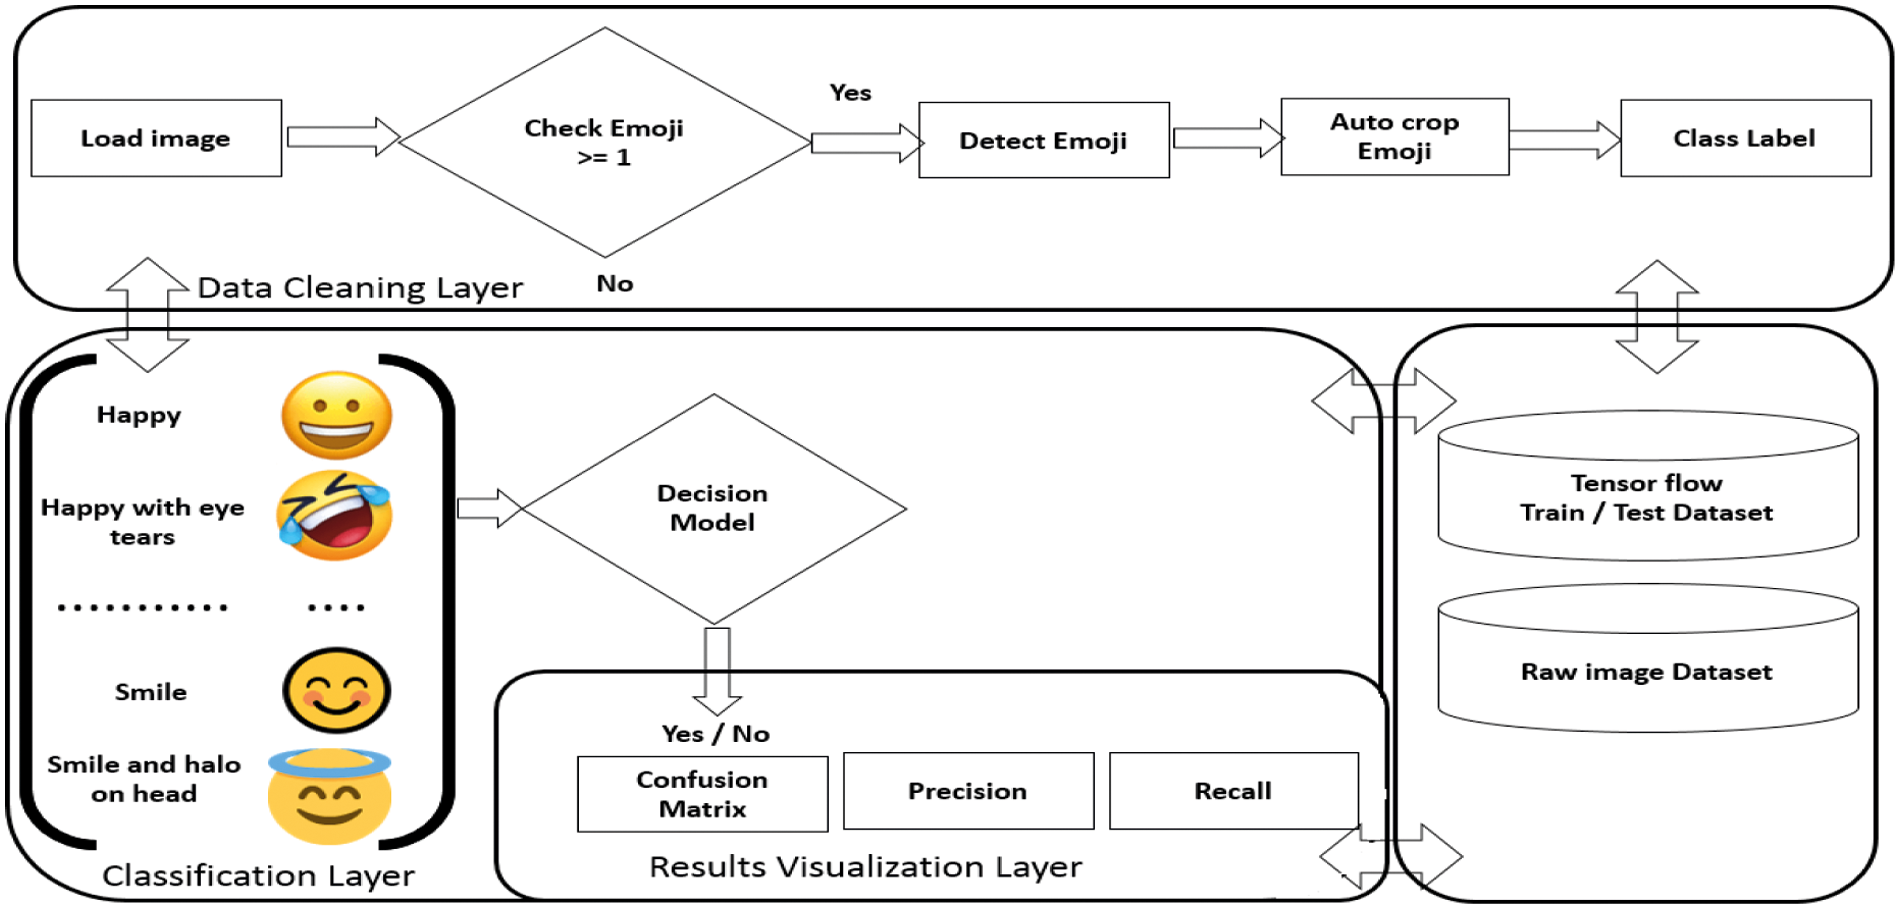
Figure 1: Deep Learning framework for classification of emoji based sentiments workflow
Used dataset contains 16000 Facebook pages of text messages and WhatsApp group's chat messages. Approximated 2.5 million reactions and 0.5 million comments were made upon the online education system over SMA. The SMA groups were created to conduct the research on sentiment analysis at Shah Abdul Latif University (SALU), Pakistan during the pandemic periods of COVID-19 from April, 2020-March, 2021. In the comments section a very rich information was available in the format of text messages, posts and tweets. Around 1,364,206 comments were posted by the university students and almost 2,532,361 emoji based sentiments (EBS) were used to show their opinion. We selected 10 EBS shapes because they were found with high frequency. Used datasets contain 143144 emoji based sentiments (EBS) observations, out of them ten most common EBS sentiments (ST) were selected to form datasets as described below.
The sentiment (ST) expression ST 1 is represented by using whereas ST 2 is defined with symbol , ST 3 is shown as , ST 4 is presented as , ST 5 is described with , ST 6 is exposed with , ST 7 is denoted with , ST 8 is displayed with , ST 9 expression is shown with and ST 10 is exemplified with .
Data cleaning layer is responsible to prepare the datasets by apply data cleaning operations to detect the emoji based sentiments EBS from the complex and heterogeneous images of WhatsApp, Facebook and others SMA application. Let's consider that gabber filter bank have been used to find out the presence of such emotions. Parameters and thickness of various particles of emoji described by
Let's consider an emoji is composed
The filters
As per above Eq. (1) maximization parameter corresponds to search pixel by pixel emoji quantities under the filter bank denoted by filter
Considering the emoji as shape of ellipse, theoretically elliptical filters are more better among the ring shaped filters because the filters are capable to generate more stronger responses but some ofthe parameters such as major or minor axis and angle with rotations could consume time to find out the shape of ellipse as per emoji features therefore it is quit feasible to use larger searching strategy and space to use NCC operations and our used ring shaped filters have provided assistance to detect the circular and elliptical shapes of emoji were kept as BI which were persisting in WhatsApp as well as in Facebook images Fig. 2.
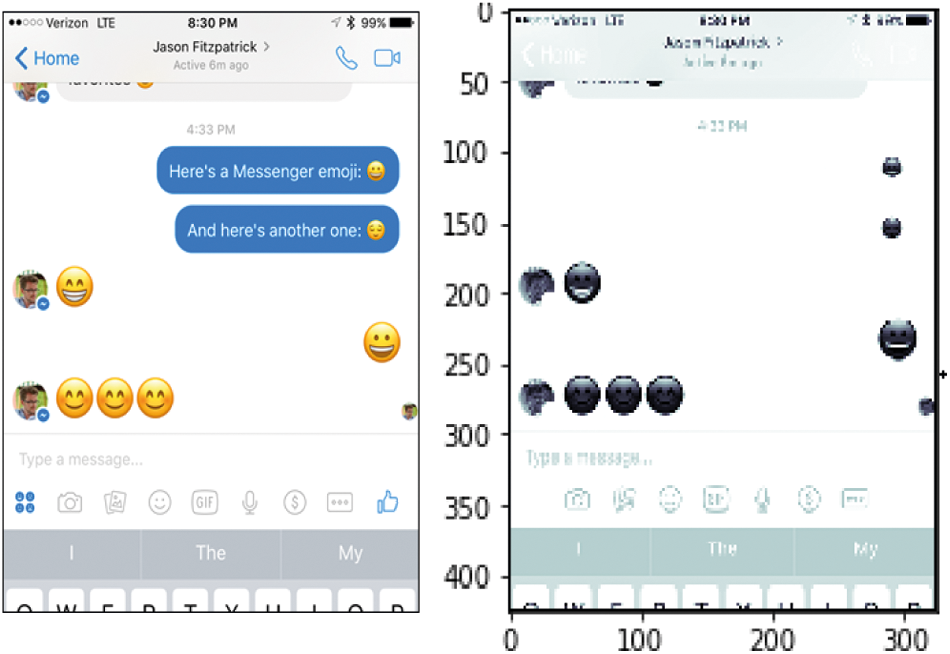
Figure 2: DES emoji object detection
A three intensity based responses are approximated to classify the emoji by using standard k-means clustering method where WR (weak responses) as shown in Fig. 3 and recorded from emoji structures, SR (strong responses) estimated for representation potential emoji and BR (background response) which is to be omitted by k-means clustering method [30].
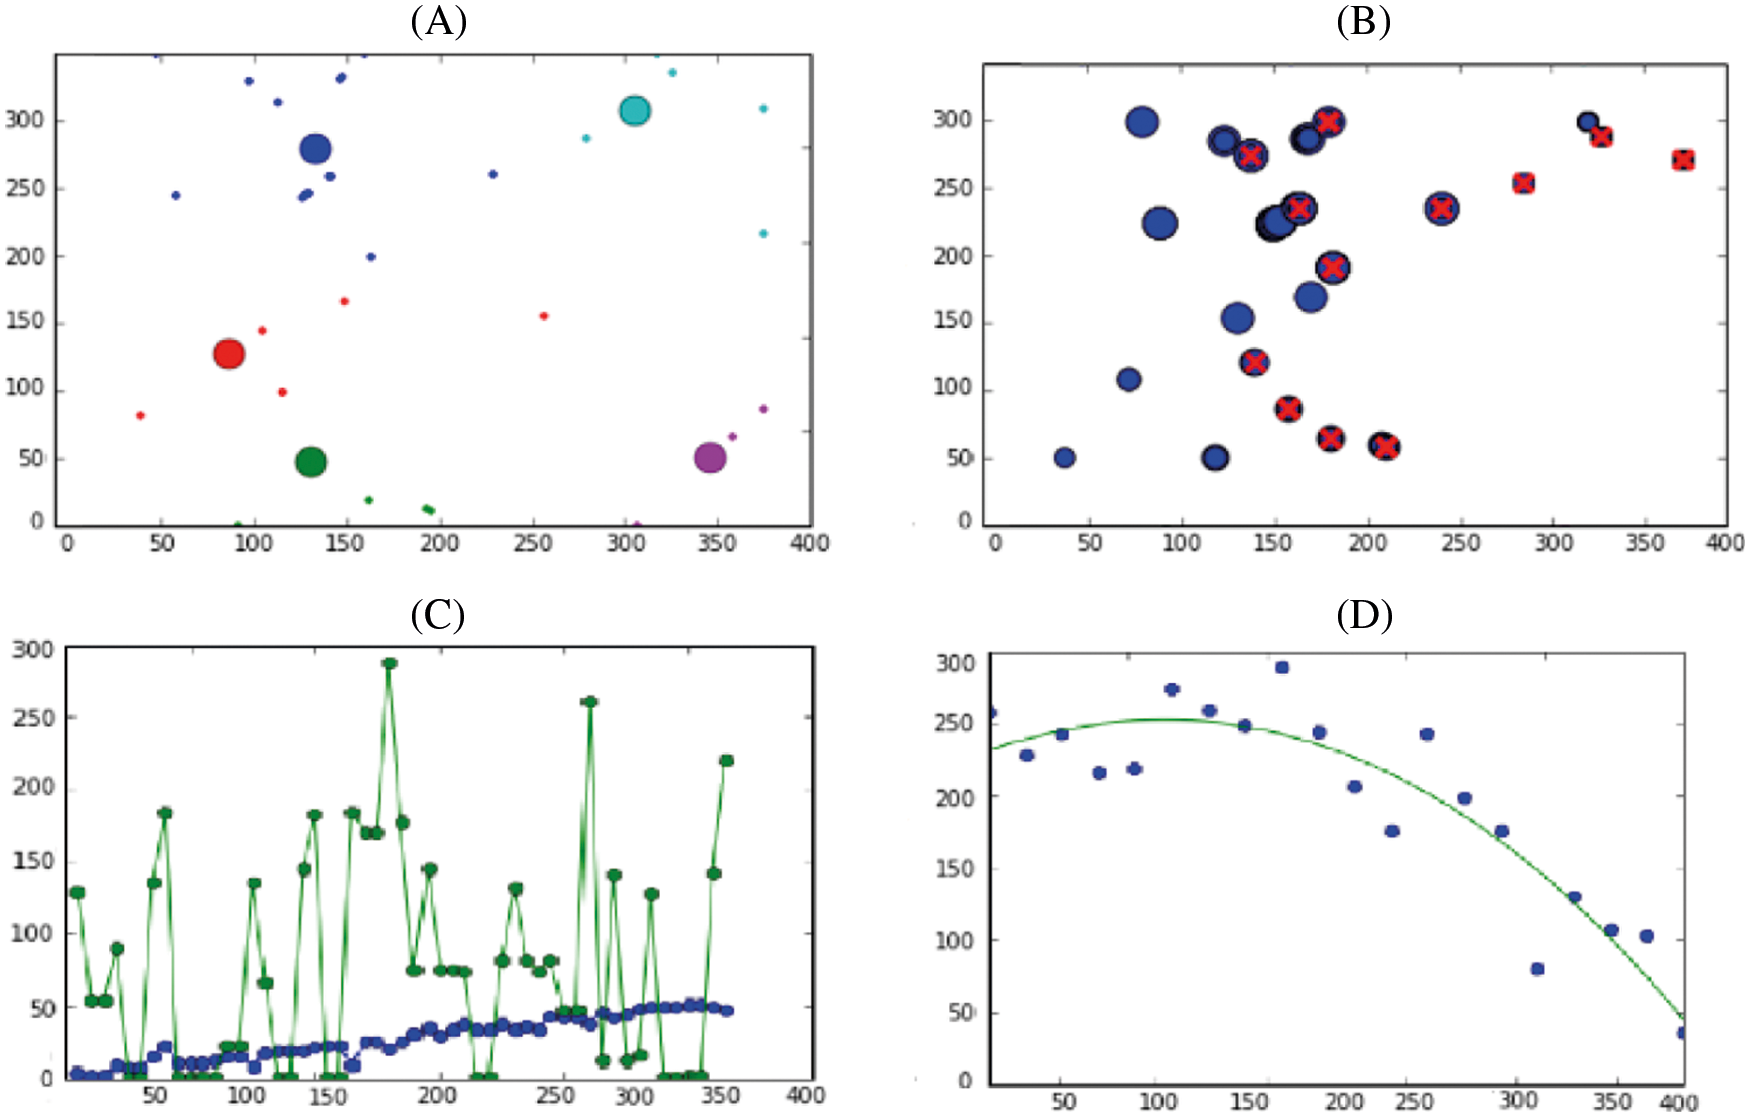
Figure 3: In (A) Emoji k-clusters are extracted (B) weak responses and strong responses of Emoji based sentiment data are selected (c) Strong responses vs. Weak responses are estimated and (D) strong responses are selected and weak responses are omitted
DES detection could be done from the several number of emoji objects as shown Fig. 2. The text could be found emerged with the emojis but removal of inconsistent data as per our cause has been removed and then auto crop function has been applied to detect the each DES object.
Auto crop function [31] requires some parameters to cut sub-image as per area of emoji. A spatial positions of the emoji contributing pixels could be estimated by using Eq. (2), where A represents the area of emoji which is estimation of total number of columns and rows represented with
The longest diameter of the EBS could be found by using
Using connected component analysis, nuclei seeds can be obtained by computing the mass center of each isolated pixel cluster classified as strong responses. System cropped EBS from WhatsApp and Facebook messages various sizes and we resized them 28 * 28 pixels. Preprocessing technique cropped 100000 EBS having various class labels. We selected most common EBS as described in datasets details. The selected 250000 EBS used for training and testing purposes with the ratio of 80/20.
We build CNN based architecture which consists upon input layer to deal the tensor flow data, hidden layer to extract the deepest knowledge of the datasets, whereas in case of feed forwarded network middle layer because all above stated layers coordinates to solve the classification problem from inputs to outputs by using masked activation function and finally convolutional neural network performs the convolutes [32].
Let's consider, a CNN model accepts inputs as tensor which defines shapes in form of number of x inputs x number of heights inputs x number of width inputs x channel inputs to represent the morphologies of emoji. Such inputs are passed to convolutional layer to define an abstract level which is said to feature map, such map is also known as activation map where number of total inputs are multiplied with feature map heights, width and channels.
As CNN are derived from the basic idea of human neurons. The visual cortex responses like neurons and each neuron processes data to its receptive field where fully connected set of neurons could learn features of particular object to recognize and classify as per data. CNN layers convolve user supplied inputs and passes the inputs to the next connected layer.
We constructed the architecture for high resolution images of EBS. Every EBS is consists upon the small size of 28 × 28 size of pixels where each pixel is considered as input feature map. 28 × 28 size pixels occupies almost 784 weights for each neurons at the second layer of decision model. the model allow image size 5 × 5 construction regions would provide more assistance to test the emoji because deeper view of pixel sets shares tilling regions by considering same weights to each layer by requiring 25 learning parameters gradient information which seems to create relation between the spatial features at the pooling and convolution stages among the neural networks [33].
Pooling layers plays important role in dimension reduction by concatenating outputs with the neurons clusters from layer one to onward layers, local pooling is involve into deep combination of smallest size of tilling sizes around 2 × 2 and global pooling turns to act as a bridge between quantiles of feature maps which is commonly called max pool layer by using max as well average highest quantiles in above stated matrix of feature map whereas min pooling deals with the maximum values persisting within the neurons. In max pooling makes image partitions as per architecture defined for particular problem. We extracted 2 × 2 features in max pooling for output to support the fully connected layer outputs because dimension reduction may protect the model from over-fit due to huge number of data observations. We use ReLU layer and it supports local and global feature operations as per Eq. (5).
The process of overfitting is also known as down-sampling which considers the parameters as memory footprint because the pooling performs its operation independent for every piece of information either any depth and slices of input and sizes by forming max pooling layer with related filters containing the size of 2 × 2 , height , width and discording quantities. Region of interest provides faster environment in object detection because optimization of max pool layer supports fast R-CNN model [34].
ReLU layer [34] works iteratively on non-saturating function which can be described as
Let's consider a fully connected convolutional layers and max pool layers are responsible for classification of EBS where every neuron as per feature map is connected to next higher layer. In such activation can be computed by considering the affine transformation along with the procedures of matrix multiplication and vector addition of learned observation are avoided by using bias offset quantities as derived from matrix multiplication values.
We approximated accuracy as Eq. (6) whereas precision as per Eq. (7) and recall measure as Eq. (8).
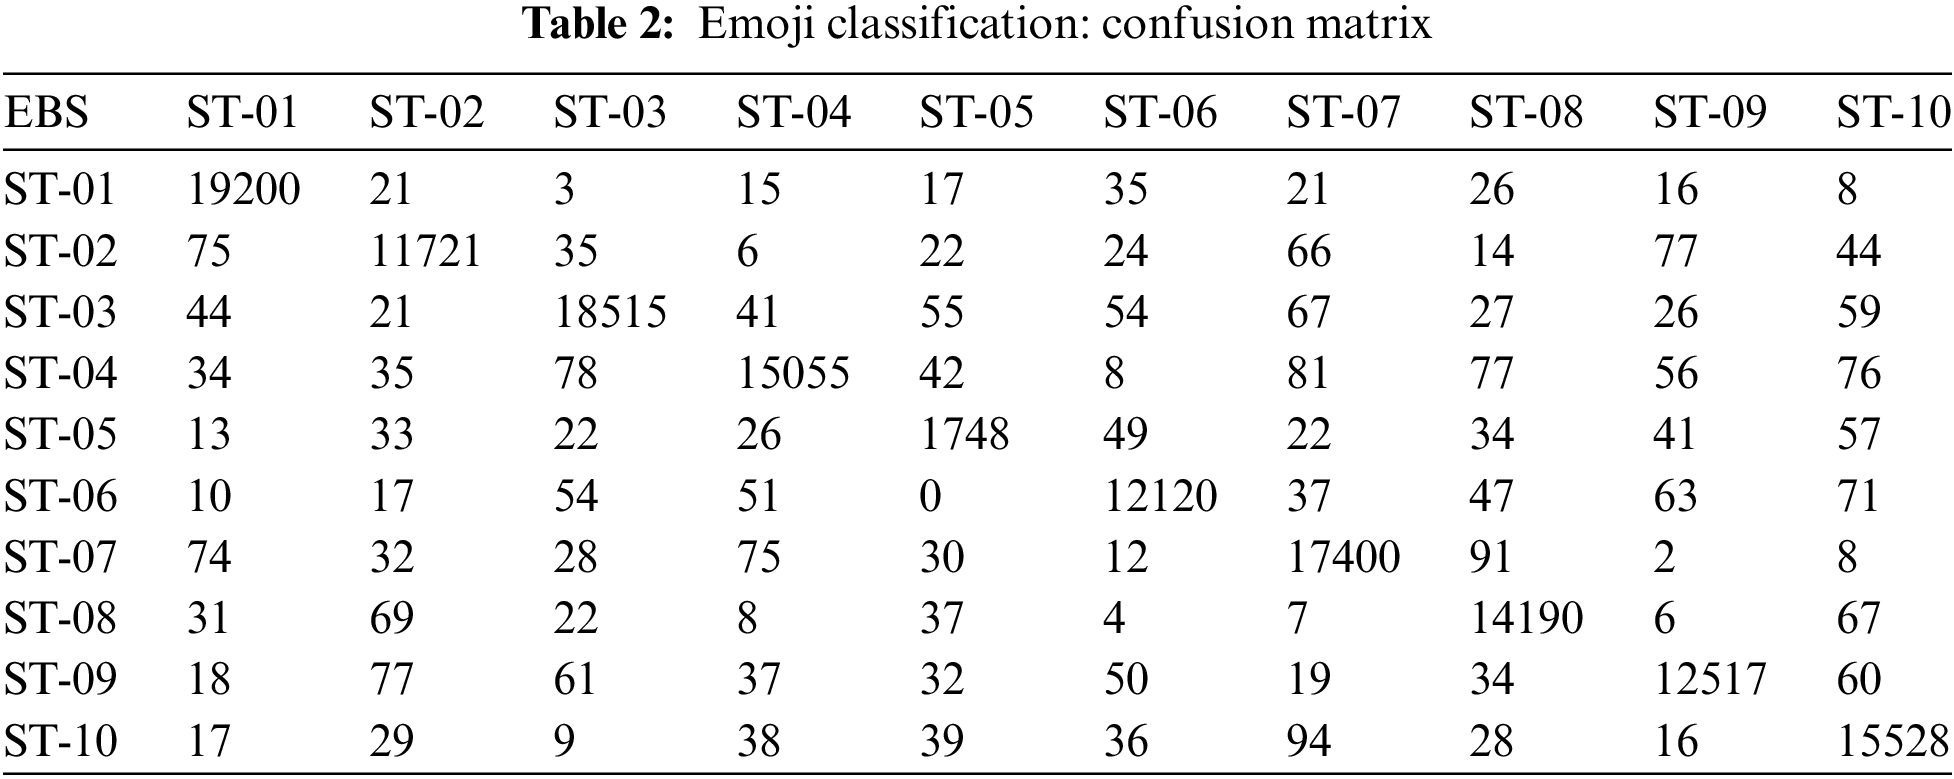
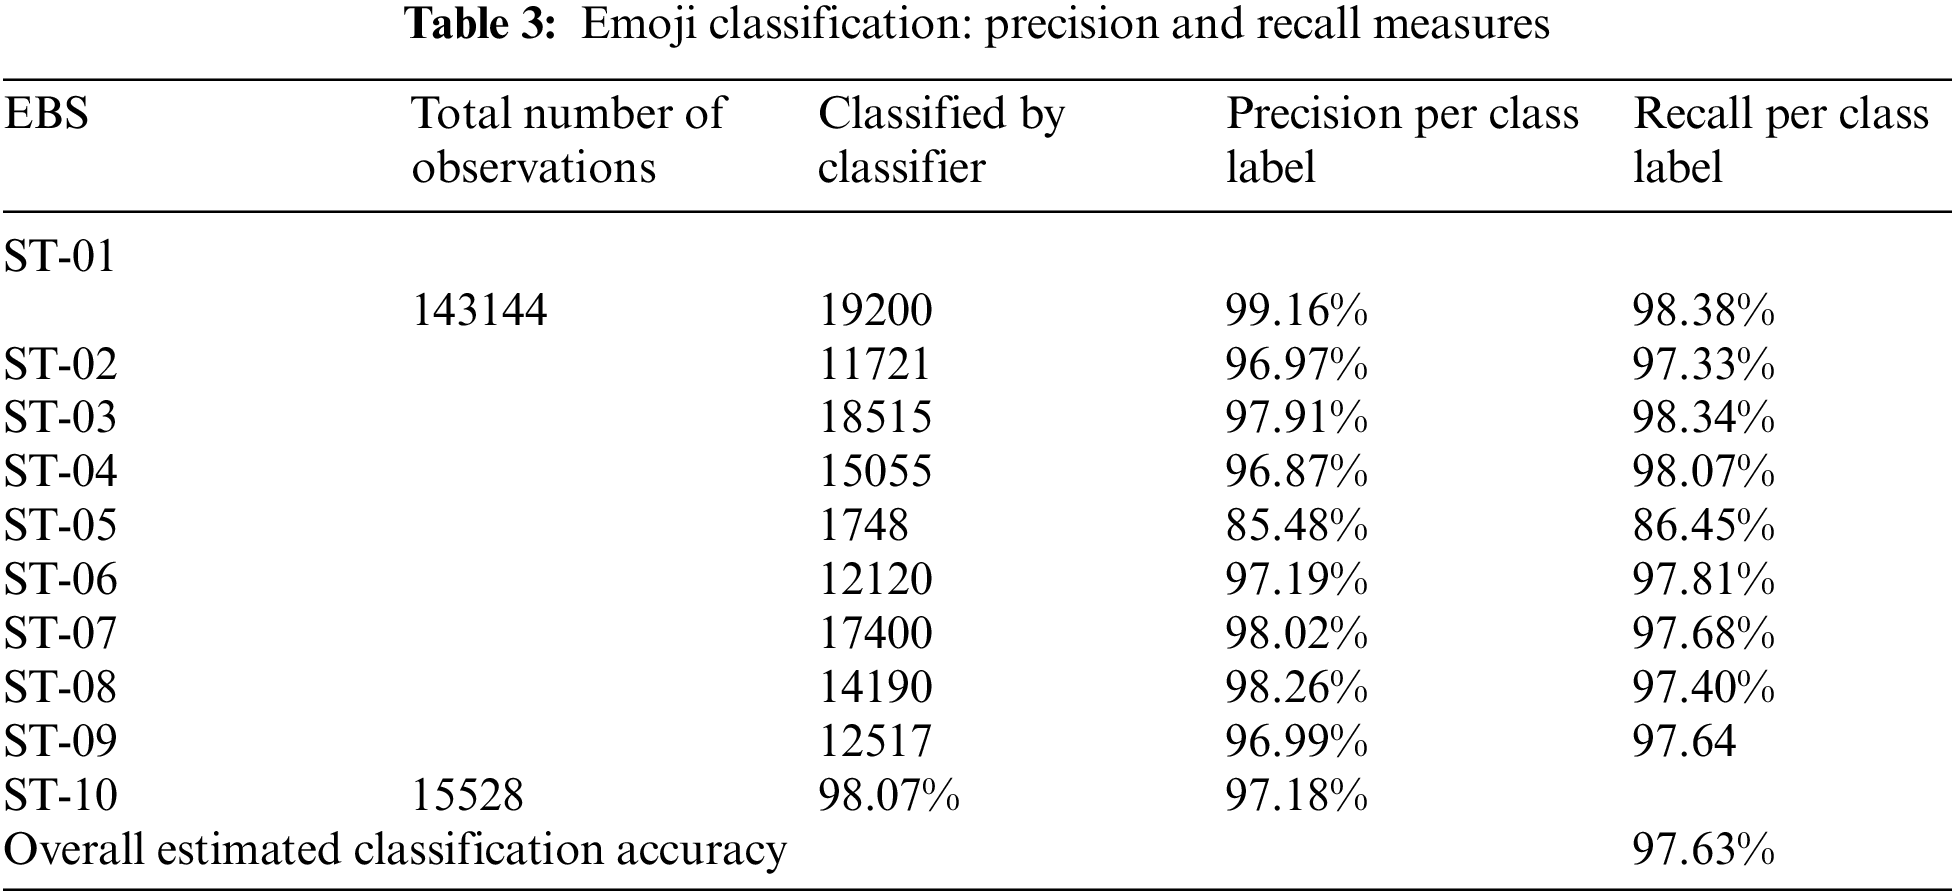
The dissimilar emoji patterns (DEP) with similar (SM) classified to assist the social media application (SMA) users and the proposed data cleaning method detected around 2,532,361. The proposed decision model was assigned 143144 observations to build the classification model by using convolutional neural network (CNN). The results for emoji based sentiment (EBS) classification are presented by using confusion matrix as shown in Tab. 2 whereas precision and recall measures are estimated for each class label attribute and shown in Tab. 3. Each class label attribute represents an emoji based sentiment (EBS) as sentiment (ST). The classifier classified 19200 observations for the class label ST-01 and the precision for ST-01 class was measured about 99.16% whereas recall measure was approximated as about 98.38%. The classification model classified 11721 observations for the class label ST-02, meanwhile estimated precision 96.97% and recall 97.33% was approximated. ST-03 type EBS were 18515 as identified by the classifier whereas 97.91% precision and 98.34% recall measure was estimated. The constructed classification model identified 15055 observation for the class label ST-04 whereas 96.87% precision and 98.07% recall was approximated. There were 1748 instances recognized by the classifier form the sentiment number ST-05, meanwhile 85.48% precision measure and 86.48% recall estimation was approximated. There were 12120 observation for the sentiment number ST-06, meanwhile 97.19% precision and 97.81% recall measure was approximated by the classifier. ST-07 class label attribute was classified by the proposed algorithm as 17400, whereas 98.02% precision was estimated and 97.68% measures were recorded. There were 14100 instances for the class label attribute ST-08, where 98.26% precision and 97.40% recall measures were estimated. The classification model recognized 12517 observations for the class label ST-09, whereas 96.99% precision measure was estimated and 97.64% recall estimation was approximated. The class label attribute ST-10 was classified as 15528 instances, meanwhile 98.07% precision measure was recorded and 97.18% recall estimation was recorded. Over all accuracy of our approach was measured as 97.63%.
The compression of our proposed approach with literature is shown in Tab. 4 which shows that our approached received highest classification accuracy and ROC is shown in Fig. 4. This paper contributes (1) data cleaning method for emoji based sentiments (EBS) and (2) highest classification accuracy approximated as 97.63%.
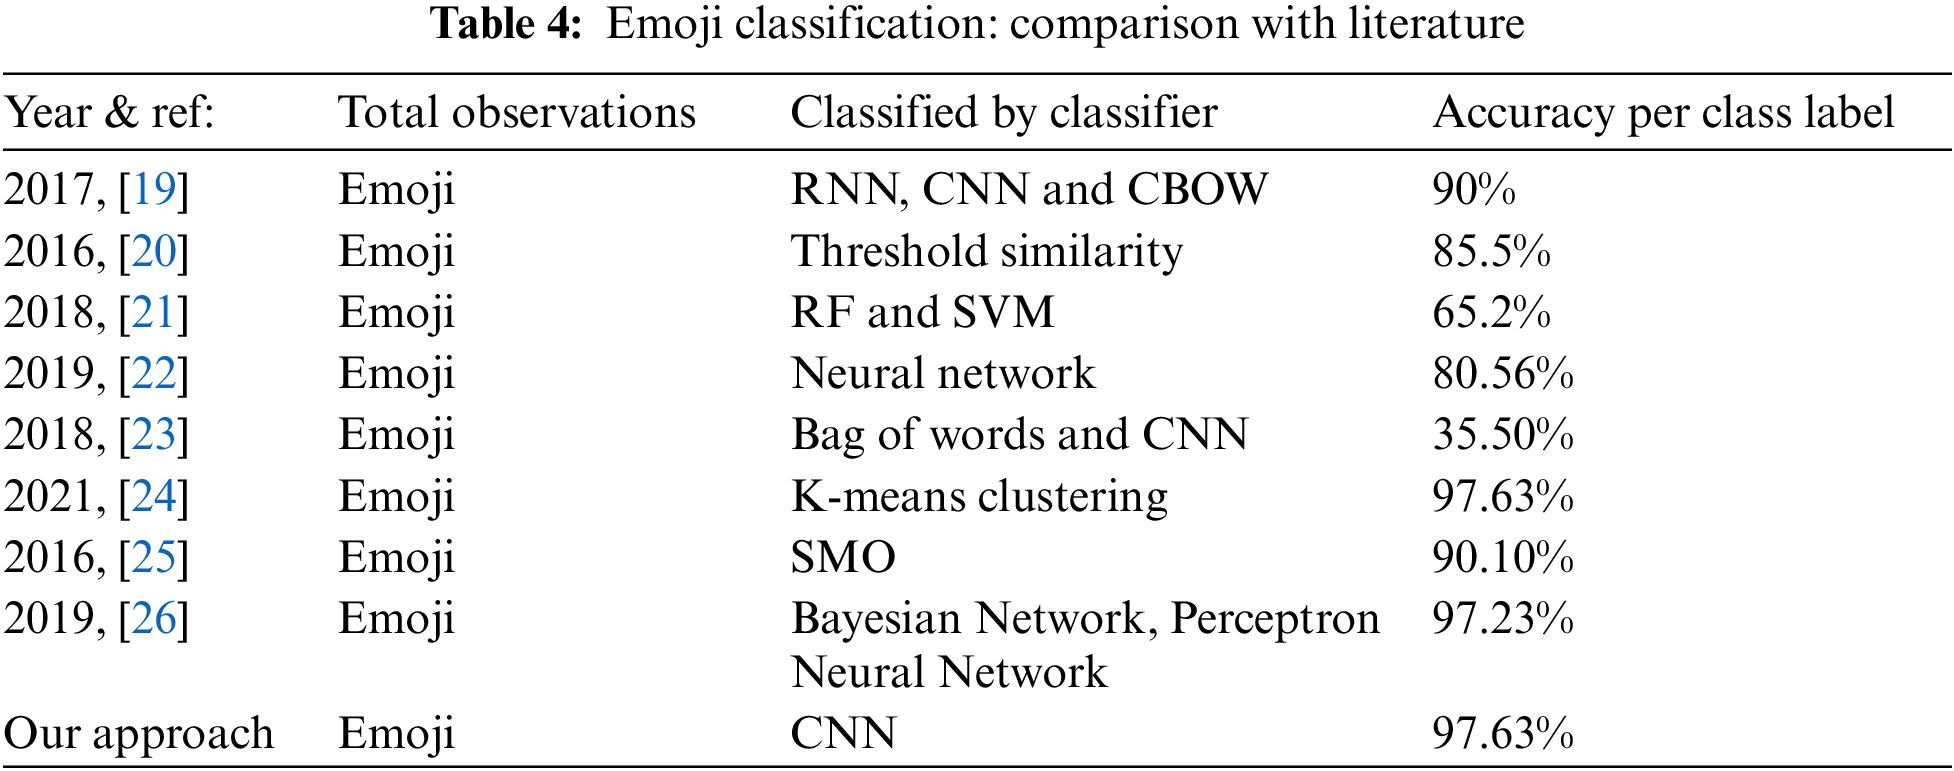
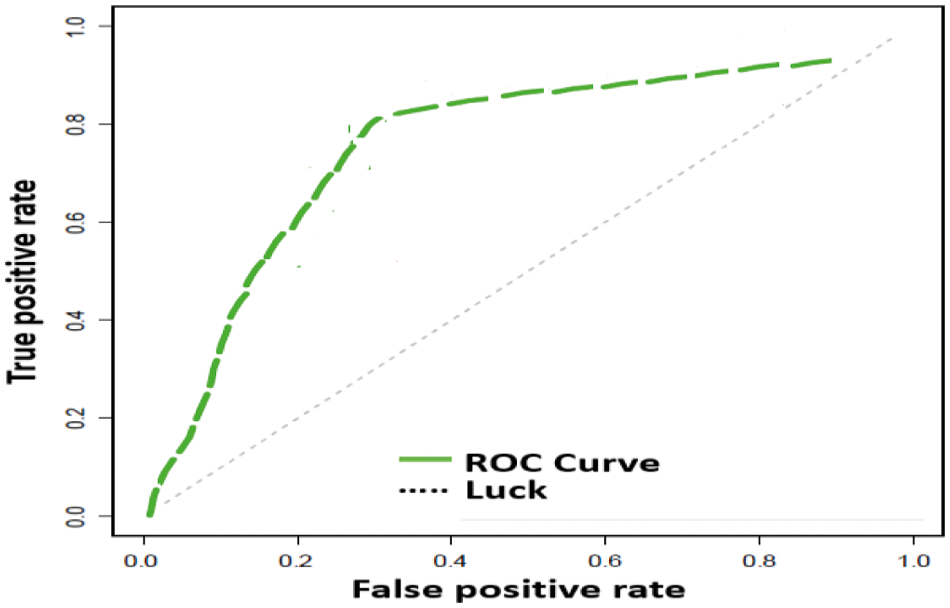
Figure 4: ROC CURVE for emoji based sentiments
The semantics and syntax of tiny emoji based sentiments (EBS) contain a rich peace of information and considered as complete message; but machine vision techniques could be trained to learn such emotions, intuitions and sentiments by using optimized approaches of deep learning. Every emoji consists upon complex patterns, deviated morphologies, heterogeneous patterns and dissimilar appearance in various social media applications (SMA) as shown in Tab. 1. Complex, heterogeneous and mimic patterns of EBS are very hard to detect because EBS shapes are dissimilar emoji patterns (DEP) with similar meaning (SM). Prediction of EBS would provide more meticulous assistance to SMA user to predict the user behaviors. We collected datasets from text images, posts and tweets made over SMA applications such as Facebook pages and WhatsApp groups. The pages and groups were created during online education at SALU, Pakistan. Used dataset contains 143144 EBS observations which were found most frequent in the Facebook comments and WhatsApp messages.
This paper offers a system to classify the emoji images and to find out the deepest knowledge of EBS. First layer of our proposed algorithm contains data preparation layer where data cleaning and feature selection techniques are used to detect dissimilar emoji patterns (DEP). In first sub step we input set of emoji, in second sub step every emoji has to qualify user defined threshold, in third sub step algorithm detects every emoji by considering as objects and in fourth step emoji images are cropped, after data cleaning these tiny images are saved as emoji images. In second step we build classification model by using convolutional neural networks (CNN) to explore hidden knowledge of emoji datasets. In third step we present results visualization by using confusion matrix and other estimations.
The results of our approach show that show that precision for each sentiment (ST) was measured respectively, ST-01 99.16%, ST-02 96.97% , ST-03 97.91%, ST-04 96.27%, ST-05 85.48%, ST-06 97.19%, ST-07 98.02%, ST-08 98.26% ST-09 96.99% and ST-10 98.07%. The recall for each sentiment (ST) was measured respectively, ST-01 98.38%, ST-02 97.33% , ST-03 98.34%, ST-04 98.07%, ST-05 86.45%, ST-06 97.81%, ST-07 97.68%, ST-08 97.40% ST-09 97.64% and ST-10 97.18%. This paper contributes a data cleaning methodology and highest classification accuracy measured as 97.63%.
Acknowledgement: This research was conducted during the pandemic period of COVID–19 and datasets were derived from text messages, tweets and posts of Facebook and WhatsApp groups created for Shah Abdul Latif University (SALU), Pakistan during online classes’ spans.
Funding Statement: The authors received no specific funding for this study.
Conflicts of Interest: The authors declare that they have no conflicts of interest to report regarding the present study.
1. Z. Yao, J. Yang, J. Liu, M. Keith and C. Guan, “Comparing tweet sentiments in megacities using machine learning techniques: In the midst of COVID-19,” Cities, vol. 116, pp. 103–273, 2021. [Google Scholar]
2. A. Hasan, S. Moin, A. Karim and S. Shamshirband, “Machine learning-based sentiment analysis for twitter accounts,” Mathematical and Computational Applications, vol. 23, no. 1, pp. 1–15, 2018. [Google Scholar]
3. T. Highfield and L. Tama, “Instagrammatics and digital methods: Studying visual social media, from selfies and gifs to memes and emoji,” Communication Research and Practice, vol. 2, no. 1, pp. 47–62, 2016. [Google Scholar]
4. I. N. Sodhar, H. J. Akhtar, I. C. Muhammad and N. H. Dil, “Romanized sindhi rules for text communication,” Mehran University Research Journal of Engineering & Technology, vol. 40, no. 2, pp. 298–304, 2021. [Google Scholar]
5. A. H. Khan and Z. Muhammad, “Classification of multi-lingual tweets, into multi-class model using naïve Bayes and semi-supervised learning,” Multimedia Tools and Applications, vol. 79, no. 43 pp. 32749–32767, 2020. [Google Scholar]
6. G. Rampersad and A. Turki, “Fake news: Acceptance by demographics and culture on social media,” Journal of Information Technology & Politics, vol. 17, no. 1, pp. 1–11, 2020. [Google Scholar]
7. M. Valizadeh, P. N. Ranjbar, C. Caragea and N. Parde, “Identifying medical self-disclosure in online communities,” in Proc. of the 2021 Conf. of the North American Chapter of the Association for Computational Linguistics: Human Language Technologies, Stroudsburg, PA 18360 USA, pp. 4398–4408, 2021. [Google Scholar]
8. S. Kinger and K. Vrushali, “Explainable AI for deep learning based disease detection,” in 2021 Thirteenth Int. Conf. on Contemporary Computing (IC3-2021), Noida, India, pp. 209–216, 2021. [Google Scholar]
9. J. Keiser and D. Lemire, “Validating UTF-8 in less than one instruction per byte,” Software: Practice and Experience, vol. 51, no. 5, pp. 950–964, 2021. [Google Scholar]
10. Y. Tang and F. H. Khe, “Emoticon, Emoji, and Sticker Use in Computer-Mediated Communications: Understanding Its Communicative Function, Impact, User Behavior, and Motive,” in New Media for Educational Change, Singapore: Springer, pp. 191–201, 2018. [Google Scholar]
11. E. Janavi, S. Maryam, G. Abbas, F. Mike and E. Pajman, “Effect of social media adoption and media needs on online purchase behavior: The moderator roles of media type, gender, Age,” Journal of Information Technology Management, vol. 13, no. 2, pp. 1–24, 2021. [Google Scholar]
12. D. Rodrigues, P. Marília, G. Rui, V. G. Margarida and L. Diniz, “Lisbon emoji and emoticon database (LEEDNorms for emoji and emoticons in seven evaluative dimensions,” Behavior Research Methods, vol. 50, no. 1, pp. 392–405, 2018. [Google Scholar]
13. Y. Feng, L. Zheng, Z. Wenjun, W. Zhibo and C. Qing, “New emoji requests from twitter users: When, where, Why, and what We can do about them,” ACM Transactions on Social Computing, vol. 3, no. 2, pp. 1–25, 2021. [Google Scholar]
14. A. Mohta, J. Atishay, S. Aditi and D. Sonika, “Pre-processing and emoji classification of WhatsApp chats for sentiment analysis,” in 2020 Fourth Int. Conf. on I-SMAC (IoT in Social, Mobile, Analytics and Cloud) (I-SMAC), Coimbatore, India, pp. 514–519, 2020. [Google Scholar]
15. J. H. Tang, C. C. Ming, Y. Y. Cheng, C. Y. Tsai and Y. A. Lee, “Personality traits, interpersonal relationships, online social support, and facebook addiction,” Telematics and Informatics, vol. 33, no. 1, pp. 102–108, 2016. [Google Scholar]
16. Y. Lou, Y. Zhang, F. Li, T. Qian and D. Ji, “Emoji-based sentiment analysis asing attention networks,” ACM Transactions on Asian and low-Resource Language Information Processing (TALLIP), vol. 19, no. 5, pp. 1–13, 2020. [Google Scholar]
17. H. W. Raj and B. Santhi, “Future emoji entry prediction using neural networks,” Journal of Computer Science, vol. 16, no. 2, pp. 150–157, 2020. [Google Scholar]
18. S. Srivastava, P. Gupta and P. Kumar “Emotion recognition based emoji retrieval using deep learning,” in 2021 5th Int. Conf. on Trends in Electronics and Informatics (ICOEI), Tirunelveli, India, pp. 1182–1186, 2021. [Google Scholar]
19. X. Li, R. Yan and M. Zhang, “Joint emoji classification and embedding learning,” in Asia-Pacific Web (APWeb) and Web-Age Information Management (WAIM) Joint Conf. on Web and Big Data, Cham: Springer, pp. 48–63, 2017. [Google Scholar]
20. B. Eisner, T. Rocktäschel, I. Augenstein, M. Bošnjak and S. Riedel, “Emoji2vec: Learning emoji representations from their description,” arXiv preprint arXiv: 1609.08359, pp. 1–11, 2016. [Google Scholar]
21. A. Illendula and R. Y. Manish, “Learning emoji embeddings using emoji Co-occurrence network graph,” arXiv preprint arXiv: 1806.07785, pp. 1–9, 2018. [Google Scholar]
22. A. Singh, E. Blanco and W. Jin, “Incorporating emoji descriptions improves tweet classification,” in Proc. of the 2019 Conf. of the North American Chapter of the Association for Computational Linguistics: Human Language Technologies, Stroudsburg, PA 18360 USA, vol. 1, pp. 2096–2101, 2019. [Google Scholar]
23. A. Illendula, K. Manohar and R. Y. Manish, “Which emoji talks best for my picture?” in 2018 IEEE/WIC/ACM Int. Conf. on Web Intelligence (WI), Santiago, Chile, pp. 514–519, 2018. [Google Scholar]
24. G. Kutsuzawa, H. Umemura, K. Eto and Y. Kobayashi, “Emoji emotional states: Classification on the valence and arousal axes,” Research Squire, vol. 12, no. 398, pp. 2–17, 2021. [Google Scholar]
25. S. Boy, D. Ruiter and D. Klakow, “Emoji-based transfer learning for sentiment tasks,” in Proc. of the 16th Conf. of the European Chapter of the Association for Computational Linguistics: Student Research Workshop, Stroudsburg, PA 18360 USA, pp. 103–110, 2021. [Google Scholar]
26. E. E. Kırcı, N. Nazik, S. Kapan, E. Meriç, E. S. Zor et al., “Ponto-caspian and Mediterranean faunal and floral records of upper pleistocene-holocene sediments from the izmit gulf (Marmara Sea, Turkey),” Acta Palaeontol. Rom, vol. 17, pp. 23–62, 2021. [Google Scholar]
27. B. M. A. Bataineh and M. K. Y. Shambour, “A robust algorithm for emoji detection in smartphone screenshot images,” Journal of ICT Research and Applications, vol. 13, no no. 2, pp. 192–212, 2019. [Google Scholar]
28. A. A. Altun and K. Cagatay, “Face verification system in mobile devices by using cognitive services,” International Journal of Intelligent Systems and Applications in Engineering, vol. 6, no. 4, pp. 294–298, 2018. [Google Scholar]
29. D. Lin, R. C. W. Wong, M. Xie and V. J. Wei, “Index-free approach with theoretical guarantee for efficient random walk with restart query,” in 2020 IEEE 36th Int. Conf. on Data Engineering (ICDE), Dallas, Texas, USA, pp. 913–924, 2020. [Google Scholar]
30. L. Panigrahi, K. Verma and B. K. Singh, “Ultrasound image segmentation using a novel multi-scale Gaussian kernel fuzzy clustering and multi-scale vector field convolution,” Expert Systems with Applications, vol. 115, pp. 486–498, 2019. [Google Scholar]
31. Z. Wang, K. Wang, S. Pan and Y. Han, “Segmentation of crop disease images with an improved K-means clustering algorithm,” Applied Engineering in Agriculture, vol. 34, no. 2, pp. 277–289, 2018. [Google Scholar]
32. X. Lei, H. Pan and X. Huang, “A dilated CNN model for image classification,” IEEE Access, vol. 7, pp. 124087–124095, 2019. [Google Scholar]
33. K. V. Greeshma and K. Sreekumar, “Hyperparameter optimization and regularization on fashion-MNIST classification,” International Journal of Recent Technology and Engineering (IJRTE), vol. 8, no. 2, pp. 3713–3719, 2019. [Google Scholar]
34. Y. Liu, “An improved faster R-CNN for object detection,” in 2018 11th Int. Symp. on Computational Intelligence and Design (ISCID), Hangzhou, China, vol. 2, pp. 119–123, 2018. [Google Scholar]
 | This work is licensed under a Creative Commons Attribution 4.0 International License, which permits unrestricted use, distribution, and reproduction in any medium, provided the original work is properly cited. |