DOI:10.32604/cmc.2022.025116
| Computers, Materials & Continua DOI:10.32604/cmc.2022.025116 | |
| Article |
Vision-based Recognition Algorithm for Up-To-Date Indoor Digital Map Generations at Damaged Buildings
1Computer Information Technology, Korea National University of Transportation, Chungju, 27469, Korea
2Department of Railway Vehicle System Engineering, Korea National University of Transportation, Uiwang, 16106,Korea
*Corresponding Author: Junho Ahn. Email: jhahn@ut.ac.kr
Received: 12 November 2021; Accepted: 24 January 2022
Abstract: When firefighters are engaged in search and rescue missions inside a building at a risk of collapse, they have difficulty in field command and rescue because they can only simply monitor the situation inside the building utilizing old building drawings or robots. To propose an efficient solution for fast search and rescue work of firefighters, this study investigates the generation of up-to-date digital maps for disaster sites by tracking the collapse situation, and identifying the information of obstacles which are risk factors, using an artificial intelligence algorithm based on low-cost robots. Our research separates the floor by using the mask regional convolutional neural network (R-CNN) algorithm, and determines whether the passage is collapsed or not. Then, in the case of a passage that can be searched, the floor pattern of the obstacles that exist on the floor that has not collapsed is analyzed, and obstacles are searched utilizing an image processing algorithm. Here, we can detect various unknown as well as known obstacles. Furthermore, the locations of obstacles can be estimated using the pixel values up to the bounding box of an existing detected obstacle. We conduct experiments using the public datasets collected by Carnegie Mellon university (CMU) and data collected by manipulating a low-cost robot equipped with a smartphone while roaming five buildings in a campus. The collected data have various floor patterns for objectivity and obstacles that are different from one another. Based on these data, the algorithm for detecting unknown obstacles of a verified study and estimating their sizes had an accuracy of 93%, and the algorithm for estimating the distance to obstacles had an error rate of 0.133. Through this process, we tracked collapsed passages and composed up-to-date digital maps for disaster sites that include the information of obstacles that interfere with the search and rescue work.
Keywords: Vision; artificial intelligence; robot; map generation; damaged building
The United States (U.S.) government has approximately 45,000 unused or underutilized buildings [1]. Furthermore, according to the U.S. fire administration, approximately 20% of urban structures are not being utilized [2]. Abandoned empty buildings have a risk of collapse, access to them is restricted through the “Worcester marking system.” It is also difficult to access buildings at a risk of collapse because of disaster situations such as fire and earthquake, as well as abandoned empty buildings. To search, suppress the fire and examine the situation inside the buildings at a risk of collapse, robots are deployed instead of people. When the nuclear reactors were destroyed in Fukushima, Japan, snake-shaped robots were deployed to examine inside of nuclear reactors [3]. Robots were also utilized for search and rescue missions when an earthquake occurred in the Lushan national park in China [4]. Recently, the firefighting robot Colossus was utilized to put out the fire in Notre-dame, France [5]. Los Angeles, U.S. also introduced the firefighting robot RS3 [6].
With the conventional simple monitoring using existing architectural drawings and robot image data, firefighters have difficulty in field command or rescue when performing search and rescue activities inside buildings where the disaster occurred. Because of the disaster, buildings at a risk of collapse have collapsed floors and ceilings, and places that have been altered by remodeling. Thus, it is difficult to identify the inside layouts by the architectural drawings created when the building was constructed. Moreover, it is difficult to understand the concrete situation inside the building in a disaster situation simply by monitoring the inside of the building from outside the building using robots owing to obstacles and collapsed parts. Therefore, instead of utilizing existing design drawings and simple monitoring, we researched the generation of efficient, useful up-to-date digital maps for disaster sites that correspond to the actual situation inside the building at a risk of collapse.
To generate up-to-date digital maps for disaster sites, it is necessary to detect collapsed passages and obstacles inside the buildings, and link them to the digital maps. Before detecting them, we classified buildings’ inner spaces of various shapes into three categories. The first category is closed spaces, such as a room that is closed on all sides and can be accessed through an entrance such as a door. The second category is large open spaces comprising columns inside them such as a large plaza. The third category is passages such as a corridor that serves as a passage that interconnects the aforementioned spaces. Most studies related to the inside of buildings detect obstacles among the three categories of spaces such as room, plaza, and corridor, or predict the path. In studies on the detection of objects inside buildings [7,8], an artificial intelligence model studies objects designated by labels and detects them. Meanwhile, studies on obstacle detection [9–11] detect obstacles in inner spaces of buildings such as rooms or plazas. Studies on passages inside buildings such as corridors focus on predicting the path by identifying the characteristics of passages rather than detecting obstacles [12–14]. We focused on obstacles in corridors and collected and analyzed information related to obstacles. For firefighters in a corridor to determine whether it is a collapsed passage, the floor was segmented based on deep learning to determine whether it collapsed. In addition, a hybrid algorithm that converges image processing was proposed and constructed to estimate the size of detected obstacles in a non-collapsed passage. To conduct experiments, a smartphone was installed in a real low-cost robot, and corridor image data were collected from various buildings. After obtaining the bounding box of an obstacle by detecting an obstacle and estimating its height using deep learning and image processing, the distance to the obstacle was estimated and the obstacle size and distance data were stored. In addition, we created up-to-date digital maps that include whether the detected obstacles and passages have collapsed or not using the algorithm. Although existing disaster robots cost tens of thousands to hundreds of thousands of dollars, we utilized a low-cost robot that costs less than 5,000 dollars with a smartphone, which is advantageous for the software updates. This study can help the robot to determine an autonomous driving path by detecting various forms of unknown obstacles and storing their information. Furthermore, using the generated up-to-date digital maps, firefighters can work efficiently inside buildings at risk of collapse.
This paper is organized as follows. Section 2 introduces studies on detecting obstacles and identifying the locations and sizes of obstacles in spaces, and various disaster robots. Section 3 describes the overall architecture of the proposed algorithm and the detailed architecture of each module. Section 4 describes the experimental data and experiment design, presents the experiment results for each module, and summarizes the overall results. Section 5 concludes by presenting various issues of the proposed algorithm and future research directions.
A several studies related to vision attempted to detect obstacles in specific scenes. Existing studies on obstacle detection can be largely classified into two groups: those that trained a model and detected designated obstacles using the model, and those that detected various shapes of untrained obstacles. One study adopted the you only look once (YOLO) algorithm [15] to train a model and detect objects [16]. Furthermore, not solely the YOLO algorithm, but also the deep learning algorithm and labeled objects were utilized to train a model [17–20]. A few studies attempted to find designated objects more accurately by merging the results predicted by the trained model with an image processing algorithm [21,22]. Several researchers have tried to detect untrained obstacles. One study detected obstacles using a depth sensor such as red, green, blue (RGB) image and its corresponding depth image (RGB-D) instead of a general camera [23]. This study distinguished dynamic obstacles based on mathematical models and geometric constraints by clustering the feature points of a depth image. A study that attempted to detect untrained obstacles utilizing an RGB camera [24] proposed a student-teacher system, which discovered foreground obstacles in a video and obtained a soft mask for each frame. Then the student convolution neural network (CNN), a sub-network of the system, was trained by filtering the result masks based on the untrained quality metric. The finally obtained student network allowed the training of more general and objective features than the unsupervised teachers. Another study [25] detected dynamic obstacles using the temporal features of videos.
We separated floors and obstacles by detecting the foreground according to the floor of corridors, as well as detecting obstacles. When floors are separated, collapsed passages inside a building at risk of collapse can be detected. Furthermore, because robots and people move through the floors, we focused on detecting obstacles on floors. Image processing and segmentation to separate floors have been researched. A study on floor detection utilizing image processing [26] detects corridors based on edges. The canny edges [27] of images that have undergone gray scale transformation are obtained and morphologically transformed. Research on image segmentation such as fully convolutional networks (FCN) [28] and U-net [29] is been conducted. A study that separated the floors of corridors using image segmentation [30] trained a CNN model with corridor images and segmentations corresponding to floors. Because the parts corresponding to floors may not be smooth owing to lights and shades, these parts are filled using the conditional random field (CRF) [31] for optimization. The algorithm of this study separates floors after image segmentation using the mask regional convolutional neural network (R-CNN) [32] algorithm. Then obstacles are detected by extracting the edges of the separated floor segmentation masks and comparing between the case when there is an obstacle and when there is no obstacle.
We estimate and store the locations of detected obstacles and the sizes of obstacles on images. Determining the locations of and distances to obstacles by estimating their depths play a critical role when robots perform autonomous driving, or building inside maps are drawn later. Various studies related to estimating the locations of obstacles are using the stereo technique [33,34]. In particular, one study obtained a polynomial function using the parallax of two stereo cameras and actual distances, and estimated the distance to obstacles [35]; however, we estimate the distance using a monocular camera that uses solely one camera. Several studies [36,37] have been recently conducted to estimate the distance to obstacles from the camera using a monocular camera. Utilizing a monocular camera instead of a stereo camera, we obtain a polynomial regression function using the edge lines of floors to obstacles and the actual distance, and then estimate the distance.
Currently, several types of disaster robots are being utilized in disaster sites [38]. In disaster situations, disaster robots enter buildings, suppress fires, search for people in collapsed buildings, and help rescue them; however, the firefighting robot RS3 is very expensive at the price of $277,000 [39], and other robots utilized in disaster sites are also expensive as well. Because disaster robots are costly, ranging from tens of thousands to hundreds of thousands of dollars, solely a small number of robots are deployed and utilized in a limited range in actual disaster sites, making efficient rescue work difficult. In the case of search, users identify the disaster site simply by remotely controlling robots without generating a digital map of the disaster site. Such methods are difficult to analyze the overall disaster situation, and firefighters entering a building have to move in accordance with maps that do not reflect the actual disaster situation such as the existing architectural drawings. We generated up-to-date disaster site digital maps using a $2,771 low-cost robot [40] and an $837 smartphone [41], instead of existing disaster robots costing hundreds of thousands of dollars. By utilizing low-cost robots, it becomes possible to perform search work in a wide range with multiple robots in a disaster situation. Moreover, collecting information about the inside of buildings using the smartphone facilitates software updates or the addition of other imaging devices later.
In this section, the overall architecture of the proposed algorithm and the detailed architecture of each module are described. First, the overall architecture of the proposed algorithm is briefly described, then the algorithm applied in each module is explained in detail.
3.1 Data Collection and Recognition
When firefighters are engaged in rescue activities in unexpected disaster situations such as typhoons, floods, earthquakes, heavy snow, and fires, they should quickly identify the disaster situation inside a building at a risk of collapse. Fig. 1 illustrates the architecture design of a system for generating disaster site maps utilizing a low-cost robot. By quickly deploying a low-cost robot combined with a smartphone in which the latest artificial intelligence software is installed into a building in a disaster situation, up-to-date digital maps for disaster sites including information such as obstacles, building remains, and collapsed passages that interfere with rescue and search activities in the disaster site can be created. The low-cost robot combined with the smartphone collects and analyzes data, and generates up-to-date digital maps that allow fast identification of building collapse sites by linking with a cloud server. Using the generated maps, the status inside the building in a disaster situation can be analyzed, and necessary materials and personnel can be efficiently placed where assistance is needed.
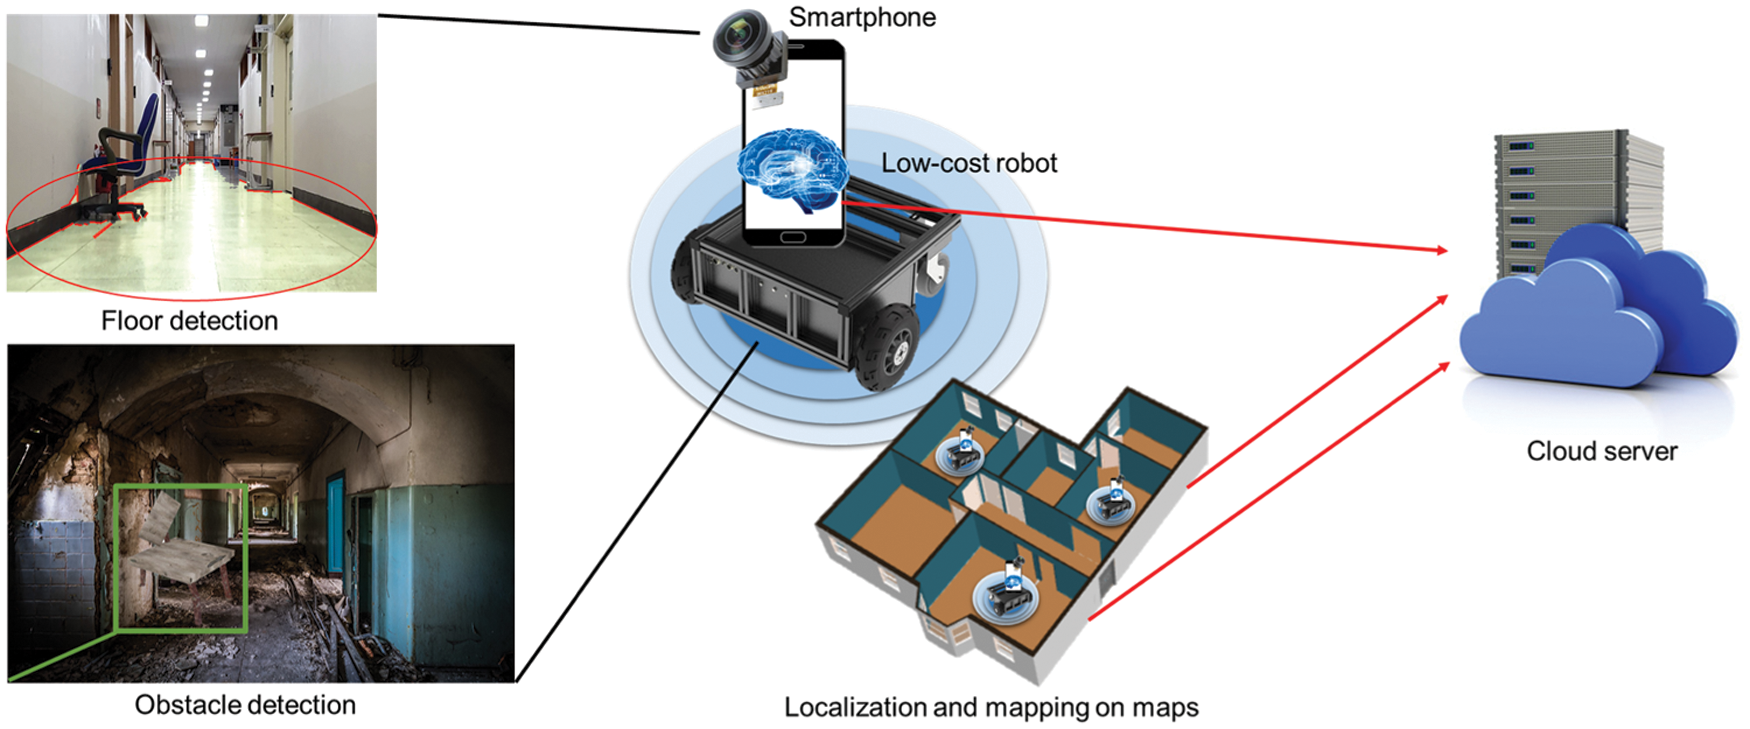
Figure 1: Architecture of the data collection and recognition system proposed in this study
Fig. 2 illustrates the overall architecture image of the proposed algorithm, and the flowchart is illustrated in Fig. 3. The RGB video data enter the first module. After the floor is separated, if the shape of image segmentation is normal, the separated floor mask enters the second module. If the image segmentation has an abnormal shape, it is considered that entry is no longer possible. In addition, to avoid detecting very far obstacles, the two over three point of the image is designated as a region of interest (ROI), and the line is searched for the corresponding part. After the obstacle is detected by analyzing the line pattern, the height of the obstacle is estimated using image processing in the third module. In the fourth module, the distance to the obstacle is estimated adopting the polynomial regression function obtained using the pixel values of the line to the obstacle, and the actual value between the start point of the robot and the obstacle. The current location of the obstacle can be known based on the predicted distance. The sizes and distances of the collapsed passage and detected obstacle are stored in a cloud server. Because the overall algorithm is composed of one framework, the results are indicated sequentially. The detailed algorithm for each module is described in the following section.
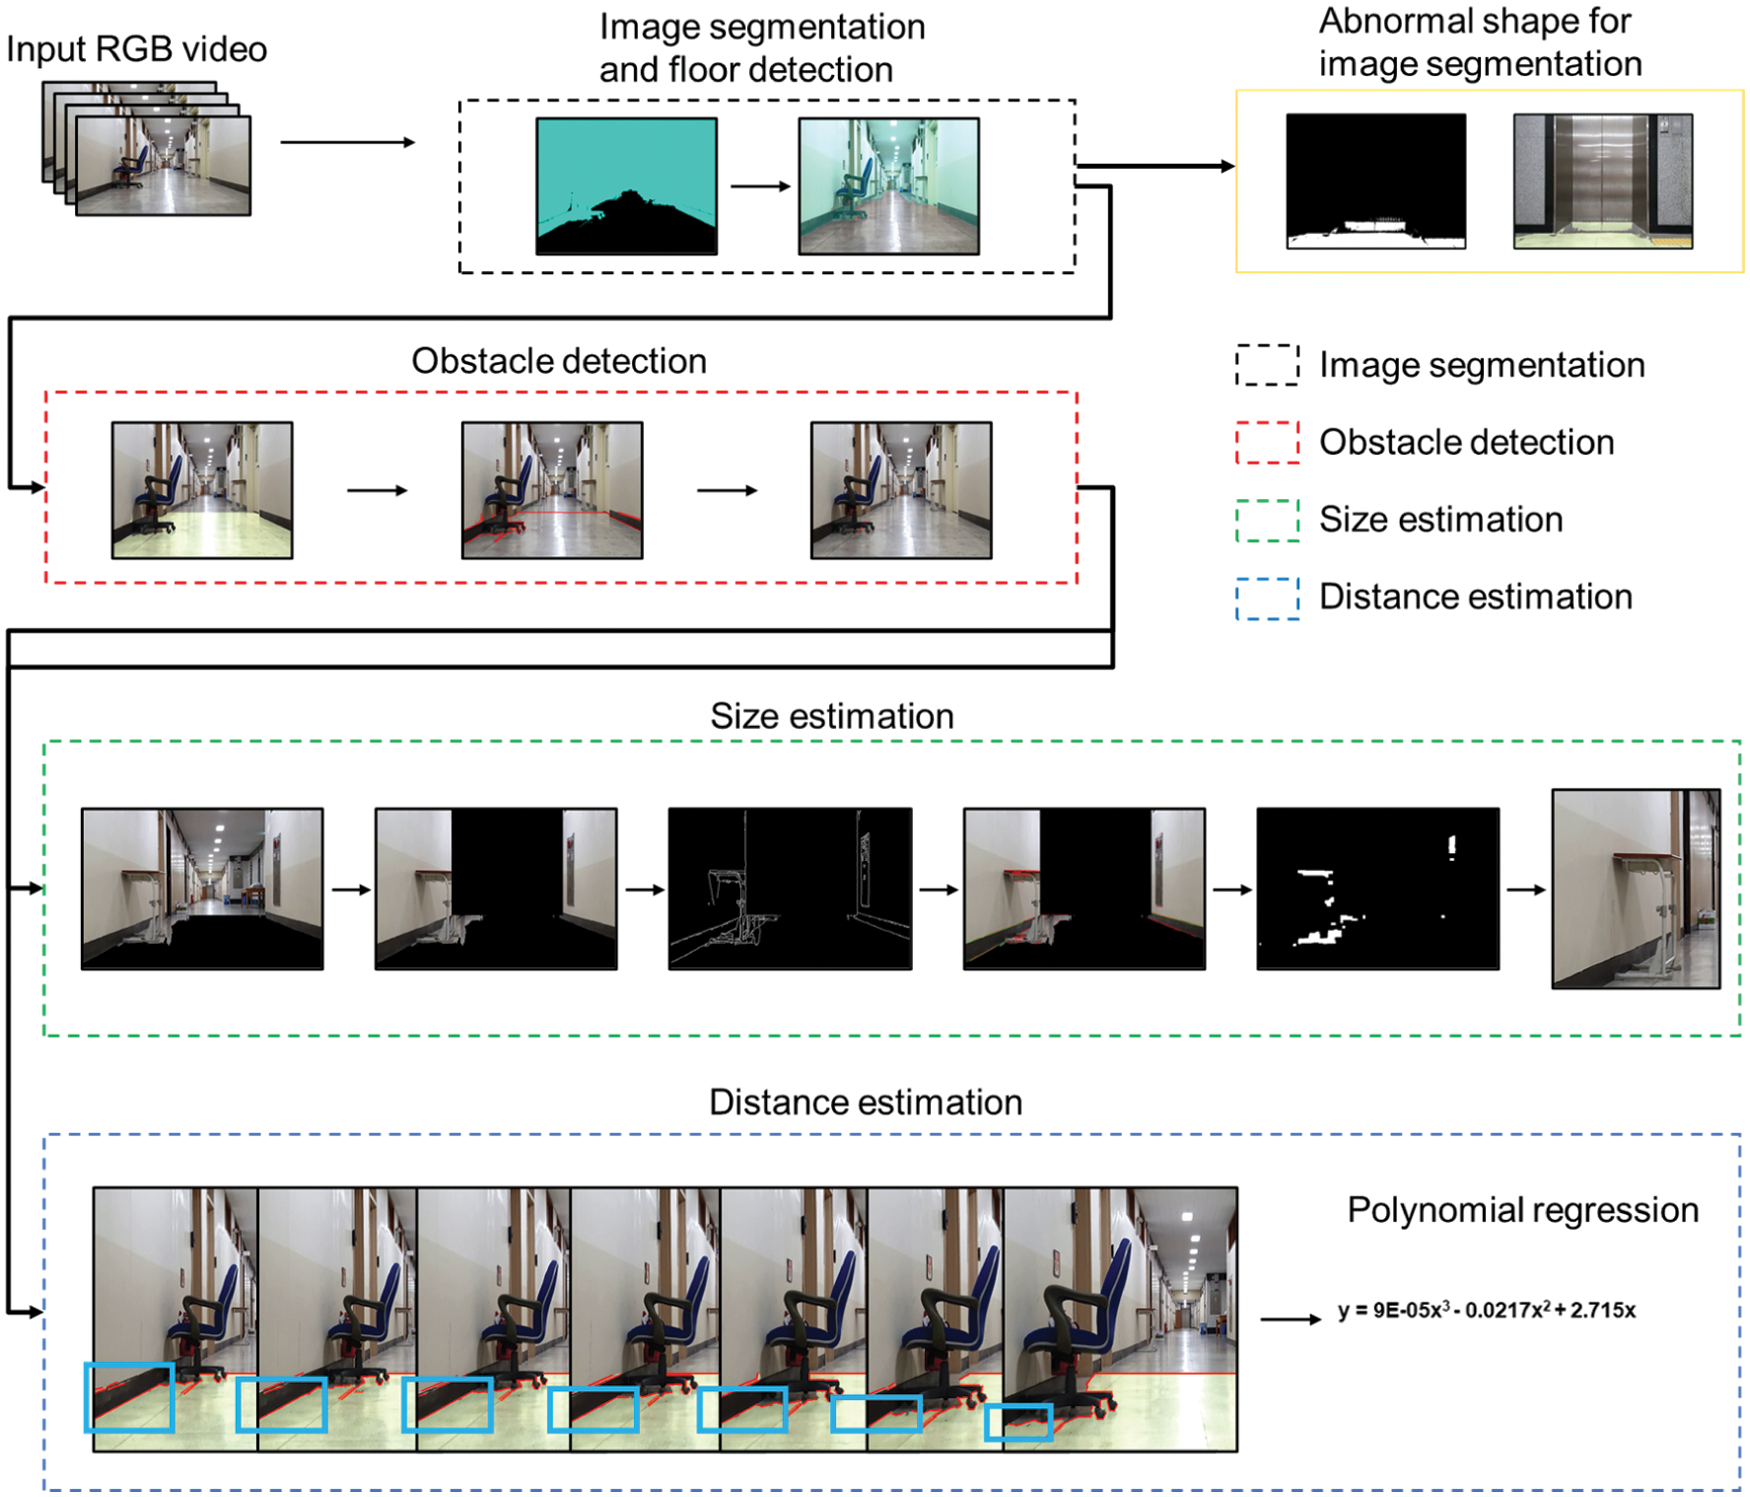
Figure 2: Algorithm architecture
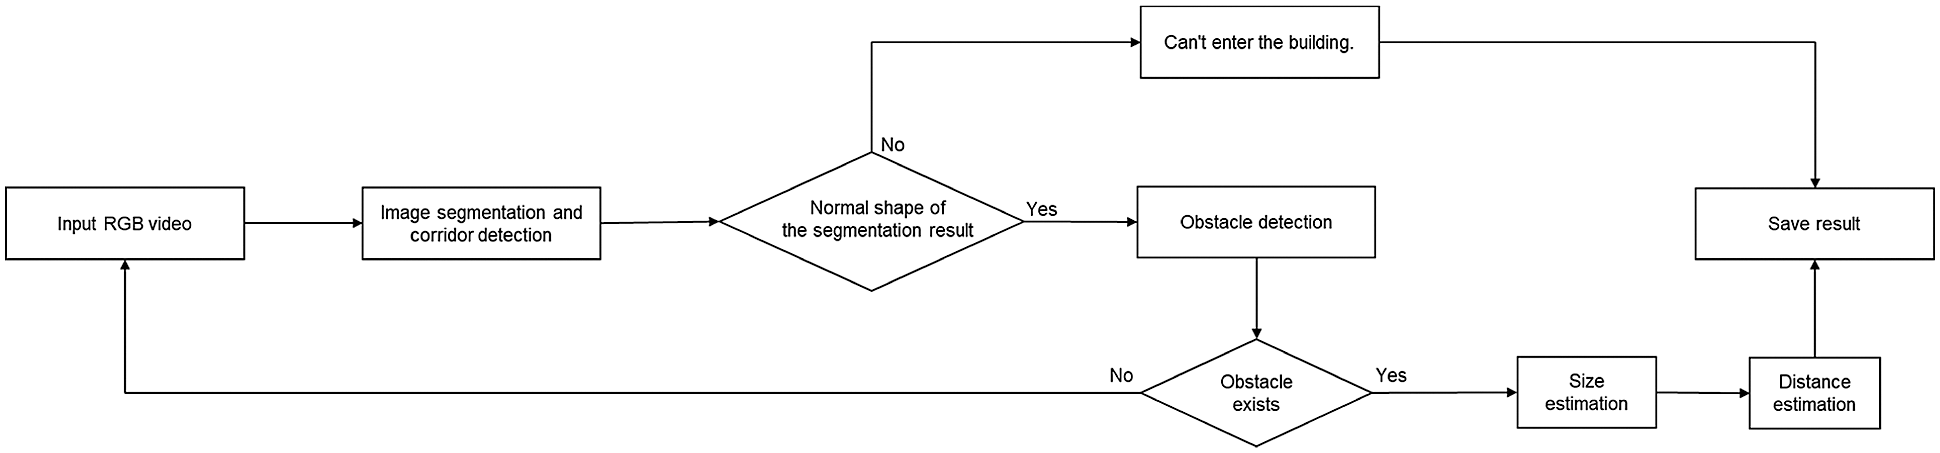
Figure 3: The proposed algorithm flowchart
To verify the overall algorithm by the verified accuracy of each detailed algorithm, the error propagation is calculated using Eq. (1). Here, the error rates are obtained using the accuracy of each detailed algorithm.
Whether an entry is possible or not can be determined using floor segmentation. We determined that entry is no longer possible if the floor mask shape is not a normal trapezoid. To obtain the image segmentation of the floor, we utilized a model trained by the mask R-CNN [32] algorithm. This floor mask is close to a triangle shape. Because an obstacle that is far from the current position has unclear features, the two over three point of the image is designated as a region of interest. Accordingly, the mask has a trapezoidal shape. Fig. 4 illustrates the shape of a normal passage and the shape of a passage blocked by an obstacle. The floor of the normal passage has a trapezoidal shape; however, if the passage is blocked or cannot be entered anymore because of a large obstacle or floor collapse of the building, the result is different from the normal shape as illustrated in Fig. 4. We determined that entry was possible if an abnormal floor pattern does not appear as in this case.
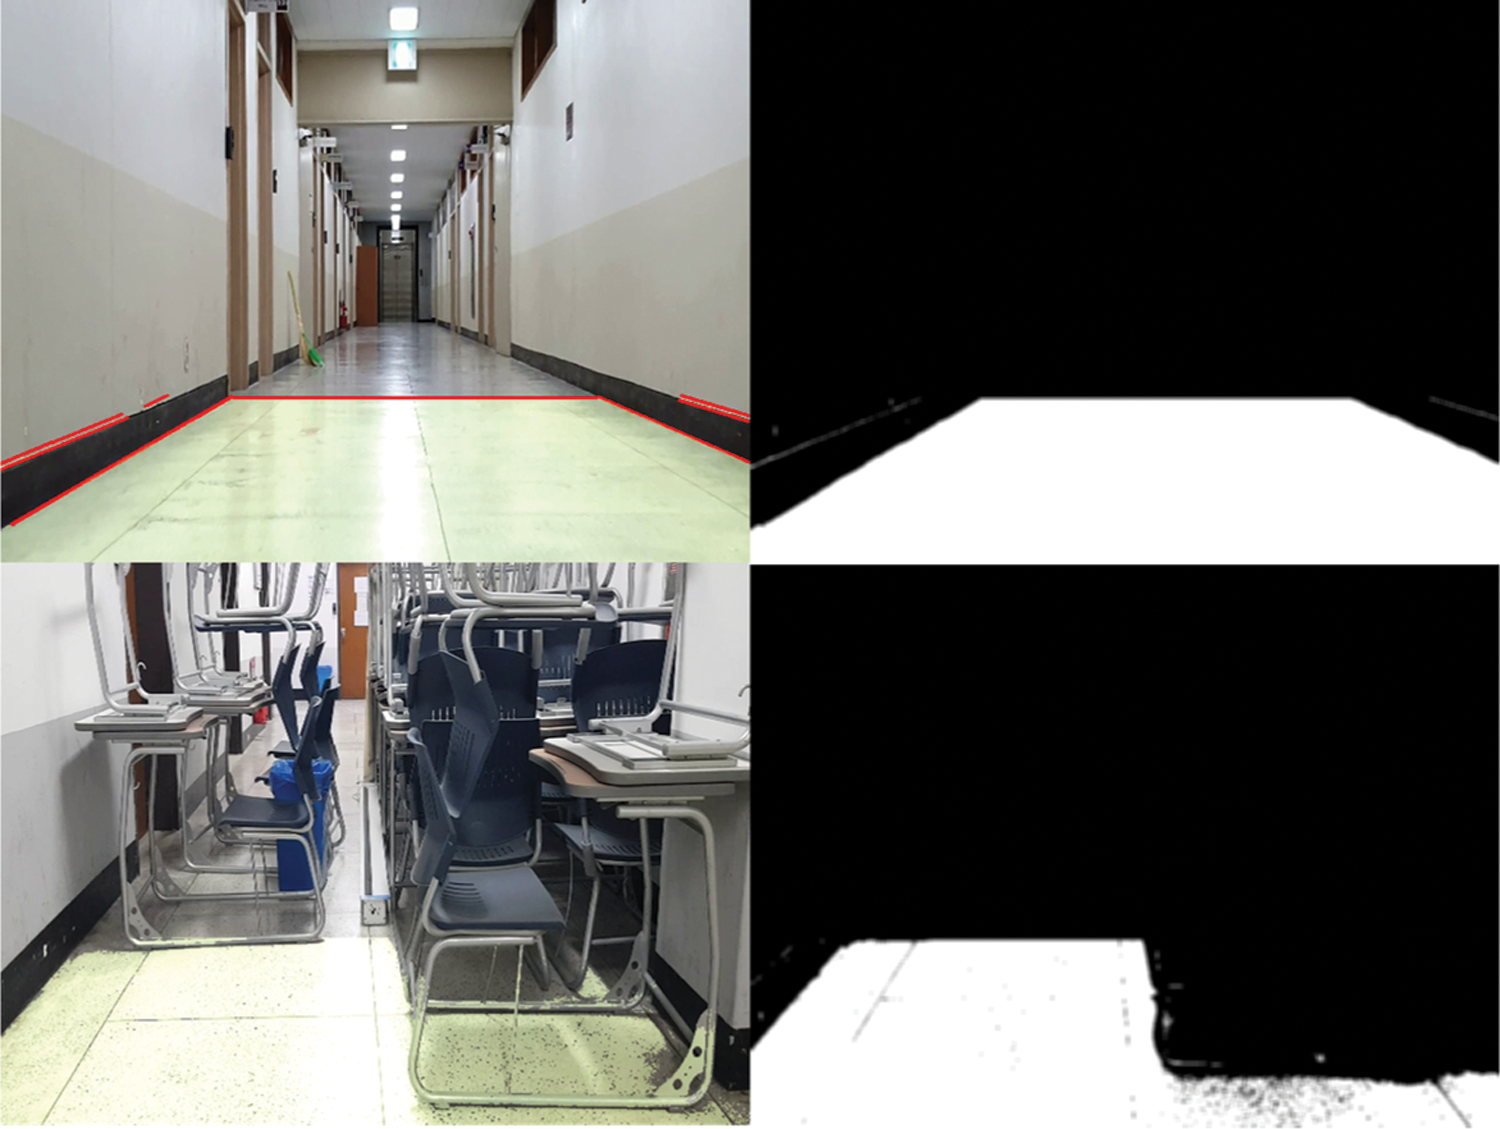
Figure 4: Example of detecting a normal passage and a passage blocked by obstacle through floors in an indoor space
3.4 Obstacle Detection and Size Estimation
In this study, obstacles are detected using the obstacle pattern of a separated floor. There are various types of obstacles inside buildings at a risk of collapse; however, it is highly difficult to designate labels for all types of obstacles. Hence, we detected the floor using deep learning, and detected objects by analyzing the pattern of the parts excluding the floor. The overall flow of the algorithm is illustrated in Fig. 5.
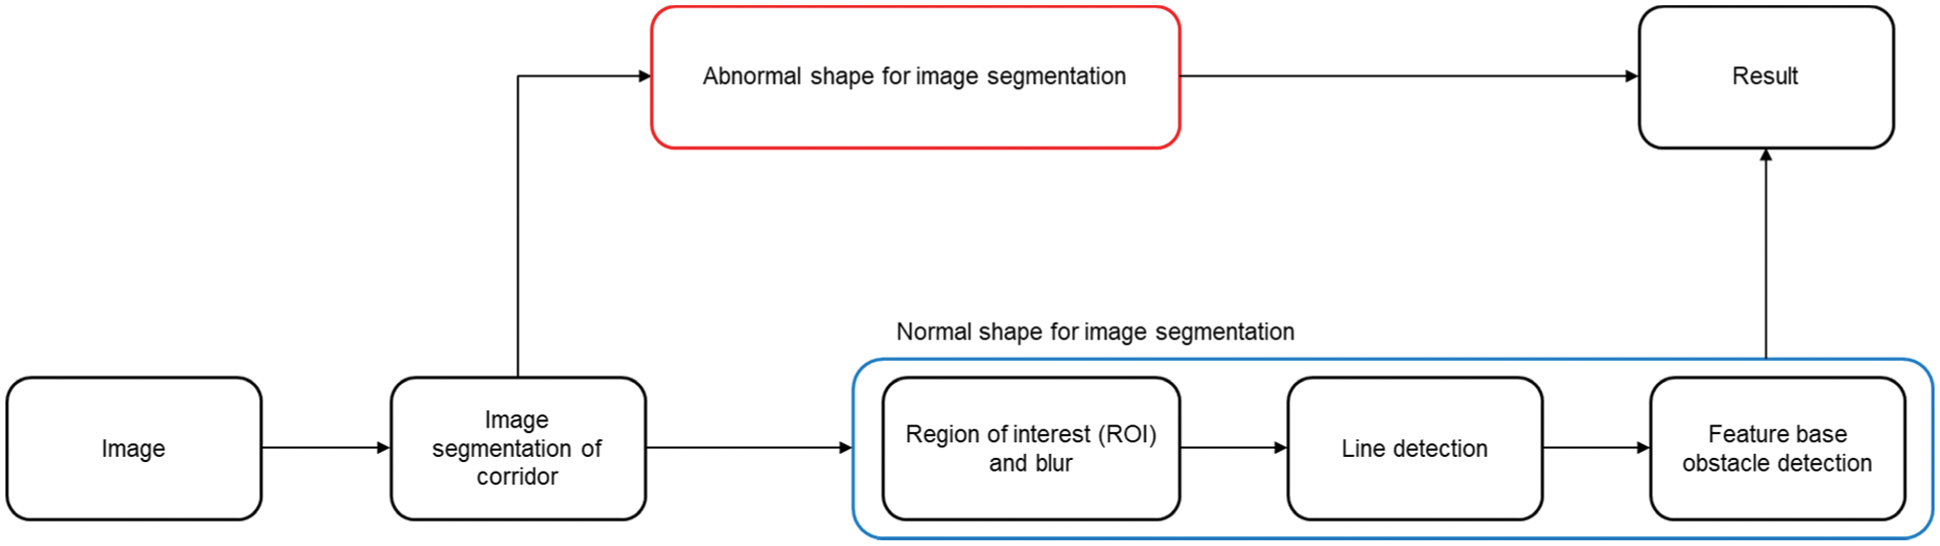
Figure 5: Obstacle detection algorithm combined with a deep learning-based floor detection algorithm
The mask corresponding to the floor is obtained using image segmentation for the floor. When a normal floor was detected, the line segment detector (LSD) method [42] was applied to determine the line. To detect a local line in LSD, a straight line is regarded as a square area, and a straight line with a high direction is extracted by measuring the degree of similar directions for the pixels included in this area. Here, we need both the local line of the obstacle, and the overall line that expresses the edges of the corridor and is opposite to the local line. Therefore, we obtained a local line with conspicuous features by utilizing LSD after applying blur. We can obtain the edge line features of the floor, and if there is an obstacle, a line of a shape that is different from the line drawn in the previous frame is obtained. Fig. 6 illustrates the edges represented by using a canny edge for the mask value to more clearly express the shapes when there is an obstacle and when there is none. We analyzed the obstacle pattern of the floor when there is an obstacle. As illustrated in Fig. 6a, when there is no obstacle, a continuous straight line is obtained; however, when there is an obstacle, straight lines with different slopes are obtained as illustrated in Fig. 6b. By comparing the slopes of the straight lines detected in frames based on the straight-line pattern, if there are five or more such patterns, it is determined that there is an obstacle.
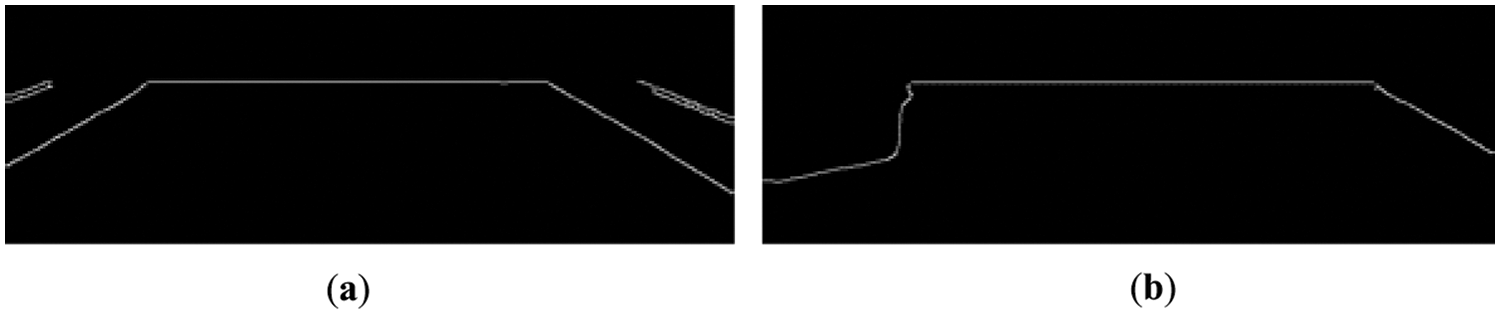
Figure 6: Obstacle detection result based on canny edge image processing: (a) a passage with no obstacle, (b) a passage with an obstacle
We detected obstacles in the image data collected using a robot, and determined accuracy, recall, and precision for the detection result. Based on the obtained recall and precision, the F1-score was calculated using Eq. (2).
The size of the detected obstacle is estimated after the existence of an obstacle is determined. To estimate the obstacle size, we are required to know the horizontal and vertical sizes of the obstacle. In this study, the size of the baseline, which is the x-axis of the obstacle, was estimated using the obstacle pattern of the floor. In addition, various image processing algorithms were applied to estimate the height, which is the y-axis of the obstacle. First, the feature line obtained through the floor was utilized to estimate the baseline. The pattern of a floor that was determined to have an obstacle has a shape out of the existing line as illustrated in Fig. 6b. As illustrated in Fig. 7a, the distance from the dotted line, an edge line when there is no obstacle, to the red circle, the farthest feature point, was determined as the base line size. After that, to estimate the height excluding complex and unnecessary features, a square was drawn with the line start and end points of the x-coordinate that meets with the y-axis of the two over three point detected on the floor, and the line start and end points of the x-coordinate when the y-axis is zero, which are illustrated as four green circles in Fig. 7b. Then this square was designated as the mask. The edge of the obstacle was obtained by applying the canny edge to the remaining part excluding the square part in the image. It was determined that the feature corresponding to the door is detected together with this edge. To remove the feature corresponding to the door, the edge that continued from the top of the image was excluded. Among the remaining edges, to leave solely clear and definite features, morphology techniques [43] were applied to the edge values. The morphology techniques fill holes or remove noises by analyzing image shapes, thus clearly indicating the obstacle area. Among the morphology techniques, we performed the close operation, which removes noises, and then open operation, which only indicates clear features, thus leaving solely the most important features. Then, among these features, the highest and lowest features were determined by the height. Although the accurate height of the obstacle cannot be estimated, the height was estimated enough to know the approximate shape of the obstacle.
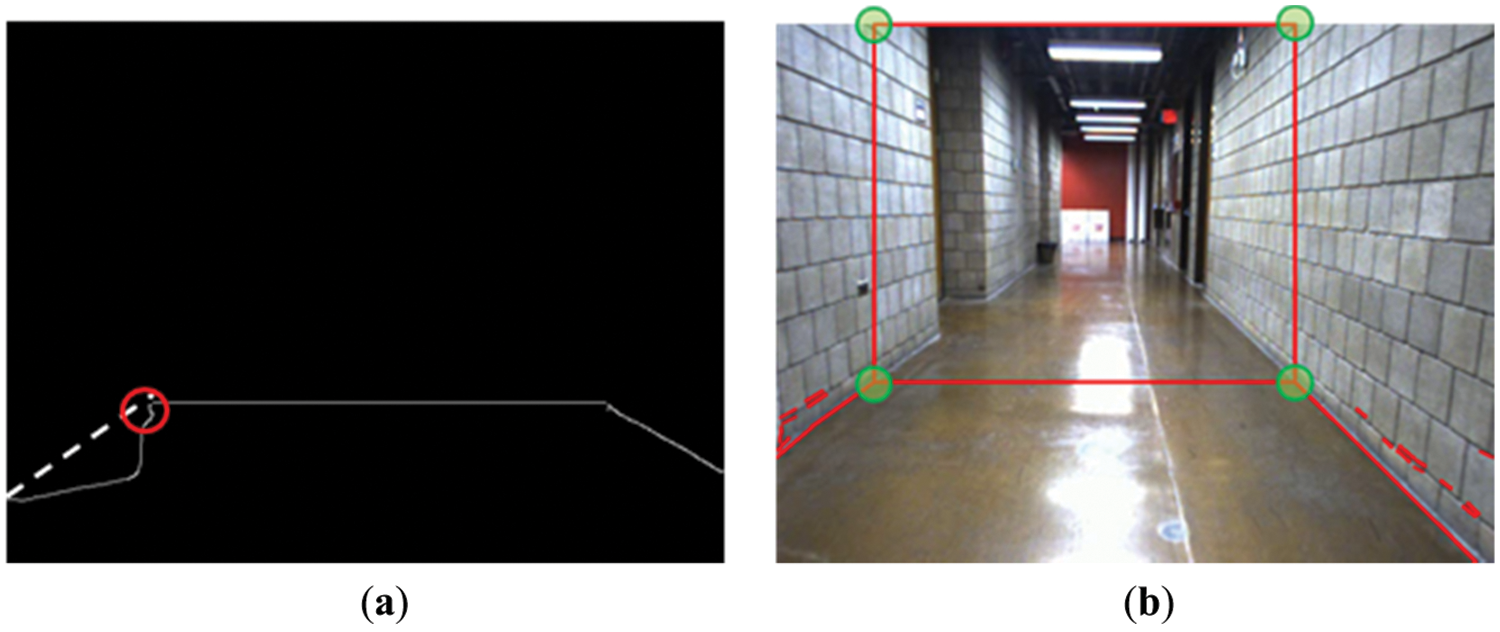
Figure 7: Methods to estimate the size of objects in the algorithm: (a) estimating the base line size of the obstacle, (b) square mask coordinate setting to specify unnecessary areas
3.5 Robot and Obstacle Localization
To estimate the location of objects using a robot, the current location of the robot must be known. The initial location of the robot can be specified by the person who controls the robot, and can be automatically estimated using the number of rooms in the building. The location of the robot according to robot's movement can be estimated using the wheel size of the robot and number of revolutions of the wheel. If the circumference of the robot's wheel is 20 cm, it follows that the robot moves 20 cm each time it moves one revolution; however, the robot's location can be shifted when the robot steps on a low bump or small residue on the floor, causing an error. To remove this error, the robot's location can be reset when the robot changes direction at the stairs and corners on the existing architectural drawing. Furthermore, this error can be corrected by detecting signs indicating the room number, etc. while the robot is moving. Room number can be detected using the indoor localization algorithm of an existing study [44]. We automatically detect the initial location of the robot using the room number on the architectural drawing based on the existing study.
After the obstacle size is estimated, the real distance to the obstacle is estimated. To more accurately estimate the distance, we utilize the real starting location of the robot. To estimate the location of the obstacle, we utilize the pixel value of the edge line of the floor that reaches the bounding box of the obstacle. The edge pixel value of the floor decreases as it gets closer to the obstacle's bounding box, and this is utilized to estimate the distance to the obstacle. The x-axis in the graph of Fig. 8, which illustrates this, is the pixel length of the edge line to the obstacle's bounding box, and the y-axis is the real distance from the start point of the robot to the object. The orange line on the graph expresses the polynomial regression function between the real distance and the pixel length. The polynomial regression function obtained through the pixel and real distances is expressed as Eq. (3).
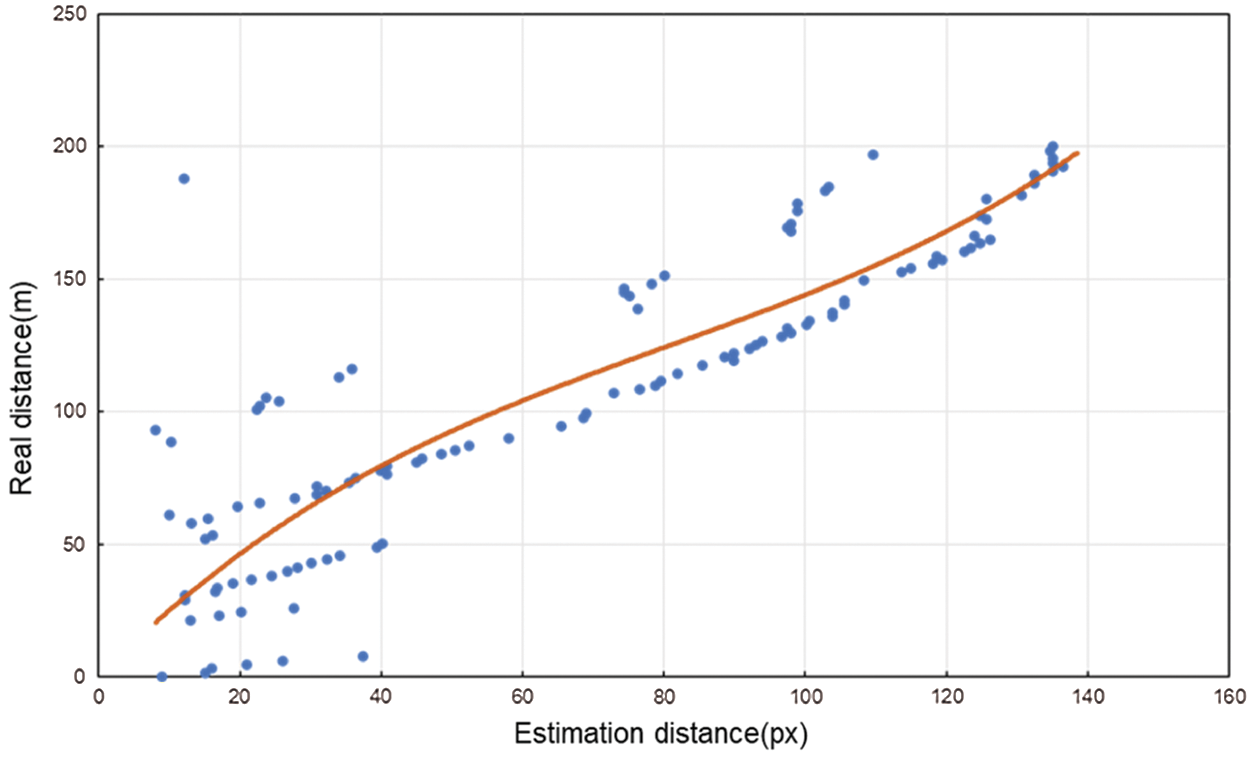
Figure 8: Analysis comparing the real and estimated distances between the robot and obstacle
When the obstacle for estimating the distance is no longer detected, it is considered that the obstacle has been passed. Then, to estimate the location of another obstacle, the location of the robot when the other obstacle was first detected is specified as the start point. Furthermore, the actual location of the obstacle inside the building can be estimated using the moved location of the robot. The performance of the algorithm for estimating the distance by detecting objects is evaluated using the average error rate obtained using Eq. (4).
In this section, the devices utilized in data collection and experiment to test the designed algorithm are explained, and the results obtained by applying the collected data to the algorithm are explained as well.
4.1 Experiments Setup and Data Recognition
For this experiment, we attached a Samsung Galaxy S10 to a four-wheeled robot that can be manipulated with a remote controller, and then collected data inside various buildings in the campus. The robot's speed determined through the rear wheels was 0.4 m/s, and the front wheels had casters. As illustrated in Fig. 9, data were collected in a corridor with an obstacle and in a corridor with no obstacle.
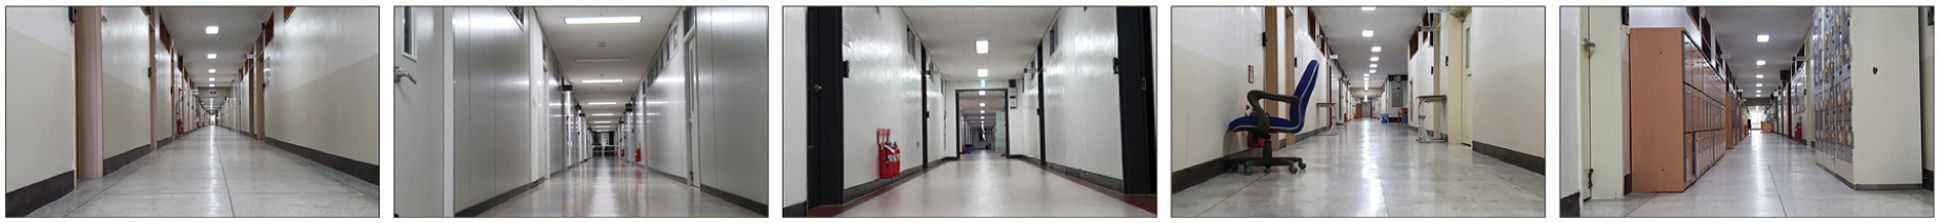
Figure 9: Example of passage image data collected inside buildings
There were various obstacles such as fire extinguishers, desks, chairs, and lockers at the five places in total. All corridors have straight line shape, and a separate space for going down the stairs at the center of the corridor. To fix a camera to the robot, we utilized a fixing device as illustrated in Fig. 10, which was attached to the front of the robot using an insulation tape. The fixing device can hold two cameras simultaneously. The robot has an emergency stop switch and its speed and direction can be controlled utilizing the remote controller. Data were collected while the low-cost robot with a fixed camera was moved around various buildings in the campus. In addition to the collected data, we also utilized the open Carnegie Mellon university (CMU) dataset [45] for accurate performance measurement. The CMU dataset was collected from corridors using a customized LAGR robot at Carnegie Mellon university wean hall. Among the data of the CMU dataset, we only utilized the left images taken with a stereo camera.
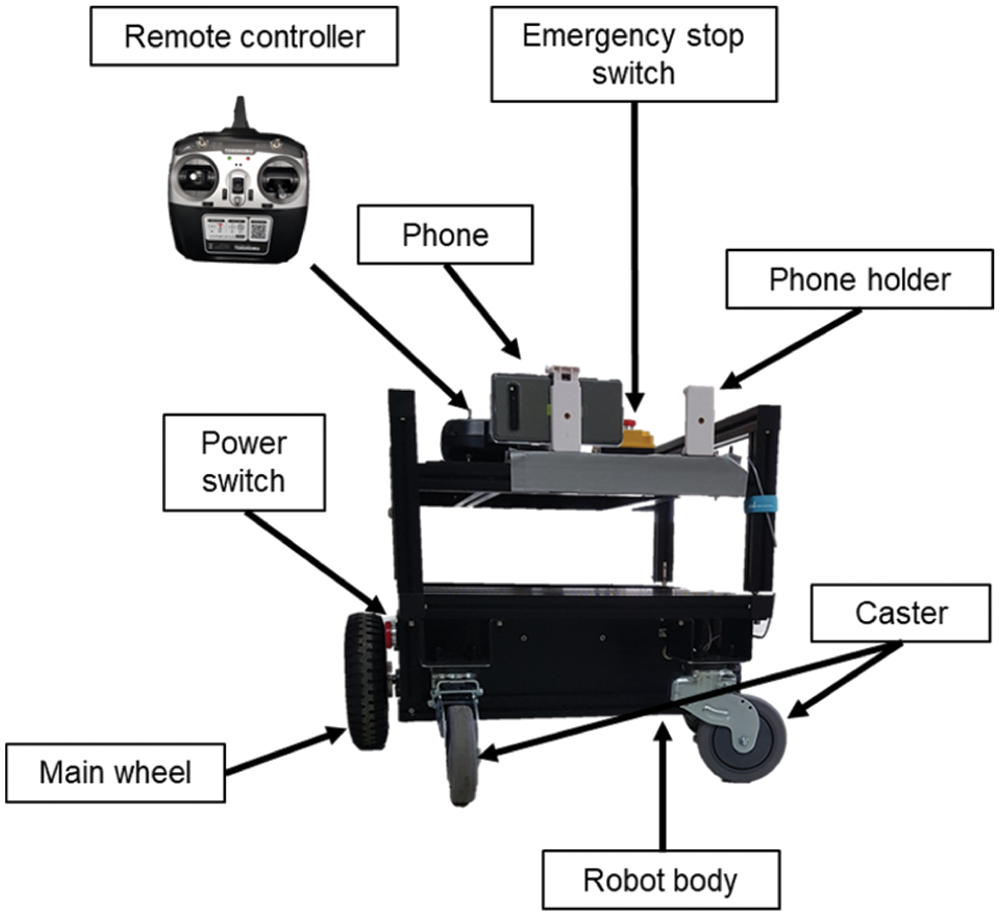
Figure 10: Low-cost robot and smartphone setup used in this experiment
In the collected data, obstacles are first detected through the obstacle detection module. The height of the detected obstacle is estimated, and the detected obstacle is cut. Fig. 11 illustrates the cutting result of untrained obstacles using features. Although obstacles are not accurately cut, it can be observed that they have all the features of obstacles.
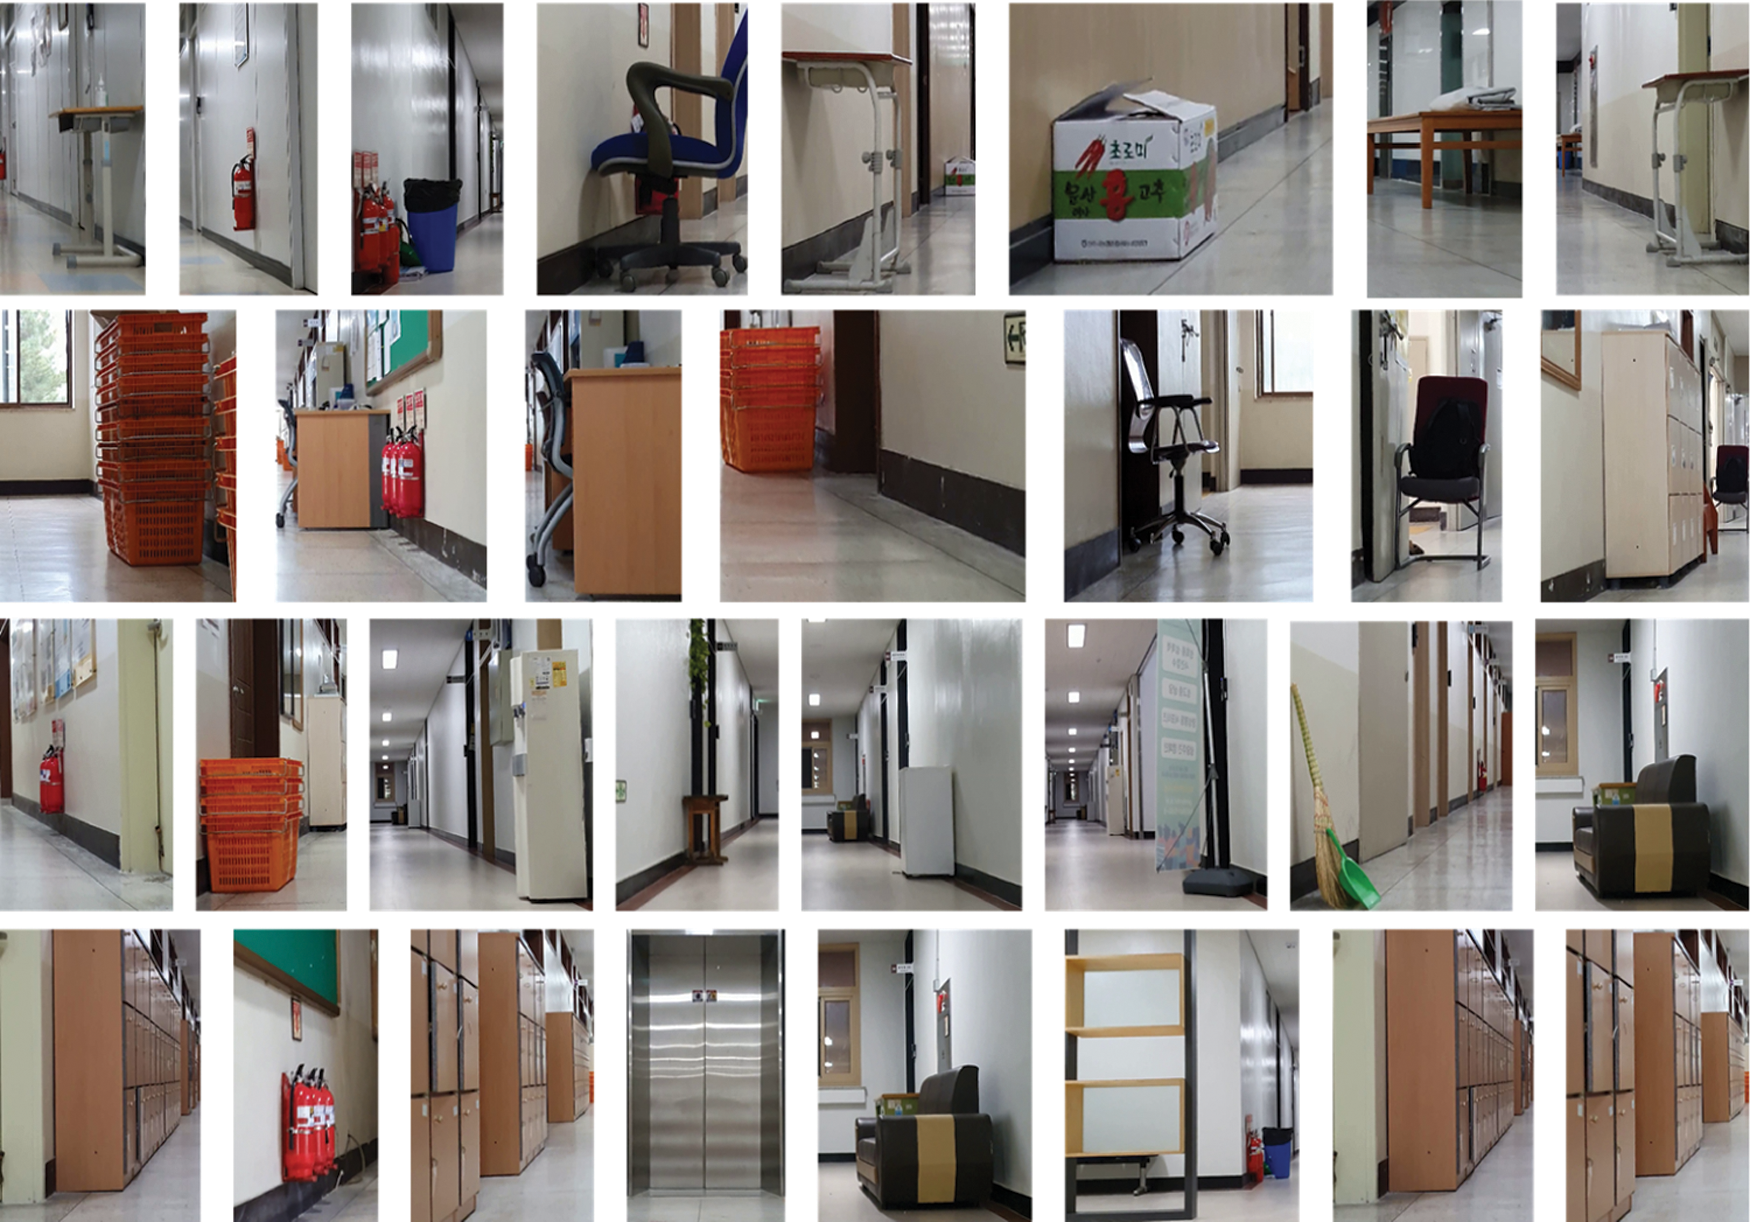
Figure 11: Example of detecting obstacles using pattern analysis and resulting images for estimating the height of obstacles
For this experiment, we utilized the inside of the buildings with the most diverse obstacles among the buildings in the campus. The accuracy of the algorithms for detecting obstacles is summarized in Tab. 1.
As presented in Tab. 1, existing object detection algorithms that have solely undergone pre-training cannot detect obstacles of various shapes. In actual disaster sites, there are several unknown obstacles of diverse shapes such as residues and broken objects as well as known objects. At this time, labeling of objects existing inside the building takes a lot of time and money, and even if the labeled data is sufficiently collected, each object has a different shape, making it difficult to find obstacles through the existing object detection algorithms. In addition, because it is impossible to label all obstacles inside the buildings at a risk of collapse, we detected obstacles solely using the proposed algorithm without combining it with existing object detection algorithms. The proposed algorithm exhibited a high performance in the detection of unknown obstacles. Because object detection utilized the features of the floor, the result was greatly influenced by shadows and contrasts caused by light. When the light weakened as illustrated in Fig. 12, there was a case of misjudging that there was an obstacle because of the shadow, although there was no obstacle. Such misjudgment cases decreased when a constant light was applied, but misjudgments increased when the light turned off or changed in the middle of the experiment. Furthermore, when the robot moved toward the central stairs or the end of the corridor, a pattern that is different from the existing corridor patterns was detected. When the robot definitely reached the end of the corridor, we considered it as a case of an obstacle.
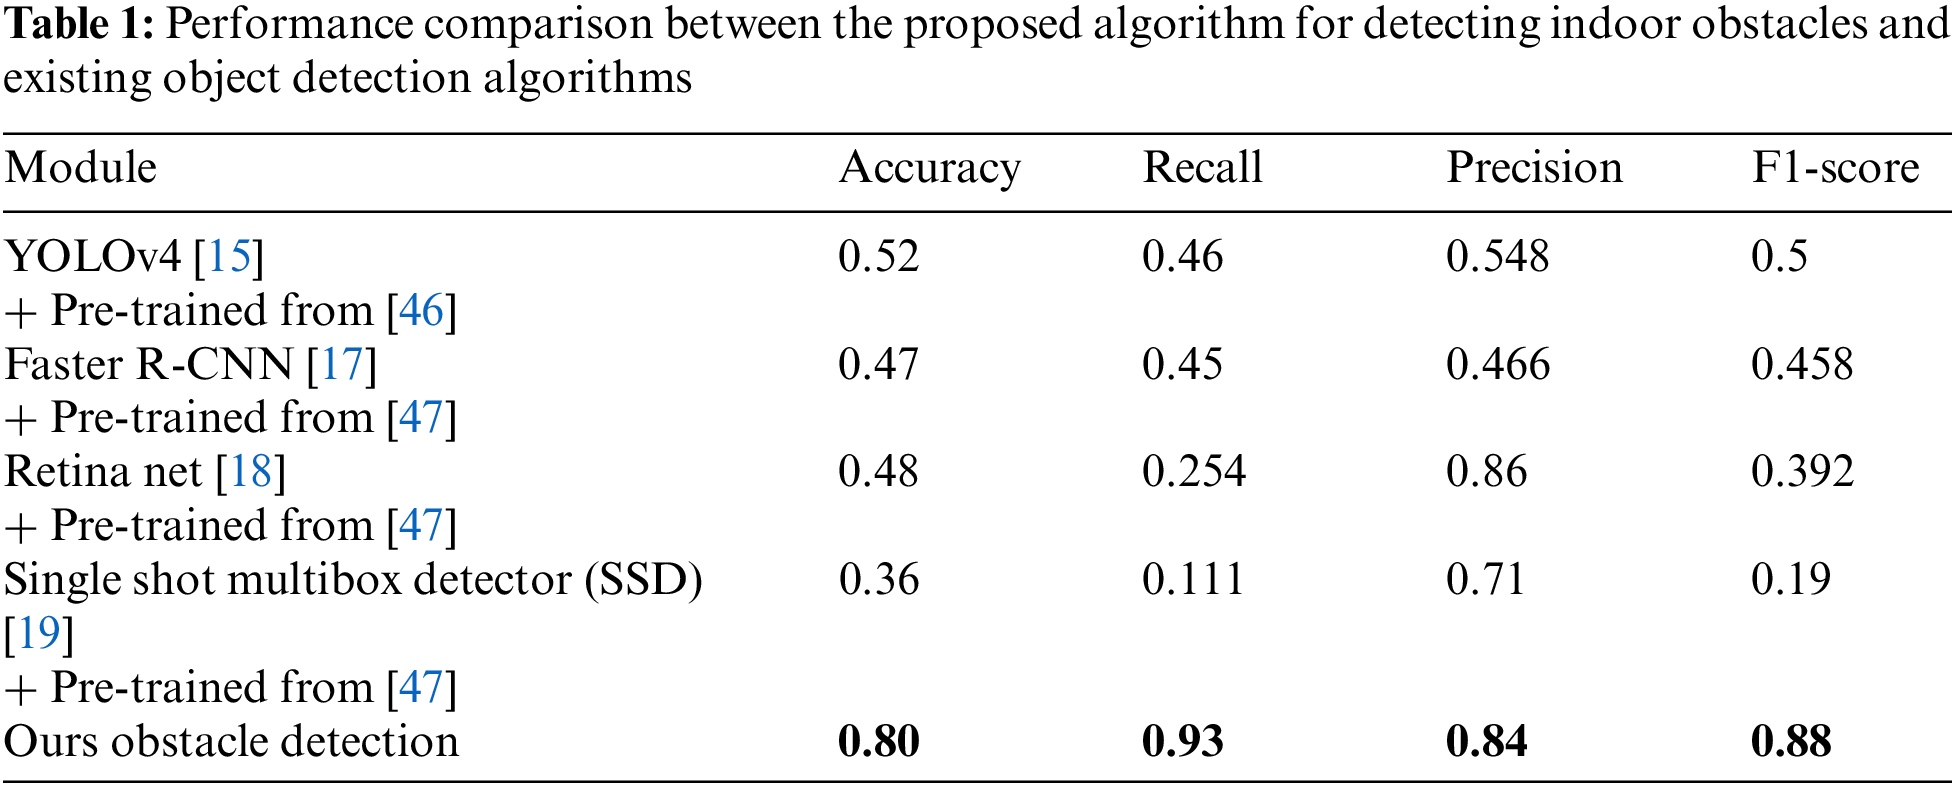
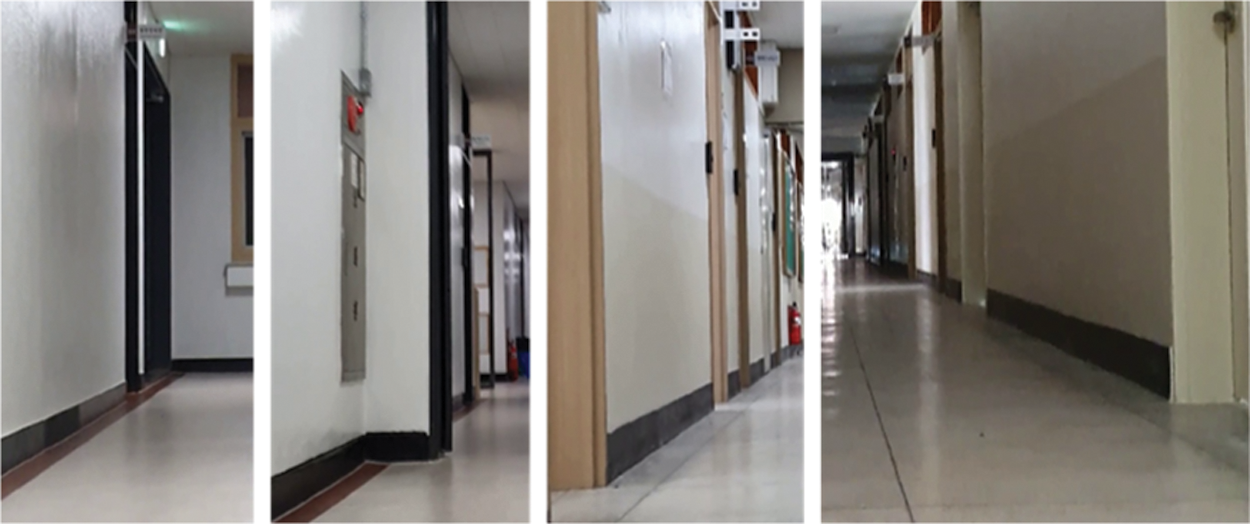
Figure 12: Example of obstacle detection error due to light
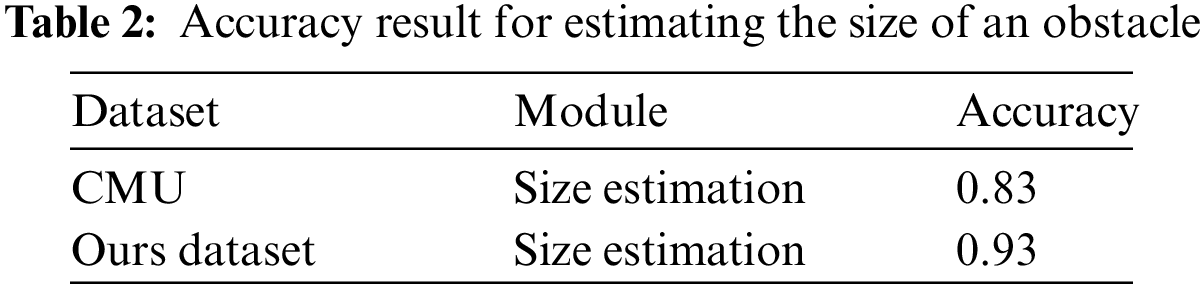
After detecting an obstacle, the algorithm estimates the size of the obstacle. To estimate the obstacle's size, the height of the obstacle is estimated, a bounding box in which the obstacle exists is estimated, and the obstacle is cut in line with the bounding box. Fig. 11 illustrates the result of cutting a detected obstacle in line with the bounding box. We considered it as a correct estimation if the obstacle was fully included in the bounding box. However, if any part of the obstacle was not included in the bounding box, it was considered as an inaccurate detection. The accuracy obtained using this was 0.93 as presented in Tab. 2. Thus, in most cases, the bounding box included the entire obstacle.
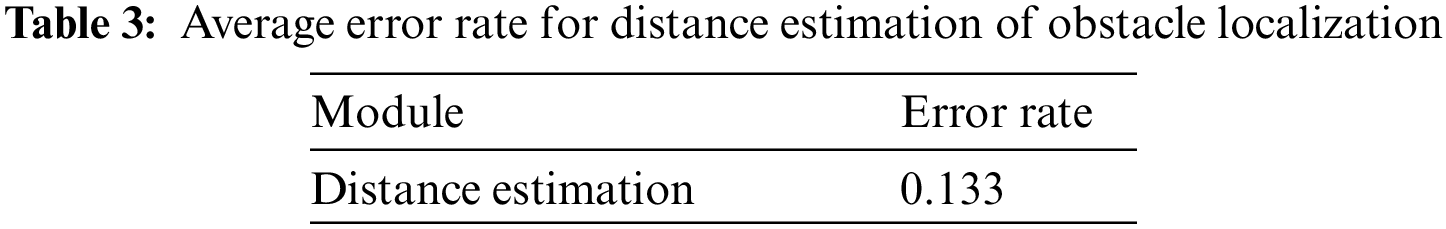
After the size of the obstacle is estimated, its location is estimated sequentially by localization. When the location is estimated, a text file that the estimated location value is written together with the frame number is saved. To verify the distance estimation result, we utilized the average error rate for the distance estimation result. The final error rate was determined by averaging the distance estimation error rate for each obstacle. The distance estimation average error rate of obstacles is presented in Tab. 3.
Each module is sequentially performed, and the height and distance are estimated from the detected obstacle. As explained in the previous section, we obtained error propagation using the accuracy and error rate of the algorithm to determine the overall accuracy of the algorithm. The error rate was defined as 1 minus the validation value. The error of obstacle detection was 1 minus F1 score, or 0.12, error of size estimation was 0.07, and error of distance estimation was 0.133. The error propagation value obtained from the error rate of each detailed algorithm is 0.19; therefore, the overall accuracy of our algorithm is 0.81.
This study is related to the generation of up-to-date disaster digital maps by tracking the locations of collapsed places that are difficult to enter and unknown obstacles, and mapping them on building maps for efficient search and rescue work by identifying the disaster situation inside buildings. The places that can and cannot be accessed inside buildings were identified using a low-cost robot, and the information of various accessible obstacles was collected. The obstacle detection performance of the proposed algorithm indicated a high accuracy of 93%, and the obstacle location estimation had an error rate of 0.133. Up-to-date digital maps can be created using the information of obstacles obtained in this study, and they will be effective for research of the autonomous driving of robots; however, as aforementioned, inaccurate detections because of the effects of light and various environments inside buildings occasional occur. We will conduct a research on obstacle detection in indoor environments of special shapes to address this challenge, and also conduct research to create more concrete up-to-date disaster digital maps by detecting outdoor obstacles around buildings.
Funding Statement: This research was supported by Basic Science Research Program through the National Research Foundation of Korea funded by the Ministry of Education (No. 2020R1I1A3068274), Received by Junho Ahn. https://www.nrf.re.kr/. This research was funded by Korea Transportation Science and Technology Promotion Agency (No. 21QPWO-B152223-03), Received by Chulsu Kim. https://www.kaia.re.kr/.
Conflicts of Interest: The authors declare that they have no conflicts of interest to report regarding the present study.
1. S. Botting, “What should we do with 45,000 half-empty public buildings?,” in Government Policy and Regulation, A. Ignatius, MA, USA: Harvard Business Review, 2020. [Online]. Available: https://hbr.org/2020/07/what-should-we-do-with-45000-half-empty-public-buildings. [Google Scholar]
2. U.S. Fire Administration, (2018, Apr, 16“Securing vacant and abandoned buildings: What communities can do,” [Online]. Available: USFA/Fire Prevention & Public Education/Outreach Materials & Educational Programs/Arson Awareness. [Google Scholar]
3. A. Yamamoto, “Japan's fukushima nuclear plant reactor examined by snake-shaped robot,” NBC News World, NY, USA: NBC News, 2015. [Online]. Available: https://www.nbcnews.com/news/world/japans-fukushima-nuclear-plant-reactor-examined-snake-shaped-robot-n339091. [Google Scholar]
4. L. Tzuheng, “The central people's government of the people's republic of China,” China: Xinhua News, 2013. [Online]. Available: http://www.gov.cn/jrzg/2013-04/26/content_2391132.htm. [Google Scholar]
5. A. P. Collins, “Meet Colossus: The French firefighting robot that helped save Notre-dame,” in Robots & Automation, NY, USA: Jalopnik, 2019. [Online]. Available: https://jalopnik.com/meet-colossus-the-french-firefighting-robot-that-helpe-1834089489. [Google Scholar]
6. M. Stewart, “LAFD debuts the RS3: First robotic firefighting vehicle in the United States,” News, LA, USA: Los Angeles Fire Department, 2020. [Online]. Available: https://www.lafd.org/news/lafd-debuts-rs3-first-robotic-firefighting-vehicle-united-states. [Google Scholar]
7. M. Afif, R. Ayachi, E. Pissaloux, Y. Said and M. Atri, “Indoor objects detection and recognition for an ICT mobility assistance of visually impaired people,” Multimedia Tools and Applications, vol. 79, no. 41, pp. 31645–31662, 2020. [Google Scholar]
8. M. Afif, R. Ayachi, Y. Said, E. Pissaloux and M. Atri, “An evaluation of retinanet on indoor object detection for blind and visually impaired persons assistance navigation,” Neural Processing Letters, vol. 51, no. 3, pp. 2265–2279, 2020. [Google Scholar]
9. S. Kowalewski, A. L. Maurin and J. C. Andersen, “Semantic mapping and object detection for indoor mobile robots,” in IOP Conf. Series: Materials Science and Engineering, Singapore, pp. 012012, 2019. [Google Scholar]
10. G. Georgakis, A. Mousavian, A. C. Berg and J. Kosecka, “Synthesizing training data for object detection in indoor scenes,” in 2017 Robotics: Science and Systems (RSS), Cambridge, MA, USA, pp. 1–9, 2017. [Google Scholar]
11. I. Armeni, S. Sax, A. R. Zamir and S. Savarese, “Joint 2D-3D-semantic data for indoor scene understanding,” arXiv preprint arXiv:1702.01105, 2017. [Google Scholar]
12. H. Zhang, C. Zhang, W. Yang and C. Chen, “Localization and navigation using QR code for mobile robot in indoor environment,” in 2015 IEEE Int. Conf. on Robotics and Biomimetics (ROBIO), Zhuhai, China, pp. 2501–2506, 2015. [Google Scholar]
13. Q. Liu, R. Li, H. Hu and D. Gu, “Indoor topological localization based on a novel deep learning technique,” Cognitive Computation, vol. 12, no. 3, pp. 528–541, 2020. [Google Scholar]
14. R. P. Padhy, S. Ahmad, S. Verma, S. Bakshi and P. K. Sa, “Localization of unmanned aerial vehicles in corridor environments using deep learning,” in 2020 25th Int. Conf. on Pattern Recognition (ICPR), Milan, Italy, pp. 9423–9428, 2021. [Google Scholar]
15. A. Bochkovskiy, C. Wang and H. M. Liao, “YOLOv4: Optimal speed and accuracy of object detection,” arXiv preprint arXiv:2004.10934, 2020. [Google Scholar]
16. J. Tao, H. Wang, X. Zhang, X. Li and H. Yang, “An object detection system based on YOLO in traffic scene,” in 2017 6th Int. Conf. on Computer Science and Network Technology (ICCSNT), Dalian, China, pp. 315–319, 2017. [Google Scholar]
17. S. Ren, K. He, R. Girshick and J. Sun, “Faster R-CNN: Towards real-time object detection with region proposal networks,” IEEE Transactions on Pattern Analysis and Machine Intelligence, vol. 39, no. 6, pp. 1137–1149, 2017. [Google Scholar]
18. T. Y. Lin, P. Goyal, R. Girshick, K. He and P. Dollar, “Focal loss for dense object detection,” in 2017 IEEE Int. Conf. on Computer Vision (ICCV), Venice, Italy, pp. 2980–2988, 2017. [Google Scholar]
19. W. Liu, D. Anguelov, D. Erhan, C. Szegedy, S. Reed et al., “SSD: Single shot multibox detector,” in Computer Vision–ECCV 2016, Cham, Switzerland: Springer, vol. 9905, pp. 21–37, 2016. [Google Scholar]
20. M. U. Ahmed, Y. H. Kim and P. K. Rhee, “EER-ASSL: Combining rollback learning and deep learning for rapid adaptive object detection,” KSII Transactions on Internet and Information Systems, vol. 14, no. 12, pp. 4776–4794, 2020. [Google Scholar]
21. J. Jung, D. Kim, C. Kim, R. Oh and J. Ahn, “Intelligent railway detection algorithm fusing image processing and deep learning for the prevent of unusual events,” Journal of Internet Computing and Services, vol. 21, no. 4, pp. 109–116, 2020. [Google Scholar]
22. J. Jung, M. Park, K. Cho, C. Mun and J. Ahn, “Intelligent hybrid fusion algorithm with vision patterns for generation of precise digital road maps in self-driving vehicles,” KSII Transactions on Internet and Information Systems, vol. 14, no. 10, pp. 3955–3971, 2020. [Google Scholar]
23. W. Runzhi, W. Wenhui, W. Yongkang and D. Kaichang, “A new RGB-D SLAM method with moving object detection for dynamic indoor scenes,” Remote Sensing, vol. 11, no. 10, pp. 1143, 2019. [Google Scholar]
24. I. Croitoru, S. Bogolin and M. Leordeanu, “Unsupervised learning from video to detect foreground objects in single images,” in 2017 IEEE Int. Conf. on Computer Vision (ICCV), Venice, Italy, pp. 4345–4353, 2017. [Google Scholar]
25. Z. Yang, Q. Wang, L. Bertinetto, W. Hu, S. Bai et al., “Anchor diffusion for unsupervised video object segmentation,” in 2019 IEEE/CVF Int. Conf. on Computer Vision (ICCV), Seoul, Korea, pp. 931–940, 2019. [Google Scholar]
26. G. Surbhi, R. Sangeeta, M. R. Shankar, S. Gaurav, B. Tapas et al., “Corridor segmentation for automatic robot navigation in indoor environment using edge devices,” Computer Networks, vol. 178, no. 1389–1286, pp. 107374, 2020. [Google Scholar]
27. J. Canny, “A computational approach to edge detection,” IEEE Transactions on Pattern Analysis and Machine Intelligence, vol. PAMI-8, no. 6, pp. 679–698, 1986. [Google Scholar]
28. J. Long, E. Shelhamer and T. Darrell, “Fully convolutional networks for semantic segmentation,” in 2015 IEEE Conf. on Computer Vision and Pattern Recognition (CVPR), Boston, MA, USA, pp. 3431–3440, 2015. [Google Scholar]
29. O. Ronneberger, P. Fischer and T. Brox, “U-net: Convolutional networks for biomedical image segmentation,” in Medical Image Computing and Computer-Assisted Intervention–MICCAI 2015, Cham, Switzerland: Springer, pp. 234–241, 2015. [Google Scholar]
30. S. Yang, D. Maturana and S. Scherer, “Real-time 3D scene layout from a single image using convolutional neural networks,” in 2016 IEEE Int. Conf. on Robotics and Automation (ICRA), Stockholm, Sweden, pp. 2183–2189, 2016. [Google Scholar]
31. P. Krähenbühl and V. Koltun, “Efficient inference in fully connected CRFs with Gaussian edge potentials,” in Conf. on Neural Information Processing Systems, Granada, Spain, pp. 109–117, 2011. [Google Scholar]
32. K. He, G. Gkioxari, P. Dollár and R. Girshick, “Mask R-CNN,” in 2017 IEEE Int. Conf. on Computer Vision (ICCV), Venice, Italy, pp. 2961–2969, 2017. [Google Scholar]
33. A. Zaarane, I. Slimani, W. A. Okaishi, I. Atouf and A. Hamdoun, “Distance measurement system for autonomous vehicles using stereo camera,” Array, vol. 5, no. 2590–0056, pp. 100016, 2020. [Google Scholar]
34. C. S. Ferreira, J. Y. Mori, M. C. Q. Farias and C. H. Llanos, “A Real-time stereo vision system for distance measurement and underwater image restoration,” Journal of the Brazilian Society of Mechanical Sciences and Engineering, vol. 38, no. 7, pp. 2039–2049, 2016. [Google Scholar]
35. U. Frédéric and V. Stéphane, “Stereo-vision,” in University of Applied Sciences, F. Olawsky, Karlsruhe, Germany: Hochschule Karlsruhe, 2017. [Online]. Available: https://github.com/LearnTechWithUs/Stereo-Vision/blob/master/Stereo%20Vision%20-%20Explanation%20-%20German.pdf. [Google Scholar]
36. C. Godard, O. M. Aodha, M. Firman and G. Brostow, “Digging into self-supervised monocular depth estimation,” in 2019 IEEE/CVF Int. Conf. on Computer Vision (ICCV), Seoul, Korea, pp. 3828–3838, 2019. [Google Scholar]
37. C. Godard, O. M. Aodha and G. J. Brostow, “Unsupervised monocular depth estimation with left-right consistency,” in 2017 IEEE Conf. on Computer Vision and Pattern Recognition (CVPR), Honolulu, HI, USA, pp. 270–279, 2017. [Google Scholar]
38. M. Vermenouze, “Lugap sélectionne 4 robots shark robotics pour sa nouvelle offre dédiée à la robotique terrestre,” in Shark Robotics NEWS, La Rochelle, France: Shark Robotics, 2021. [Online]. Available: https://www.shark-robotics.com/news/lugap-slectionne-4-robots-shark-robotics-pour-sa-nouvelle-offre-ddie-la-robotique-terrestre. [Google Scholar]
39. A. D. Steffen, “Thermite RS3: America's first firefighting robot,” in Intelligent Living Technology, Bristol, UK: Intelligent Living Media Ltd, 2020. [Online]. Available: https://www.intelligentliving.co/thermite-rs3-americas-first-firefighting-robot/. [Google Scholar]
40. OMOROBOT, (2021, Oct, “19Omo R1. [Online]. Available: https://omorobot.com/docs/omo-r1/. [Google Scholar]
41. Samsung, (2019, Apr, 5Galaxy S10. [Onlilne]. Available: https://www.samsung.com/sec/smartphones/all-smartphones/. [Google Scholar]
42. R. G. v. Gioi, J. Jakubowicz, J. Morel and G. Randall, “LSD: A line segment detector,” Image Processing on Line (IPOL), vol. 2, pp. 35–55, 2012. [Google Scholar]
43. R. M. Haralick, S. R. Sternberg and X. Zhuang, “Image analysis using mathematical morphology,” IEEE Transactions on Pattern Analysis and Machine Intelligence, vol. PAMI-9, no. 4, pp. 532–550, 1987. [Google Scholar]
44. J. Ahn and R. Han, “Rescueme: An indoor mobile augmented-reality evacuation system by personalized pedometry,” in 2011 IEEE Asia-Pacific Services Computing Conf., Jeju, Korea, pp. 70–77, 2011. [Google Scholar]
45. CMU, (2011The Wean Hall dataset. [Online]. Available: https://www.cs.cmu.edu/~halismai/wean/. [Google Scholar]
46. Common Objects in Context, (2017COCO Dataset 2017 test images. [Online]. Available: http://images.cocodataset.org/zips/test2017.zip. [Google Scholar]
47. PASCAL Visual Object Classes, (2007The PASCAL Visual Object Classes Challenge 2007 (VOC2007). [Online]. Available: http://host.robots.ox.ac.uk/pascal/VOC/voc2007/. [Google Scholar]
 | This work is licensed under a Creative Commons Attribution 4.0 International License, which permits unrestricted use, distribution, and reproduction in any medium, provided the original work is properly cited. |