DOI:10.32604/cmc.2022.025220
| Computers, Materials & Continua DOI:10.32604/cmc.2022.025220 | |
| Article |
Hybrid Sine Cosine and Stochastic Fractal Search for Hemoglobin Estimation
1Faculty of Artificial Intelligence, Delta University for Science and Technology, Mansoura, 35712, Egypt
2Department of Computer Engineering, College of Computers and Information Technology, Taif University, Taif, 21944, Saudi Arabia
3Computer Engineering and Control Systems Department, Faculty of Engineering, Mansoura University, Mansoura, 35516, Egypt
4Mechanical Engineering Department, Qassim University, Buraidah, 51452, Saudi Arabia
5Department of Computer Systems Engineering, Faculty of Engineering at Shoubra, Benha University, Egypt
*Corresponding Author: Marwa M. Eid. Email: marwa.3eeed@gmail.com
Received: 17 November 2021; Accepted: 21 December 2021
Abstract: The sample's hemoglobin and glucose levels can be determined by obtaining a blood sample from the human body using a needle and analyzing it. Hemoglobin (HGB) is a critical component of the human body because it transports oxygen from the lungs to the body's tissues and returns carbon dioxide from the tissues to the lungs. Calculating the HGB level is a critical step in any blood analysis job. The HGB levels often indicate whether a person is anemic or polycythemia vera. Constructing ensemble models by combining two or more base machine learning (ML) models can help create a more improved model. The purpose of this work is to present a weighted average ensemble model for predicting hemoglobin levels. An optimization method is utilized to get the ensemble's optimum weights. The optimum weight for this work is determined using a sine cosine algorithm based on stochastic fractal search (SCSFS). The proposed SCSFS ensemble is compared to Decision Tree, Multilayer perceptron (MLP), Support Vector Regression (SVR) and Random Forest Regressors as model-based approaches and the average ensemble model. The SCSFS results indicate that the proposed model outperforms existing models and provides an almost accurate hemoglobin estimate.
Keywords: Sine cosine optimization; metaheuristics optimization; hemoglobin estimation; weight average ensemble
Hemoglobin is a protein molecule found in the red blood cells that are mainly composed of the element iron. Hemoglobin is built up of globulin chains, which are interconnected protein molecules that carry oxygen. Heme is an essential component of the globulin chain since it contains an iron atom. Heme is also known as the iron atom. It aids in the transportation of oxygen and carbon dioxide throughout our bodies via the blood. HGB (hemoglobin) and glucose (Gl) are two essential components of human blood and are two significant components of human blood. When it comes to biological activity, blood is involved in quite a few of them. Hemoglobin is responsible for transporting oxygen throughout the body from the lungs. Both a hemoglobin shortage and an overabundance of hemoglobin are associated with illness. The body generates glucose from the meals it consumes to provide energy to all the cells in the body. However, if there is an excessive amount of glucose in the blood, it may create difficulties. Diabetes can be considered one of the most prevalent illnesses globally, affecting over a billion people [1,2].
Being a reliable tool in managing laboratory information of illness diagnosis in the hematology laboratory is very beneficial. Hematological data analysis is a fascinating and challenging job in the medical research field, and we present a model to compare different classification and regression techniques utilizing Scikit-Learn to accomplish this work. If a simple Hemoglobin estimation method is provided, this may be feasible. To overcome a complication caused by anemia, our team is developing a technology that will detect hemoglobin levels in the early stages of anemia with relative ease [3,4]. Consequently, it will assist in the treatment of anemic patients. The estimate of hemoglobin levels in the blood may be accomplished using a variety of techniques. According to WHO (World Health Organization), these techniques are recorded. The methods for estimating HGB value are discussed in the next section in more detail.
Data mining can be considered as the computing process for discovering patterns during the investigation of large datasets. This process involves methods based on machine learning, statistics, and database systems [5–7]. Recently, both the amount of data generated and collected data have increased dramatically in recent decades. The main goal of the data mining process is to make sense of large amounts of primarily unsupervised data. Data mining is being utilized in various areas such as hospitals, companies, education, fraud detection, and bioinformatics. In the case of bioinformatics, it assists medical persons in extracting valuable information from large datasets collected in biology, and it helps patients receive better and more affordable health care [8].
Estimating a mapping function between the continuous input variables and the continuous output variable is known as regression analysis. The hemoglobin (HGB) can be predicted based on the input variables such as white blood cells (WBC), red blood cells (RBC), lymphocytes (LYM). For this study, various machine learning estimators, such as Decision Tree Regressor, Multilayer perceptron (MLP) Regressor, Support Vector Regression (SVR), and Random Forest Regressor, in addition to the ensemble model, have been experimented. The ensemble models assist in integrating the skills of a range of single base models to produce an almost accurate prediction model [9–11]. This concept may propose into action in different ways. For example, some essential techniques depend on resampling the training set, while others rely on different prediction methods or changing specific predictive technique parameters, among other things [12–14]. Also, the results of each prediction are pooled using an ensemble of methods to conclude [15–17].
This work presents a weighted average ensemble model based on sine cosine and stochastic fractal search optimization techniques (SCSFS) for predicting hemoglobin levels. The proposed optimization algorithm is utilized to get the ensemble's optimum weights. The proposed SCSFS ensemble is compared to Decision Tree, Multilayer perceptron (MLP), Support Vector Regression (SVR) and Random Forest Regressors as model-based approaches, in addition to the average ensemble and ensemble-based MLP models. The suggested optimizing ensemble model based on the SCSFS algorithm is used to discover the optimum weights for the MLP Regressor ensemble, and the proposed optimizing ensemble model is used to find the best weights for the ensemble model. The SCSFS results indicate if it can outperform existing models and provide an almost accurate hemoglobin estimate. The ANOVA and t-test statistical methodologies compare the populations to establish the significant difference between the suggested and compared technologies.
For the measurement of blood components, a variety of invasive techniques are used. The majority of these techniques test blood components by taking blood from the patient's body via venipuncture. These techniques are unpleasant and carry a risk of infection since blood must be taken with a needle, and the results of the analysis of the blood sample take a long time to come back [18].
Several closely similar studies have been published, including “Automated Diagnosis of Thalassemia Based on Data Mining Classifiers” and other publications that use data mining methods to diagnose a variety of illnesses. The investigation for thalassemia based on the complete blood count (CBC) was given; however, the primary focus of this article is on Mean Cellular Volume (MCV), and we believe that they should be used. The primary characteristic of categorized thalassemia is low hemoglobin. The authors in this work investigated algorithms in more depth, focusing on their accuracy, learning time, and error rate. They observed a direct relationship between the time spent constructing the tree model and the volume of information records and that there is a corresponding indirect relationship between the time spent creating the tree model and the attribute size of the informative collections. Their investigation concludes that Bayesian algorithms outperform all other algorithms in terms of classification precision [19].
A non-invasive HGB concentration level prediction approach based on photoplethysmography (PPG) signals was presented. The system analyses PPG characteristics features utilizing a variety of machine learning methods [20]. Following the analysis of the datasets (PPG signals) obtained from 33 individuals who illuminated light with their fingers over the course of ten periods, 40 distinctive characteristics were identified. A combination of RELIEFF feature selection (RFS) and correlation-based feature selection (CFS) was used to choose the best features before developing eight distinct regression models [21]. According to the prediction findings, the support vector-based regression model outperformed the other model in terms of overall performance.
Iron adds to the hemoglobin (HGB) level in the blood and causes it to be red. There is a significant relationship between the color components and the hemoglobin concentrations. According to this article, the Hb value is calculated by analyzing the color components of picture samples. The average of the red component of a colored picture is calculated and regarded as a feature in the image analysis. These have been computed based on the data that has been made public. Outside of commercial devices such as those mentioned above, much research is being conducted to create non-invasive hemoglobin monitoring systems and prediction algorithms for human blood. The researchers used pulse spectrophotometry at seven different wavelengths to create a non-invasive, continuous, and highly accurate device that showed promise for detecting HGB [22]. Data mining techniques and methods for diabetes diagnosis are being used, according to the authors. A comparable examination of different algorithms is conducted in this article. This endeavor is concerned with mining the relationships in diabetic information to put the information into effective order. Regardless, they need a model that can evaluate diabetes datasets, which has already been presented.
The suggested ensemble model will be introduced and described in more depth in this part. First, the gathered dataset is given to be preprocessed. The dataset is subjected to an exploratory analysis, which is provided. After that, the preparation methods that were used on the dataset are described in detail.
Specific columns, such as gender and age, have been removed from the dataset since there were so many blank entries in them. Those blank numbers can happen because the operator did not store the patient's personal information for each blood test because the operator was using another software to handle the patient's data at the time of the test. The previously stated that CBC parameters were carefully chosen by a competent doctor who decided the most significant factors that impact the calculation of hemoglobin.
After selecting the relevant features, the data has been normalized to convert the raw feature vectors into a more appropriate form for the various machine learning estimators available. Then, utilizing the StandardScaler formula to do the work standardizes characteristics by subtracting their means and scaling them to unit variance. Various machine learning estimators can perform incorrectly if an individual feature does not more or less resemble standard normally distributed data. Tab. 1 shows the descriptive statistics of the hematological dataset. Data correlation of the hemoglobin and other parameters in the tested dataset are shown in Fig. 1. Fig. 2 presents the processing of hemoglobin data in graphical format which shows the distribution of the dataset value for each parameter.
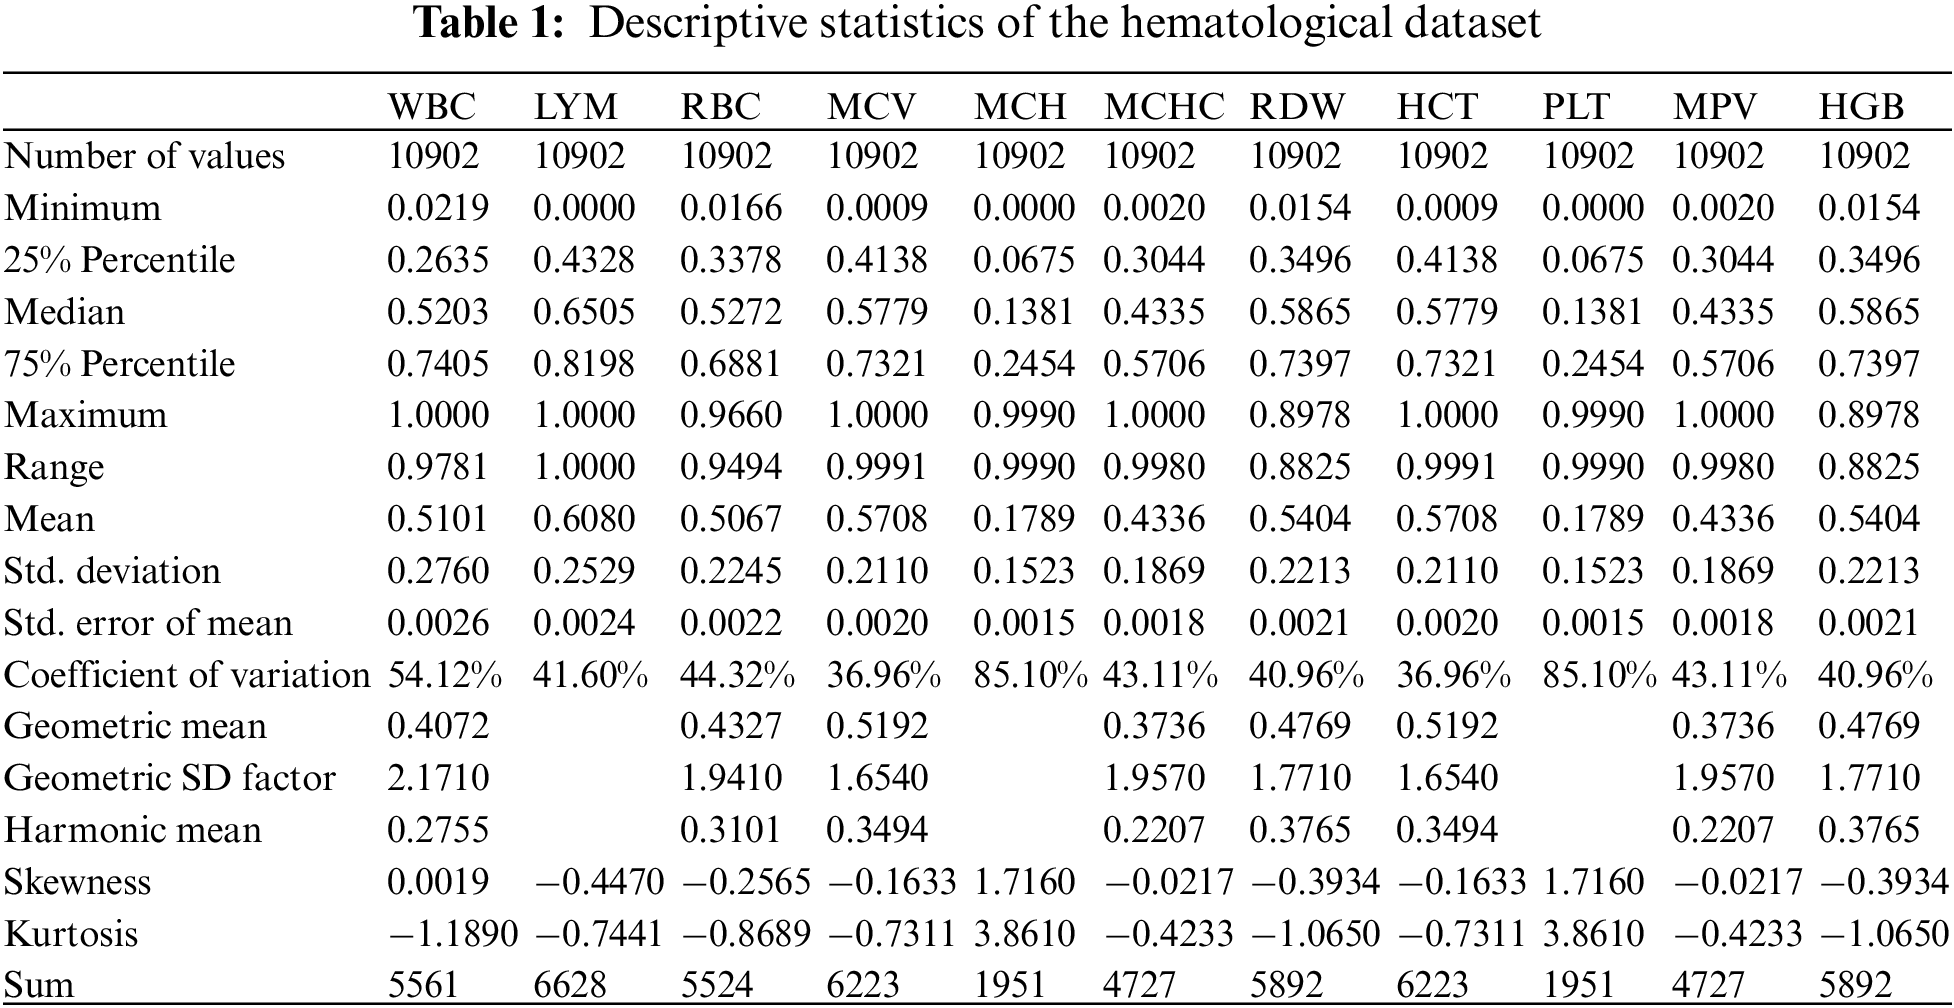
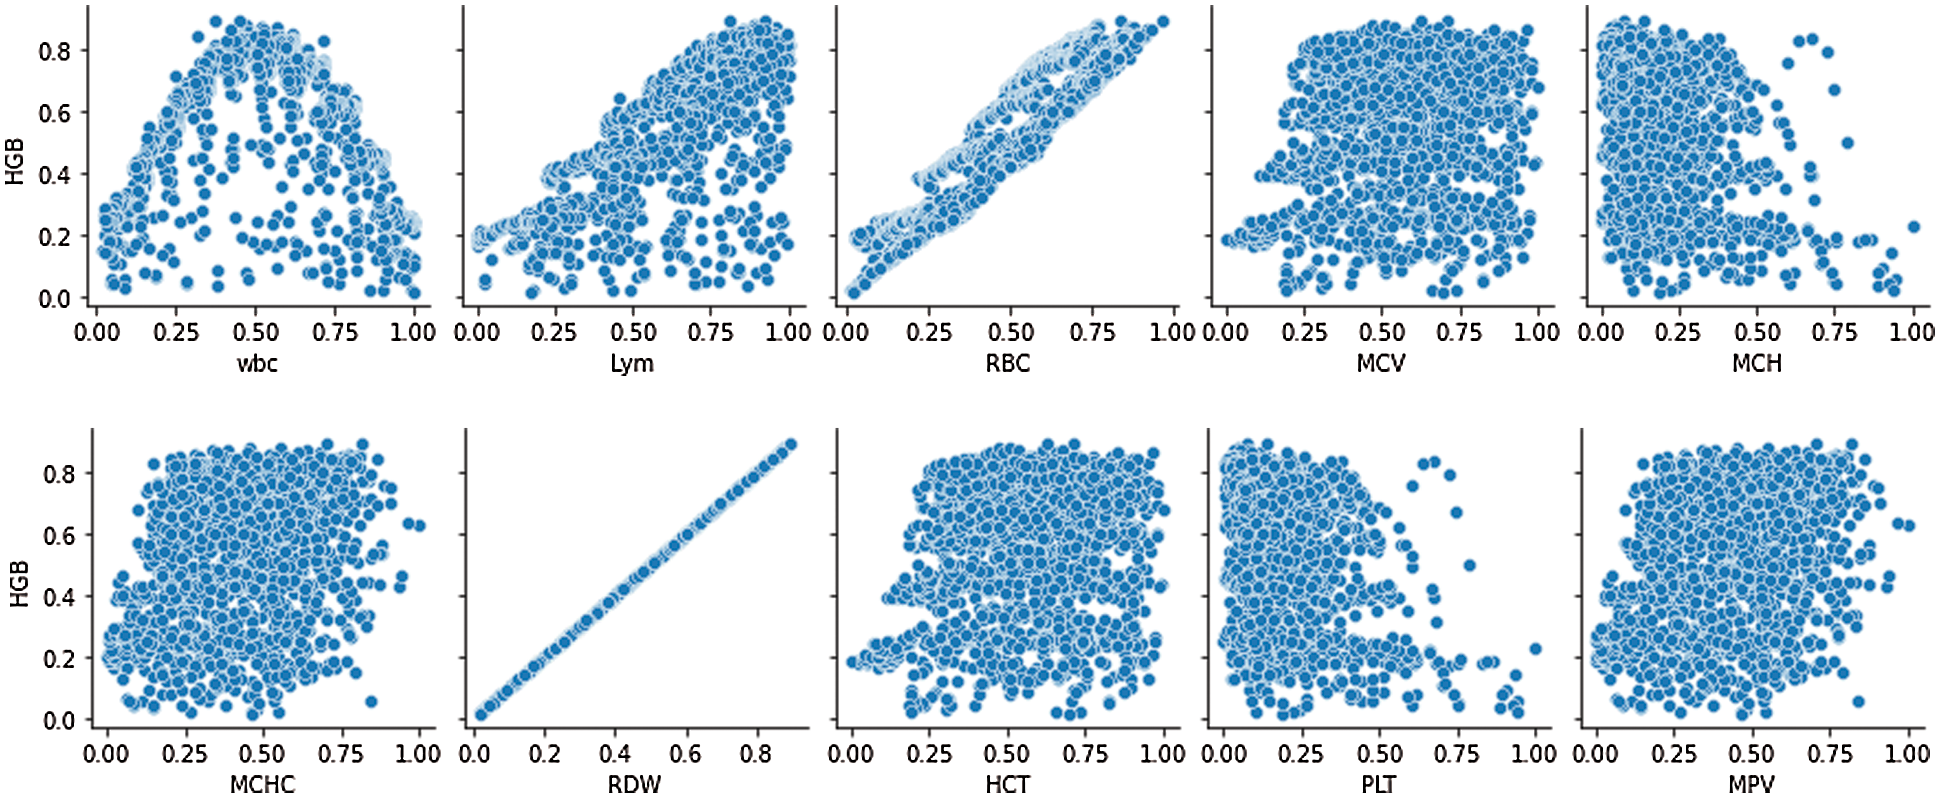
Figure 1: Hemoglobin data correlation of parameters vs. HGB
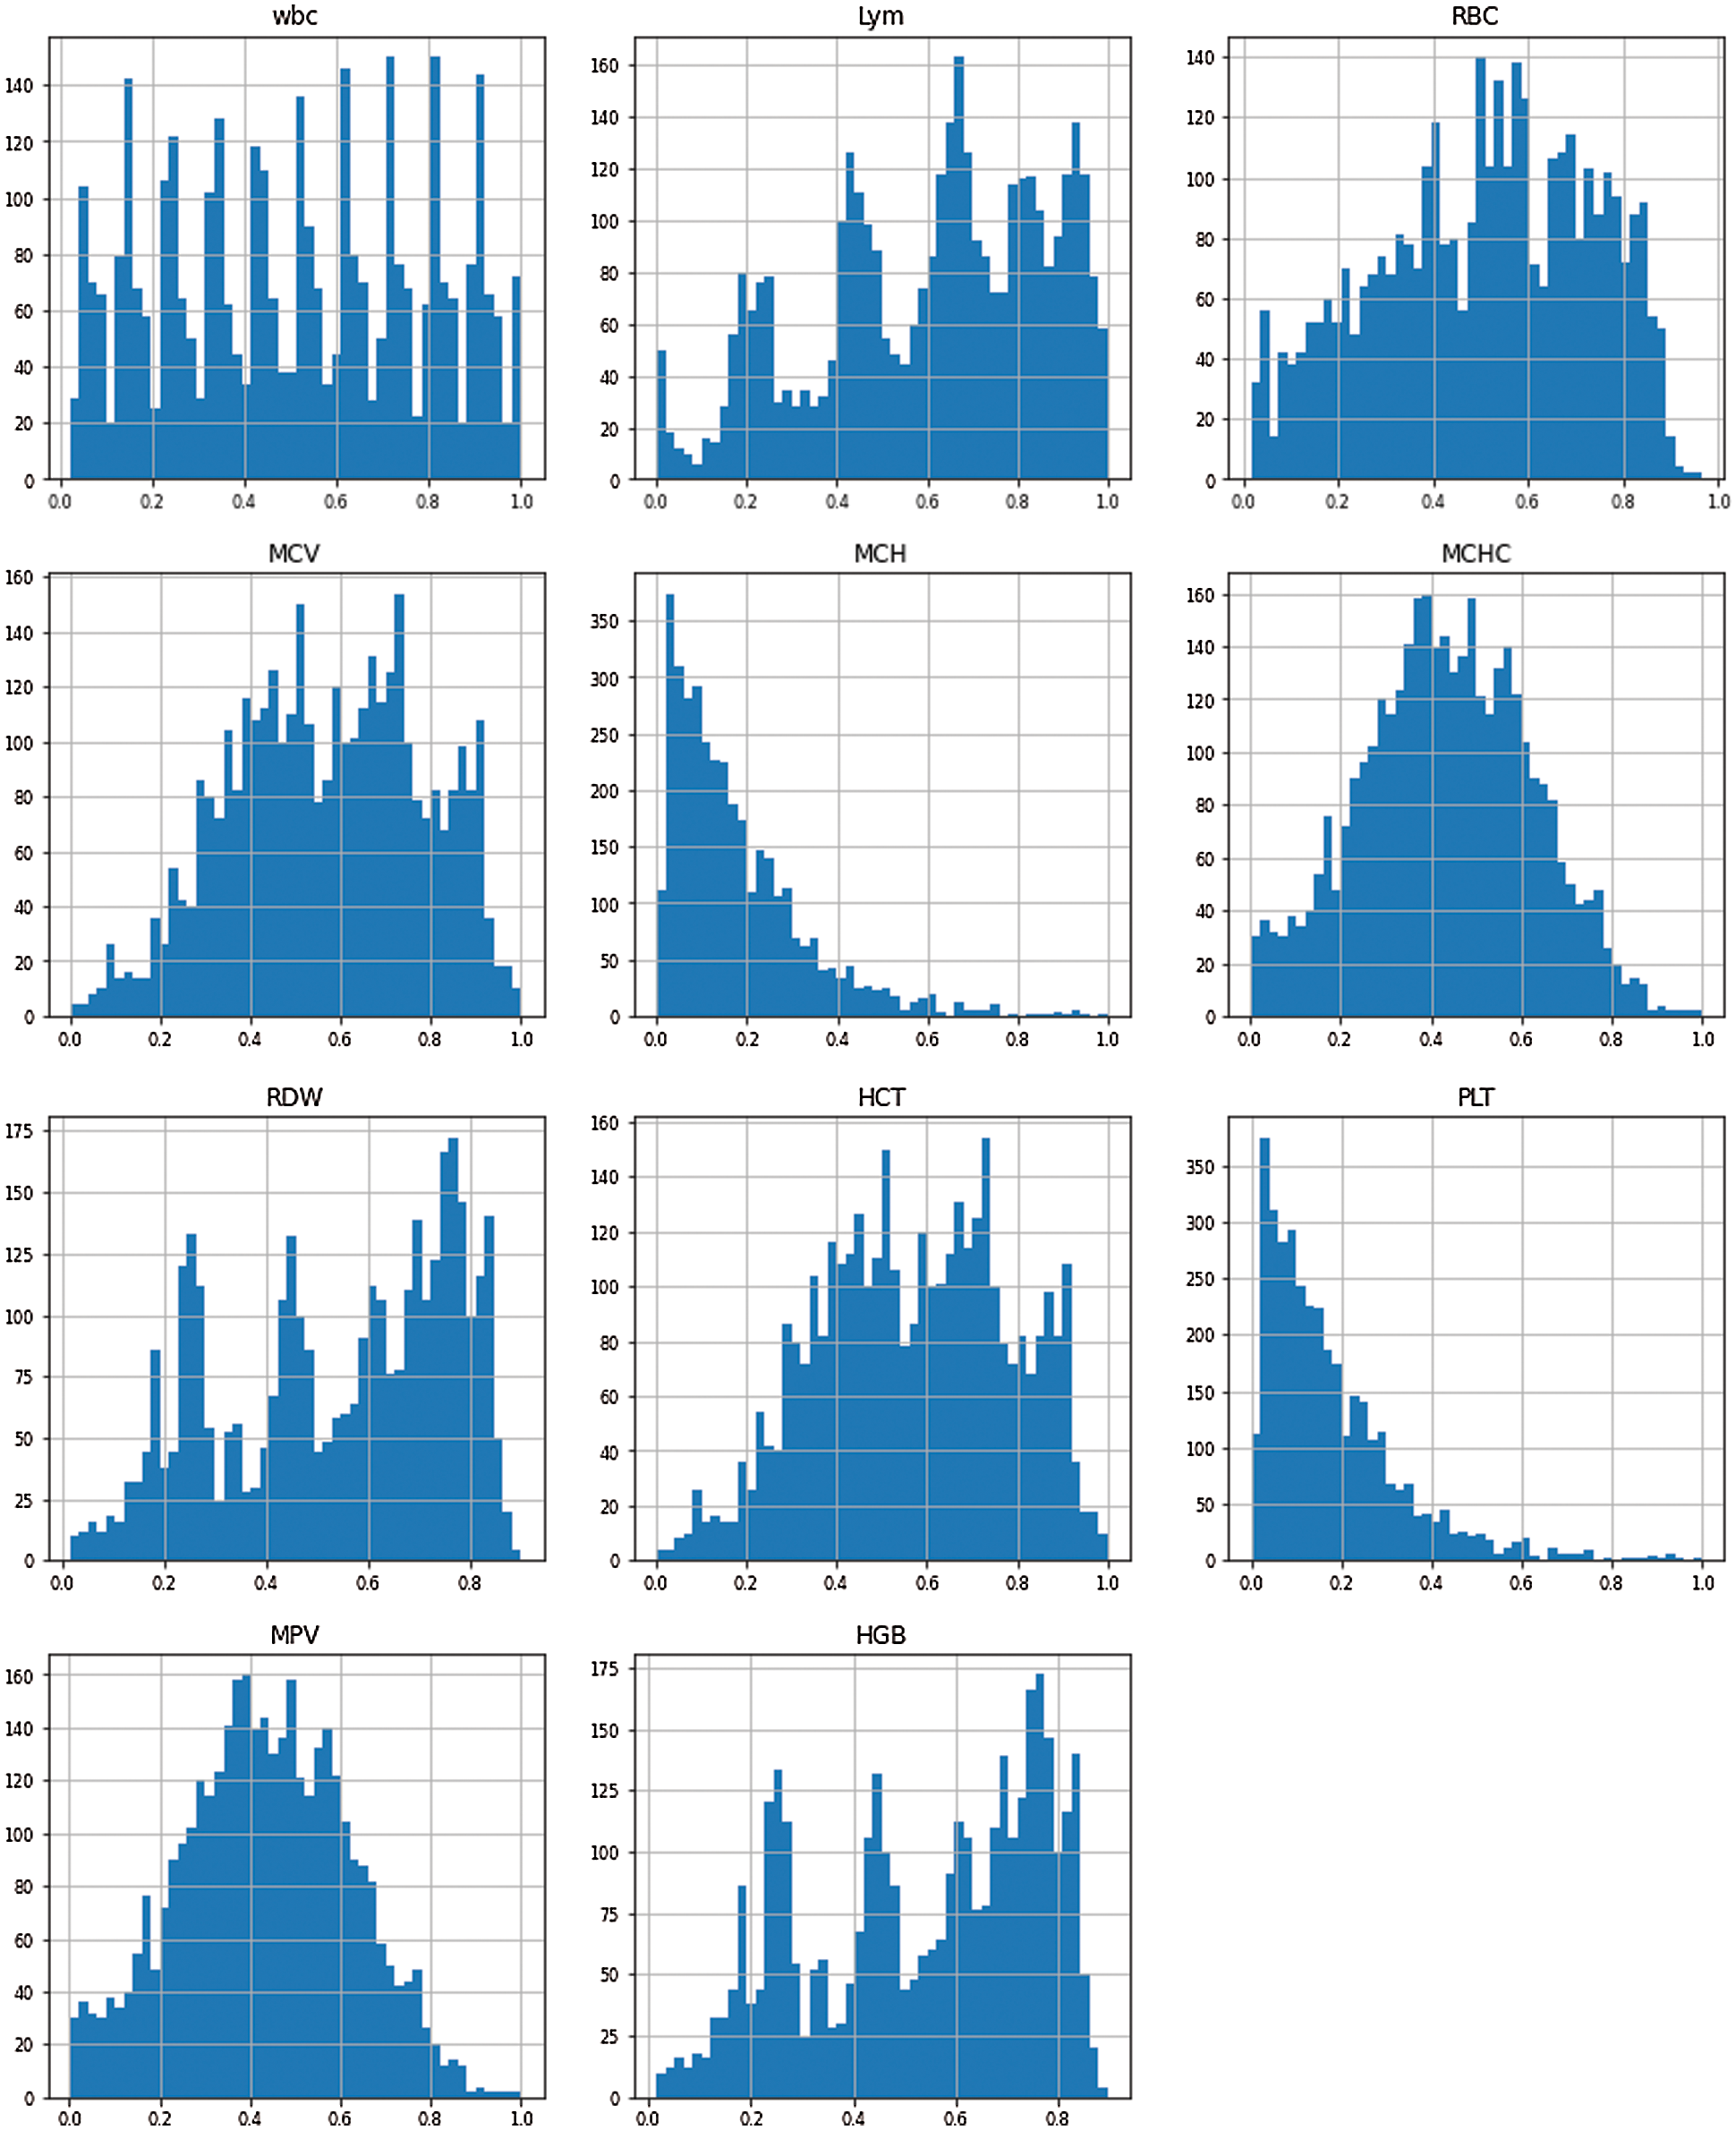
Figure 2: Processing of the hemoglobin dataset parameters
3.2 Weight Average Ensemble Model
The suggested weighted average ensemble model is based on optimizing weights for base models, followed by the calculation of the average ensemble based on the weighted outcomes. The optimum weights for the ensemble model are determined by using the Sine Cosine Algorithm (SCA) [23] based on Stochastic Fractal Search (SFS) method [24]. The SCSFS algorithm is responsible for optimizing the weights of the base. Following the calculation of the optimized weights of the base models, the average ensemble is computed to get the final output result of the base models.
A common issue in machines when the input parameters of the function, such as the floating-point values, are actual numerical values is the problem of continuous functions optimization (also known as optimization of continuous functions). The function returns an evaluation of the argument that corresponds to real-life situations. Continuous function optimization may be used to differentiate between issues involving discrete variables and problems involving many variables, which are referred to as combined optimization problems. Various methods may be resolved, structured, and relied upon to maximize the situation when dealing with issues involving continuous functions. Based on one method of optimization classification, the information about the goal function used and utilized throughout the optimization process is derived. The more well-known information about the target function is, the simpler it is to optimize since knowledge can be applied efficiently.
Several years ago, the Sine Cosine Algorithm (SCA) for optimization issues was introduced [23]. When it comes to updating the locations of the agents, the algorithm is mostly based on the sine and cosine functions. A collection of random variables indicates the direction of movement, the distance of movement that should be made, and the transition between the sine and cosine components in the algorithm. SCA updates the locations of various solutions using the following equation, which is expressed in mathematical terms.
where
The method generates a random starting location for the SCA population of n agents, then used to determine the final position. The objective function is then computed for each agent to determine the location of the best possible solution. The characteristics of the original fractal method can be used to inspire a meta-heuristic algorithm based on random fractals in terms of time consumption and accuracy to find a solution for a given problem. The basic Stochastic Fractal Search (SFS) method [24] employs the following elements to find a solution for a given problem:
where
It is necessary to use the Gaussian distribution technique to generate new particles based on the diffusion process of SFS. Thus, using the SFS algorithm's diffusion process to find the best solution, the suggested SCSFS may explore more options and find the best answer faster than before, as shown in Fig. 3. The proposed SCSFS algorithm is explained in detail in Algorithm 1. Steps from 1 to 3 initialize the algorithm parameters. From step 4 to step 19, the algorithm calculates the predefined objective function and updates the agents’ positions. Changing of agent's positions is based on the sine cosine algorithm from step 7 to step 14 and the SFS algorithm from step 15 to step 17. AT step 18, the number of iterations is updated. After finalizing the process, the optimal solution is obtained.
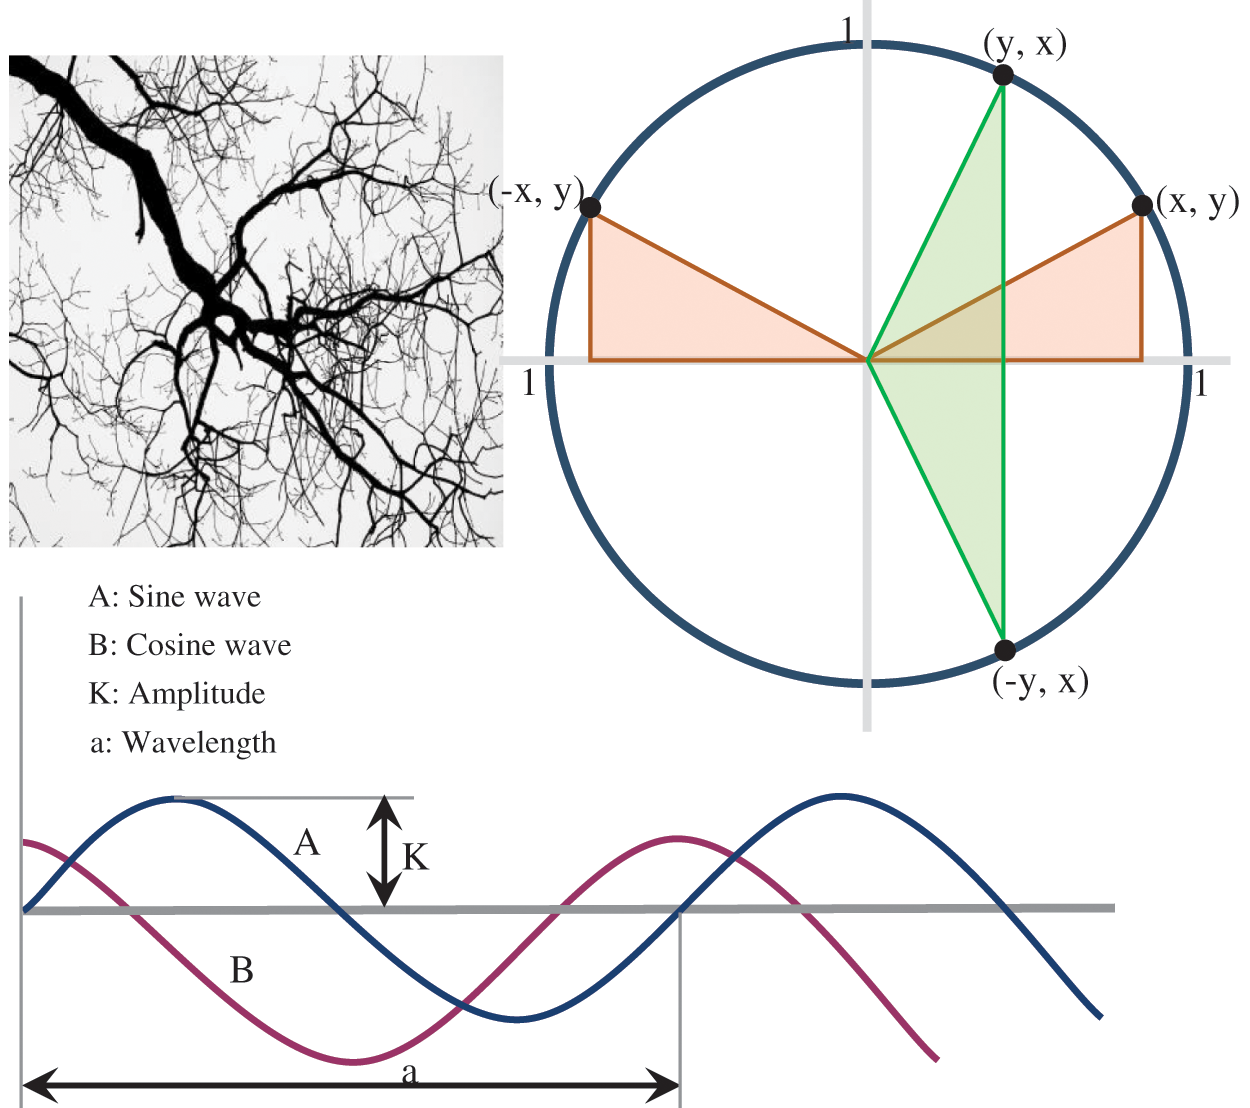
Figure 3: Proposed SCSFS optimization technique using the SCA algorithm based on SFS method
The dataset, performance metrics, results and statistical analysis are explained in detail in this section. In addition to feature selection and standardization, the hematological dataset is divided into two parts: training data (which accounts for 80 percent of the dataset) and testing data (20 percent of the dataset). The contrast between the original hemoglobin value and the predicted hemoglobin value is presented in Fig. 4 to show the effectiveness of the presented SCSFS based model.
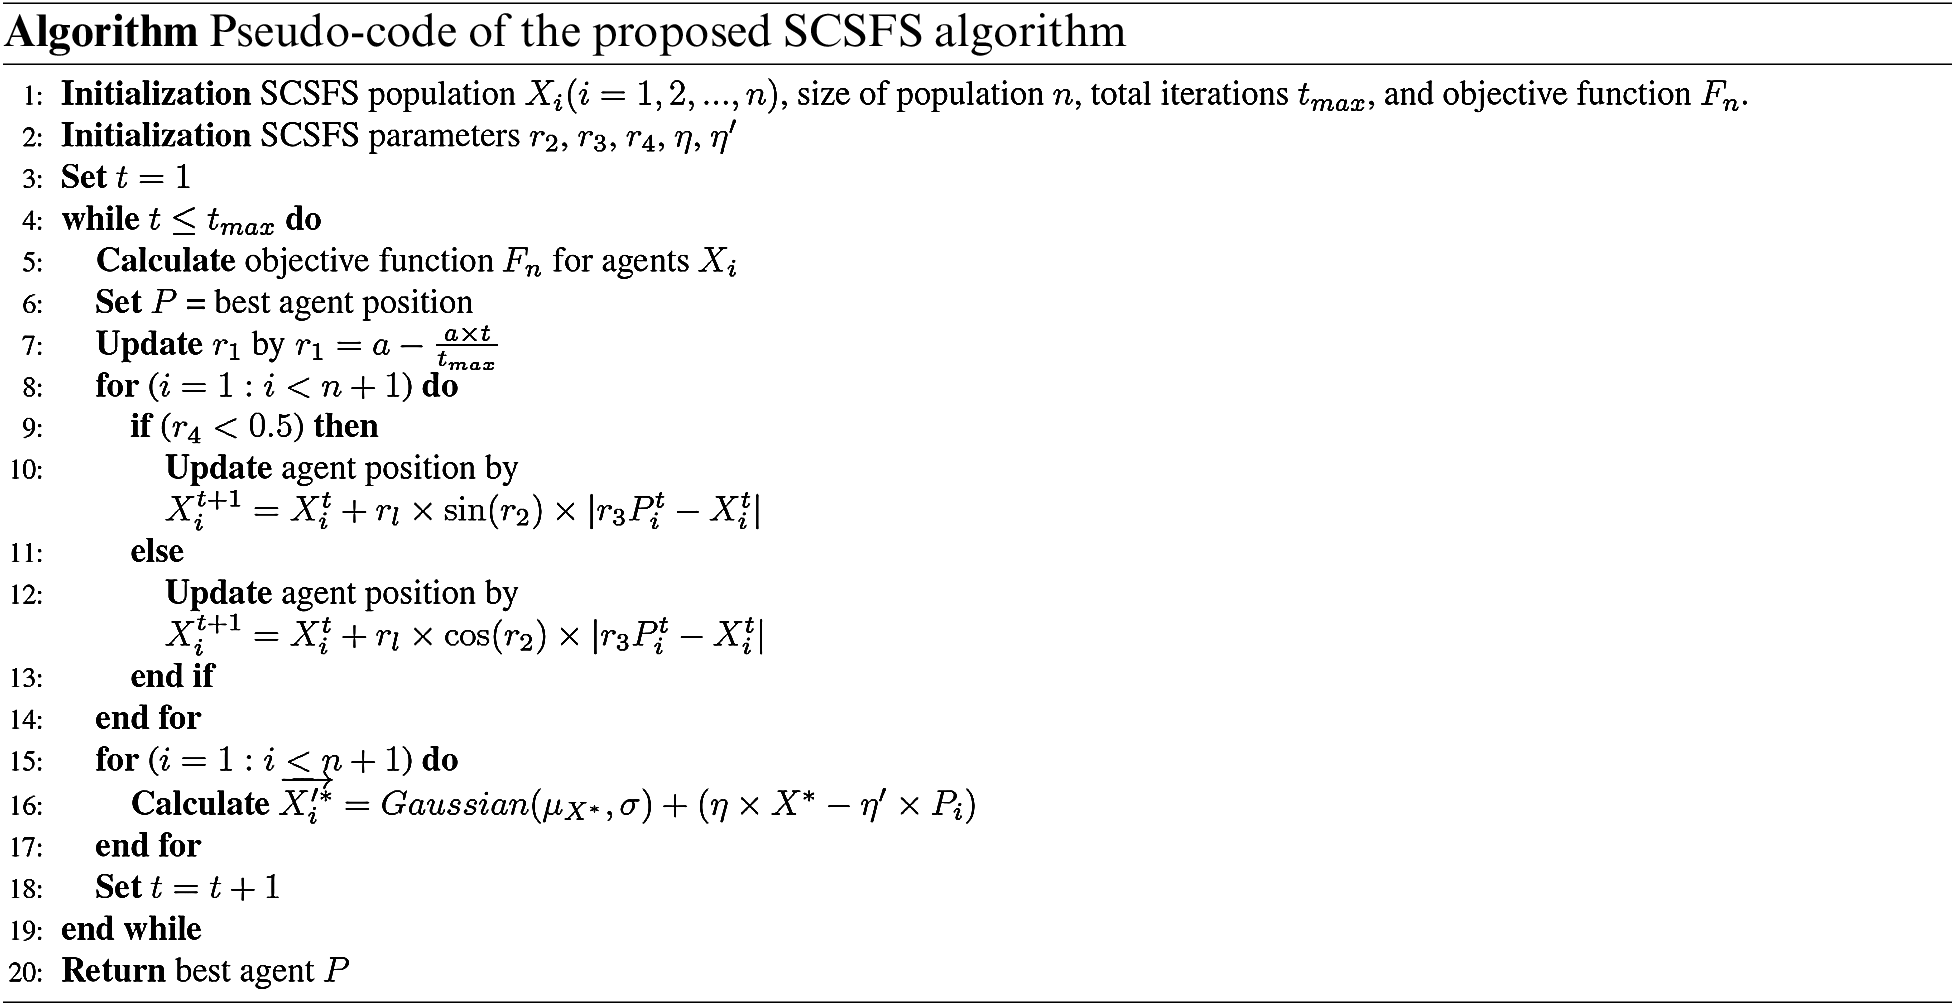
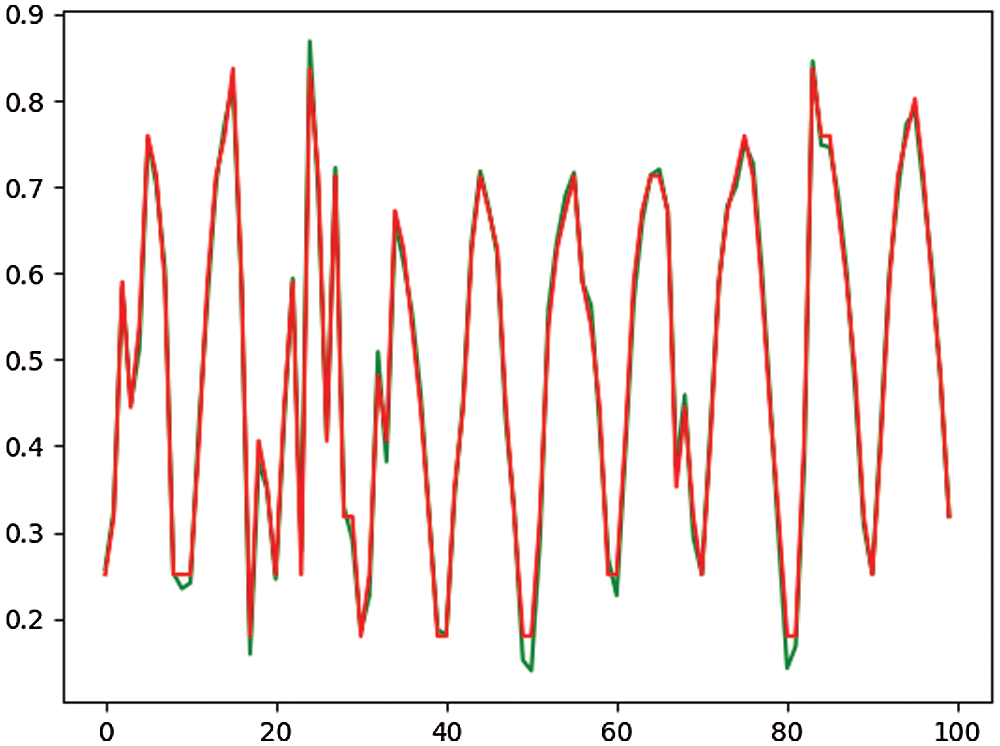
Figure 4: Sample of the original value (green color) to the predicted value (red color) based on the SCSFS algorithm
Using the Mindray BC-5300 Auto Hematology Analyzer [25], which delivers consistent and almost accurate five-part hematology findings from as little as 20 uL of blood, the researchers gathered the information as represented in Tab. 1. This analyzer stores more than 200 hematological parameters for each blood test to make it a potent tool. Some of these values, such as RBC, WBC, and PLT, are computed automatically by the analyzer. Other parameters, such as gender and age, are entered manually by the operator into the system.
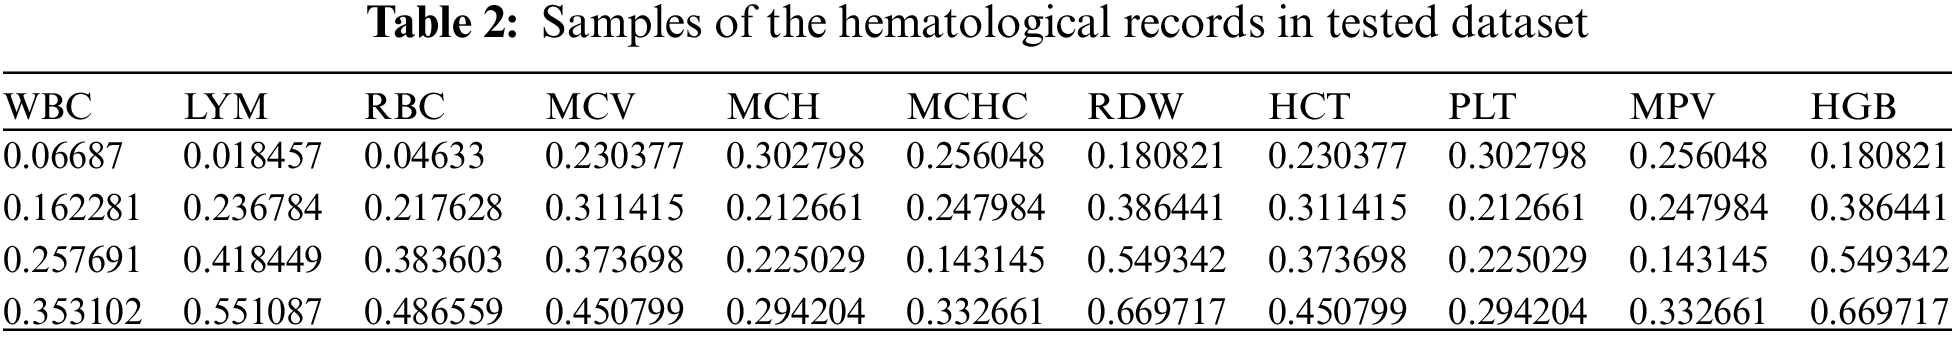
The following parameters that make up the hematological dataset are CBC, WBC, Lymphocytes (LYM), RBC, MCV, Mean Cellular Hemoglobin (MCH), Mean Cellular Hemoglobin Concentration (MCHC), Red Blood Cell Distribution Width (RDW), Hematocrit, Platelet Count (PLT), Mean Platelet Volume (MPV), Hematocrit (HCT), Platelet Count (PLT), Mean Platelet Volume (MPV) and Hemoglobin (HGB) [18,26]. These factors assist in doing data mining operations on hematological data. Example records from the design dataset are shown in the first row of Tab. 2.
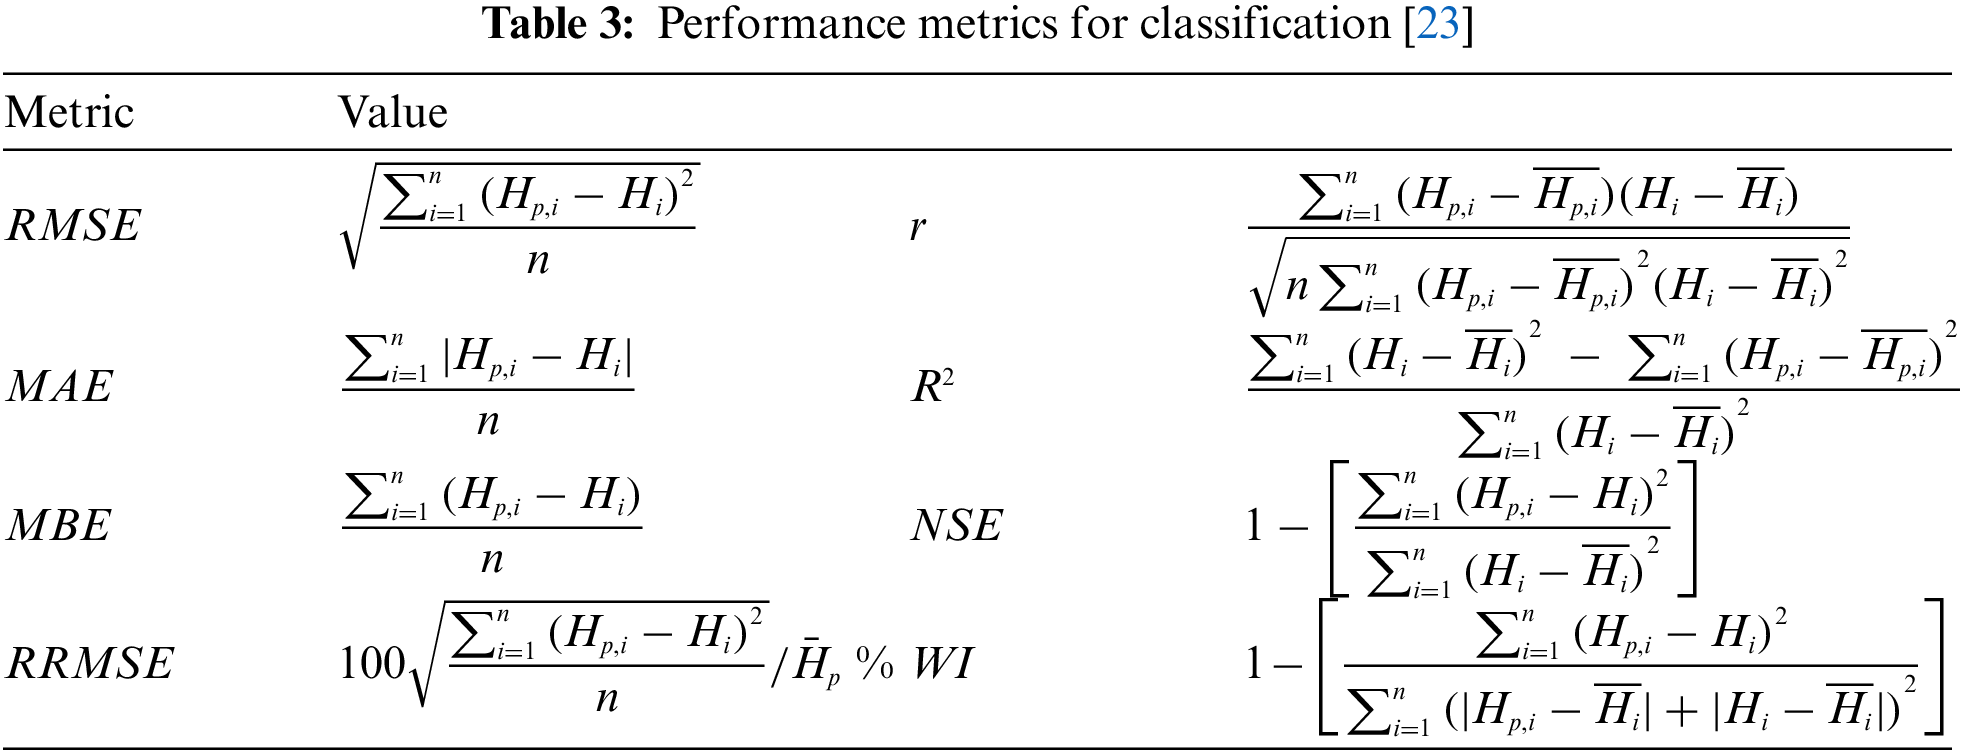
The performance metrics used to evaluate the proposed algorithm based on the tested dataset are Root Mean Squared Error (RMSE), Mean Absolute Error (MAE), Mean Bias Error (MBE), r, determination coefficient (
The experiment shows the results of the base, ensemble, and proposed model as presented in Tabs. 4 and 5. Tab. 4 shows the results of the base model, while Tab. 5 shows the results of the ensemble model using the proposed SCSFS and other ensemble models. The results, based on base models of Decision Tree, MLP, SVR, and Random Forest Regressors, in addition to the average ensemble and the ensemble model based on MLP regressor, then all these results are compared with a weighted average ensemble model using the SCSFS algorithm to show the performance of the proposed model. The results show the performance of the proposed model with RMSE of (0.009042361), MAE of (0.000828369), MBE of (−0.003330259), r of (0.999876369),
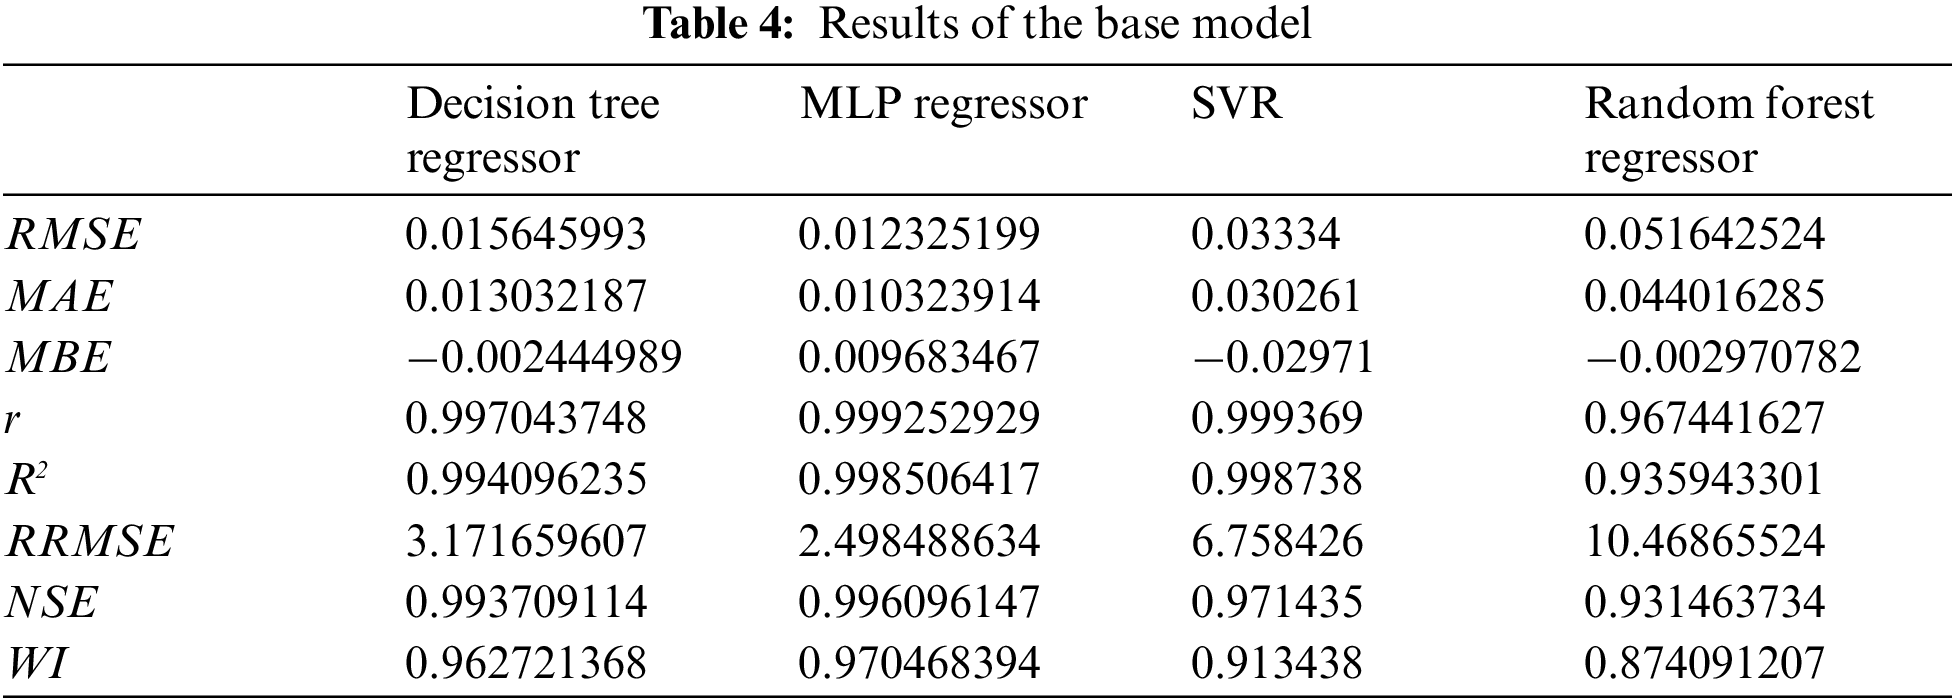
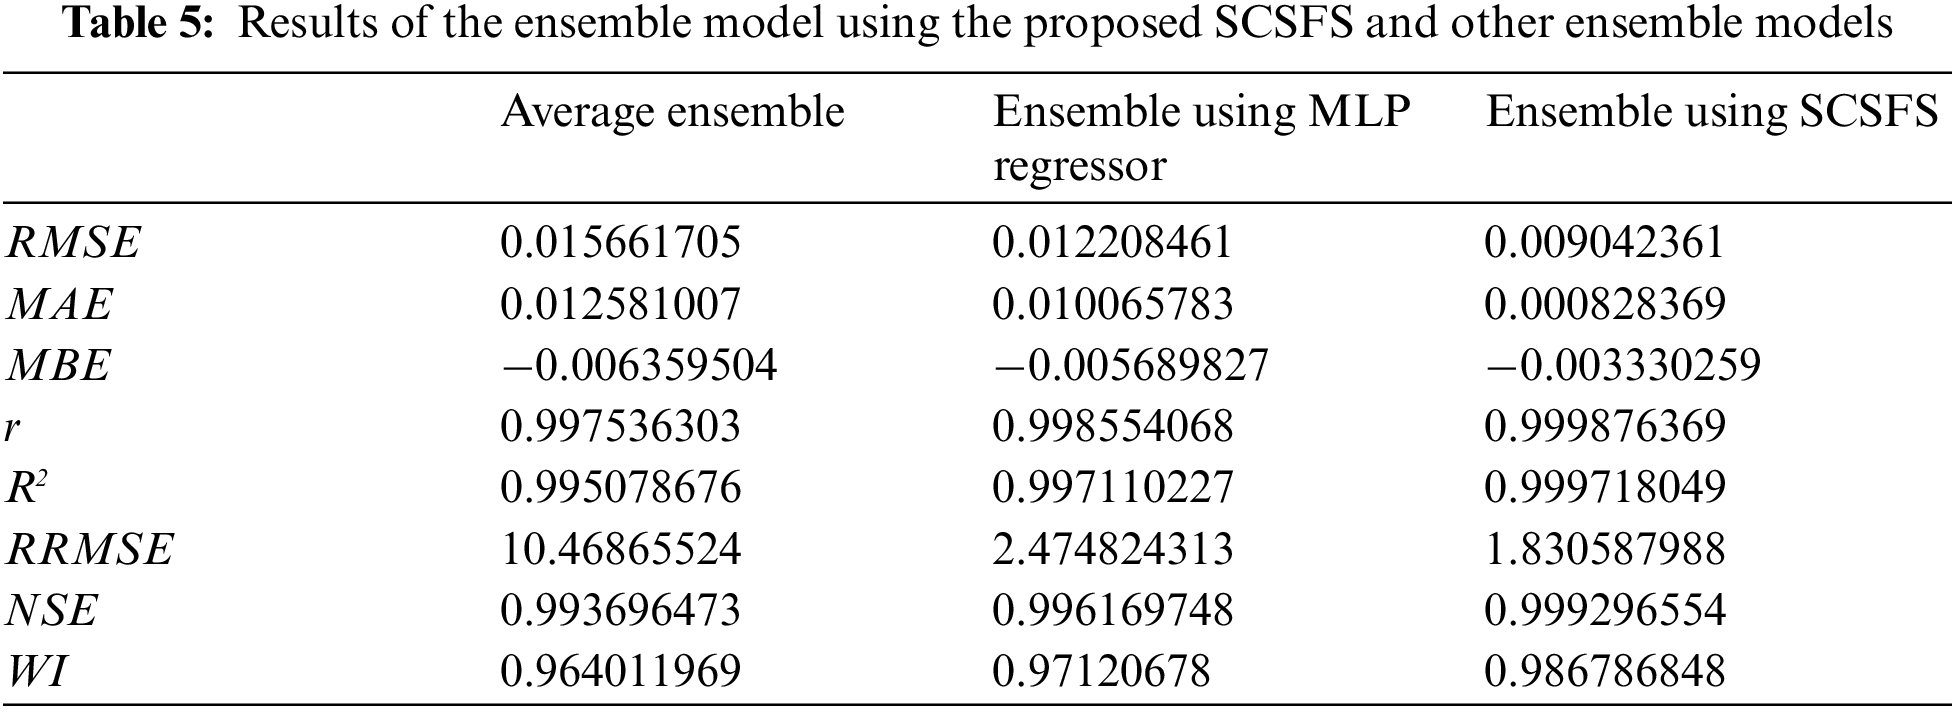
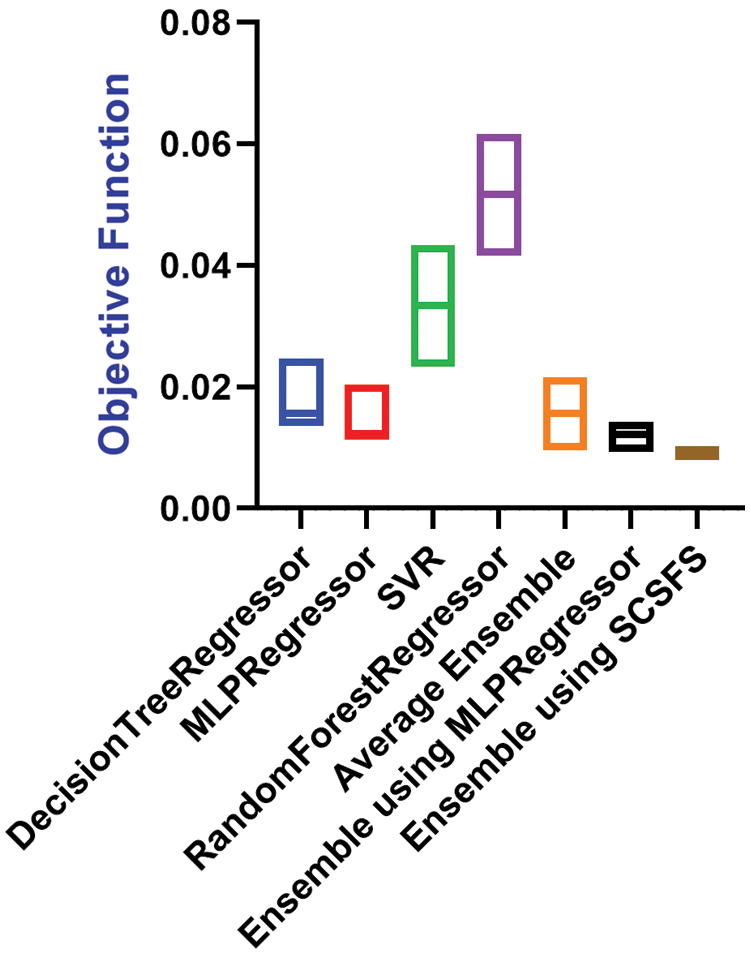
Figure 5: RMSE box plot graph for the presented and compared models vs. the objective function
The SCSFS based ensemble model exhibits superior performance in histogram and receiver operating characteristic (ROC) curves, confirming the suggested model's superiority for the studied issue as shown in Fig. 6. Fig. 6a shows the ROC curve of the presented ensemble model using SCSFS vs. ensemble model using MLP regressor, Fig. 6b shows the ROC curve of the presented ensemble model using SCSFS vs. average ensemble model. Fig. 6c presents the histogram of RMSE, with bin center range of (0.008, 0,034 and 0,060) against number of values, for the presented and compared to other ensemble and single models. The ROC analysis is performed on a ranking standard and continuous diagnostic test data. The derived accuracy indices, especially the area under the curve (AUC), provide a meaningful knowledge of best regression. As shown in Fig. 6, the suggested algorithm's AUC value is much greater than that of previous methods, approaching one. The QQ plot also shows that the proposed algorithm's actual and predicted values are almost fit as represented in Fig. 7. Fig. 7a shows the residual plot, Fig. 7b represent the homoscedasticity plot and Fig. 7c indicates the QQ plot. The heat map for the presented ensemble model using SCSFS algorithm vs. other single and ensemble models is shown in Fig. 7d.
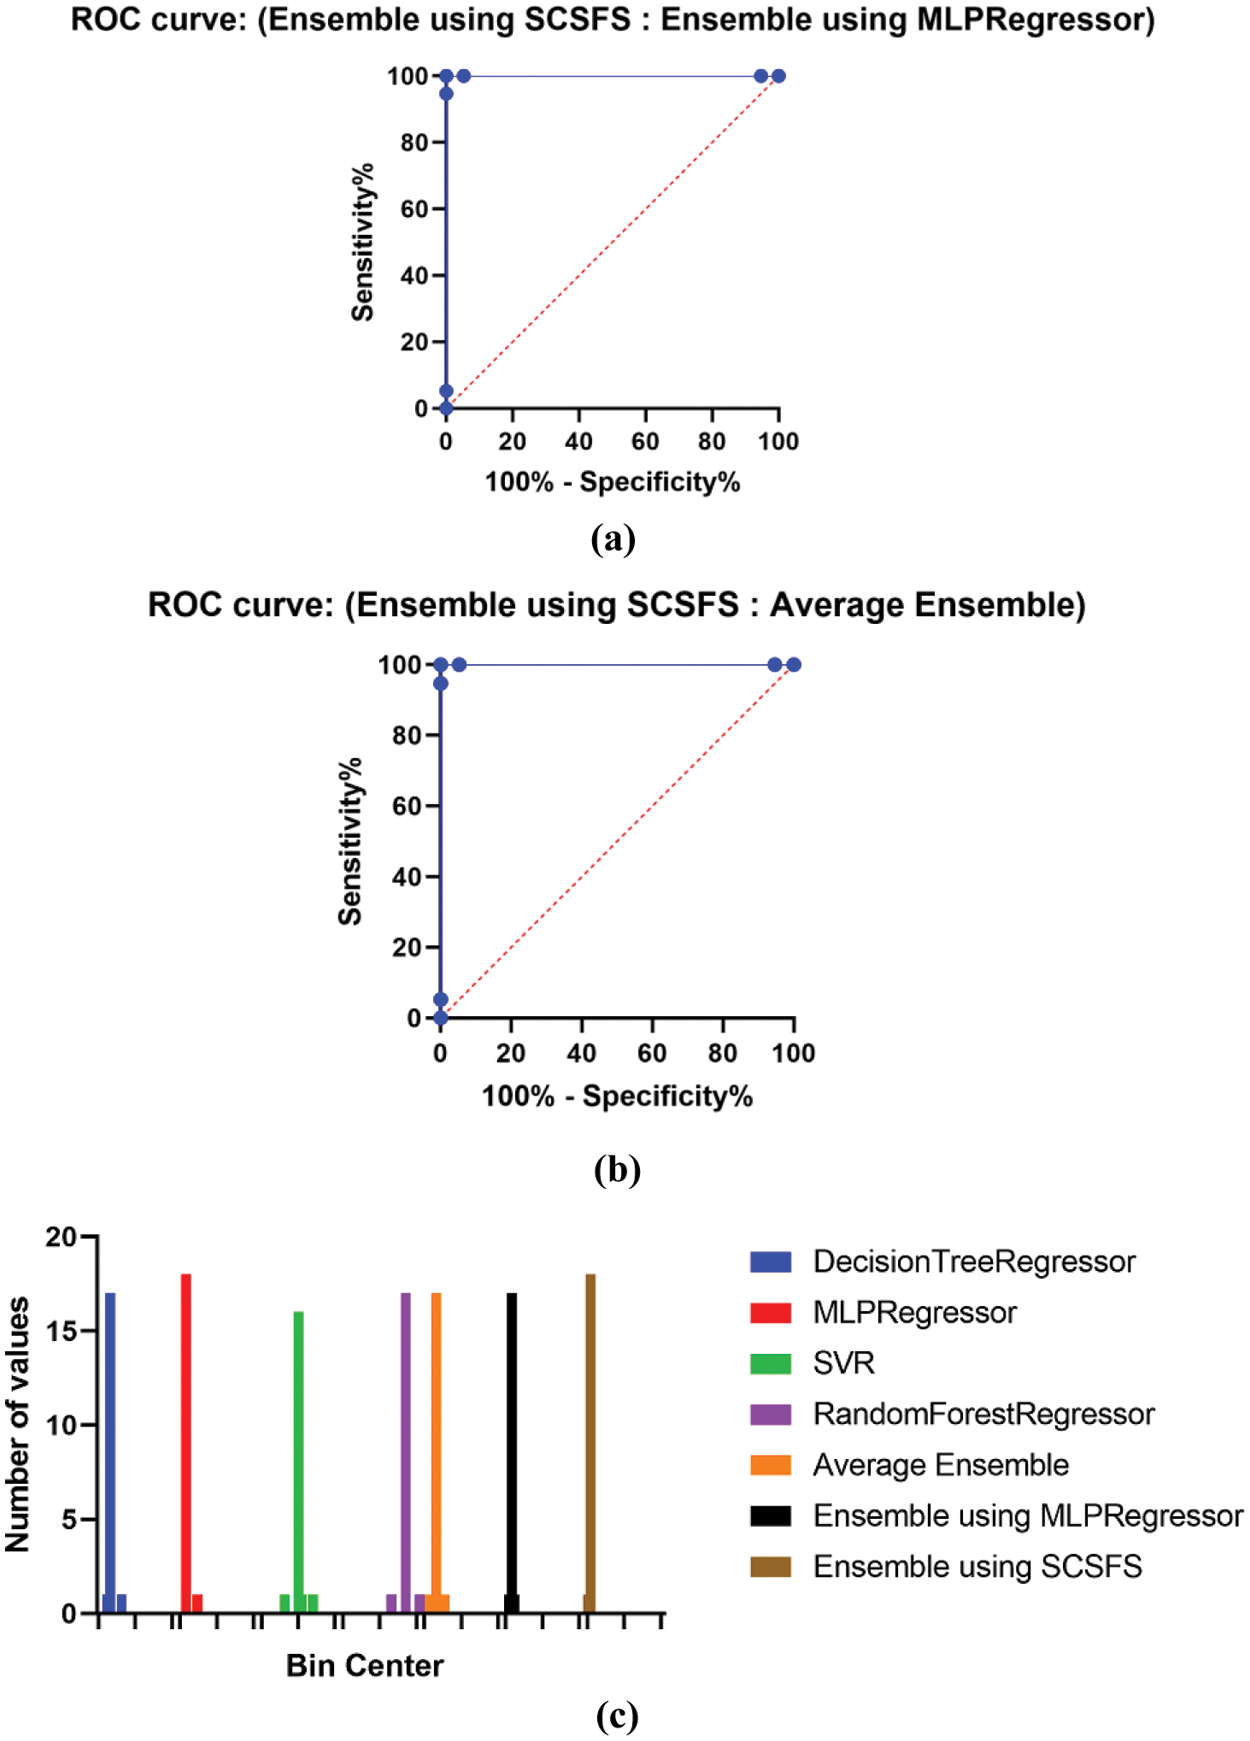
Figure 6: (a) ROC curve of the presented ensemble model using SCSFS vs. ensemble model using MLP regressor, (b) ROC curve of the presented ensemble model using SCSFS vs. average ensemble model and (c) Histogram of RMSE, with bin center range of (0.008, 0,034 and 0,060) against number of values, for the presented and compared to other ensemble and single models
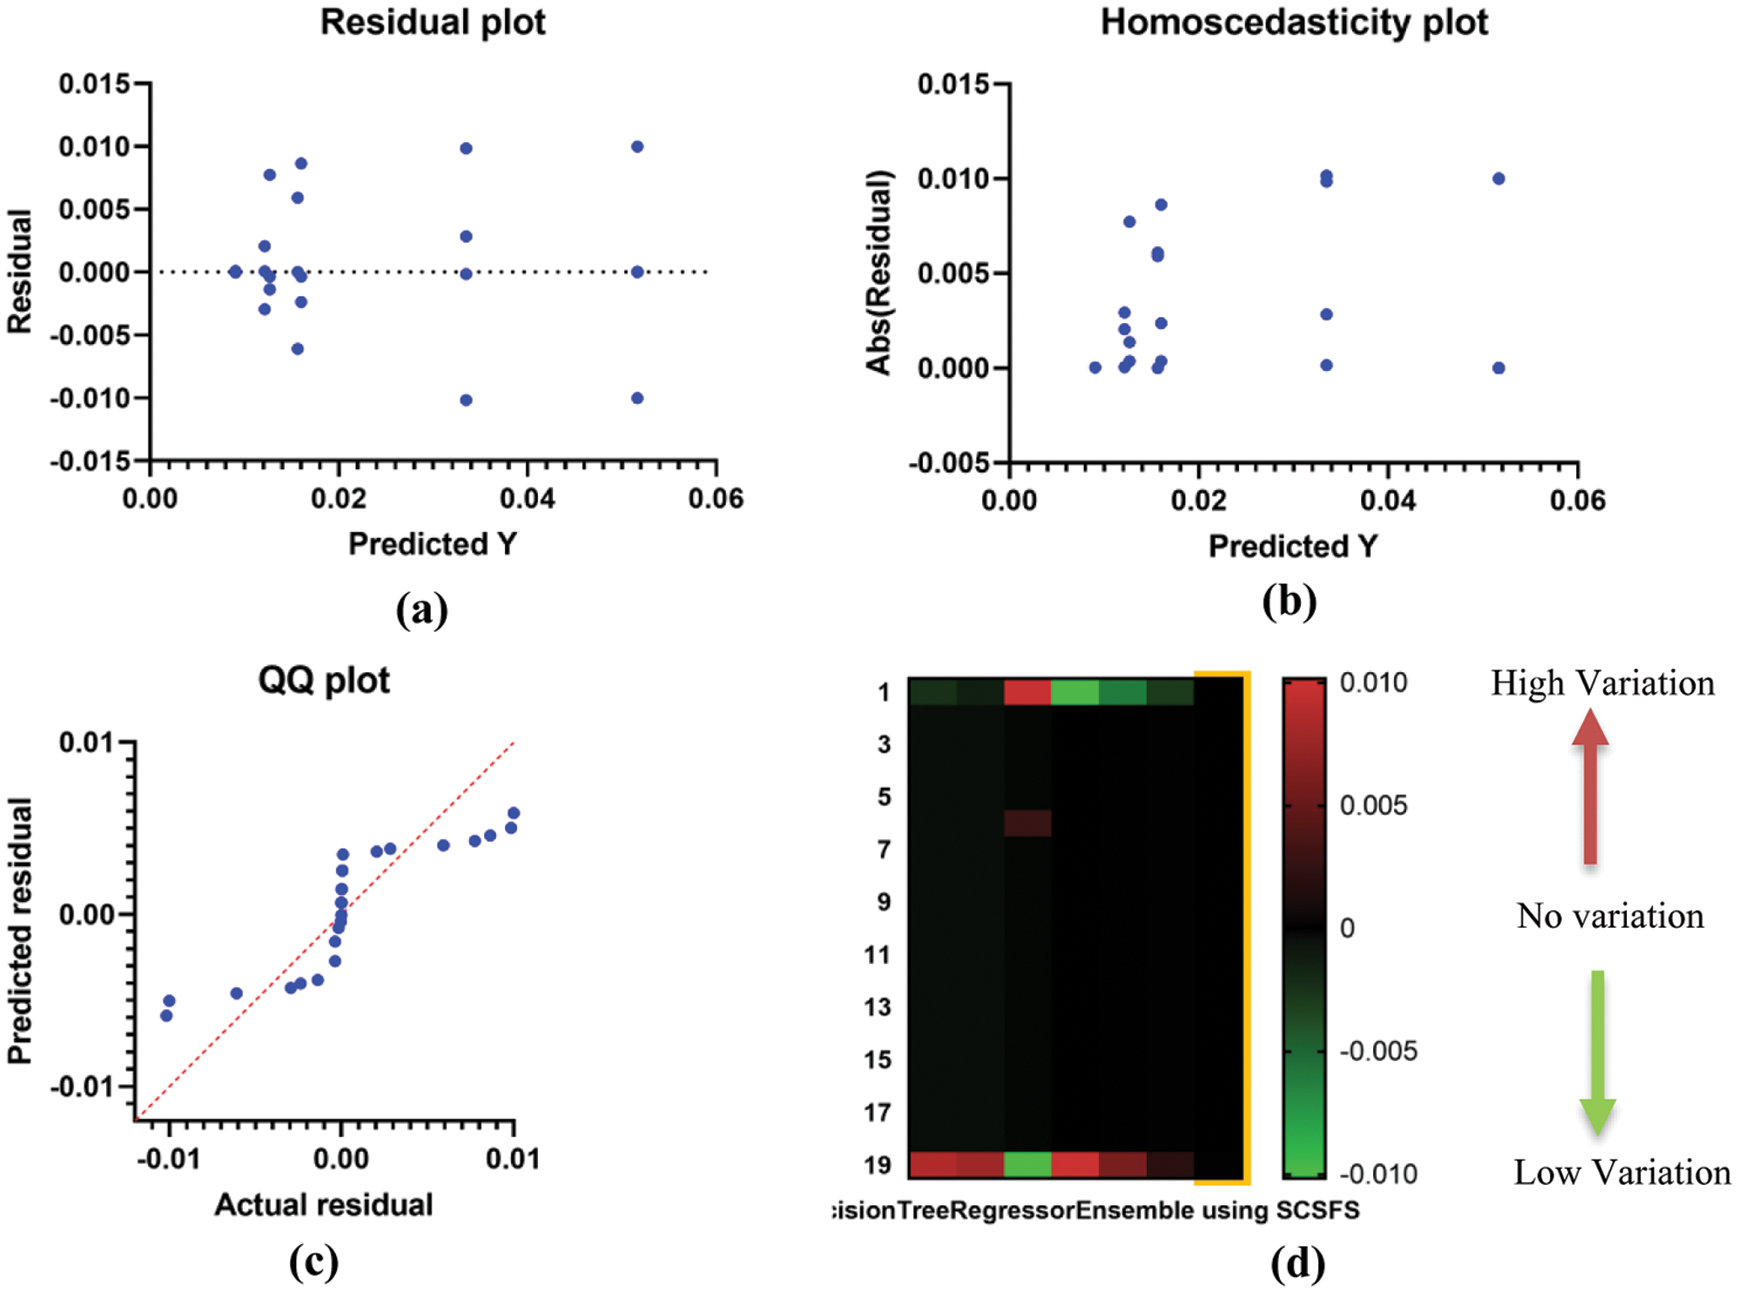
Figure 7: (a) Residual plot, (b) Homoscedasticity plot, (c) QQ plot and (d) Heat map for the presented ensemble model using SCSFS algorithm vs. other single and ensemble models
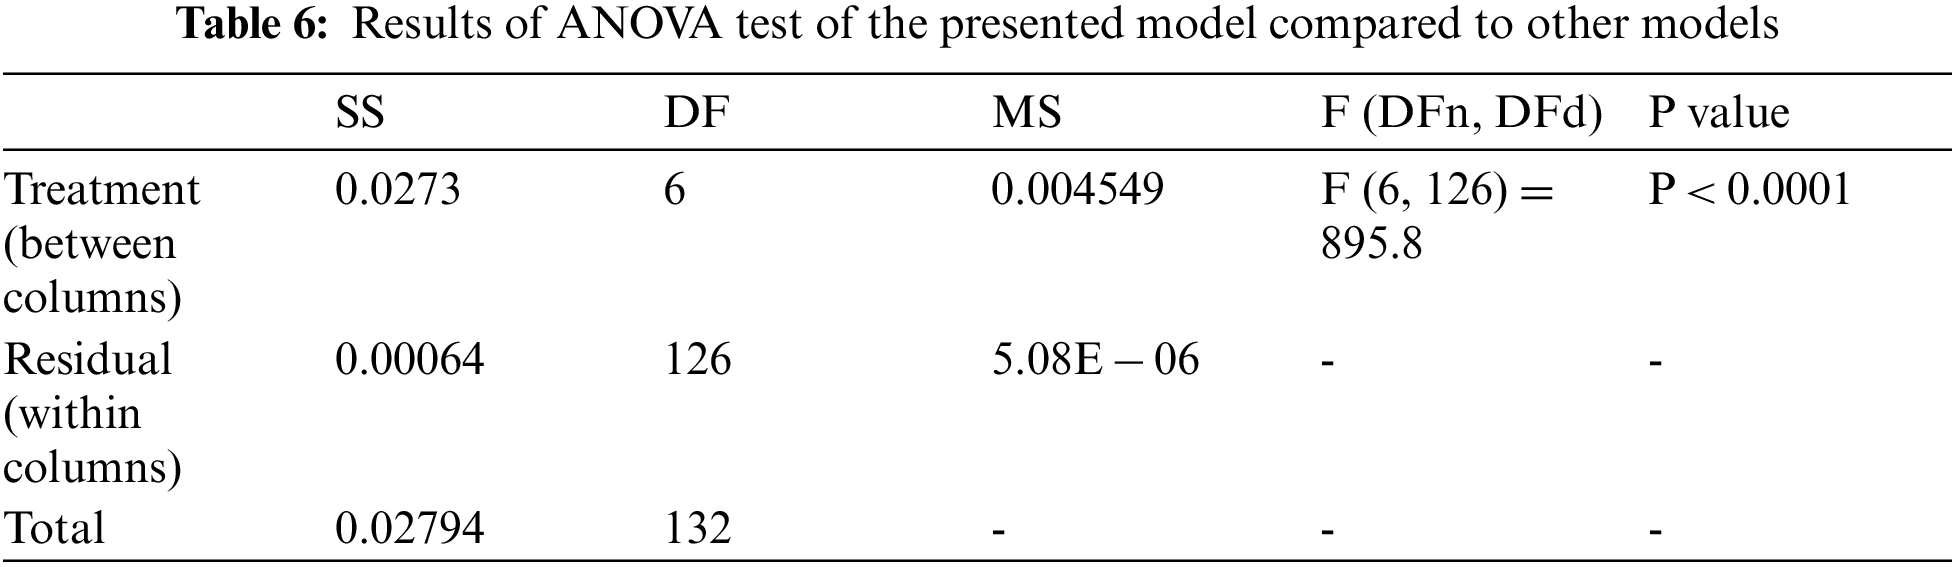
The ANOVA and t-test statistical methodologies are used to compare the populations to establish a significant difference between the suggested and compared technologies. The results of the two-way ANOVA test are shown in Tab. 6. The statistical hypothesizes for ANOVA are stated as follows:
• The null hypothesis (H0) states that there is no statistically significant difference between the groups.
• The alternative hypothesis (H1) states a statistically significant difference between the means of two populations, which is the distinction.
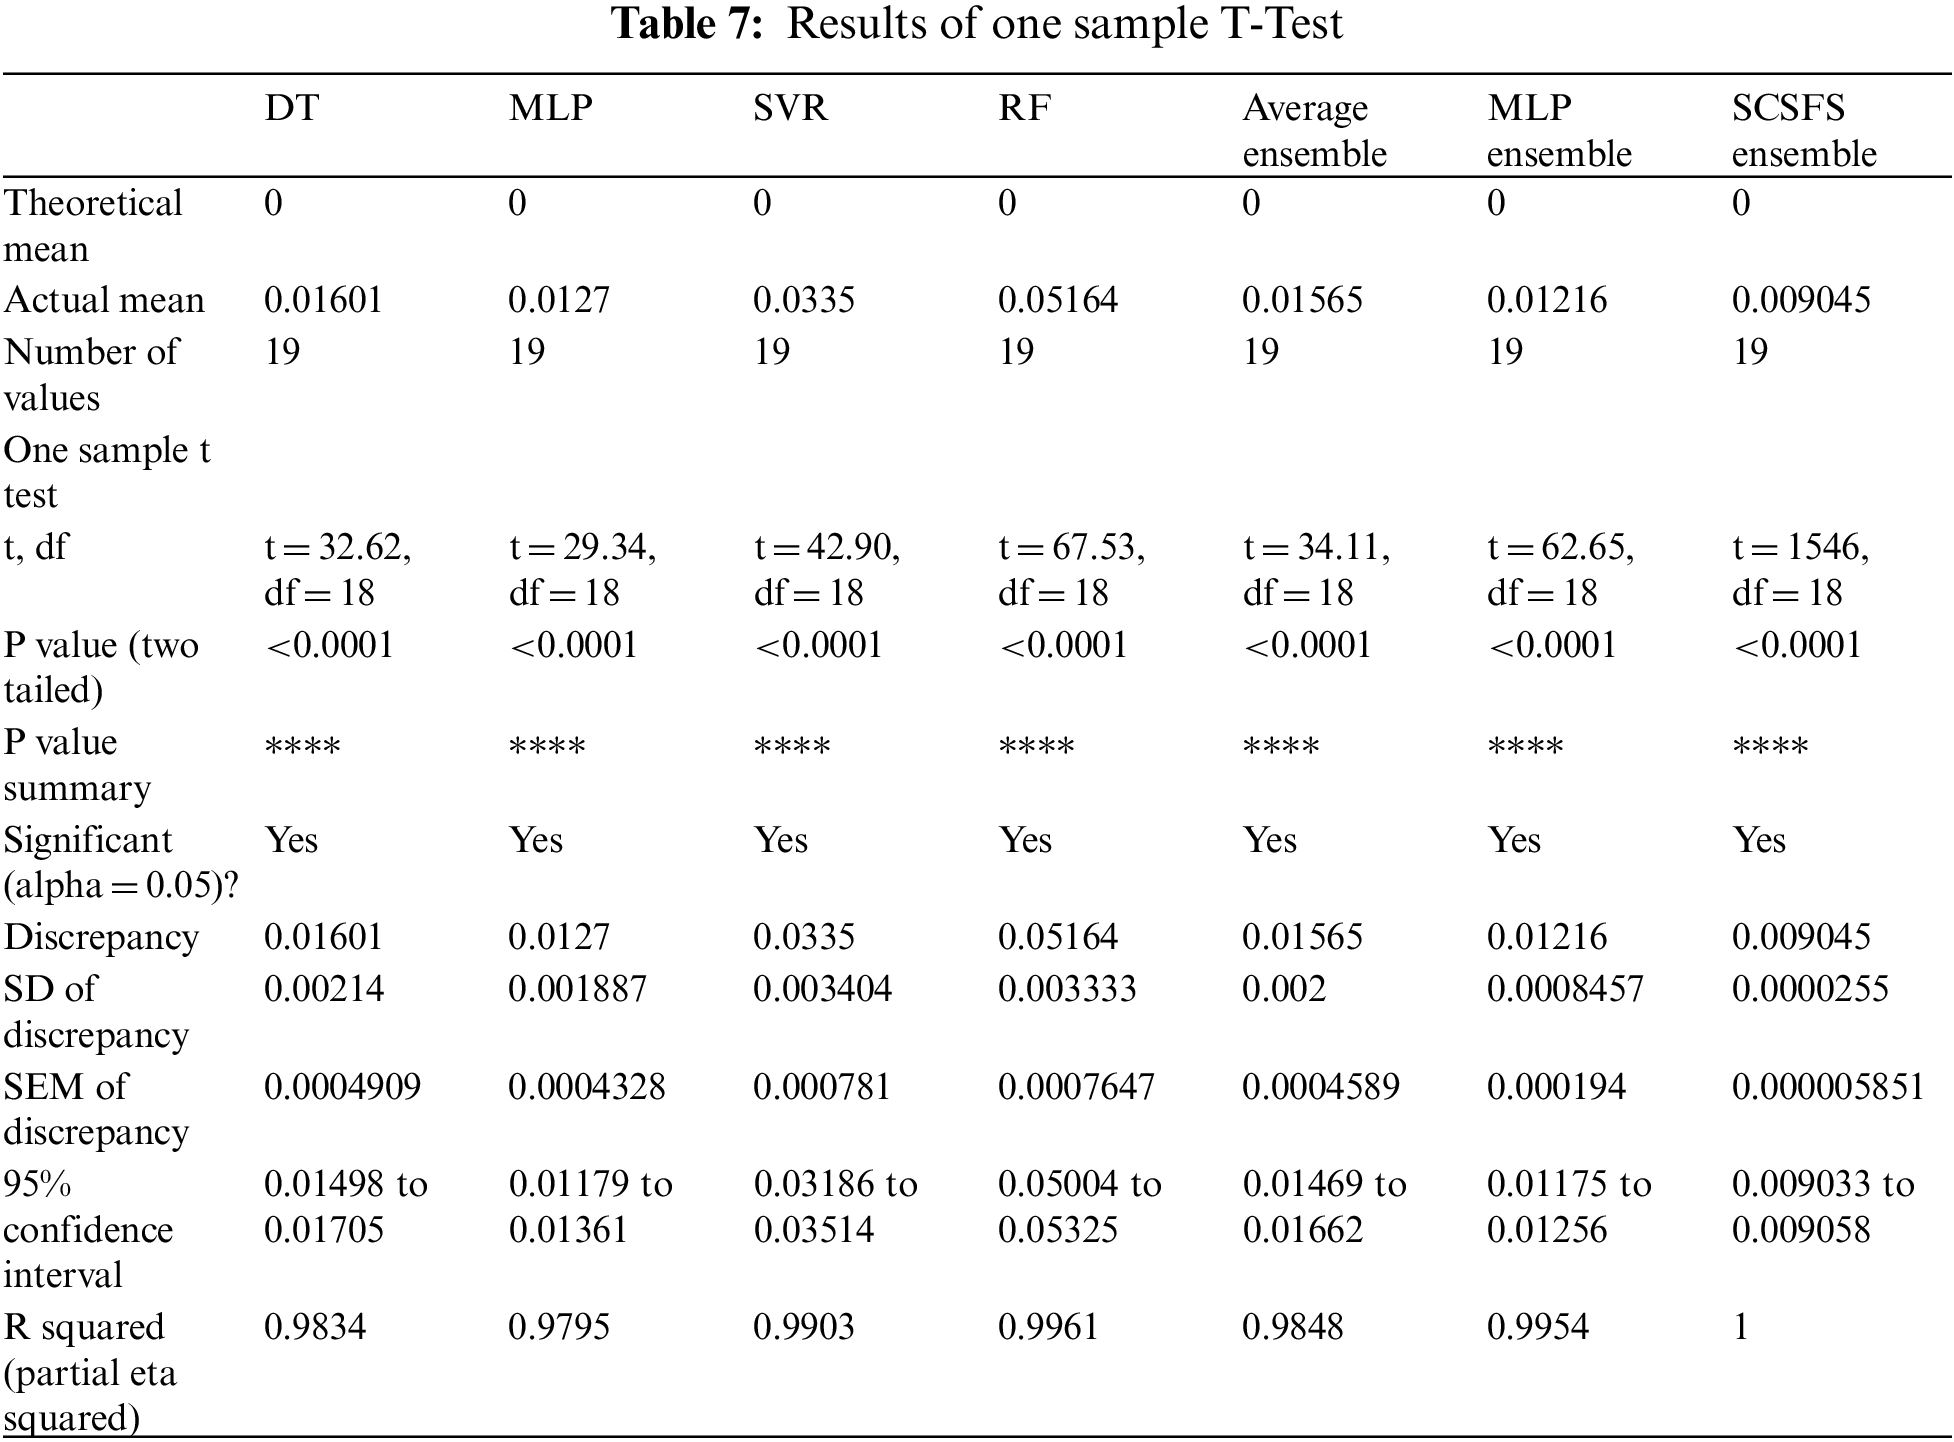
For the one-sample t-test, as shown in Tab. 7, the statistical hypothesis may be expressed in the following manner:
• The null hypothesis (H0) states that there is no statistically significant difference between the two groups.
• Alternative hypothesis (H1): The differentiation is based on the significant difference between the two means of the population.
Ensemble weights are optimized through the proposed SCSFS Meta-Heuristic Optimization, based on the Sine Cosine Algorithm (SCA) and stochastic fractal search. The proposed SCSFS algorithm for estimating the value of Hemoglobin using hematological parameters, SCSFS ensemble, is compared to three model-based approaches and the average ensemble model. The SCSFS algorithm performed a comparison and statistical study of the ROC curve and the T-Test to determine the superiority and stability of the anticipated outcomes to validate the processes’ correctness.
Acknowledgement: We deeply acknowledge Taif University for supporting this study through Taif University Researchers Supporting Project Number (TURSP-2020/150), Taif University, Taif, Saudi Arabia.
Funding Statement: Funding for this study is received from Taif University Researchers Supporting Project No. (Project No. TURSP-2020/150), Taif University, Taif, Saudi Arabia.
Conflicts of Interest: The authors declare that they have no conflicts of interest to report regarding the present study.
1. A. N. Schechter, “Hemoglobin research and the origins of molecular medicine,” Blood, vol. 112, no. 10, pp. 3927–3938, 2008. [Google Scholar]
2. S. N. Thakur, “Photoacoustic spectroscopy: Applications in security and biology,” Molecular and Laser Spectroscopy, vol. 2018, pp. 283–316, 2018. [Google Scholar]
3. V. Dhinakaran, K. Vigneswari, M. Lavanya and M. V. Shree, “Chapter ten-point-of-care applications with graphene in human life,” Comprehensive Analytical Chemistry, vol. 91, pp. 235–262, 2020. [Google Scholar]
4. R. Ouellette and J. D. Rawn, “Amino acids, peptides, and proteins,” in Organic Chemistry, 2nd ed., Elsevier Academic Press, pp. 929–971, 2018. [Google Scholar]
5. E. -S. M. El-Kenawy, A. Ibrahim, S. Mirjalili, M. M. Eid and S. E. Hussein, “Novel feature selection and voting classifier algorithms for COVID-19 classification in CT images,” IEEE Access, vol. 8, no. 1, pp. 179317–179335, 2020. [Google Scholar]
6. A. Ibrahim, S. Mohammed, H. A. Ali and S. E. Hussein, “Breast cancer segmentation from thermal images based on chaotic salp swarm algorithm,” IEEE Access, vol. 8, no. 1, pp. 122121–122134, 2020. [Google Scholar]
7. A. Ibrahim, H. A. Ali, M. M. Eid and E. -S. M. El-Kenawy, “Chaotic harris hawks optimization for unconstrained function optimization,” in 2020 16th Int. Computer Engineering Conf. (ICENCO), Cairo, Egypt, IEEE, pp. 153–158, 2020. [Google Scholar]
8. A. Bhatt and A. Silberfarb, “Chapter 17-Ionospheric science in the age of big data,” in The Dynamical Ionosphere: A Systems Approach to Ionospheric Irregularity, Elsevier Academic Press, pp. 257–276, 2020. [Google Scholar]
9. E. -S. M. El-Kenawy, S. Mirjalili, A. Ibrahim, M. Alrahmawy, M. El-Said et al., “Advanced meta-heuristics, convolutional neural networks, and feature selectors for efficient COVID-19 x-ray chest image classification,” IEEE Access, vol. 9, pp. 36019–36037, 2021. [Google Scholar]
10. A. Ibrahim, S. Mirjalili, M. El-Said, S. S. M. Ghoneim, M. Al-Harthi et al., “Wind speed ensemble forecasting based on deep learning using adaptive dynamic optimization algorithm,” IEEE Access, vol. 9, pp. 125787–125804, 2021. [Google Scholar]
11. S. S. M. Ghoneim, T. A. Farrag, A. A. Rashed, E. -S. M. El-Kenawy and A. Ibrahim, “Adaptive dynamic meta-heuristics for feature selection and classification in diagnostic accuracy of transformer faults,” IEEE Access, vol. 9, pp. 78324–78340, 2021. [Google Scholar]
12. A. Ibrahim, M. Noshy, H. A. Ali and M. Badawy, “PAPSO: A poweraware VM placement technique based on particle swarm optimization,” IEEE Access, vol. 8, no. 1, pp. 81747–81764, 2020. [Google Scholar]
13. A. Ibrahim, A. Ahmed, S. Hussein and A. E. Hassanien, “Fish image segmentation using salp swarm algorithm,” in Proc. Int. Conf. on Advanced Machine Learning Technologies and Applications (AMLTA2018Advances in Intelligent Systems and Computing, vol. 723. Cham, Springer, 2018. [Google Scholar]
14. M. M. Fouad, A. I. El-Desouky, R. Al-Hajj and E. -S. M. El-Kenawy, “Dynamic group-based cooperative optimization algorithm,” IEEE Access, vol. 8, pp. 148378–148403, 2020. [Google Scholar]
15. E. -S. M. El-Kenawy and M. Eid, “Hybrid gray wolf and particle swarm optimization for feature selection,” International Journal of Innovative Computing, Information and Control, vol. 16, no. 3, pp. 831–844, 2020. [Google Scholar]
16. A. Ibrahim, A. Tharwat, T. Gaber and A. E. Hassanien, “Optimized superpixel and adaboost classifier for human thermal face recognition,” Signal, Image and Video Processing, vol. 12, pp. 711–719, 2018. [Google Scholar]
17. E. M. Hassib, A. I. El-Desouky, L. M. Labib and E. -S. M. T. El-Kenawy, “Woa + brnn: An imbalanced big data classification framework using whale optimization and deep neural network,” Soft Computing, vol. 24, no. 8, pp. 5573–5592, 2020. [Google Scholar]
18. E. -S. M. El-Kenawy, “A machine learning model for hemoglobin estimation and anemia classification,” International Journal of Computer Science and Information Security (IJCSIS), vol. 17, no. 2, pp. 100–108, 2019. [Google Scholar]
19. H. R. Hussien, E. -S. M. El-Kenawy and A. I. El-Desouky, “EEG channel selection using a modified grey wolf optimizer,” EJECE, European Journal of Electrical Engineering and Computer Science, vol. 5, no. 1, pp. 17–24, 2021. [Google Scholar]
20. H. Liu, F. Peng, M. Hu, J. Shi, G. Wang et al., “Development and validation of a photoplethysmography system for noninvasive monitoring of hemoglobin concentration,” Journal of Electrical and Computer Engineering, vol. 2020, pp. 1–9, 2020. [Google Scholar]
21. R. J. Urbanowicz, M. Meeker, W. L. Cava, R. S. Olson and J. H. Moore, “Relief-based feature selection: Introduction and review,” Journal of Biomedical Informatics, vol. 85, pp. 189–203 2018. [Google Scholar]
22. A. S. Adewoyin and B. Nwogoh, “Peripheral blood film---A review,” Annals of Ibadan Postgraduate Medicine, vol. 12, no. 2, pp. 71–79, 2014. [Google Scholar]
23. E. -S. M. El-Kenawy, S. Mirjalili, S. S. M. Ghoneim, M. M. Eid, M. El-Said et al., “Advanced ensemble model for solar radiation forecasting using sine cosine algorithm and newton's laws,” IEEE Access, vol. 9, pp. 115750–115765, 2021. [Google Scholar]
24. E. -S. M. El-Kenawy, M. M. Eid, M. Saber and A. Ibrahim, “MbGWO-SFS: Modified binary grey wolf optimizer based on stochastic fractal search for feature selection,” IEEE Access, vol. 8, no. 1, pp. 107635–107649, 2020. [Google Scholar]
25. Shenzhen Mindray Bio-Medical Electronics Co., Ltd., BC-5300 Auto Hematology Analyzer. 2022 [Online]. Available: https://www.mindray.com/en/product/BC-5300.html. Accessed: 2021-10-11. [Google Scholar]
26. M. M. Eid, E. -S. M. El-Kenawy and A. Ibrahim, “Anemia estimation for Covid-19 patients using a machine learning model,” Journal of Computer Science and Information Systems, vol. 17, no. 11, pp. 1–7, 2021. [Google Scholar]
 | This work is licensed under a Creative Commons Attribution 4.0 International License, which permits unrestricted use, distribution, and reproduction in any medium, provided the original work is properly cited. |