DOI:10.32604/cmc.2022.026041
| Computers, Materials & Continua DOI:10.32604/cmc.2022.026041 | |
| Article |
An Eco-Friendly Approach for Reducing Carbon Emissions in Cloud Data Centers
1Department of Computer Science, College of Arts and Science, Prince Sattam bin Abdulaziz University, Al-Kharj,Saudi Arabia
2Department of Computer Engineering, College of Computer Science and Engineering, Taibah University, Madinah, Saudi Arabia
*Corresponding Author: Mohammad Aldossary. Email: mm.aldossary@psau.edu.sa
Received: 14 December 2021; Accepted: 11 February 2022
Abstract: Based on the Saudi Green initiative, which aims to improve the Kingdom's environmental status and reduce the carbon emission of more than 278 million tons by 2030 along with a promising plan to achieve net-zero carbon by 2060, NEOM city has been proposed to be the “Saudi hub” for green energy, since NEOM is estimated to generate up to 120 Gigawatts (GW) of renewable energy by 2030. Nevertheless, the Information and Communication Technology (ICT) sector is considered a key contributor to global energy consumption and carbon emissions. The data centers are estimated to consume about 13% of the overall global electricity demand by 2030. Thus, reducing the total carbon emissions of the ICT sector plays a vital factor in achieving the Saudi plan to minimize global carbon emissions. Therefore, this paper aims to propose an eco-friendly approach using a Mixed-Integer Linear Programming (MILP) model to reduce the carbon emissions associated with ICT infrastructure in Saudi Arabia. This approach considers the Saudi National Fiber Network (SNFN) as the backbone of Saudi Internet infrastructure. First, we compare two different scenarios of data center locations. The first scenario considers a traditional cloud data center located in Jeddah and Riyadh, whereas the second scenario considers NEOM as a potential cloud data center new location to take advantage of its green energy infrastructure. Then, we calculate the energy consumption and carbon emissions of cloud data centers and their associated energy costs. After that, we optimize the energy efficiency of different cloud data centers’ locations (in the SNFN) to reduce the associated carbon emissions and energy costs. Simulation results show that the proposed approach can save up to 94% of the carbon emissions and 62% of the energy cost compared to the current cloud physical topology. These savings are achieved due to the shifting of cloud data centers from cities that have conventional energy sources to a city that has rich in renewable energy sources. Finally, we design a heuristic algorithm to verify the proposed approach, and it gives equivalent results to the MILP model.
Keywords: Cloud computing; carbon emissions; energy efficiency; energy consumption; energy costs; eco-friendly data center
Green information and communication technology (ICT) is achieving more popularity in recent years due to the fact of global warming and climate change, which act as serious challenges for environmental sustainability. In Saudi Arabia, the total emissions generated by electricity increased from 58.2 million tons (mt) in 1971 to 588.8 mt in 2020, which accounts for 1.45% of the global emitted carbon. Also, the total emissions generated by Saudi Arabia electricity are growing at an average annual rate of more than 5% [1]. At this increasing rate, the total emission of Saudi Arabia is expected to exceed 1 billion tons by 2030.
To slow down the increase of global carbon emissions, Saudi Arabia is planning to increase its renewable energy generating capacity from 58 Gigawatts (GW) to 120 GW in 2030, by developing solar and hydrogen energy generation, which will be based mainly in NEOM city [2]. Also, Saudi Arabia has a plan to lower its carbon emissions by 278 mt in 2030 and aim to achieve net-zero carbon by 2060 [1]. Furthermore, reducing the energy consumption of data centers is a major concern for both academics and industry [3]. The ICT sector is considered a key contributor to global energy consumption and carbon emissions. For example, the data centers account for increasing the energy demand, which is estimated to consume about 13% of the overall global electricity demand by 2030 [4]. Thus, reducing the total energy consumption of the data centers plays a vital factor in achieving the Saudi plan to minimize global carbon emissions.
Currently, large-scale local data centers, established by Oracle [5], Saudi Telecom Company [6], and Mobily [7] are located in Jeddah and Riyadh, and these data centers are powered by crude oil and other fossil fuels [8]. Therefore, using renewable energy has different costs compared to oil and fossil fuels. For example, electricity cost from solar renewable energy has reached $0.068 per kilowatt-hour (kWh) in 2019 [9], whereas the cost of fossil fuel has reached $0.18/kWh [10]. In addition, the carbon intensity varies depending on what kind of energy sources are used (e.g., fossil fuels, crude oil, or solar). Thus, it is clear that there is a need to reduce data centers’ carbon emissions and energy costs through an efficient system [11].
In this regard, a wide range of works has focused on optimizing data centers in terms of reducing energy consumption, energy cost along with their environmental impacts [12–15]. For example, the associations of energy balancing to avoid carbon emissions across data centers were discussed in [15]. In addition, a carbon-aware approach is investigated in [12,16] to manage the energy consumption of data centers in a cost-effective manner, using renewable energy. Likewise, the authors in [17] have presented a carbon-aware system, which aims to reduce electricity carbon emissions and energy costs of distributed data centers. However, these studies are mostly theoretical, using small-scale prototypes with particular applications and workloads.
In terms of economic and environmental impacts, the authors in [18] presented an optimal hybrid micro-grid model, using traditional and renewable energy sources. Based on their simulation results, they have achieved a significant reduction in energy costs and environmental impacts. Moreover, the authors in [19] have investigated how to achieve sustainable development by studying the impact of generating renewable energy on the economy and the environment. Similarly, they studied the use of ocean-based renewable energy for generating electrical power and analyzed the economic and environmental impacts of adopting their approach [20]. Their results have shown that the proposed approach is capable to generate the required energy in order to supply the energy demands. Also, their approach can significantly save costs in a long run compared to the conventional approaches.
In this paper, we propose an eco-friendly approach to control the carbon emissions associated with data centers, considering real infrastructure (the Saudi National Fiber Network (SNFN)) along with various applications. Furthermore, we optimize the energy efficiency of different cloud data centers’ locations (in the SNFN) intending to reduce carbon emissions and energy costs. Additionally, we compare NEOM (as a potential option to relocate all local data centers) with the current locations that host the data centers, which are mainly in Jeddah and Riyadh. The main contributions of this paper are summarized as follows:
• We present an eco-friendly approach that considers an end-to-end SNFN architecture, which includes the central cloud at one end, followed by the core network, the metro network, and the access network located in different cities. Also, we compare two different scenarios of data center locations. First, we analyze the traditional locations in Jeddah and Riyadh in terms of energy efficiency, carbon emissions, and energy costs. Second, we consider NEOM as a potential cloud data center new location to take advantage of its green energy infrastructure.
• We develop an optimization model that uses mixed-integer linear programming (MILP) to optimize the presented approach mathematically in order to study the energy efficiency and carbon emissions of the new proposed location (NEOM). Also, we formulate the total energy consumption, concerning the task splitting ratio (i.e., computation and communication resources). Moreover, we assess the energy cost function and investigate how to optimally place a wide range of ICT applications in a carbon-efficient location that uses renewable energy resources. Consequently, this would lead to lower electricity costs compared to locations that are only powered by crude oil and other fossil fuels sources.
• We design a heuristic approach that can mimic the behavior of MILP optimization. In particular, we extract insights from the MILP optimization and suggest design rules that the heuristics have to obey in order to minimize carbon emissions and energy costs in the cloud data centers while obeying the constraints and requirements.
• We evaluate the capability and efficiency of the proposed approach along with its models, using a simulation environment, and compare the outcomes to the current cloud physical topology.
The rest of this work is structured as follows [21]: Section 2 presents the eco-friendly approach for Saudi Cloud data centers. Section 3 introduces the mixed-integer linear programming (MILP) model for optimizing energy consumption, carbon emissions, and energy costs. Section 4 presents the design of the MILP model along with its parameters and variables. The discussion of the results is presented in Section 5. In Section 6, we propose the heuristic awareness of energy consumption, carbon emissions, and their related costs in the Saudi Cloud data canter's (HAECC-SCDC). Finally, Section 7 concludes the paper and discusses future work.
2 An Eco-Friendly Approach for Saudi Cloud Data Centers
2.1 Cloud Computing and Their Users
Cloud computing provides on-demand resources (e.g., processors, storage, networks, services, and applications) to several geographically distributed users. Due to the scalable nature of cloud computing, the number of resources can increase or decrease according to the demand of requests from users [22]. Usually, cloud users requested tasks/applications, which are placed into geo-distributed clouds [23], and these clouds have different networking energy consumption and cost based on the users’ locations. However, the large-scale adoption of cloud services mainly relies on minimizing the energy consumption and carbon emissions of their data centers [24]. Thus, optimizing the placement of applications over the cloud can help to minimize energy consumption, carbon emissions, and energy costs of the data centers.
In this work, the placement of applications is optimized by orchestrating cloud data centers, where specific constraints (e.g., energy consumption, carbon emissions, and energy costs) are considered. Furthermore, the applications placement decisions are taken in real-time to efficiently place the applications on cloud data centers located in different cities that have different carbon emissions and energy costs.
2.2 Communication Networks Infrastructure
The Internet protocol (IP) over wavelength division multiplexing (WDM) is broadly implemented in the core network infrastructure, which is composed of two main layers, the IP layer, and the optical layer. In the IP layer, the IP router is linked to an optical switch and aggregates data traffic from the access network. While the optical layer provides wide bandwidth for data transmission between the IP routers located at the Metro network.
In addition, optical switches are connected to physical fiber links. On each fiber link, transponders provide optical-electronic-optical (OEO) processing at each switch node, using a pair of WDM. Also, erbium-doped fiber amplifiers (EDFAs) are used for long-distance transmission [25]. Multi-Protocol Lambda Switching (MPLS) is a routing protocol on IP over WDM optical core networks, that routes the data packets from source node to destination node through the connection-oriented service, using the shortest path [26]. A traditional cloud data center consists of multiple servers, which deliver various services to the end-users (e.g., processing and storage capacity) [27]. Usually, cloud data centers are established near the core network node in order to take advantage of the large bandwidth. The fundamental architecture of a telecom network connecting to the data center is illustrated in Fig. 1.
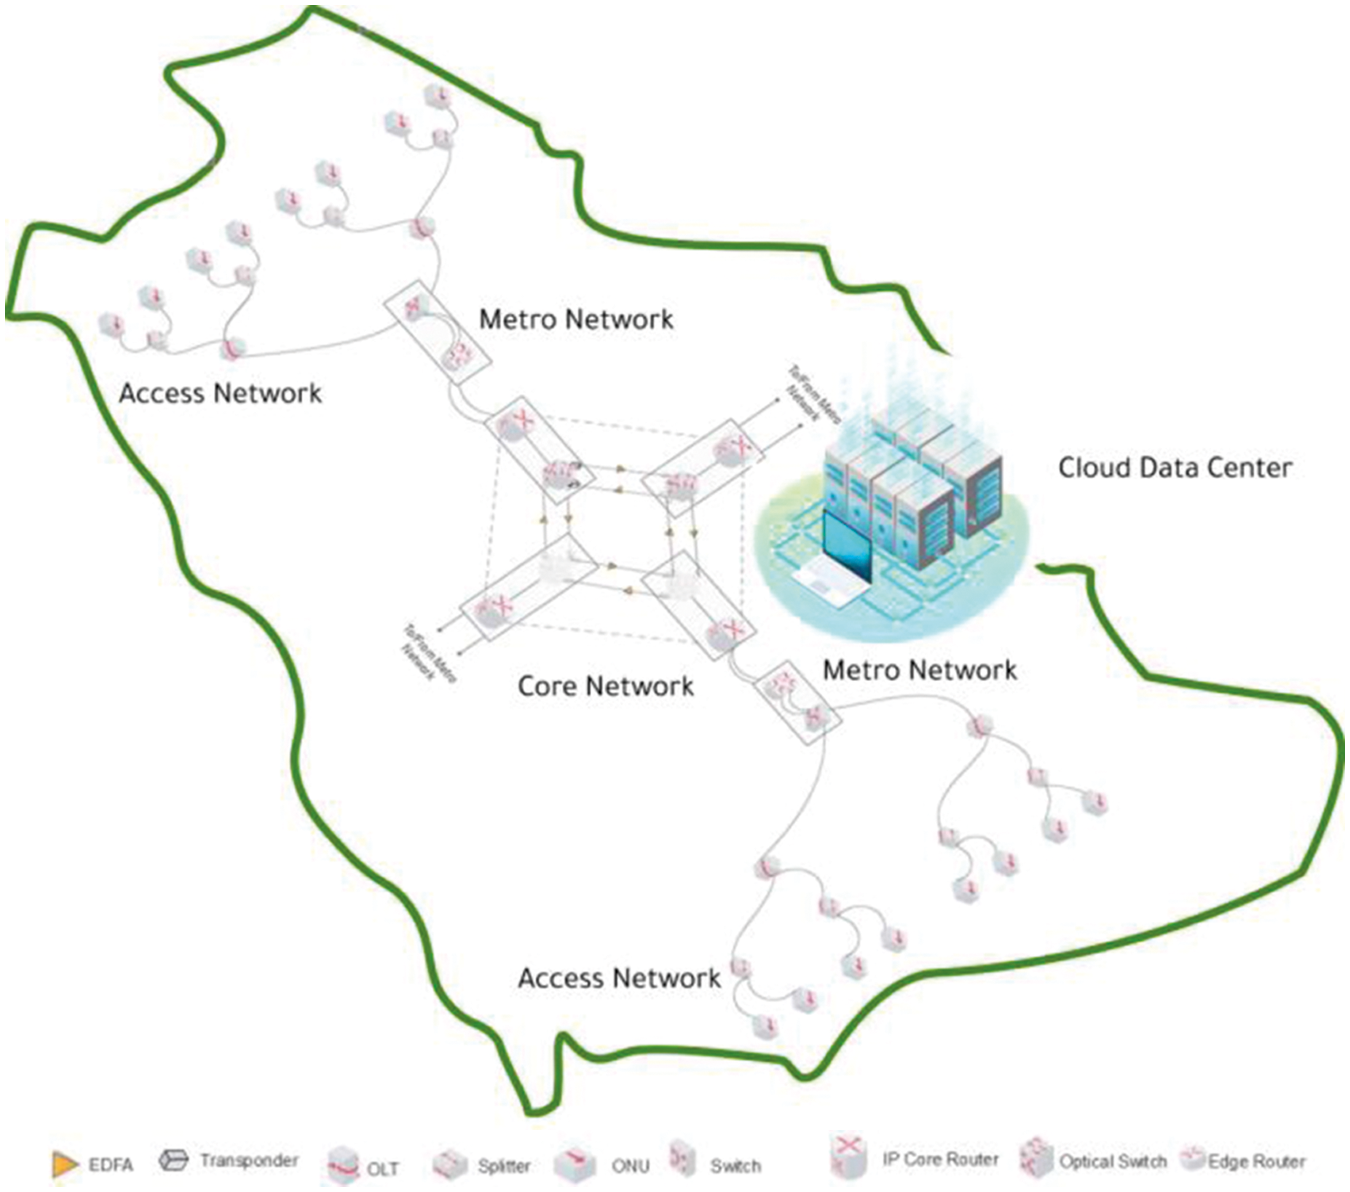
Figure 1: The telecom network architecture with data center
Mathematical modeling is the most accurate representation of any problem, which can help to understand and solve the problem concisely. To achieve optimal or near-optimal solutions, the MILP model has been used extensively in the literature for optimizing network design. In this section, we develop the MILP model to optimize the energy consumption, carbon emissions, and energy costs over cloud data centers for completeness.
3.1 Optimizing Energy Consumption
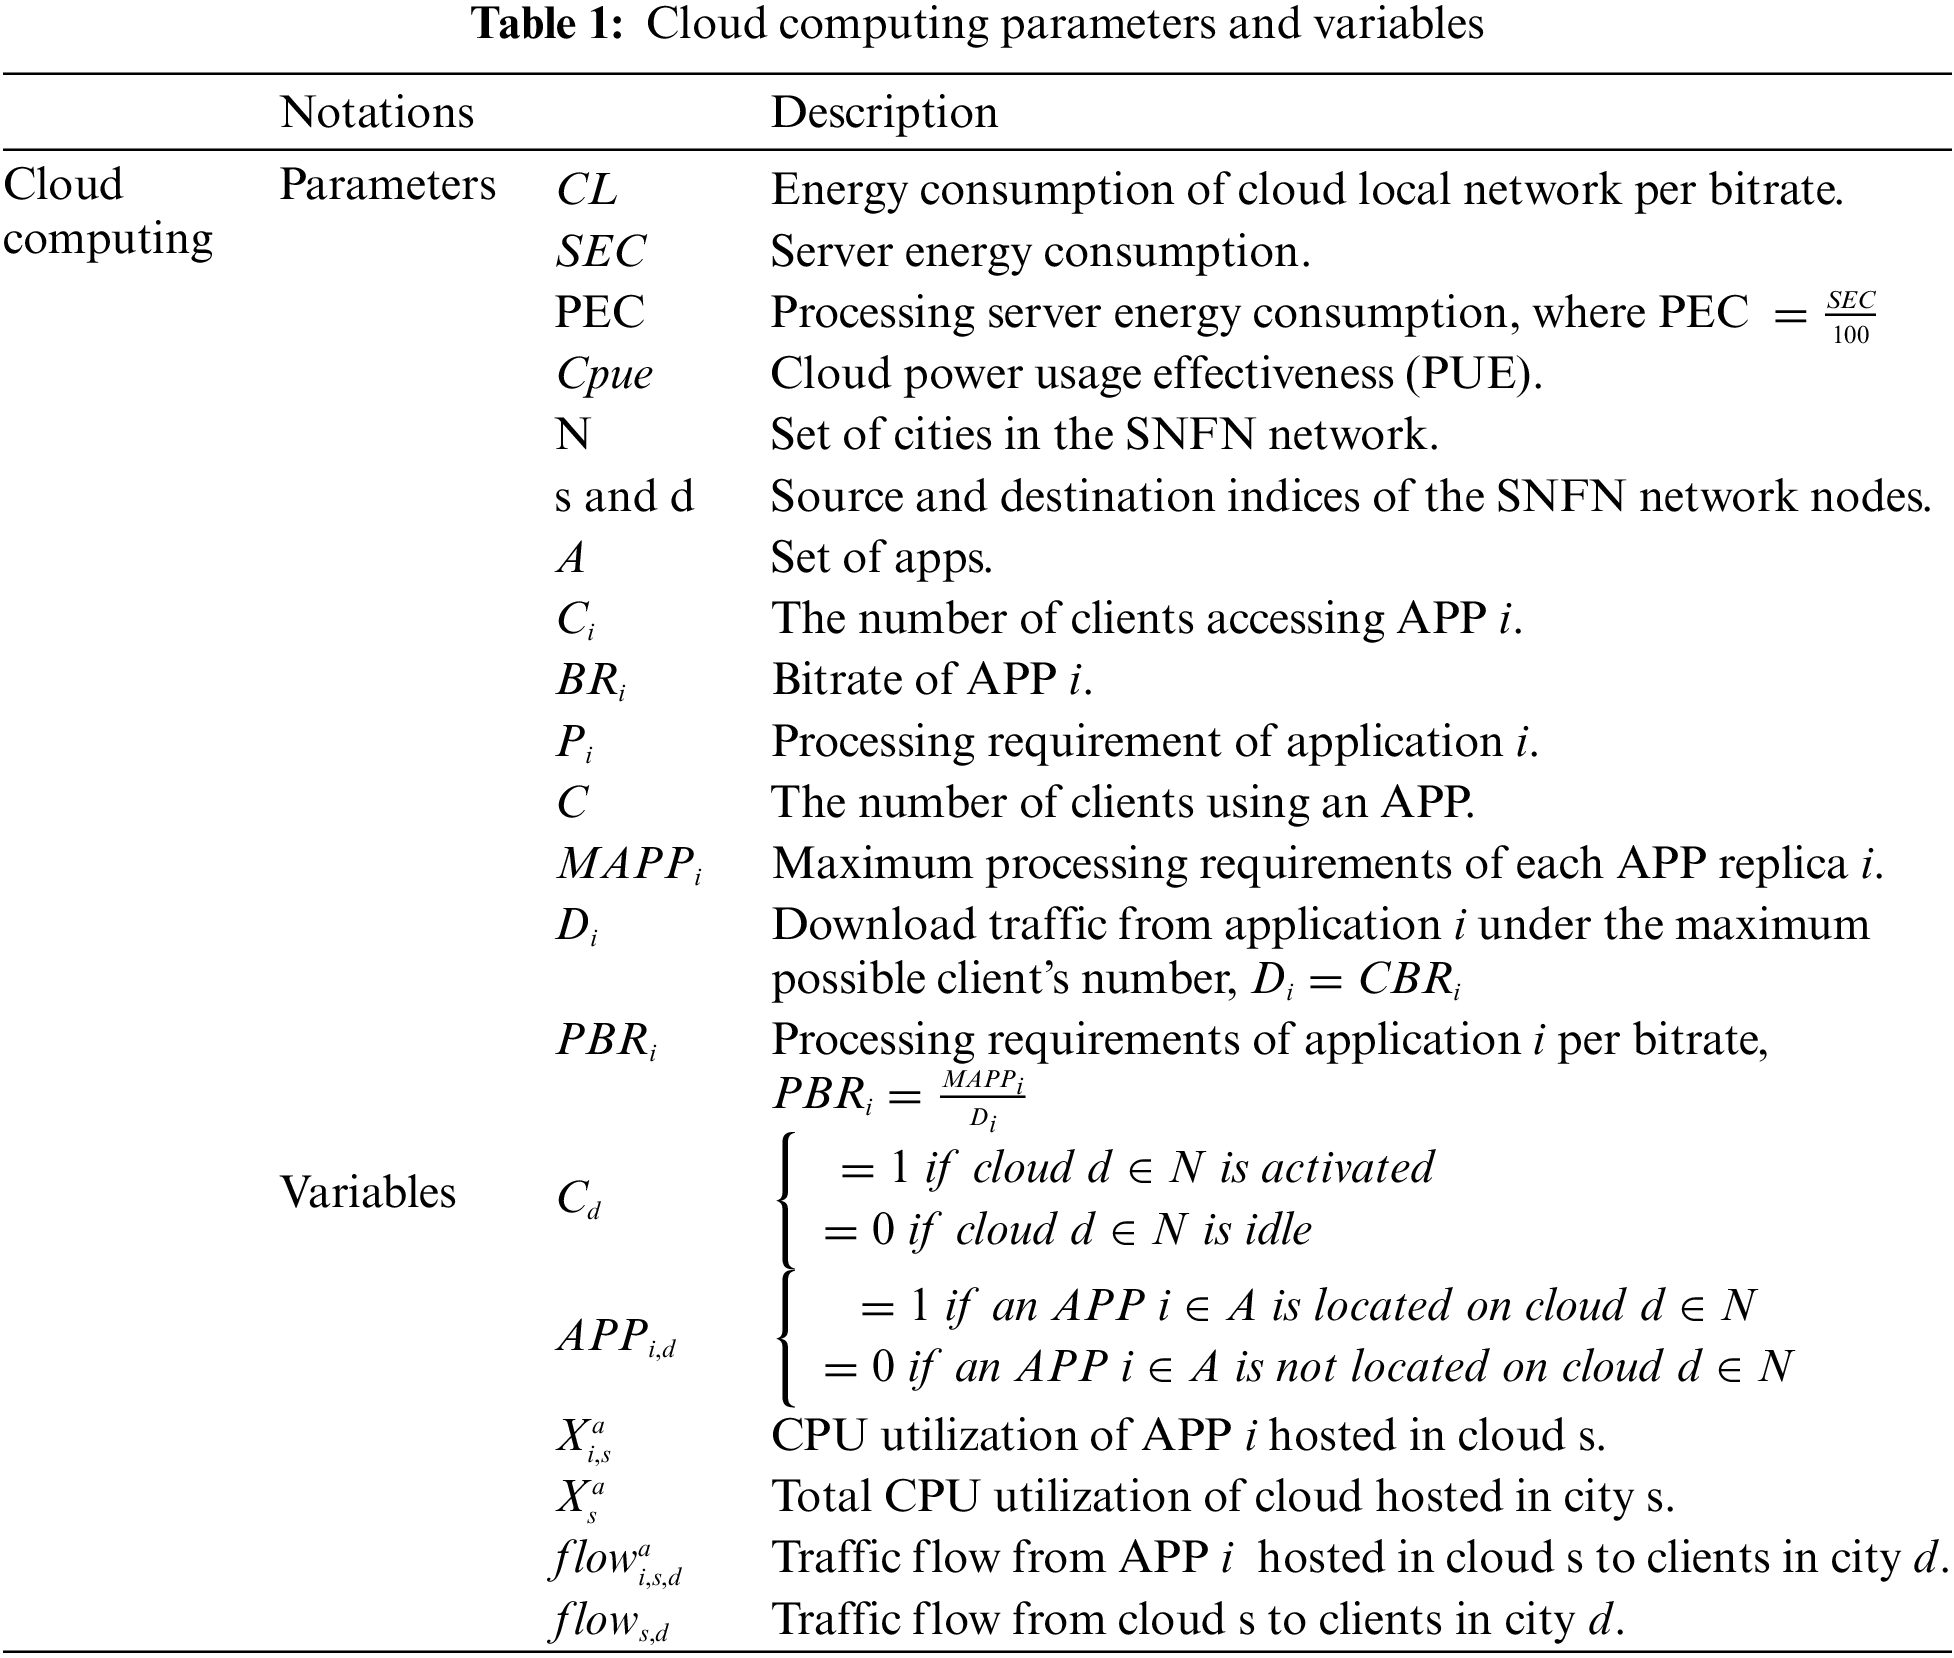
We introduce the parameters and variables to describe cloud computing, as shown in Tab. 1.
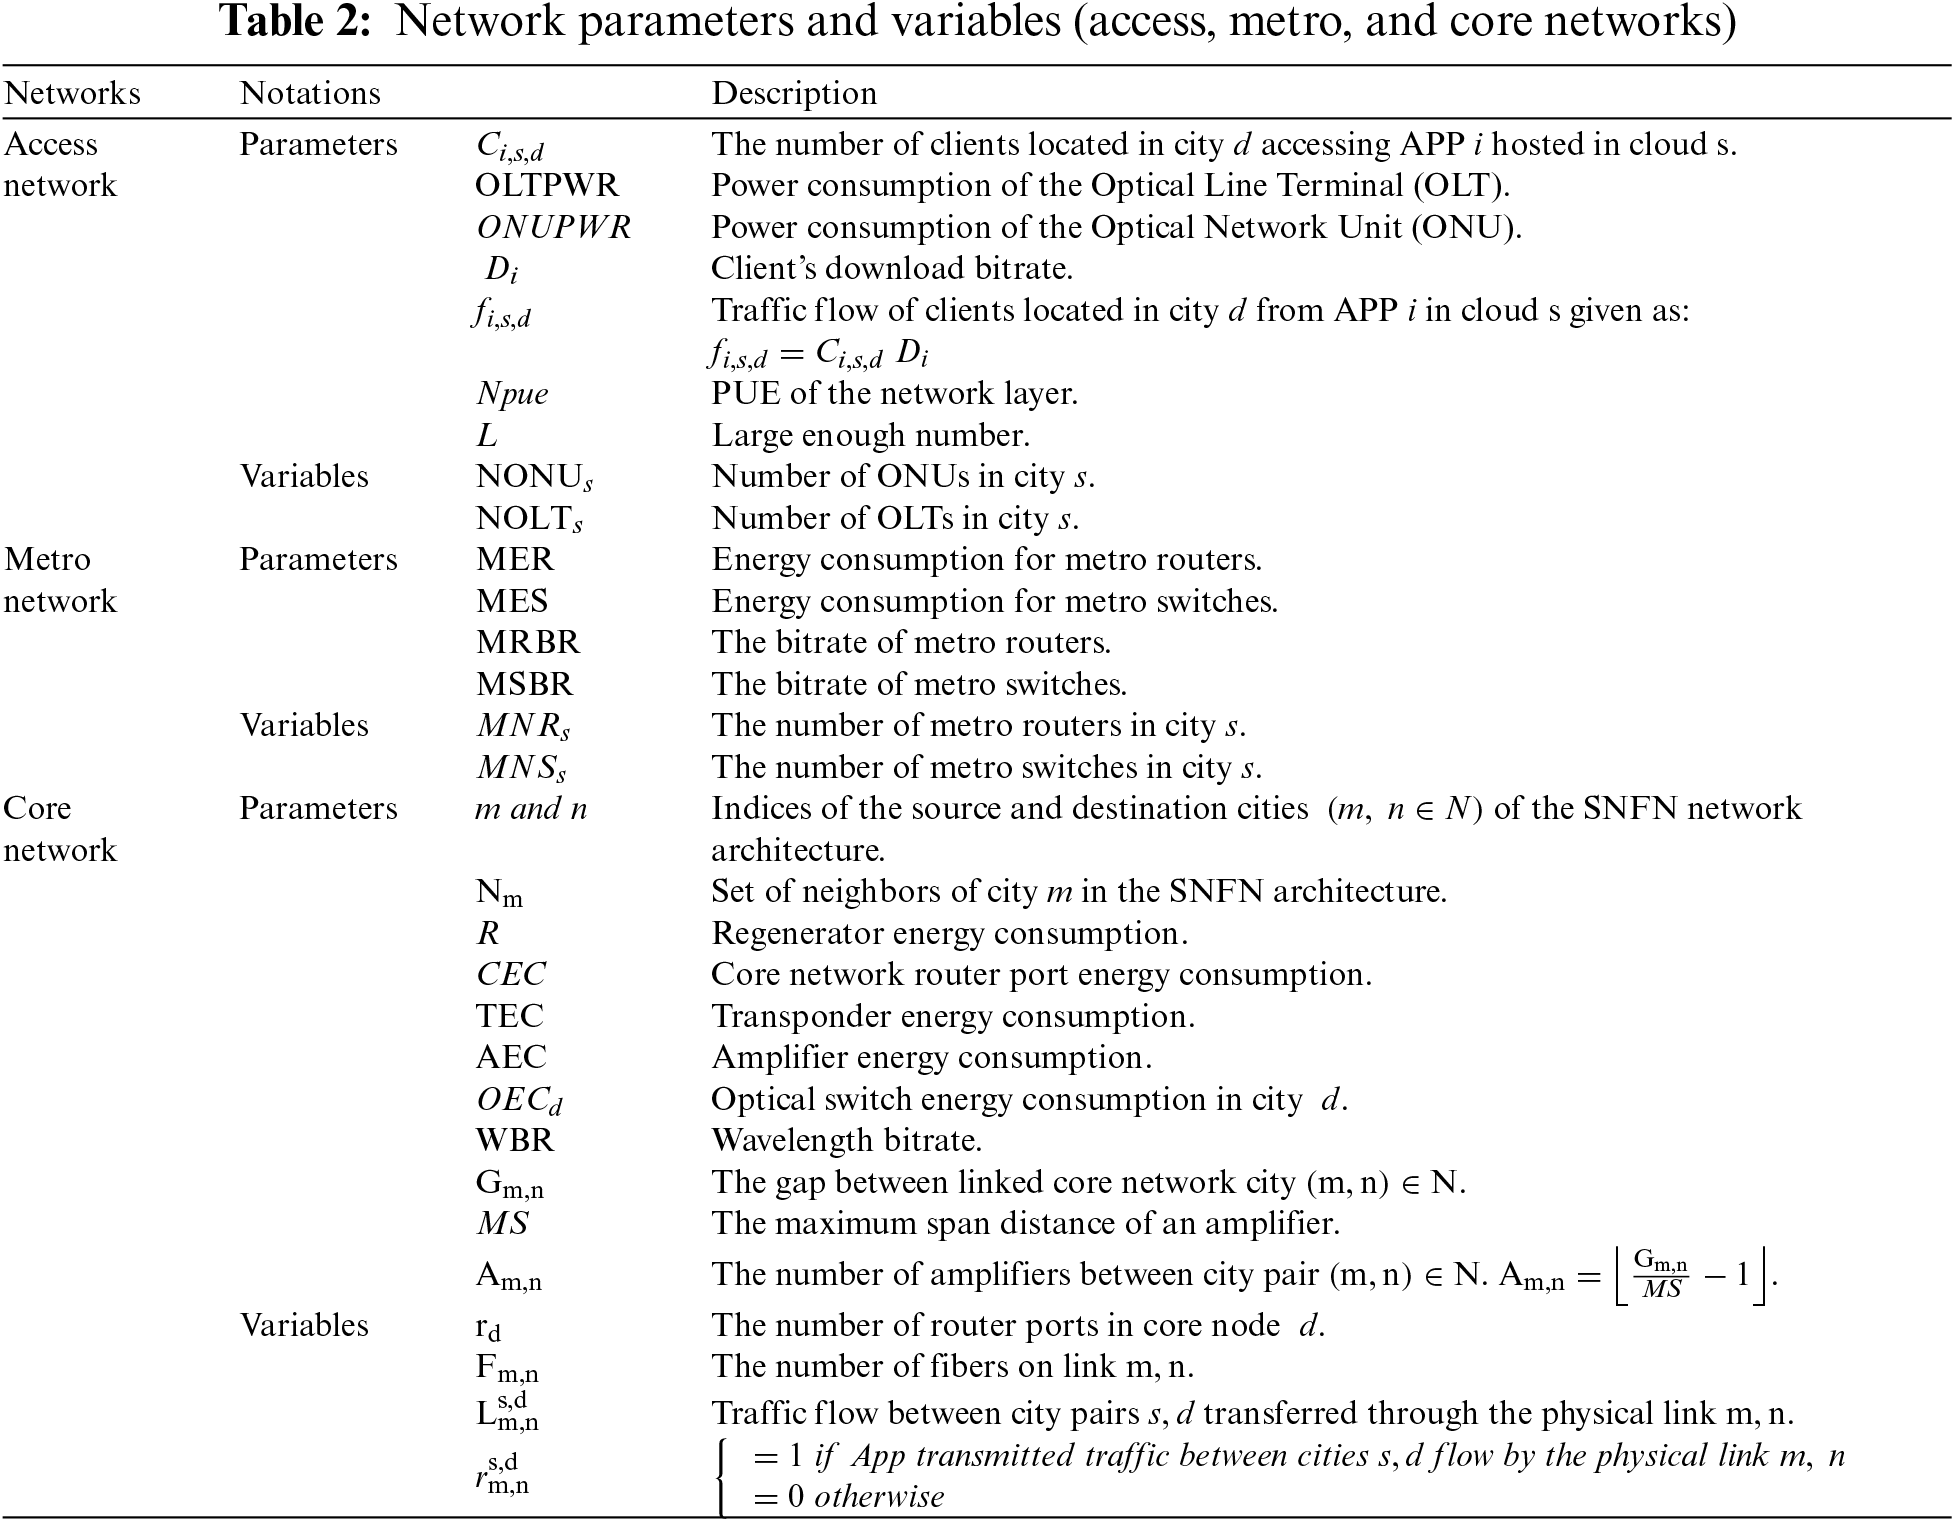
Typical telecom networks (i.e., core, metro, and access networks) are considered. Also, the traffic traversing through these networks and the corresponding energy consumption are described by the parameters and variables presented in Tab. 2.
The MILP model of energy consumption is denoted by the following objective:
The objective: is to minimize the total energy consumption:
Formula (1) computes the energy consumption of the SNFN architecture as the sum of the power consumption of the access, metro, and core networks, as well as the cloud.
Subject to the next constraints:
Traffic in the cloud architecture:
Constraint (2) guarantees that all the users are accessing an application in a cloud node.
Applications placement in the cloud:
Constraints (3) and (4) ensure that the binary variable
Physical link:
Constraints (5) and (6) make that the physical link
Processing requirements in the cloud:
Constraint (7) gives the CPU utilization requirements of App
Traffic demand on the core network:
Constraint (9) gives the traffic flow between cities due to the Apps placed in the clouds.
Flow conservation constraint:
Constraint (10) describes the flow conservation of the core network. It guarantees that the total outbounding/inbounding traffic in all cities is similar, excepting the source/destination nodes.
Physical link capacity:
Constraint (11) defines the physical link capacity by making sure that the flow in a link does not surpass the upper pound capacity of fibers.
The number of router ports in a core network node:
Constraint (12) provides the number of router ports in each core network node.
Metro routers:
Constraint (13) provides the number of metro routers in each city.
Metro switches:
Constraint (14) provides the number of metro switches in each city.
3.2 Optimizing Carbon Emissions (CO2)
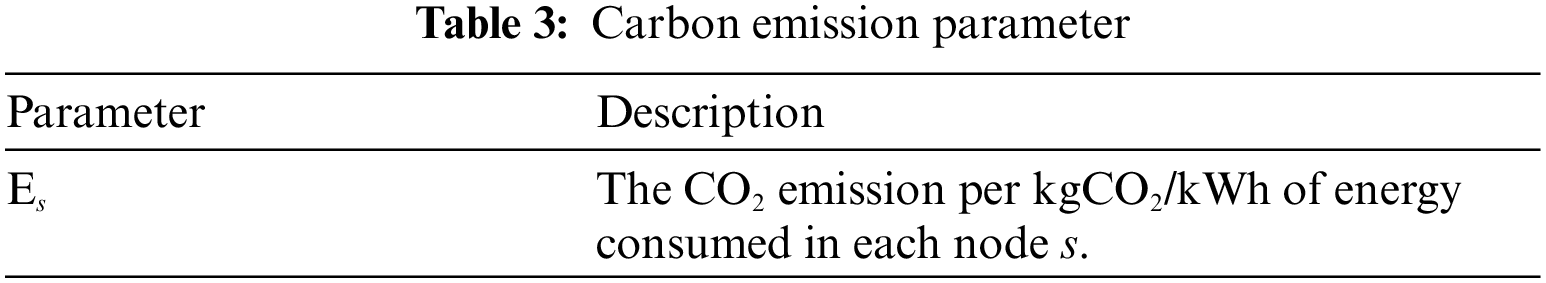
Carbon emission describes the amount of carbon dioxide (CO2) that is emitted when the energy is consumed [28], (kgCO2e/kWh) is the unit of measuring the CO2 emissions per kilowatt-hour (kWh). Also, the parameter relating to carbon emissions is defined in Tab. 3.
The MILP model of carbon emission is represented by replacing the objective in formula (1) as follow:
The objective: is to minimize the total CO2 emissions:
Formula (15) computes the carbon emission of the proposed approach as the sum of the carbon emission of the access, metro, and core networks, as well as the cloud.
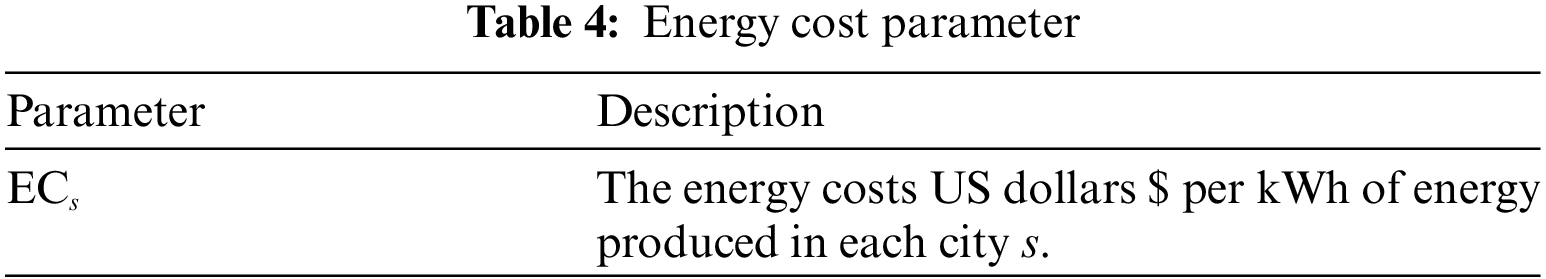
Using energies has different costs based on the type of energy used. Thus, the energy cost parameter is defined in Tab. 4.
The MILP model of energy cost is represented by replacing the objective in formula (1) as follow:
The objective: is to minimize the total energy cost:
Formula (16) calculates the energy cost of the proposed approach as the sum of the energy cost of the access, metro, and core networks, as well as the cloud.
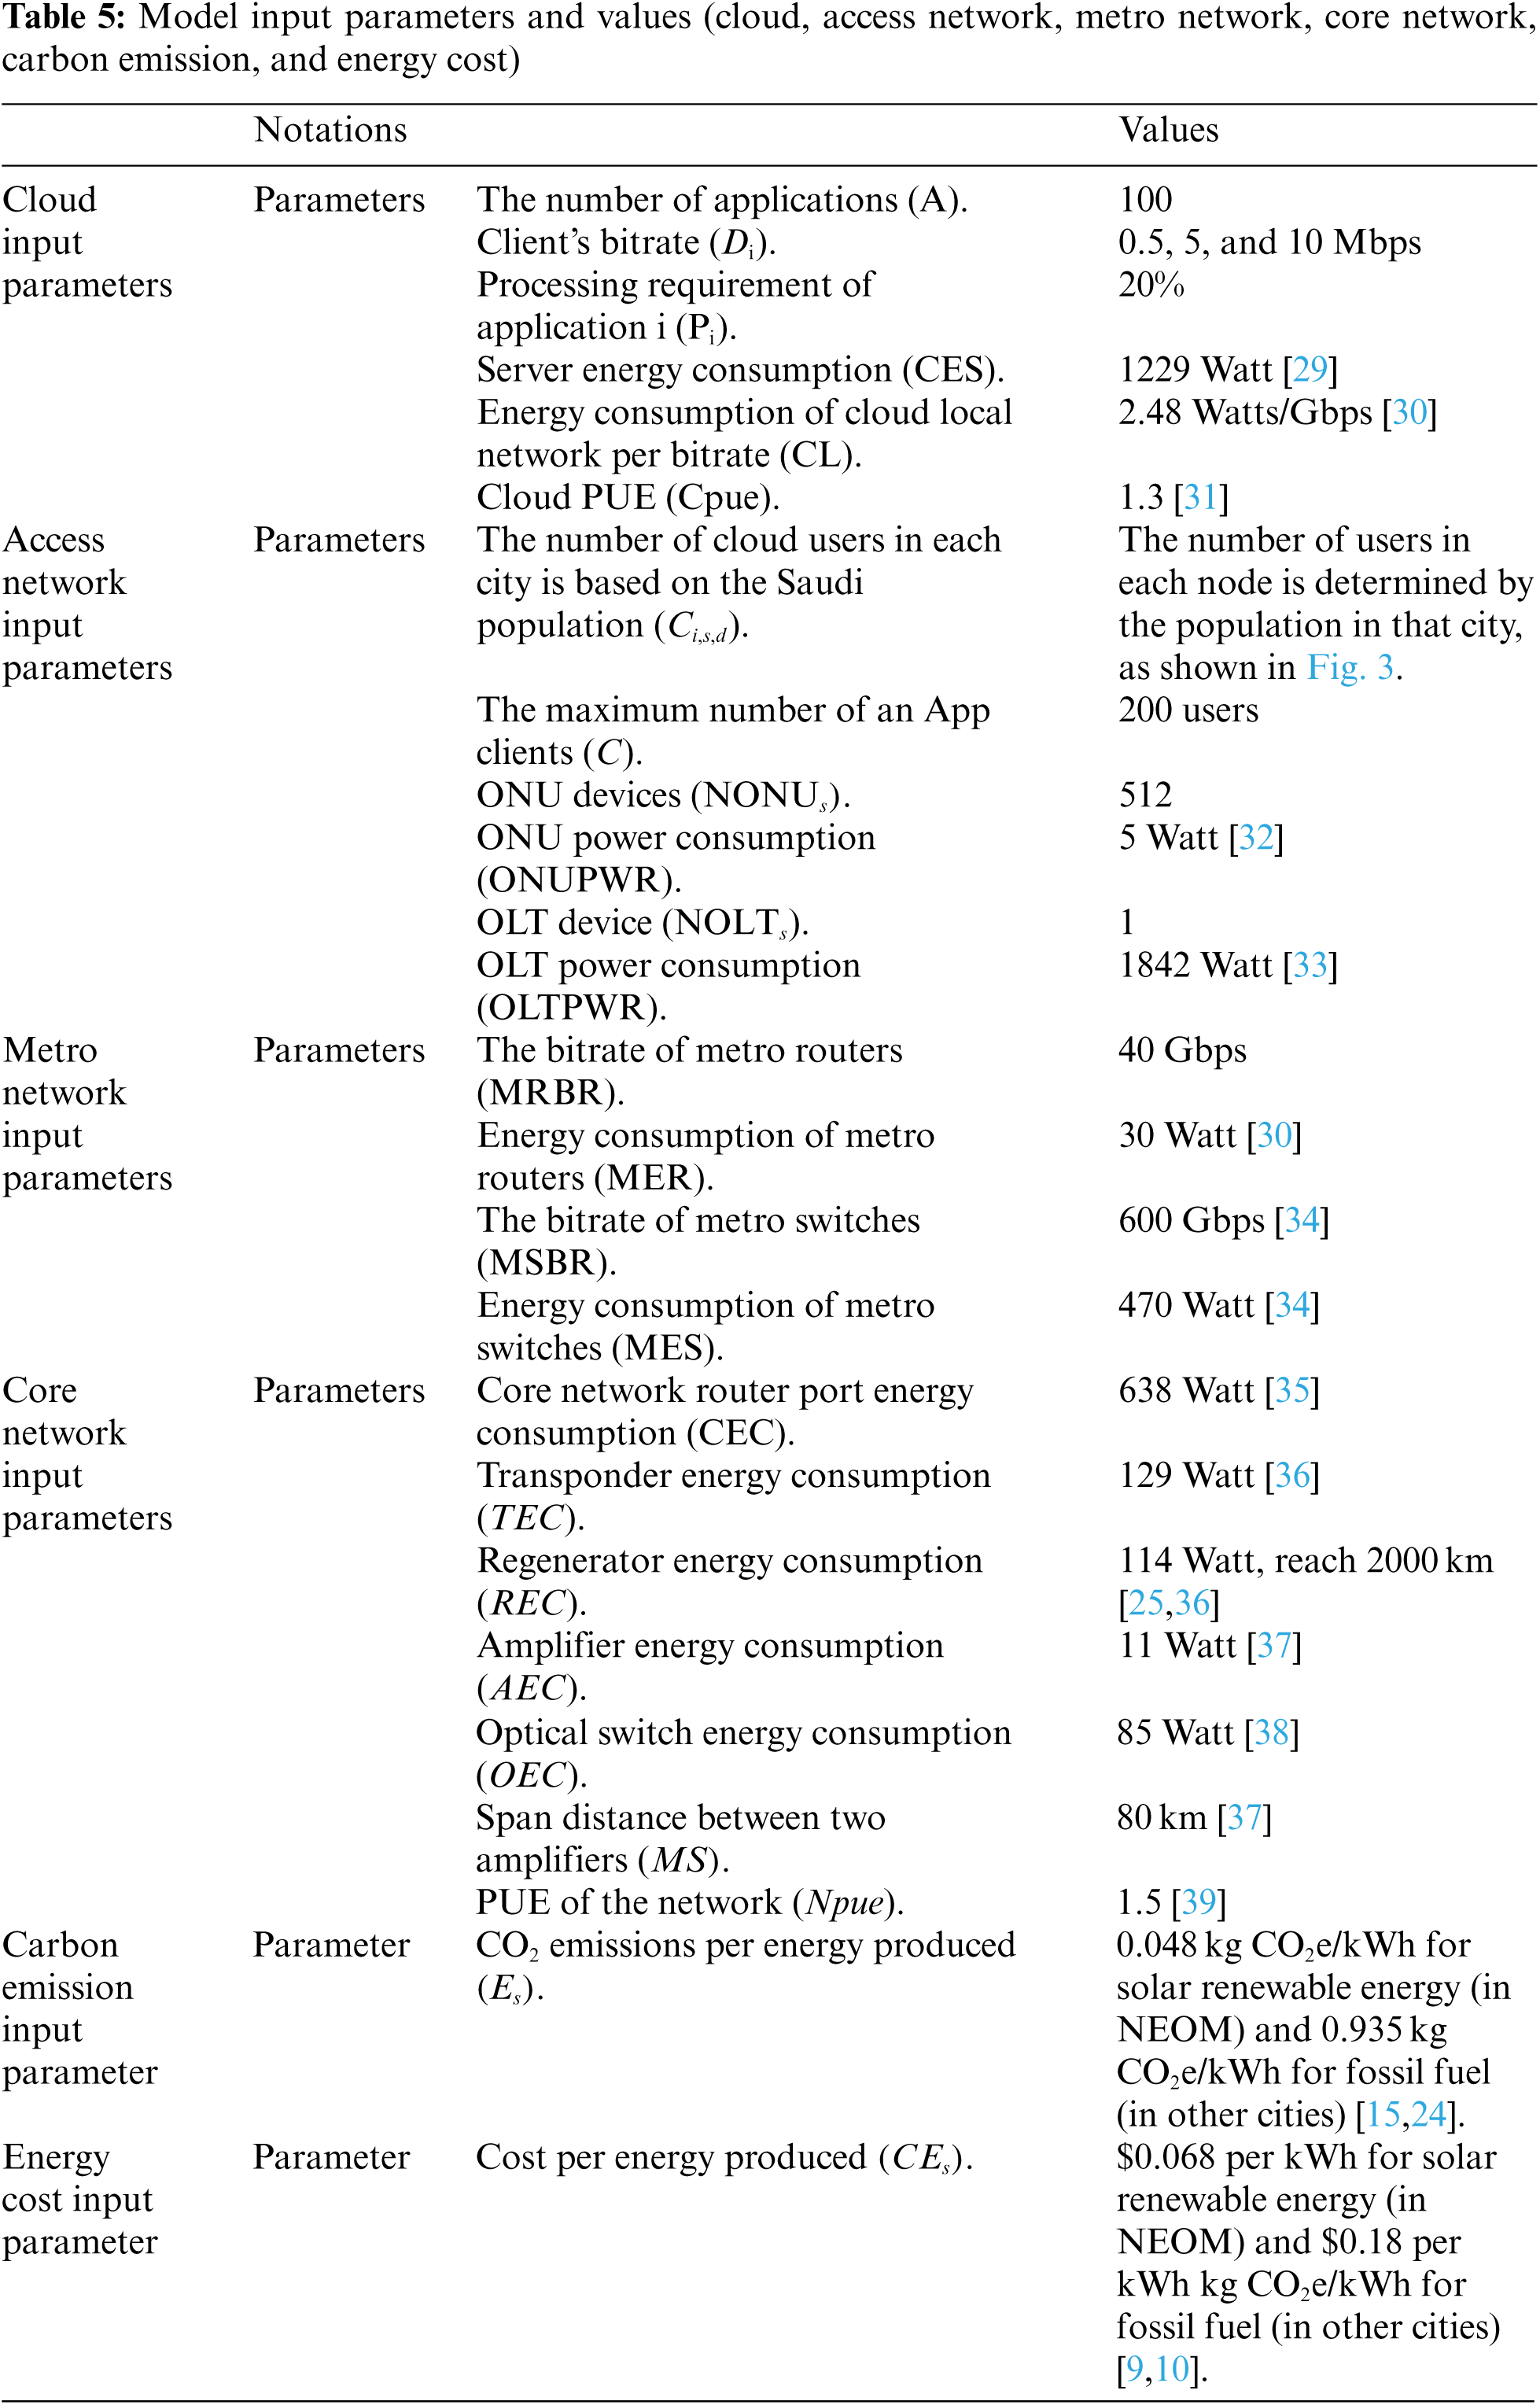
In this section, we demonstrate the experiment environment considered to evaluate the proposed approach, along with the model input parameters and their values. Regarding the environment of the experiment, the MILP model is solved using A Mathematical Programming Language (AMPL) software over a Personal Computer (PC) with an Intel Core i7 processor, 1 Terabyte (TB) Solid-State Drive (SSD) of storage, and 16 Gigabytes (GB) of memory. Additionally, the MILP model input parameters and their values of the cloud and three levels of networks (access, metro, core networks) along with the carbon emission and the energy cost are shown in Tab. 5.
This section discusses the SNFN architecture in terms of its energy consumption, CO2 emission efficiency, and total cost of consuming different energy sources. Furthermore, we evaluate the proposed approach to place the cloud applications in NEOM compared to a traditional placement in either Jeddah or Riyadh.
5.1 Saudi National Fiber Network (SNFN) Topology
We use the SNFN network to optimize the cloud data center locations in Saudi Arabia, which has 28 cities, and the distance among these cities (nodes) is obtained using Google Maps [40], as shown in Fig. 2. In this topology, we consider three different cloud data center locations in Jeddah, Riyadh, and NEOM. We also consider the population of different cities, as shown in Fig. 3.
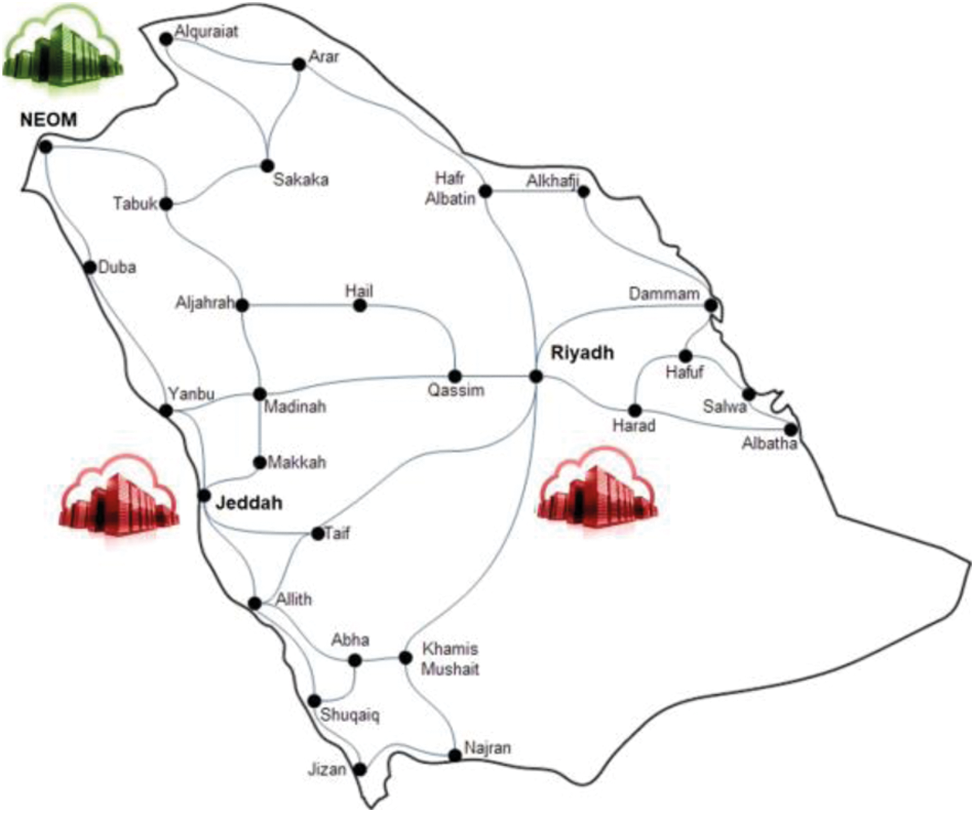
Figure 2: Saudi national fiber network (SNFN) with different cloud data center locations
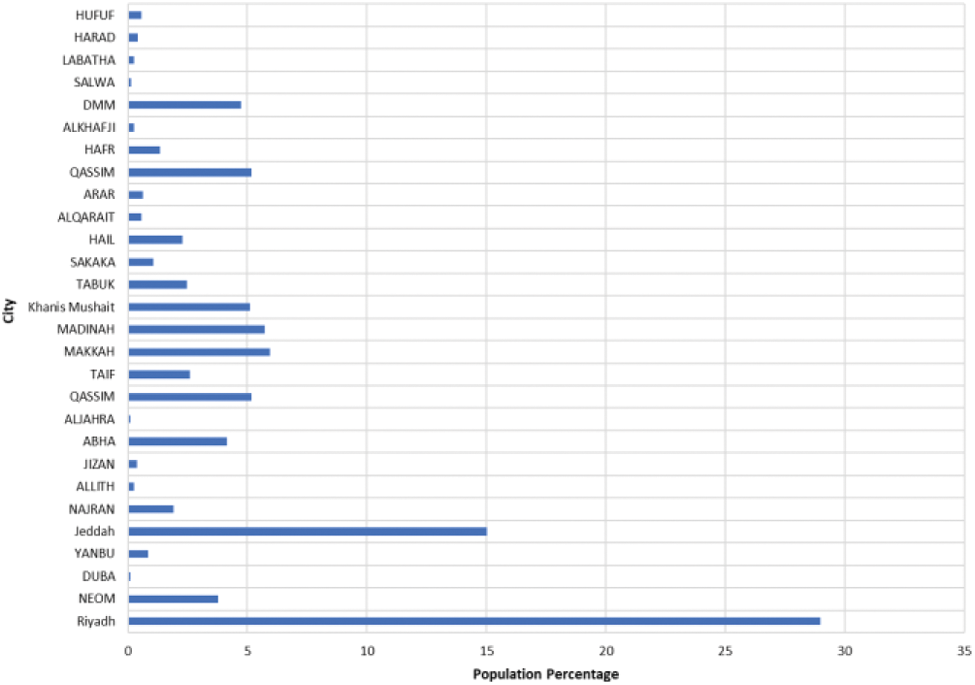
Figure 3: The population of different cities in Saudi Arabia
This subsection compares the total energy consumption of different cloud data center locations in Jeddah, Riyadh, and NEOM. Fig. 4 shows the total energy consumption of different scenarios of cloud locations in the SNFN network architecture and NEOM has the highest energy consumption compared to other locations. This can be justified due to the trade-off between the extra energy consumed by the network journey to NEOM, and data center energy saved (network energy consumption) by shortening the network journey through placing applications where the majority of users are located (i.e., in Jeddah and Riyadh). Also, we compare the energy consumption of placing cloud data centers in Jeddah and Riyadh to NEOM, as shown in Fig. 5. Using Jeddah and Riyadh as cloud data center locations shows a limited energy saving compared to NEOM and the total energy savings are only 0.1% and 0.2%, respectively.
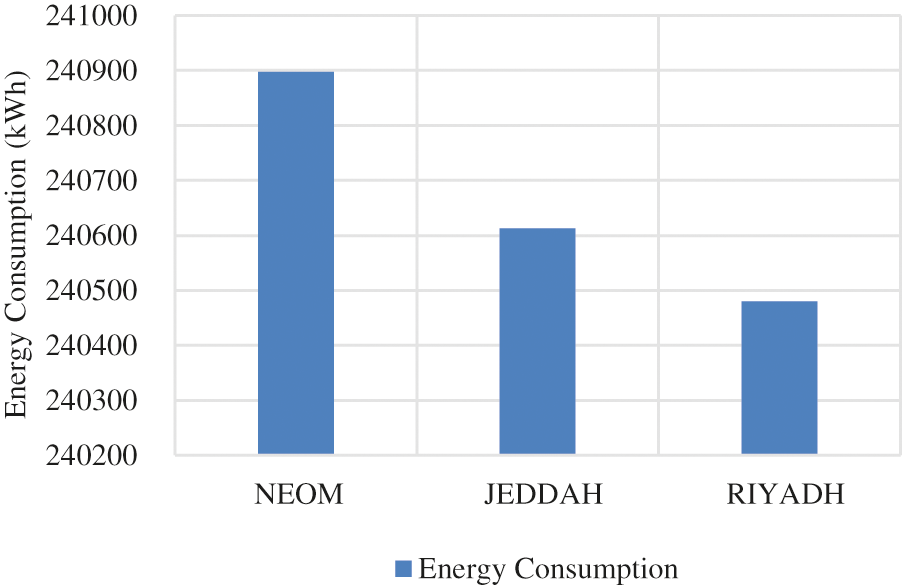
Figure 4: The total energy consumption of ICT infrastructure in Saudi Arabia, considering 3 different scenarios of cloud locations; NEOM, Jeddah, and Riyadh
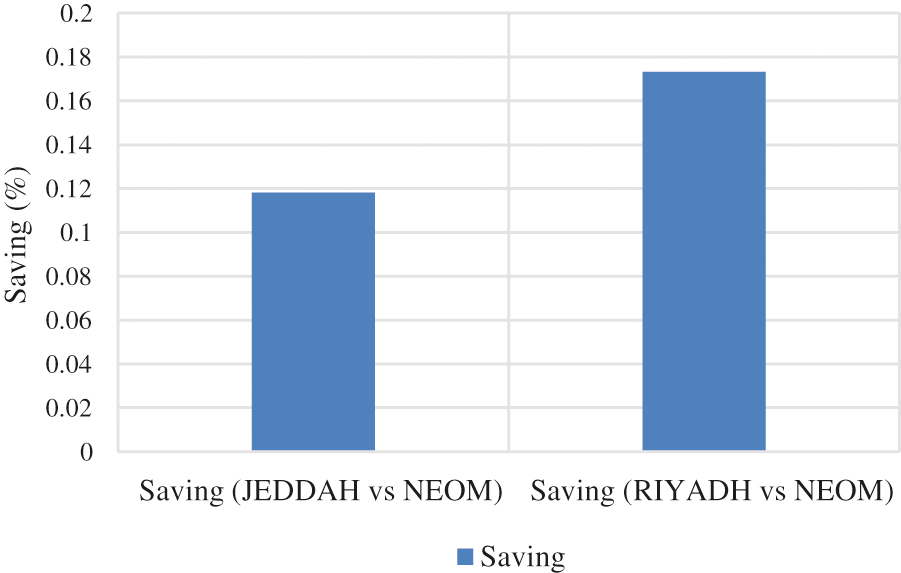
Figure 5: The total saving in energy consumption of ICT infrastructure in Saudi Arabia, considering NEOM as a potential cloud location compared to traditional locations in Jeddah and Riyadh
An energy source's carbon emissions (CO2/kWh) describe the amount of carbon released per kilowatt-hour of electricity generated, and the unit used in the experiment (tCO2e/kWh) is tons of CO2 equivalent per kWh. In this work, we have used the data values of carbon emissions stated in [15,24], and these values are also shown in Tab. 5. We compare the total carbon emissions of different scenarios of cloud data center locations in Jeddah, Riyadh, and NEOM based on the SNFN network architecture, as shown in Fig. 6. The result shows that NEOM has the lowest carbon emissions compared to other locations. In Fig. 7, we also compare the total carbon emissions of placing cloud data centers in Jeddah and Riyadh to NEOM. We notice that placing the cloud data center in NEOM shows a significant saving in carbon emissions compared to Jeddah and Riyadh, where the total savings reach 94.1% and 94%, respectively. Since NEOM has the advantage of the renewable energy resources available in the city, this resulted in a significant carbon emission saving.
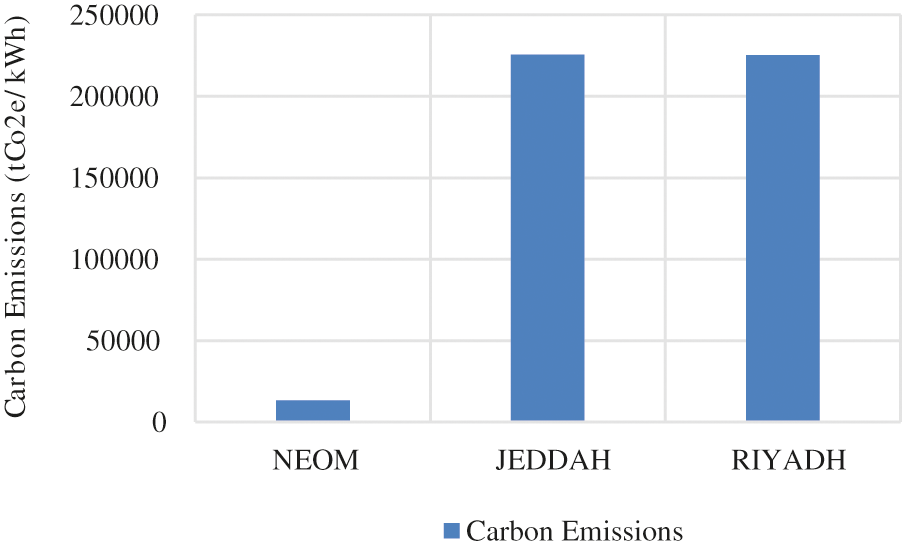
Figure 6: The total carbon emissions of ICT infrastructure in Saudi Arabia, considering 3 different scenarios of cloud locations; NEOM, Jeddah, and Riyadh
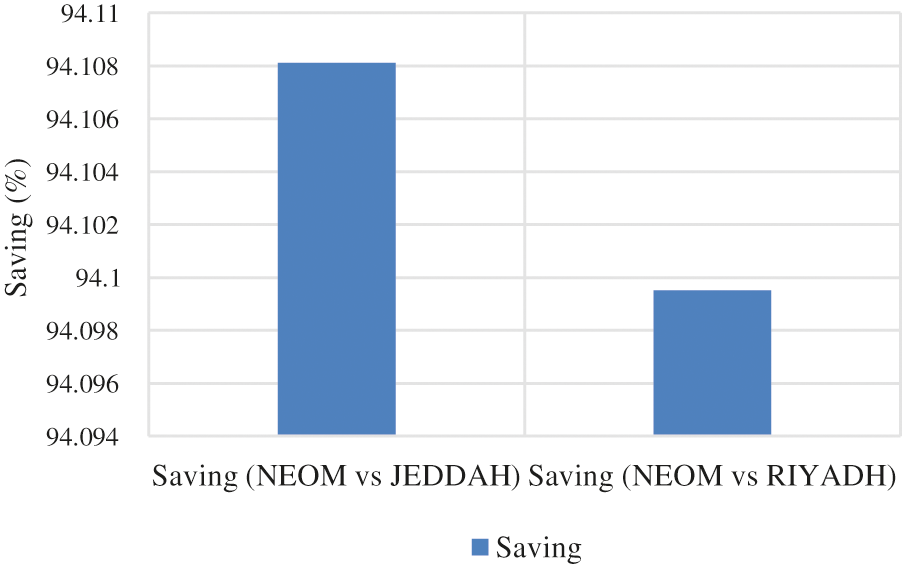
Figure 7: The total saving in carbon emissions of ICT infrastructure in Saudi Arabia, considering NEOM as a potential cloud location compared to traditional locations in Jeddah and Riyadh
This subsection investigates the cost of energy produced in each node s (US dollar $ per kWh). Using renewable energy has different costs compared to oil and fossil fuels. For example, the electricity cost of solar renewable energy is $0.068 per kWh [9], whereas the cost of fossil fuel is $0.18 per kWh [10]. These values are also shown in Tab. 5. We compare the total energy cost of different cloud placement scenarios in Jeddah, Riyadh, and NEOM. Fig. 8 shows the total energy cost of different scenarios of cloud locations in the SNFN network architecture and NEOM has the lowest energy cost compared to other locations. In Fig. 9, we compare the total energy cost of placing cloud data centers in Jeddah and Riyadh to NEOM. We notice that placing the cloud data center in NEOM shows a remarkable energy cost saving compared to Jeddah and Riyadh, where the total savings reach 61.9% and 61.8%, respectively. This is due to the use of renewable energy resources available at NEOM city, which assisted to achieve a notable energy cost saving.

Figure 8: The total energy costs of ICT infrastructure in Saudi Arabia, considering 3 different scenarios of cloud locations; NEOM, Jeddah, and Riyadh
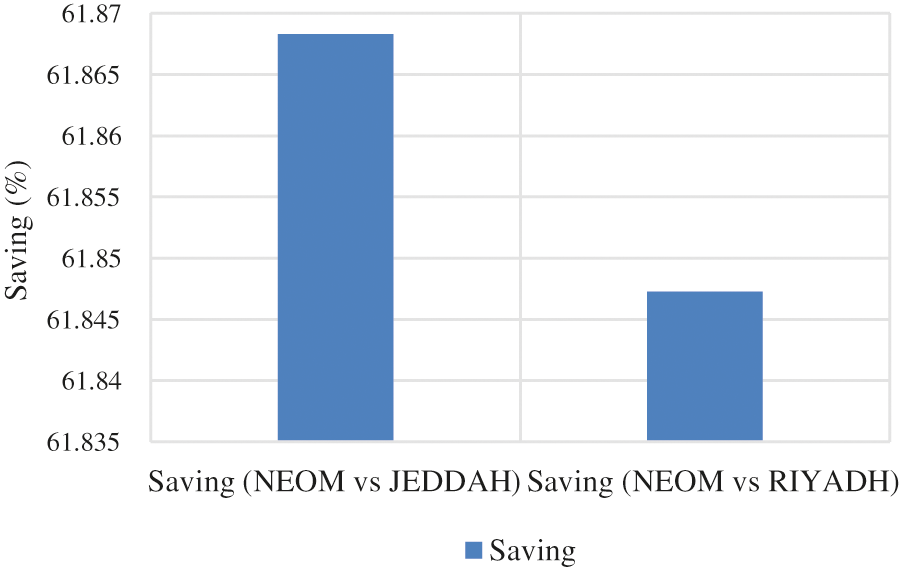
Figure 9: The total saving in energy costs of ICT infrastructure in Saudi Arabia, considering NEOM as a potential cloud location compared to traditional locations in Jeddah and Riyadh
In this section, we propose the heuristic to validate the eco-friendly approach for reducing carbon emissions and energy costs over the Saudi Cloud data centers. Optimizing the placement of the applications over cloud data centers that aims to reduce energy consumption, carbon emissions, and energy costs is a non-deterministic polynomial (NP) problem. For example, if i is the number of applications and x is the number of different locations of cloud data centers, then we will have
The HAECC-SCDC heuristic flowchart (presented in Fig. 10) is used for determining the optimal application placement over the Saudi Cloud data centers based on their energy consumption, carbon emissions, and energy costs. Also, this heuristic is evaluated using a PC with an Intel Core i7 processor, 1 TB SSD of storage, and 16 GB of memory. Similar to the MILP model, the SNFN network architecture is considered as an example of a core network. This heuristic took 2 s to evaluate the HAECC-SCDC; the MILP model and the HAECC-SCDC heuristic show a comparable result in terms of energy consumption, carbon emissions, and energy costs. The gaps between them are restricted to a maximum of 1.5%, as shown in Figs. 11–13, respectively.
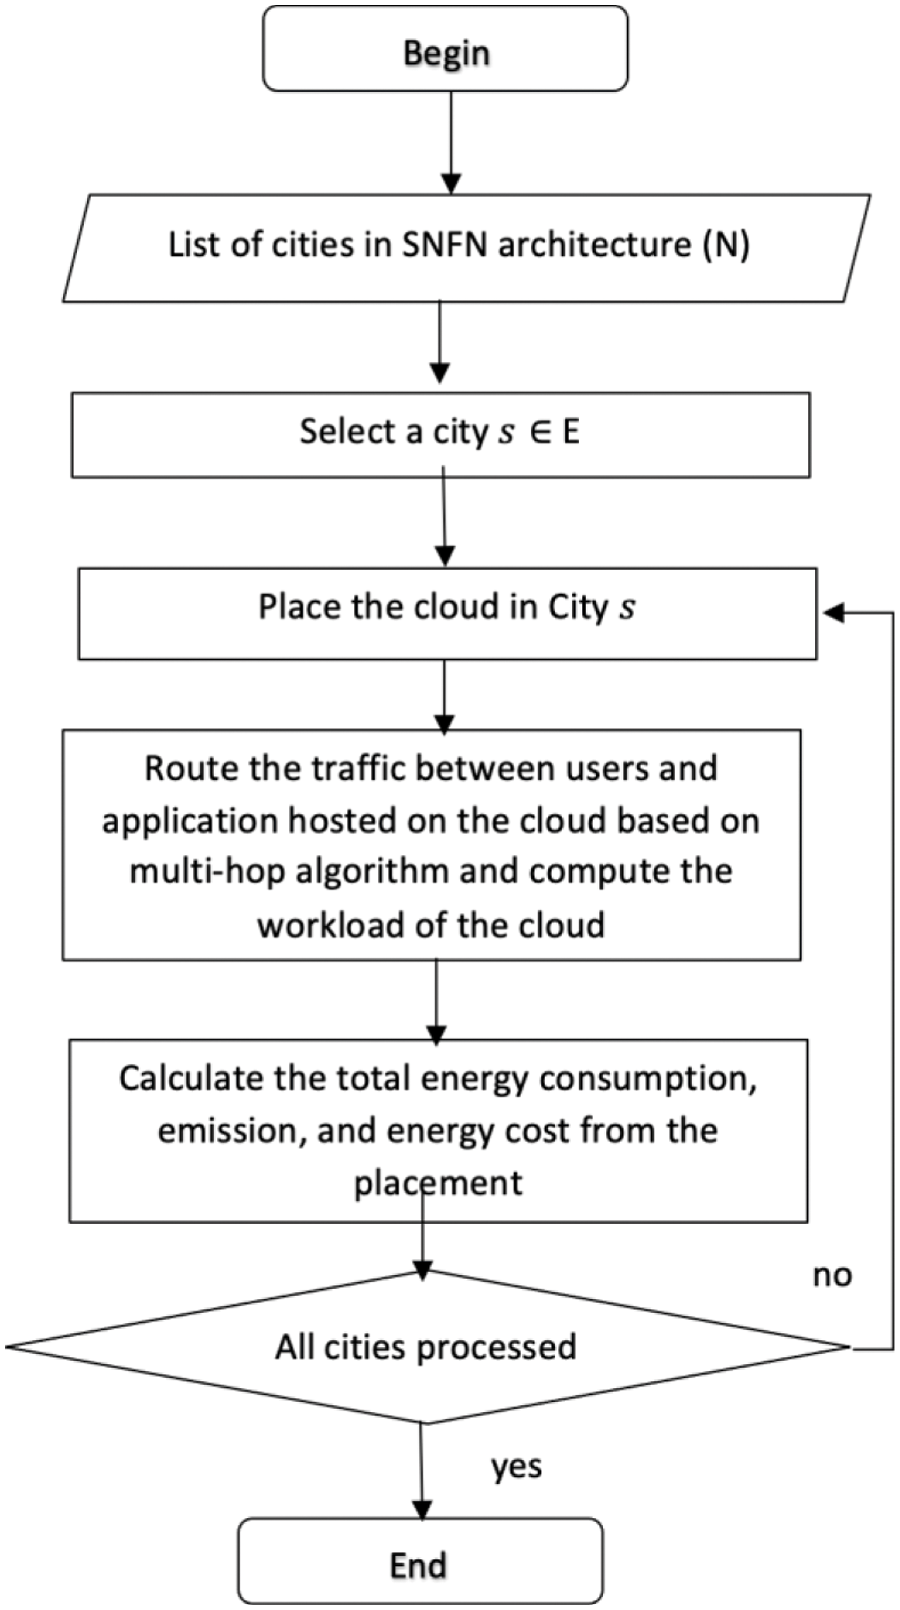
Figure 10: Flowchart of HAECC-SCDC heuristic
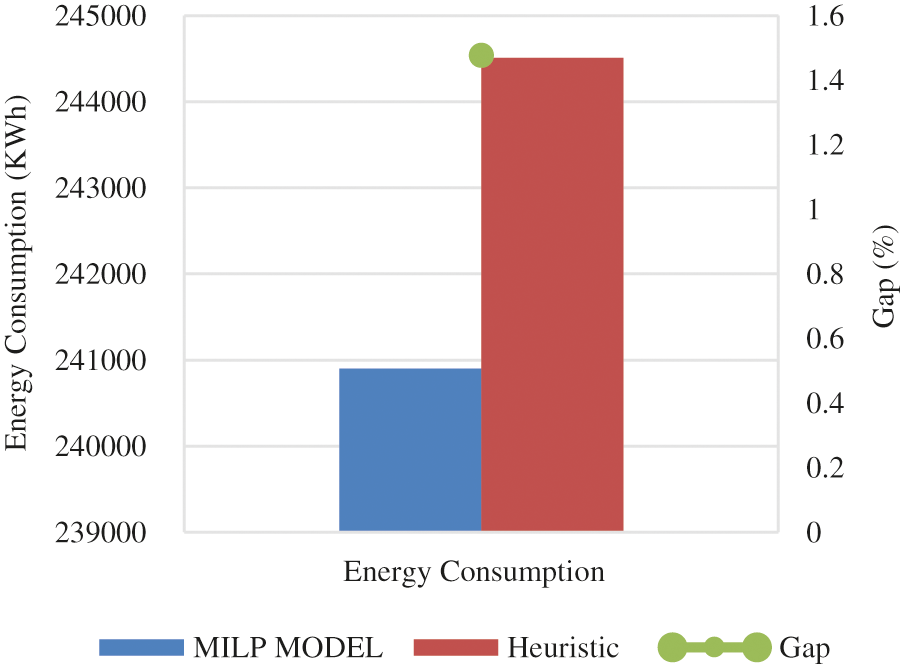
Figure 11: The difference between the MILP model vs. HAECC-SCDC heuristic in terms of energy consumption
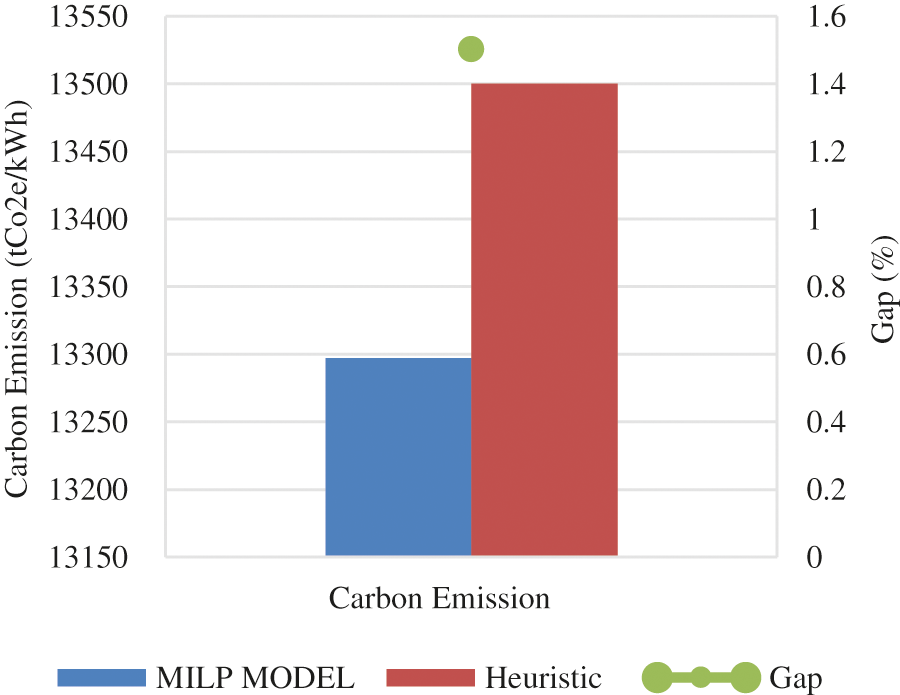
Figure 12: The difference between the MILP model vs. HAECC-SCDC heuristic in terms of carbon emissions

Figure 13: The difference between the MILP model vs. HAECC-SCDC heuristic in terms of energy costs
This paper presented an eco-friendly approach for reducing the carbon emissions associated with ICT infrastructure in Saudi Arabia. We developed a MILP model to optimize the energy efficiency of different cloud data centers’ locations in the SNFN network architecture to reduce the associated carbon emissions and energy costs. Two different scenarios have been compared, one considered the traditional cloud data center located in Jeddah and Riyadh, whereas the other considered NEOM as a potential cloud data center new location to take advantage of its green energy infrastructure. Also, the cloud data center locations are enhanced with carbon emissions awareness and calculate its associated energy costs. From the results, we observed that the most carbon-efficient location for the Saudi Cloud data center is NEOM; and the results also showed that our approach can save up to 94.1% of the carbon emissions and 61.9% of the energy cost compared to the current physical topology. Finally, a trade-off occurred between the extra emission consumed by the network route to NEOM; and data center emissions saved by reducing the network route through placing applications where the most users are located (i.e., in Jeddah and Riyadh). Thus, the creation of eco-friendly data centers in NEOM would result in carbon emissions savings if the latter emission exceeds the former. A part of future work would be to consider renewable resources for cooling operations along with their expenses, which are not addressed in this paper in order to further evaluate the capabilities of the proposed approach.
Acknowledgement: The authors would like to thank the Deanship of Scientific Research, Prince Sattam bin Abdulaziz University, Al-Kharj, Saudi Arabia, for supporting this research.
Funding Statement: The authors received no specific funding for this study.
Conflicts of Interest: The authors declare that they have no conflicts of interest to report regarding the present study.
1. Knoema, “Saudi Arabia-CO2 emissions,” 2020. [Online]. Available: https://knoema.com/atlas/Saudi-Arabia/CO2-emissions. [Accessed: 16-Nov-2021]. [Google Scholar]
2. R. George, “Saudi Arabia uses largest amount of crude oil for power generation since 2010,” 2020. [Online]. Available: https://www.eia.gov/todayinenergy/detail.php?id=18111. [Accessed: 16-Nov-2021]. [Google Scholar]
3. M. Aldossary, “A review of energy-related cost issues and prediction models in cloud computing environments,” Computer Systems Science and Engineering, vol. 36, no. 2, pp. 353–368, 2021. [Google Scholar]
4. A. Andrae and T. Edler, “On global electricity usage of communication technology: Trends to 2030,” Challenges, vol. 6, no. 1, pp. 117–157, 2015. [Google Scholar]
5. M. Ferranti, “Oracle opens cloud region in jeddah, with more gulf sites to come,” 2020. [Online]. Available: https://www.cio.com/article/3519069/oracle-opens-cloud-region-in-jeddah-with-more-gulf-sites-to-come.html. [Accessed: 17-Nov-2021]. [Google Scholar]
6. STC, “Launching 3 mega data centers in Riyadh, jeddah and Al-madina with SAR 1 billion investment,” 2020. [Online]. Available: https://www.stc.com.sa/wps/wcm/connect/english/stc/NewsItems/launch-3-data-centers-one-billion-sr. [Accessed: 21-Nov-2021]. [Google Scholar]
7. Mobily, “Co-location service,” 2020. [Online]. Available: https://www.mobily.com.sa. [Accessed: 21-Nov-2021]. [Google Scholar]
8. R. George and E. Sandys, “Saudi Arabia used less crude oil for power generation in 2018,” 2020. [Online]. Available: https://www.eia.gov/todayinenergy/detail.php?id=39693. [Accessed: 16-Nov-2021]. [Google Scholar]
9. IRENA, “Renewable power generation costs in 2019,” 2020. [Online]. Available: https://www.irena.org/publications/2020/Jun/Renewable-Power-Costs-in-2019. [Accessed: 25-Sep-2021]. [Google Scholar]
10. D. Broom, “5 charts show the rapid fall in costs of renewable energy,” 2020. [Online]. Available: https://energypost.eu/5-charts-show-the-rapid-fall-in-costs-of-renewable-energy/. [Accessed: 21-Nov-2021]. [Google Scholar]
11. M. Aldossary and H. A. Alharbi, “Towards a green approach for minimizing carbon emissions in fog-cloud architecture,” IEEE Access, vol. 9, pp. 131720–131732, 2021. [Google Scholar]
12. J. L. Berral, I. Goiri, T. D. Nguyen, R. Gavalda, J. Torres et al., “Building green cloud services at low cost,” in Proc. IEEE 34th Int. Conf. on Distributed Computing Systems, Madrid, Spain, pp. 449–460, 2014. [Google Scholar]
13. Z. Liu, M. Lin, A. Wierman, S. H. Low and L. L. H. Andrew, “Geographical load balancing with renewables,” ACM SIGMETRICS Performance Evaluation Review, vol. 39, no. 3, pp. 62–66, 2011. [Google Scholar]
14. J. Zheng, A. A. Chien and S. Suh, “Mitigating curtailment and carbon emissions through load migration between data centers,” Joule, vol. 4, no. 10, pp. 2208–2222, 2020. [Google Scholar]
15. C. E. Kelly, J. A. Ging, A. Kansal and M. P. Walsh, “Balancing power systems with datacenters using a virtual interconnector,” IEEE Power and Energy Technology Systems Journal, vol. 3, no. 2, pp. 51–59, 2016. [Google Scholar]
16. C. Ren, D. Wang, B. Urgaonkar and A. Sivasubramaniam, “Carbon-aware energy capacity planning for datacenters,” in Proc. IEEE 20th Int. Symp. on Modeling, Analysis and Simulation of Computer and Telecommunication Systems, Washington, DC, USA, pp. 391–400, 2012. [Google Scholar]
17. A. Radovanovic, R. Koningstein, I. Schneider, B. Chen, A. N. Duarte et al., “Carbon-aware computing for datacenters,” ArXiv, vol. abs/2106.11750, pp. 1–14, 2021. [Google Scholar]
18. E. Ayodele, S. Misra, R. Damasevicius and R. Maskeliunas, “Hybrid microgrid for microfinance institutions in rural areas–A field demonstration in West Africa,” Sustainable Energy Technologies and Assessments, vol. 35, pp. 89–97, 2019. [Google Scholar]
19. T. M. Adeyemi-Kayode, S. Misra and R. Damasevicius, “Impact analysis of renewable energy based generation in West Africa–A case study of Nigeria,” Problemy Ekorozwoju, vol. 16, no. 1, pp. 67–78, 2021. [Google Scholar]
20. A. Adesanya, S. Misra, R. Maskeliunas and R. Damasevicius, “Prospects of ocean-based renewable energy for West Africa's sustainable energy future,” Smart and Sustainable Built Environment, vol. 10, no. 1, pp. 37–50, 2020. [Google Scholar]
21. S. Misra, “A step by step guide for choosing project topics and writing research papers in ICT related disciplines,” in Proc. 3rd Int. Conf. on Information and Communication Technology and Applications, Minna, Nigeria, pp. 727–744, 2021. [Google Scholar]
22. M. Aldossary, “A review of dynamic resource management in cloud computing environments,” Computer Systems Science and Engineering, vol. 36, no. 3, pp. 461–476, 2021. [Google Scholar]
23. J. Almutairi and M. Aldossary, “Investigating and modelling of task offloading latency in edge-cloud environment,” Computers, Materials and Continua, vol. 68, no. 3, pp. 4143–4160, 2021. [Google Scholar]
24. E. Ahvar, S. Ahvar, Z. A. Mann, N. Crespi, R. Glitho et al., “DECA: A dynamic energy cost and carbon emission-efficient application placement method for edge clouds,” IEEE Access, vol. 9, pp. 70192–70213, 2021. [Google Scholar]
25. G. Shen and R. S. Tucker, “Energy-minimized design for IP over WDM networks,” Journal of Optical Communications and Networking, vol. 1, no. 1, pp. 176–186, 2009. [Google Scholar]
26. K. Zhu and B. Mukherjee, “Traffic grooming in an optical WDM mesh network,” IEEE Journal on Selected Areas in Communications, vol. 20, no. 1, pp. 122–133, 2002. [Google Scholar]
27. H. Hu, Y. Wen, T. -S. Chua and X. Li, “Toward scalable systems for big data analytics: A technology tutorial,” IEEE Access, vol. 2, pp. 652–687, 2014. [Google Scholar]
28. B. W. Ang and B. Su, “Carbon emission intensity in electricity production: A global analysis,” Energy Policy, vol. 94, pp. 56–63, 2016. [Google Scholar]
29. S. Tuli, S. Ilager, K. Ramamohanarao and R. Buyya, “Dynamic scheduling for stochastic edge-cloud computing environments using A3C learning and residual recurrent neural networks,” IEEE Transactions on Mobile Computing, vol. abs/2009.0, pp. 1–16, 2020. [Google Scholar]
30. Cisco, “Cisco network convergence system 5500 series data sheet,” 2019. [Google Scholar]
31. A. Shehabi, S. J. Smith, D. A. Sartor, R. E. Brown, M. Herrlin et al., “United States data center energy usage report,” 2016. [Google Scholar]
32. C. Gray, R. Ayre, K. Hinton and R. S. Tucker, “Power consumption of IoT access network technologies,” in Proc. IEEE Int. Conf. on Communication Workshop, London, UK, pp. 2818–2823, 2015. [Google Scholar]
33. ZTE CORPORATION, “ZXA10 c300 hardware description,” 2017. [Online]. Available: https://enterprise.zte.com.cn/en/products/network_lnfrastructure/broadband_access/xpon_onu/201312/t20131209_414454.html. [Accessed: 25-Sep-2021]. [Google Scholar]
34. Cisco, “Cisco nexus 9300-EX and 9300-FX platform switches,” 2017. [Google Scholar]
35. Cisco, “Cisco CRS-1 4-slot single-shelf system,” 2014. [Google Scholar]
36. Cisco, “Cisco ONS 15454 40 gbps CP-DQPSK full C-band tuneable transponder card,” 2012. [Google Scholar]
37. MRV, “EDFA optical amplifiers,” 2012. [Google Scholar]
38. Glimmerglass, “Intelligent optical system 600,” Glimmerglass, 2013. [Online]. Available: https://www.documentcloud.org/documents/815849-809-glimmerglass-brochure-specifications. [Accessed: 25-Sep-2021]. [Google Scholar]
39. A. Q. Lawey, T. E. H. El-Gorashi and J. M. H. Elmirghani, “Distributed energy efficient clouds over core networks,” Journal of Lightwave Technology, vol. 32, no. 7, pp. 1261–1281, 2014. [Google Scholar]
40. Google Maps, “Saudi Arabia-google maps,” 2021. [Online]. Available: https://www.google.co.uk/maps/place/Saudi+Arabia/. [Accessed: 16-Nov-2021]. [Google Scholar]
 | This work is licensed under a Creative Commons Attribution 4.0 International License, which permits unrestricted use, distribution, and reproduction in any medium, provided the original work is properly cited. |