DOI:10.32604/cmc.2022.026064
| Computers, Materials & Continua DOI:10.32604/cmc.2022.026064 | |
| Article |
Heart Disease Diagnosis Using the Brute Force Algorithm and Machine Learning Techniques
1Department of Computer Science and Engineering, Kongju National University, Cheonan, 31080, Korea
2Department of Computer Science, COMSATS University Islamabad, Wah Campus, 47040, Pakistan
3School of Computer Science, University of Sydney, Sydney, NSW 2006, Australia
4Centre of AI and Data Science, Edinburgh Napier University, Edinburgh, EH11 4DY, UK
*Corresponding Author: Jungeun Kim. Email: jekim@kongju.ac.kr
Received: 14 December 2021; Accepted: 11 February 2022
Abstract: Heart disease is one of the leading causes of death in the world today. Prediction of heart disease is a prominent topic in the clinical data processing. To increase patient survival rates, early diagnosis of heart disease is an important field of research in the medical field. There are many studies on the prediction of heart disease, but limited work is done on the selection of features. The selection of features is one of the best techniques for the diagnosis of heart diseases. In this research paper, we find optimal features using the brute-force algorithm, and machine learning techniques are used to improve the accuracy of heart disease prediction. For performance evaluation, accuracy, sensitivity, and specificity are used with split and cross-validation techniques. The results of the proposed technique are evaluated in three different heart disease datasets with a different number of records, and the proposed technique is found to have superior performance. The selection of optimized features generated by the brute force algorithm is used as input to machine learning algorithms such as Support Vector Machine (SVM), Random Forest (RF), K Nearest Neighbor (KNN), and Naive Bayes (NB). The proposed technique achieved 97% accuracy with Naive Bayes through split validation and 95% accuracy with Random Forest through cross-validation. Naive Bayes and Random Forest are found to outperform other classification approaches when accurately evaluated. The results of the proposed technique are compared with the results of the existing study, and the results of the proposed technique are found to be better than other state-of-the-art methods. Therefore, our proposed approach plays an important role in the selection of important features and the automatic detection of heart disease.
Keywords: Heart; disease; brute force; machine learning; feature selection
Heart disease is a life-threatening disease that can lead to heart failure. Heart disease is an important disease that affects heart function and creates problems such as reduced blood vessel function and coronary artery infection [1,2]. Heart disease is also known as a cardiovascular disease that causes death around the world. The heart is a muscular organ that pumps blood throughout the body. Heart disease refers to a variety of problems that affect the heart and blood arteries. Examples of various types of heart disease include coronary artery disease, angina, heart attack, and heart failure. Coronary heart disease (CHD) is one of the leading causes of illness and mortality in today's society. The cost of treating coronary artery disease is a significant financial burden, making prevention of coronary artery disease a critical step in therapy. A heart attack occurs when a coronary artery suddenly becomes blocked, usually by a blood clot. The various types of cardiovascular disease are high blood pressure, coronary artery disease, heart valve disease, and stroke. According to the world health organization, 17.7 million individuals passing brought about the cardiovascular disease [3]. It is fundamental that people determine how to understand and control cardiovascular disease unintended factors, for example, a healthy diet, physical exercise, and a doctor's medication for blood pressure, cholesterol, and weight. To anticipate heart disease in an early stage, a handful of deaths can be prevented.
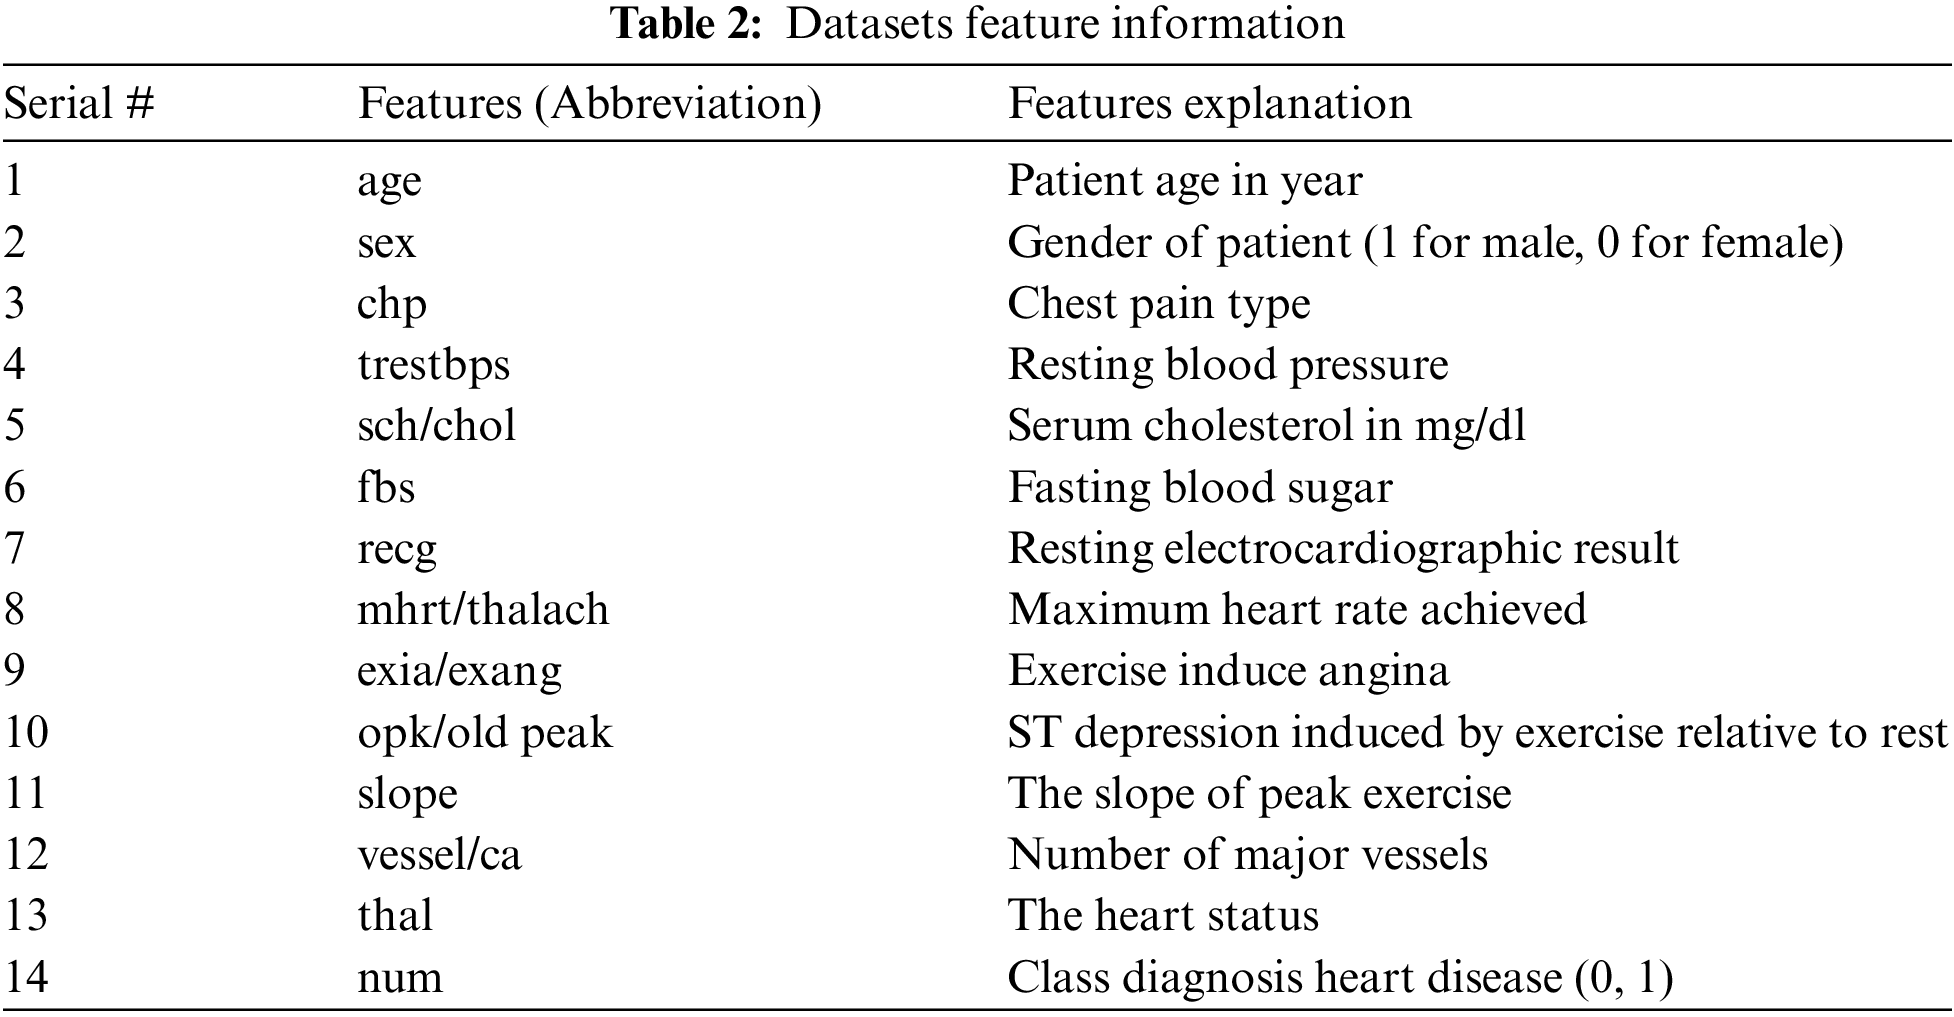
The diagnosis of heart disease involves numerous factors that complicate the task of a physician. Basic properties utilized for heart sickness are age, gender, fasting blood sugar, chest pain type, resting ECG, huge fluoroscopic shad vessels, test blood pressure (hypertension), serum cholesterol (coronary disease hazard), thalach (greatest pulse), ST gloom, fasting glucose, exang (including angina), smoke, hypertension, Food inclination, weight, height and stiffness [4]. Chest pain, arm pain, slow and lightheadedness, fatigue, and sweating are some of the early warning signs of a heart attack [5]. For diagnosing heart conditions, data mining and ensemble techniques are used, whose finding is most credible and precise [6,7]. Due to numerous risk factors, such as cholesterol, diabetes, high blood pressure, and many other factors, diagnosing the disease in patients is challenging. Patients with heart disease will not feel ill in the early stages of the disease, but they do in the later stages. Then it is too late to recover harm [8]. There are some other methods which are used for human activity using LSTM (Long short-term memory) [9]. Machine learning methods are also considered for the prediction of Coronavirus disease [10]. So American health association indicated that expanses of health care related to heart disease are estimated to double by 2030 [11]. Every country has more hospitals and more patient records due to the growth of the population. Most hospitals maintain patient health information, but it is hardly used for decision making because sometimes the doctor does not have enough time to examine patient data from the large database. To extract relevant information from a huge database, data mining techniques are needed.
Data mining is referred to as information finding in the database since it incorporates several techniques in various fields such as machine learning, neural networks, and retrieval of information. To extract information, data mining is essential to find a hidden pattern, build analytical structures, perform clustering, classification, and regression with meditation. The application mining method should identify patterns at different levels of abstraction [12]. In medical research, there is extensive raw data that needs to be processed and then used to predict heart disease. Data analysis may involve machine learning algorithms and other data mining methods. In [13], higher accuracy is expected to be achieved, but it is not easy. For this purpose, some techniques and future selection methods to help the clinical industry achieve high accuracy. The data mining methods that are utilized in the medical sector need less time to diagnose heart disease with accurate results [14]. Seven machine learning algorithms are used with three feature selection methods to identify healthy and unhealthy patients. This analysis evaluated complete features, reduced feature set, and positive arc classifier under ARC computed for execution time and reduction in accuracy of the effect of features on classifiers [15]. The application of machine learning brings a new dimension to medical diagnosis, drug discovery processes, and the field of radiation therapy and eliminates the training cost to predict the disease.
Predictions of heart disease approaches have been developed in previous research using the Internet of Things (IoT) platform. To predict heart failure, patient information is analyzed with a support vector machine (SVM). IoT devices are used to collect heart data, such as pulse, blood temperature, and blood pressure (BP). The method is used successfully for the detection of heart failure. The suggested solution recognizes cardiovascular disorders quickly; however, accuracy decreases when a significant amount of data is used [16]. A fuzzy analytical hierarchy (FAHP) technique is developed to assess the risk of a heart attack. The authors estimate the weights on the basis of many parameters that influence cardiovascular growth. Only where a high risk of heart attack has been observed, the proposed system requires monitoring. The device successfully identifies the initial results for medical professionals before prescribing expensive clinical tests. This technology reduces the cost of goods and the amount of resources used [17].
Previous studies show that previous approaches for heart disease prediction are not sufficient. These studies are carried out to restrict the selection of features for algorithms. Therefore, the identification of significant features and machine learning methods are essential to improve the performance of heart disease. The objective of this research work is to find significant features and machine learning algorithms to diagnose and improve the accuracy of heart disease performance. The selection of these significant features is important to eliminate redundant and inconsistent data. After that, analysis of various data from clinical centers and machine learning algorithms are useful to improve heart disease performance. The following are the main contributions of this study paper:
• In this paper, significant features are selected to remove redundant and inconsistent data using the brute-force algorithm that increases the efficiency of the prediction model.
• We find a superior performance machine learning algorithm using cross-validation and split validation that will be applied to the diagnosis of heart disease.
• Heart disease is predicted using three commonly used state-of-the-art datasets, namely Statlog, Cleveland, and Hungarian.
• The experimental results showed that the proposed technique achieved 97% accuracy with Naive Bayes through split validation and 95% accuracy with Random Forest through cross-validation and the results are better than previous state-of-the-art methods.
• This research study offers credible assistance to health and medical professionals with significant modifications in the healthcare industry, and immediate resolution is obtained during the diagnosis of disease.
The rest of the article is structured as follows. The proposed methodology is shown in Section 2. Section 3 describes the performance evaluation. Section 4 describes the experimental results, including a discussion and comparative analysis. Section 5 discusses the conclusion and future work.
This section consists of four main phases, namely data preprocessing techniques, feature selection method, validation method, and machine learning algorithms. The implementation of the proposed model methodology is illustrated in Fig. 1.
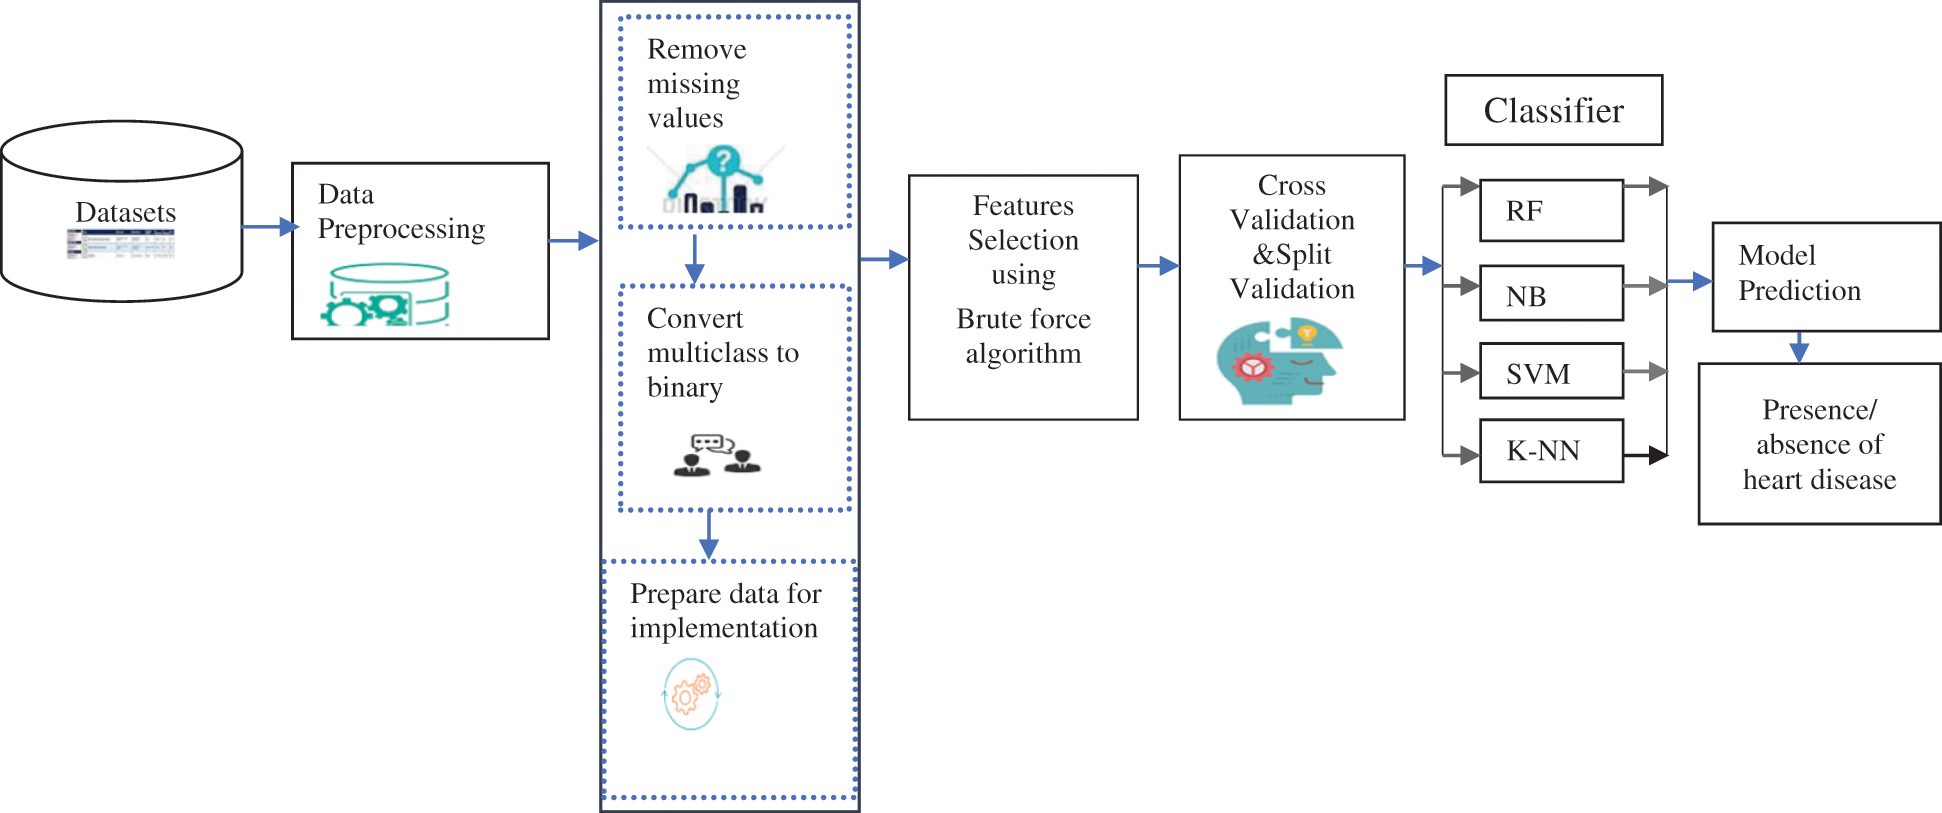
Figure 1: The framework of the proposed methodology
Pre-processing is the first phase of the diagnostic method. It requires three steps: replace missing attributes and remove redundancy, convert multiclass to binary class, and separate. If most of the attribute values of a patient match, a value is replaced by a similar position. In datasets, some instances have blank entries that are handled by preprocessing. By eliminating redundant (irrelevant) attributes, eliminating redundancy reduces the size of the data. Silent data helps diagnose patterns associated with heart disease effectively. The noise reduction procedure improves the process of identifying heart disease. Data preprocessing is done by removing missing values, removing redundancy, and converting the multiclass class to binary to extract appropriate and usable data from the datasets. The Cleveland dataset contains 303 entries with 13 attributes with missing values and one attribute as a final class attribute. They require preprocessing, noise reduction, and replacement of missing data. After applying to preprocessing, 297 records are used in the implementation. The meticulous value of the Cleveland dataset (0 for absence and 1, 2, 3, 4 for occurrence) is converted to a binary class in a preprocessing step. The Statlog dataset consists of 270 records with 13 attributes with no missing values. The class attribute ‘num’ has two values 1 and 2 converted to 0 and 1 before implementation. The Hungarian dataset consists of 261 records with 11 attributes after missing values are removed. The class attribute ‘num’ has two values 0 and 1.
To assess how each attribute participates in predicting performance, a feature selection technique is used. Feature selection is a search technique used to identify a subset of features. The method of reducing the feature to a minimal subset of features is called feature selection. It is a widely used optimization method and problem in machine learning [18].
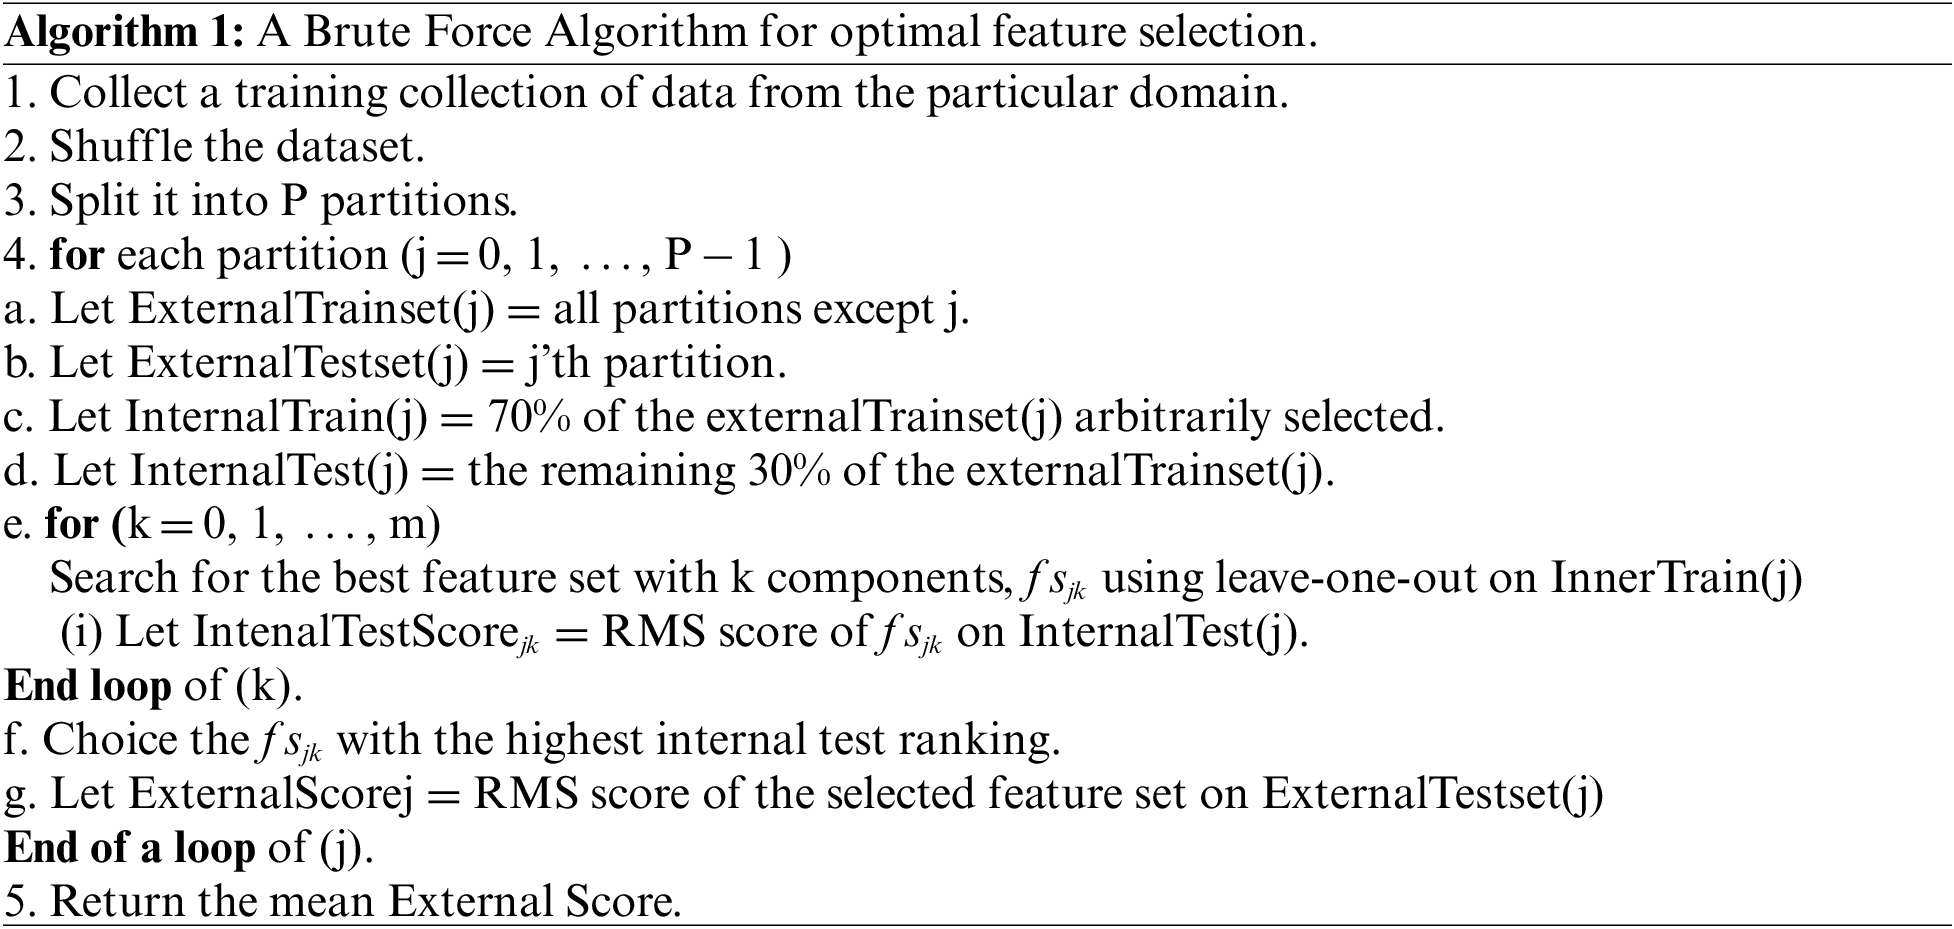
Feature selection is an important method to use prior to model construction to minimize data complexity by excluding irrelevant and useless features from the data. Feature selection methods reduce the size of data, allowing to train and test the model in less time. Feature selection is advantageous, as it reduces data size, reducing processing time, space, and power use [19]. In this research study, a brute-force algorithm extracts the features and selects the optimal feature that gives a better impact on accuracy than other feature selection techniques. Irrelevant features can cause overlap. Our goal, for example, is to conclude the connection between symptoms and their corresponding diagnosis in the field of medical diagnosis. The brute force feature selection process tests all possible combinations of the input functions and finds the best subset. The brute force algorithm attempts to solve a problem through a large number of patterns. It is a straightforward approach to solving a problem. Typically, this approach requires a direct calculation based on the problem statement. Select and compare the number with all other numbers. The method of choosing brute force comprehensively analyzes all possible variations of the input features and then finds the best subset. The computational cost of an exhaustive search is prohibitively high, with a significant risk of overfitting. The approach to choosing brute force features is to carefully evaluate all possible input combinations and then find the correct subset.
In this research study, feature selection is done first using Algorithm 1. The optimized feature set is used as input for well-organized and established classifiers. Two loops are used in Algorithm 1. The first loop is used to find the subset of features and the second loop is used to evaluate the performance of the brute-force algorithm. This comprehensive feature selection strategy is a wrapper for the evaluation of brute-force feature subsets. The algorithm will choose each combination, compute its score, and then determine the optimal combination based on its score
In this study, we used two validation techniques: K-fold cross-validation and split validation. Cross-validation of K-folds is a method of separating data into subsets for training and model testing. This method is often used for prediction models to determine how the built model implements unseen data. Typically, a model is trained in predictive analytics on an accessible dataset with the required class labels. When the model is designed, it is used to test a new dataset with unknown output labels to assess the achievement of the model [19]. Cross-validation is a resampling method that tests the learning of machine learning models on a small-scale dataset. A single parameter called k is used to calculate the number of different classes in a given dataset. Split validation consists of two subprocesses: training and a test process. The training process is used to build a model. The learned model is then added to the test process. In this research, both cross-validation and split validation are used to train and test the model.
2.4 Machine Learning Algorithms
This section explains the machine learning algorithms. After the selection of features, the machine learning algorithms are used to find the best prediction performance for heart disease.
Random Forest is an ensemble-based learning method not only for classification but also for regression and many other decision-based tasks. The random forest deals with missing values and is effective for large datasets. Combine many decision trees in a single model. The overfitting is not faced if the tree is enough. In prediction and likelihood estimation, the RF algorithm has been used. RF has several decision-making trees. Any judgment tree gives a vote that shows the judgment on the class of the object. Three essential tuning parameters are available in the random forest (1) Number of nodes (tree n) (2) Minimum node size (3) Number of features used to split each node (4) Number of features used to split each node for each tree.
SVM is a supervised learning technique and an associated learning algorithm that analyzes data for regression and classification techniques. Identify the optimal route. SVM separates the data into two classes by creating a separate line. It is a good and fast algorithm that is equally useful for both classification and regression. In a vast dimensional space, SVM generates a hyperplane, or a set of a hyperplane used for regression, classification, and various other tasks.
SVM is based on the concept of structural risk minimization (SRM), which states that a machine learning algorithm should attempt to reduce structural risk rather than empirical risks to achieve good generalization results [20].
Naive Bayes is a form of data extraction that reveals the effectiveness of classifying patients diagnosed with heart disease [21]. It is known as the simplest Bayesian network model. By applying the Bayesian theorem with the strong independent assumption, the naive Bayesian is considered a simple probabilistic classifier. It is a high-bias, low-variance classifier. Building a good model is useful for relatively small datasets. Naive Bayesian areas are text categorization, spam detection, sentiment analysis, and recommended systems. It is suitable for both numerical and nominal data with multiple dimensions.
To find the most probable possible classifications, Naive Bayes relies on probability theory [22]. Naive Bayes classifier assumes, in simple terms, that the presence or absence of a specific class attribute is independent of the presence or absence of some other class attribute. It is also used to determine the posterior possibilities of the findings and to make better decisions about probability [23].
In feature space, the K-NN classification depends on the closest training examples [24]. K-NN is a comparison technique that takes place between a training example and an unknown example. Closeness based on distance formulas in an n-dimensional space, an attribute in the training dataset, defines it. Second, K-NN ranks based on a majority vote in the neighbors they meet. The most common Euclidean distances are used to calculate the distance of all neighbors. K-NN implies that identical cases exist side by side and closest neighbors contribute to the final class forecast [25]. It is a simple method to implement in the shortest possible time.
This section describes the datasets and evaluation metrics used in our experiments.
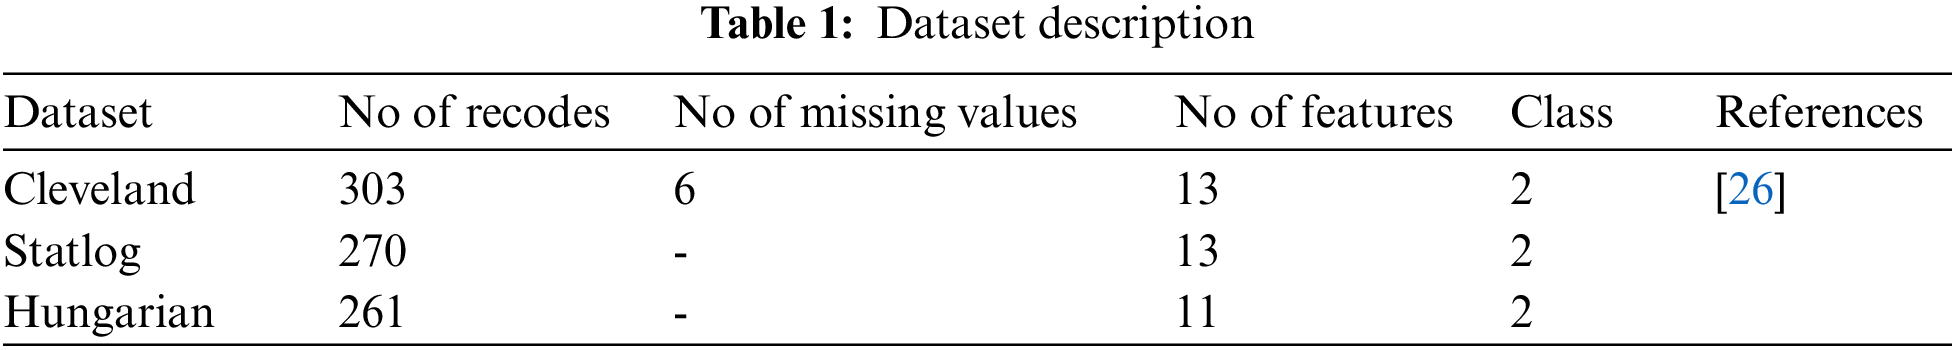
The datasets used for the construction of predictive models from an online UCI (University of California-Irvine) repository [26]. Various datasets are available in the UCI repository. Three heart disease datasets, such as the Cleveland, Statlog, and Hungary datasets, are downloaded from the University of California-Irvine ML (machine learning) repository. There are 76 attributes and 303 records in the Cleveland dataset, but the dataset contained in the repository only provides information for 14 subsets of attributes. In the “goal” field, the presence of heart disease in the patient is indicated by a number that can range from 0 (no presence) to 4. Experiments in the Cleveland database have focused on distinguishing the existence of disease (values 1–4) from non-existence (value 0) [27]. In Cleveland, the dataset for the target attributes “num” resulted in 160 heart disease absence records and 137 heart disease presence records. The statlog dataset contains 270 records with 13 attributes with no missing values. In the statlog dataset for the target “num” attributes, 150 heart disease absence records and 120 heart disease presence records are obtained. The Hungarian dataset consists of 261 records with 11 attributes after removing missing values. A total of 34 database samples are deleted due to missing values, leaving 261 samples. Heart disease is absent in 62.5% of the class and prevails in 37.5% of the class [28]. Each dataset has different records and information from numerous patients. Tab. 1 explains a brief overview of the datasets and Tab. 2 describes the features used in the datasets. All features are used in the Cleveland and Statlog dataset. However, in Hungarian datasets, excluding ca, all slope attributes are used with different numbers of records. We chose these datasets for heart disease diagnostics because they are state-of-the-art, easily accessible, and publicly available datasets. Most of the researchers used these datasets for heart disease prediction. Some of the more recent studies that used the same datasets are [29–34].
It is essential to evaluate the performance of the algorithm before its application in the medical industry. For the evaluation of the comparison results, a confusion matrix is used. In this study, the results of the prediction model are compared to three standard performance measures, namely precision, specificity, and sensitivity. Accuracy is the simplest and most widely used performance measure. It is calculated by adding true positive and true negative values and dividing them by all observed values. Eq. (1) shows how accuracy will be calculated with the formula. A true positive result is one in which the model accurately predicts the positive class. A true negative, on the other hand, is a result in which the model properly predicts the negative class. A false positive is an outcome in which the model forecasts the positive class inaccurately. A false negative is an outcome in which the model forecasts the negative class inaccurately.
Sensitivity measures the proportion of true negatives that are correctly identified. It are used when the data is unbalanced. The formula used to measure sensitivity is shown in Eq. (2).
Specificity measures the proportion of true positives that are correctly identified. It is calculated by Eq. (3).
4 Experimental Results and Discussion
This section presents the results achieved by the proposed model. The effectiveness of the classifiers is demonstrated using three standard measures: accuracy, sensitivity, and specificity. Four classification algorithms are also utilized for every dataset to compare its prediction performance with the proposed model. Forecast models are built using thirteen features and accuracy is measured using performance evaluation methods. To investigate the influence of the algorithm that affects the most, the results with cross-validation and split validation are compared and show how the proposed feature optimization method works better than other techniques. In the k-fold cross-validation, the dataset is split into k of equivalent size, the classifier is divided into K − 1 groups, and the performance at every step is estimated utilizing the remaining section. The validation cycle is repeated k times. The performance of the classifier is calculated from the k results. Cross-validation uses a variety of k-values. In our experiment, k = 10 is selected because it works well. The technique is repeated ten times for each step of the process, and prior to acquiring and testing a new set for the next cycle, the instances of the training and estimation group are randomly distributed throughout the data collection [35,36]. Finally, at the end of the 10-time cycle, all output metrics are calculated. In split validation, the data are distributed into training and testing phases. We divide 70% of the data into training and 30% into testing. Tabs. 4–6 describe the accuracy of the three datasets through cross-validation achieved by the machine learning technique with the combination of features applied in the model. The best 87% accuracy is presented in Tab. 3 with four attributes of the SVM algorithm. The accuracy of the Statlog dataset is listed in Tab. 4, and the results of the Hungarian dataset are shown in Tab. 5. According to Tab. 4, the highest accuracy is 93% achieved by K-NN. In Tab. 5, RF gave the best result with eight optimal features. The accuracy of the proposed model for three datasets with split validation is shown in Tabs. 6–8. In Tab. 6, NB and SVM gave the best accuracy of 91%. Tab. 7 shows, with ten optimal features, that NB achieved the highest accuracy. Tab. 8 also summarizes the accuracy achieved by SVM. The performance of the proposed method is trained and evaluated with three datasets; it is found that the proposed model chooses the optimal features and gave better accuracy. In the case of cross-validation of general datasets, the random forest gave the best 95% accuracy, with eight optimal features: thalach, vessel, sex, chp, thal, slope, opk/oldpeak, fbs, and exian. naive bayes achieved 97% accuracy following the features cp, oldpeak, ca, slope, exang, thal, chol, sex, thalch, fbs. In terms of accuracy, sensitivity, and specificity, split validation outperforms cross-validation. The results obtained with both validation methods are better than existing studies. Tab. 9 shows the specificity and sensitivity of all datasets using cross-validation and split validation. The highest 100% sensitivity is achieved by a random forest from the Cleveland and Hungary datasets using cross-validation. From the Statlog dataset, 100% sensitivity is achieved with a random forest. In case of split validation, 100% specificity is achieved from the Cleveland dataset using four classifiers. By using all four classifiers, 100% sensitivity is achieved for the Statlog dataset. Fig. 2 shows the line graph for the sensitivity of all datasets using cross-validation and split validation. Fig. 3 shows the line graph for the specificity of all datasets using cross-validation and split validation.
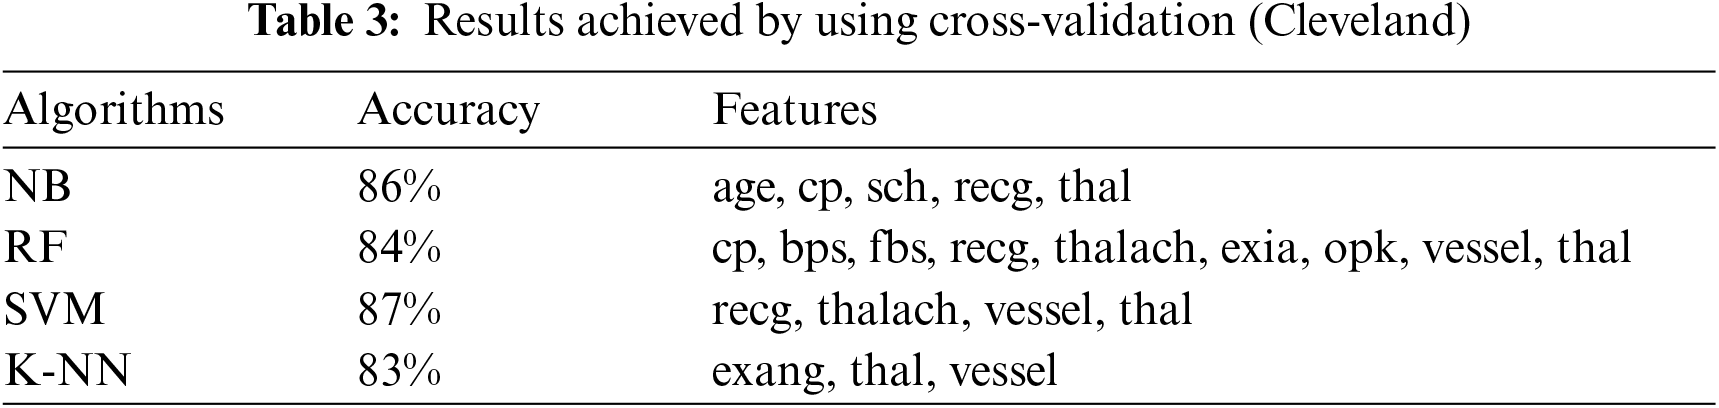
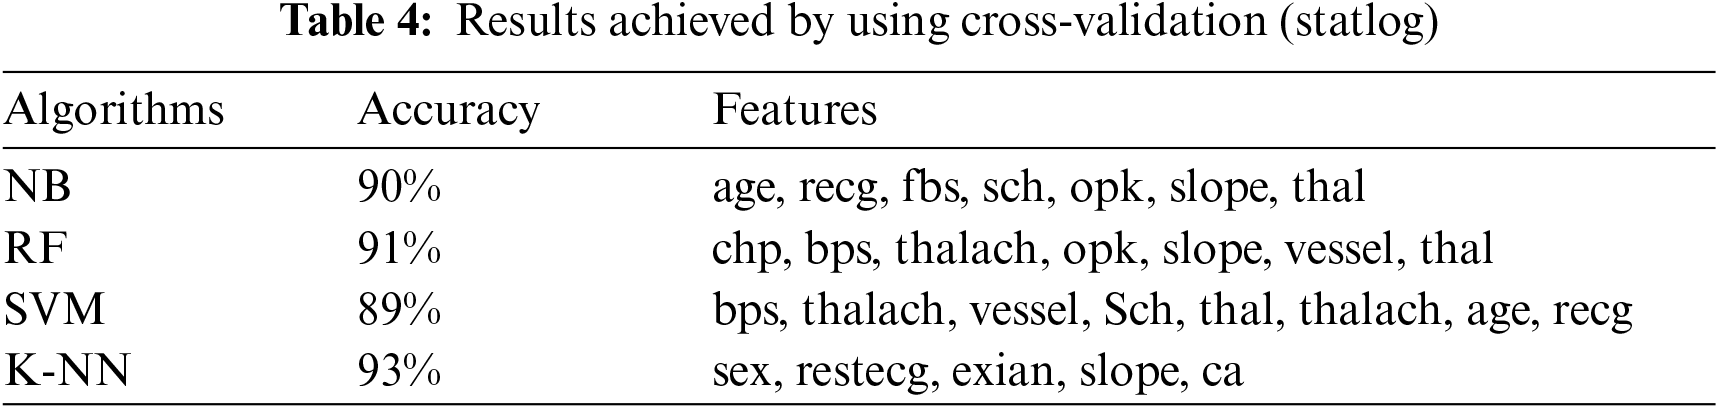
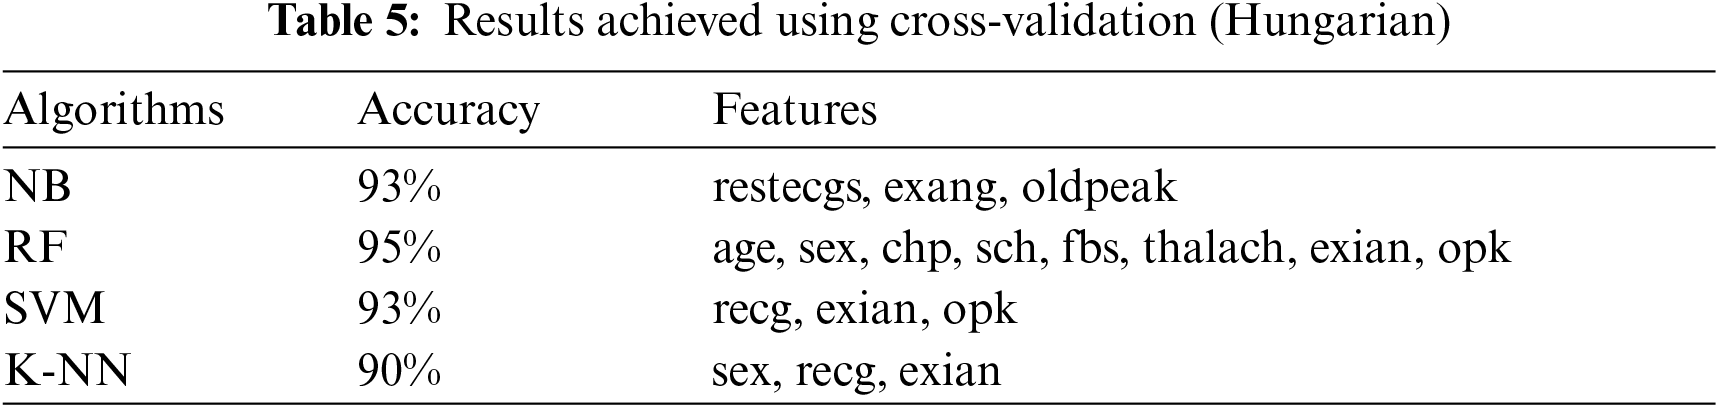
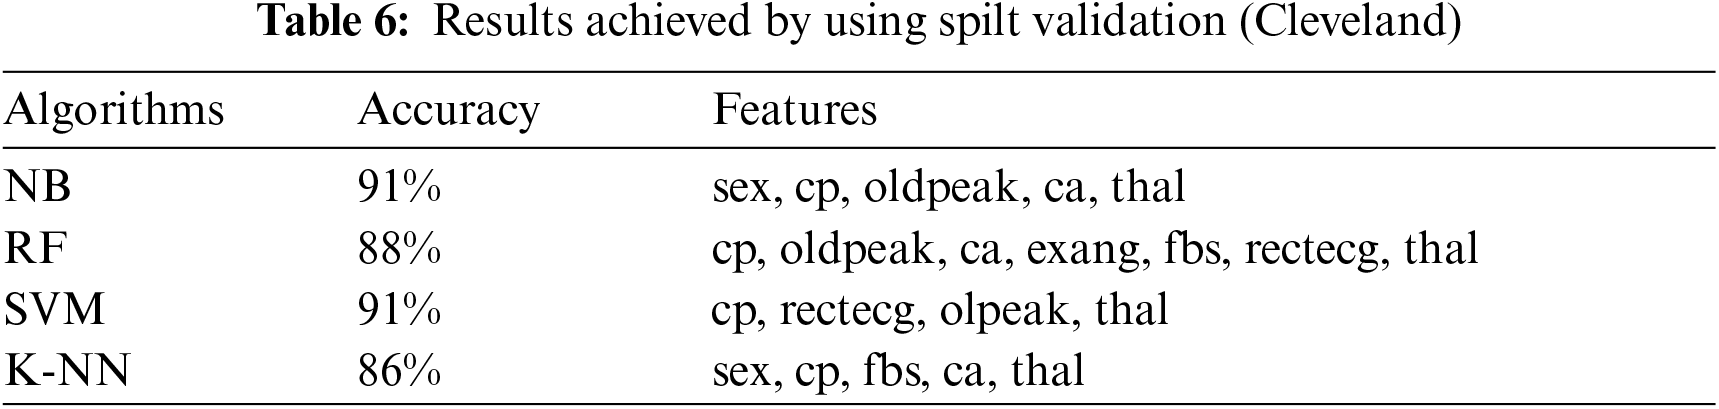
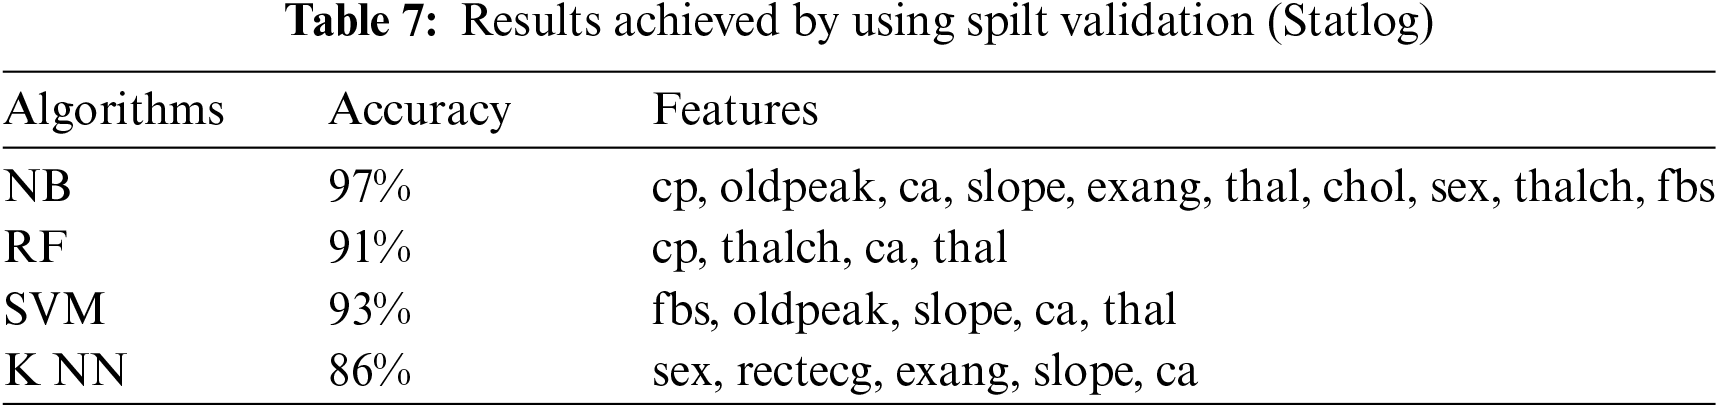
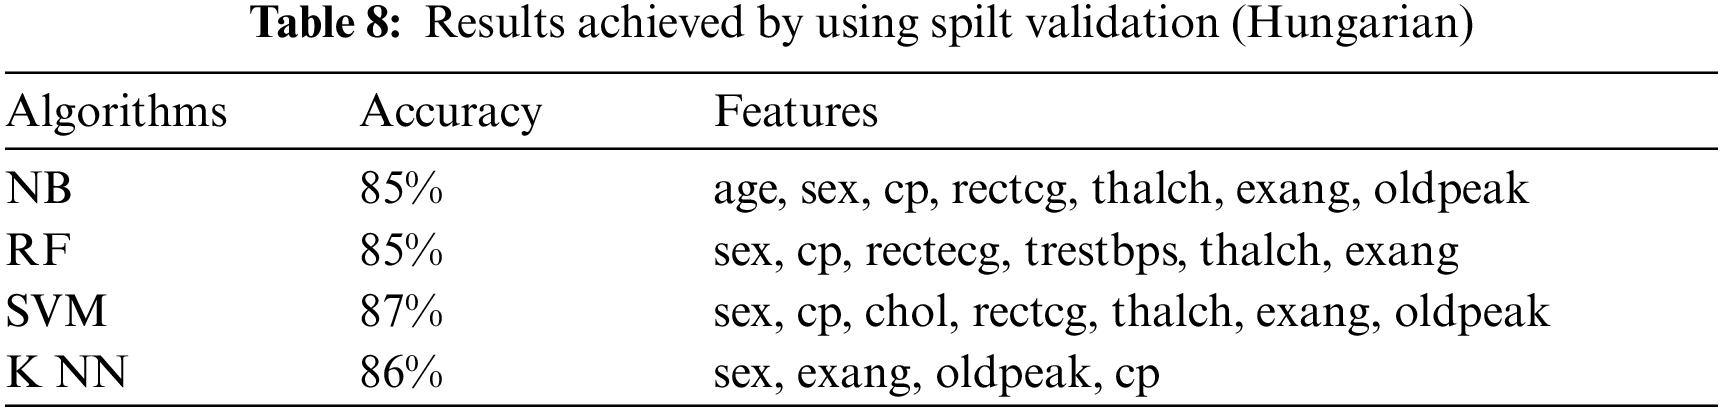
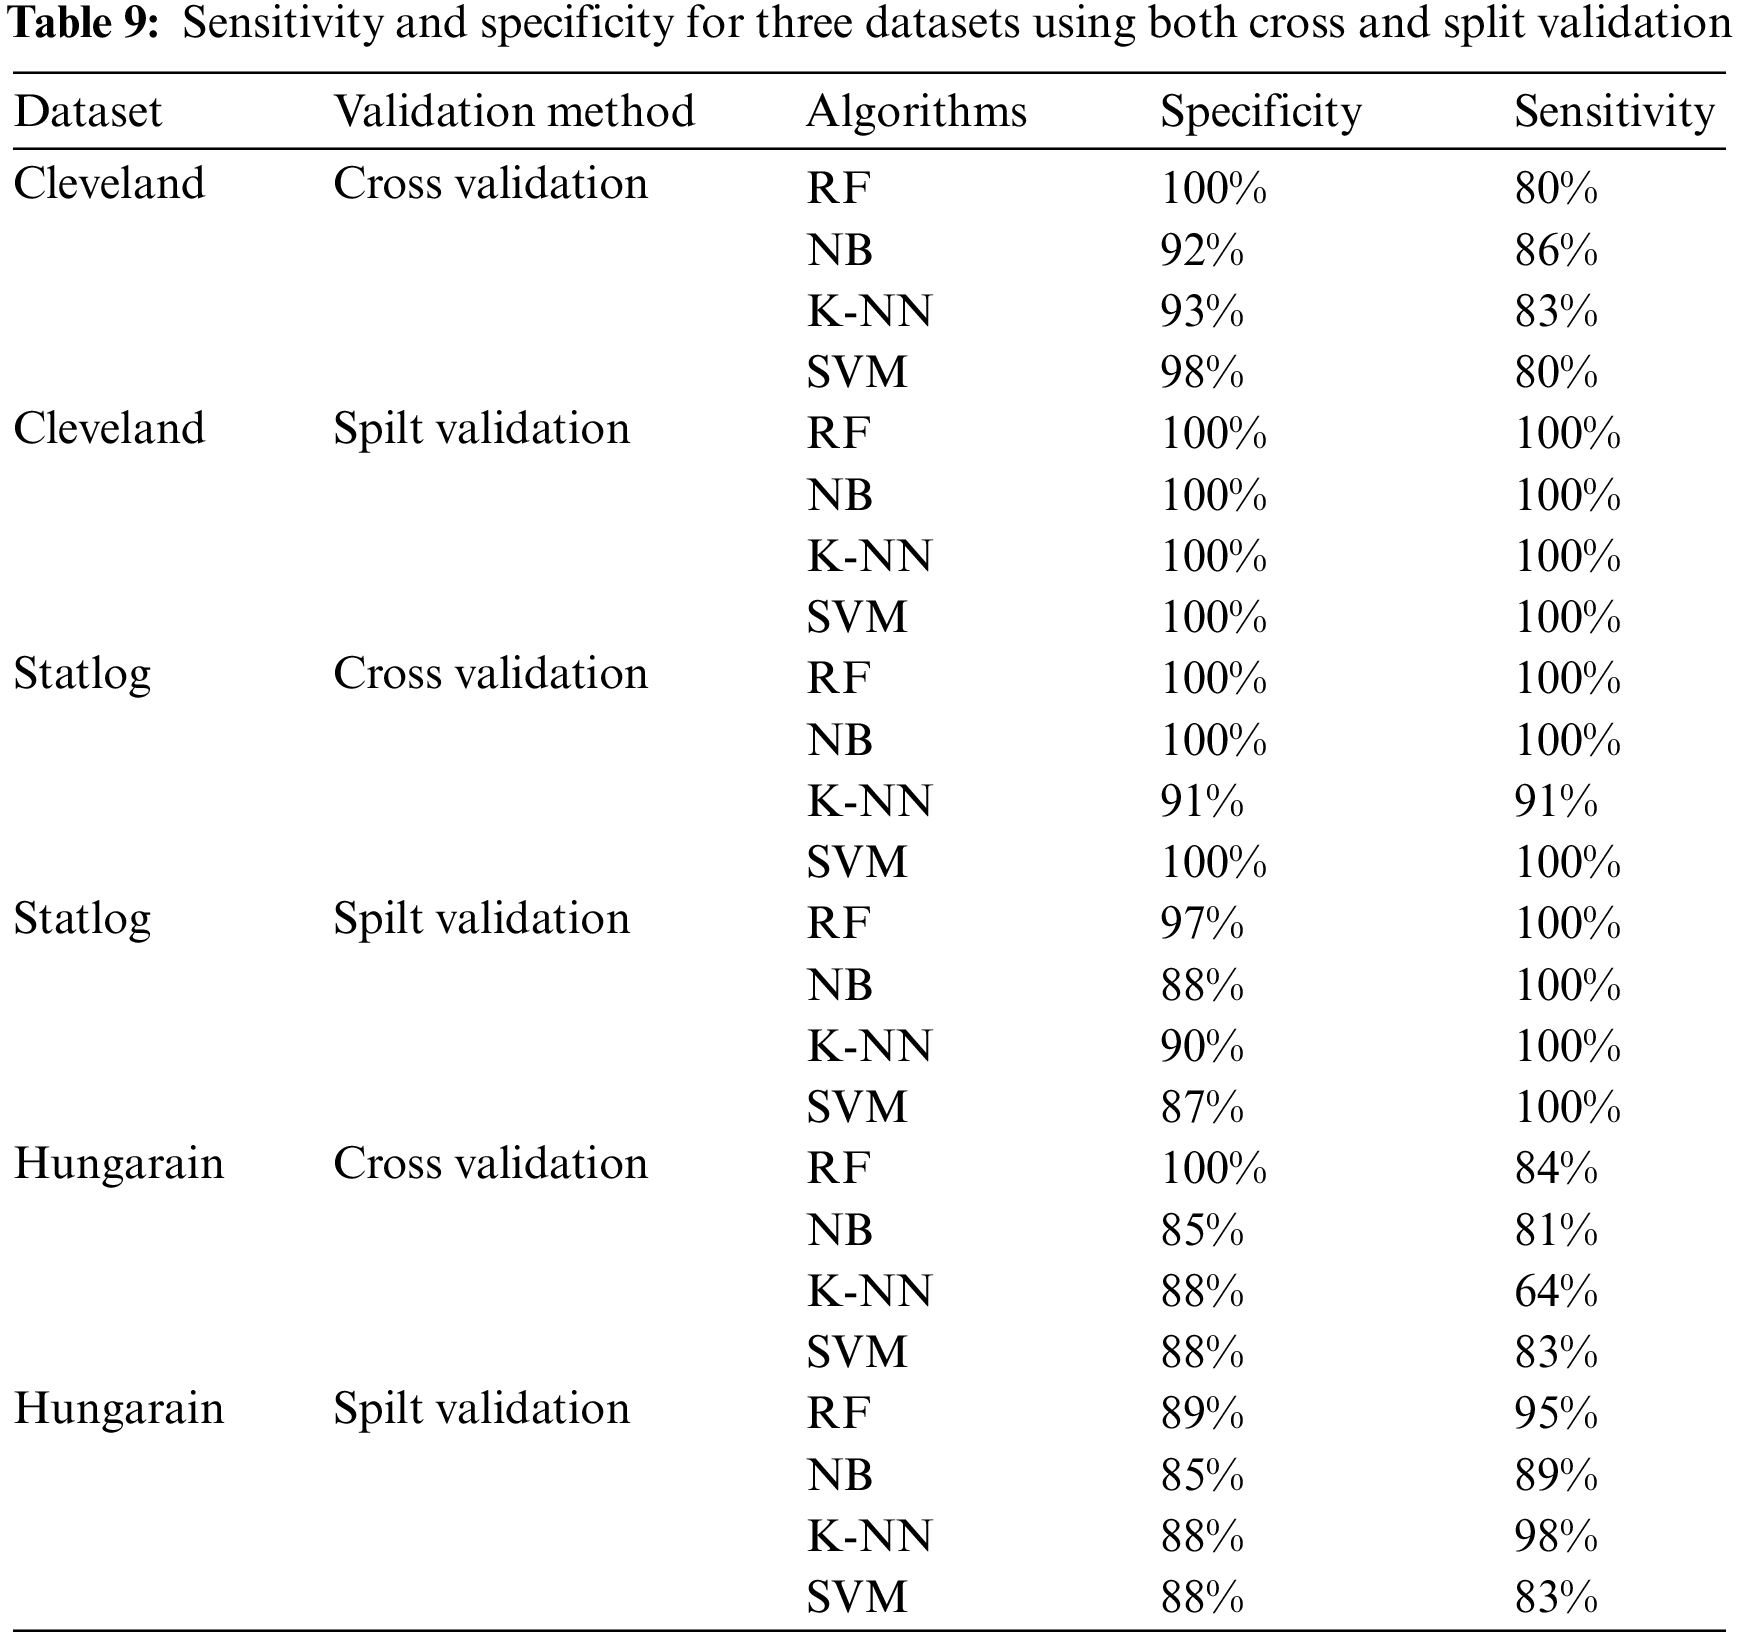
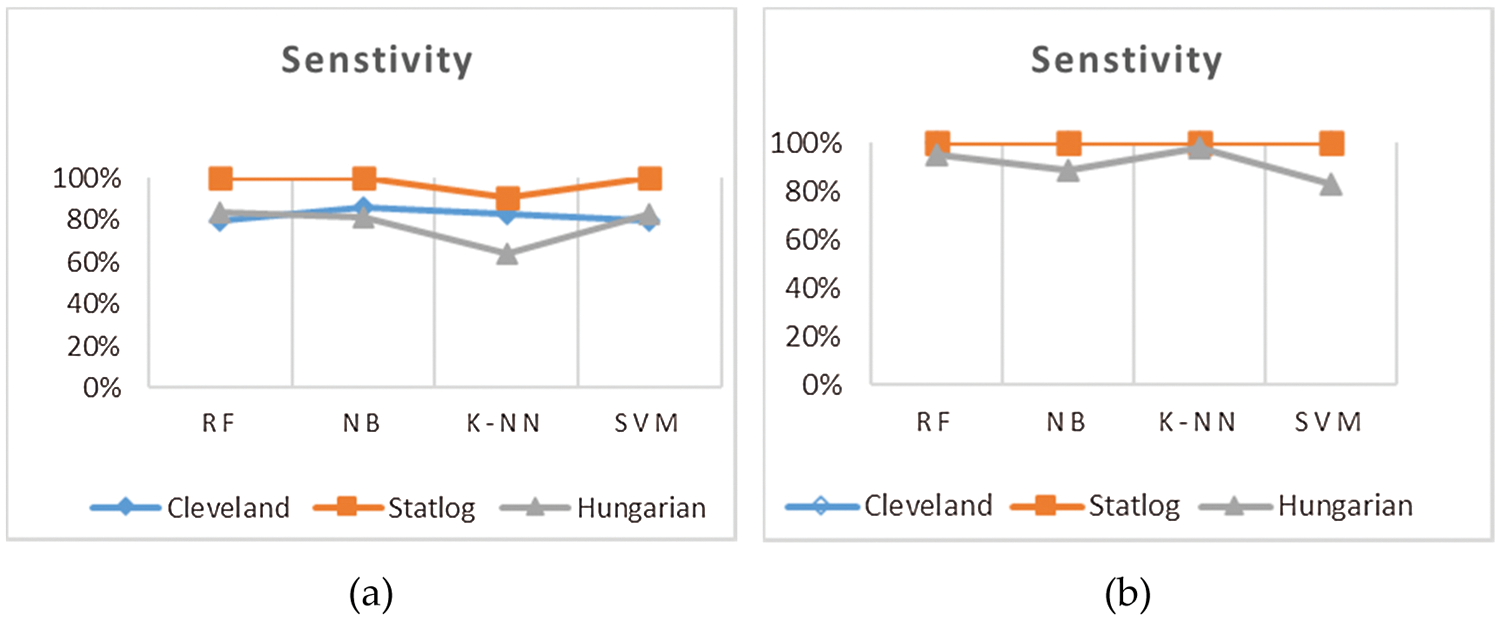
Figure 2: Sensitivity of cross-validation (a) and split validation (b)
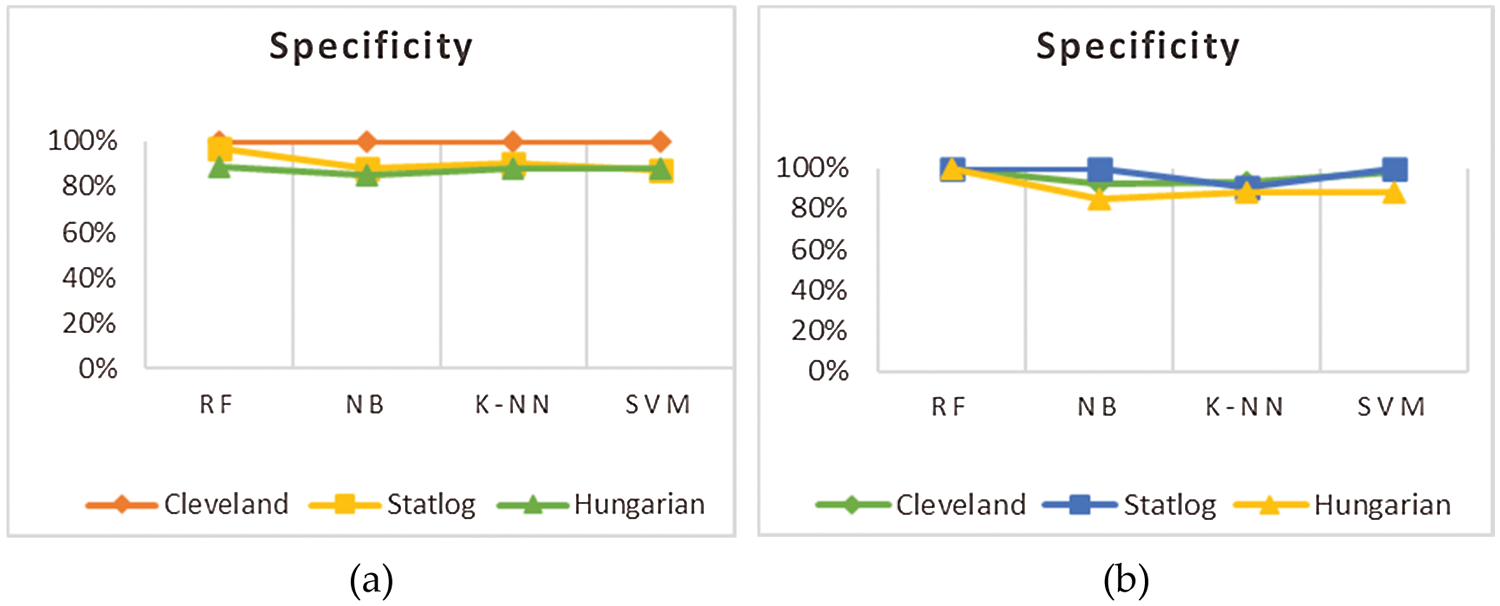
Figure 3: Specificity of cross validation (a) and split validation (b)
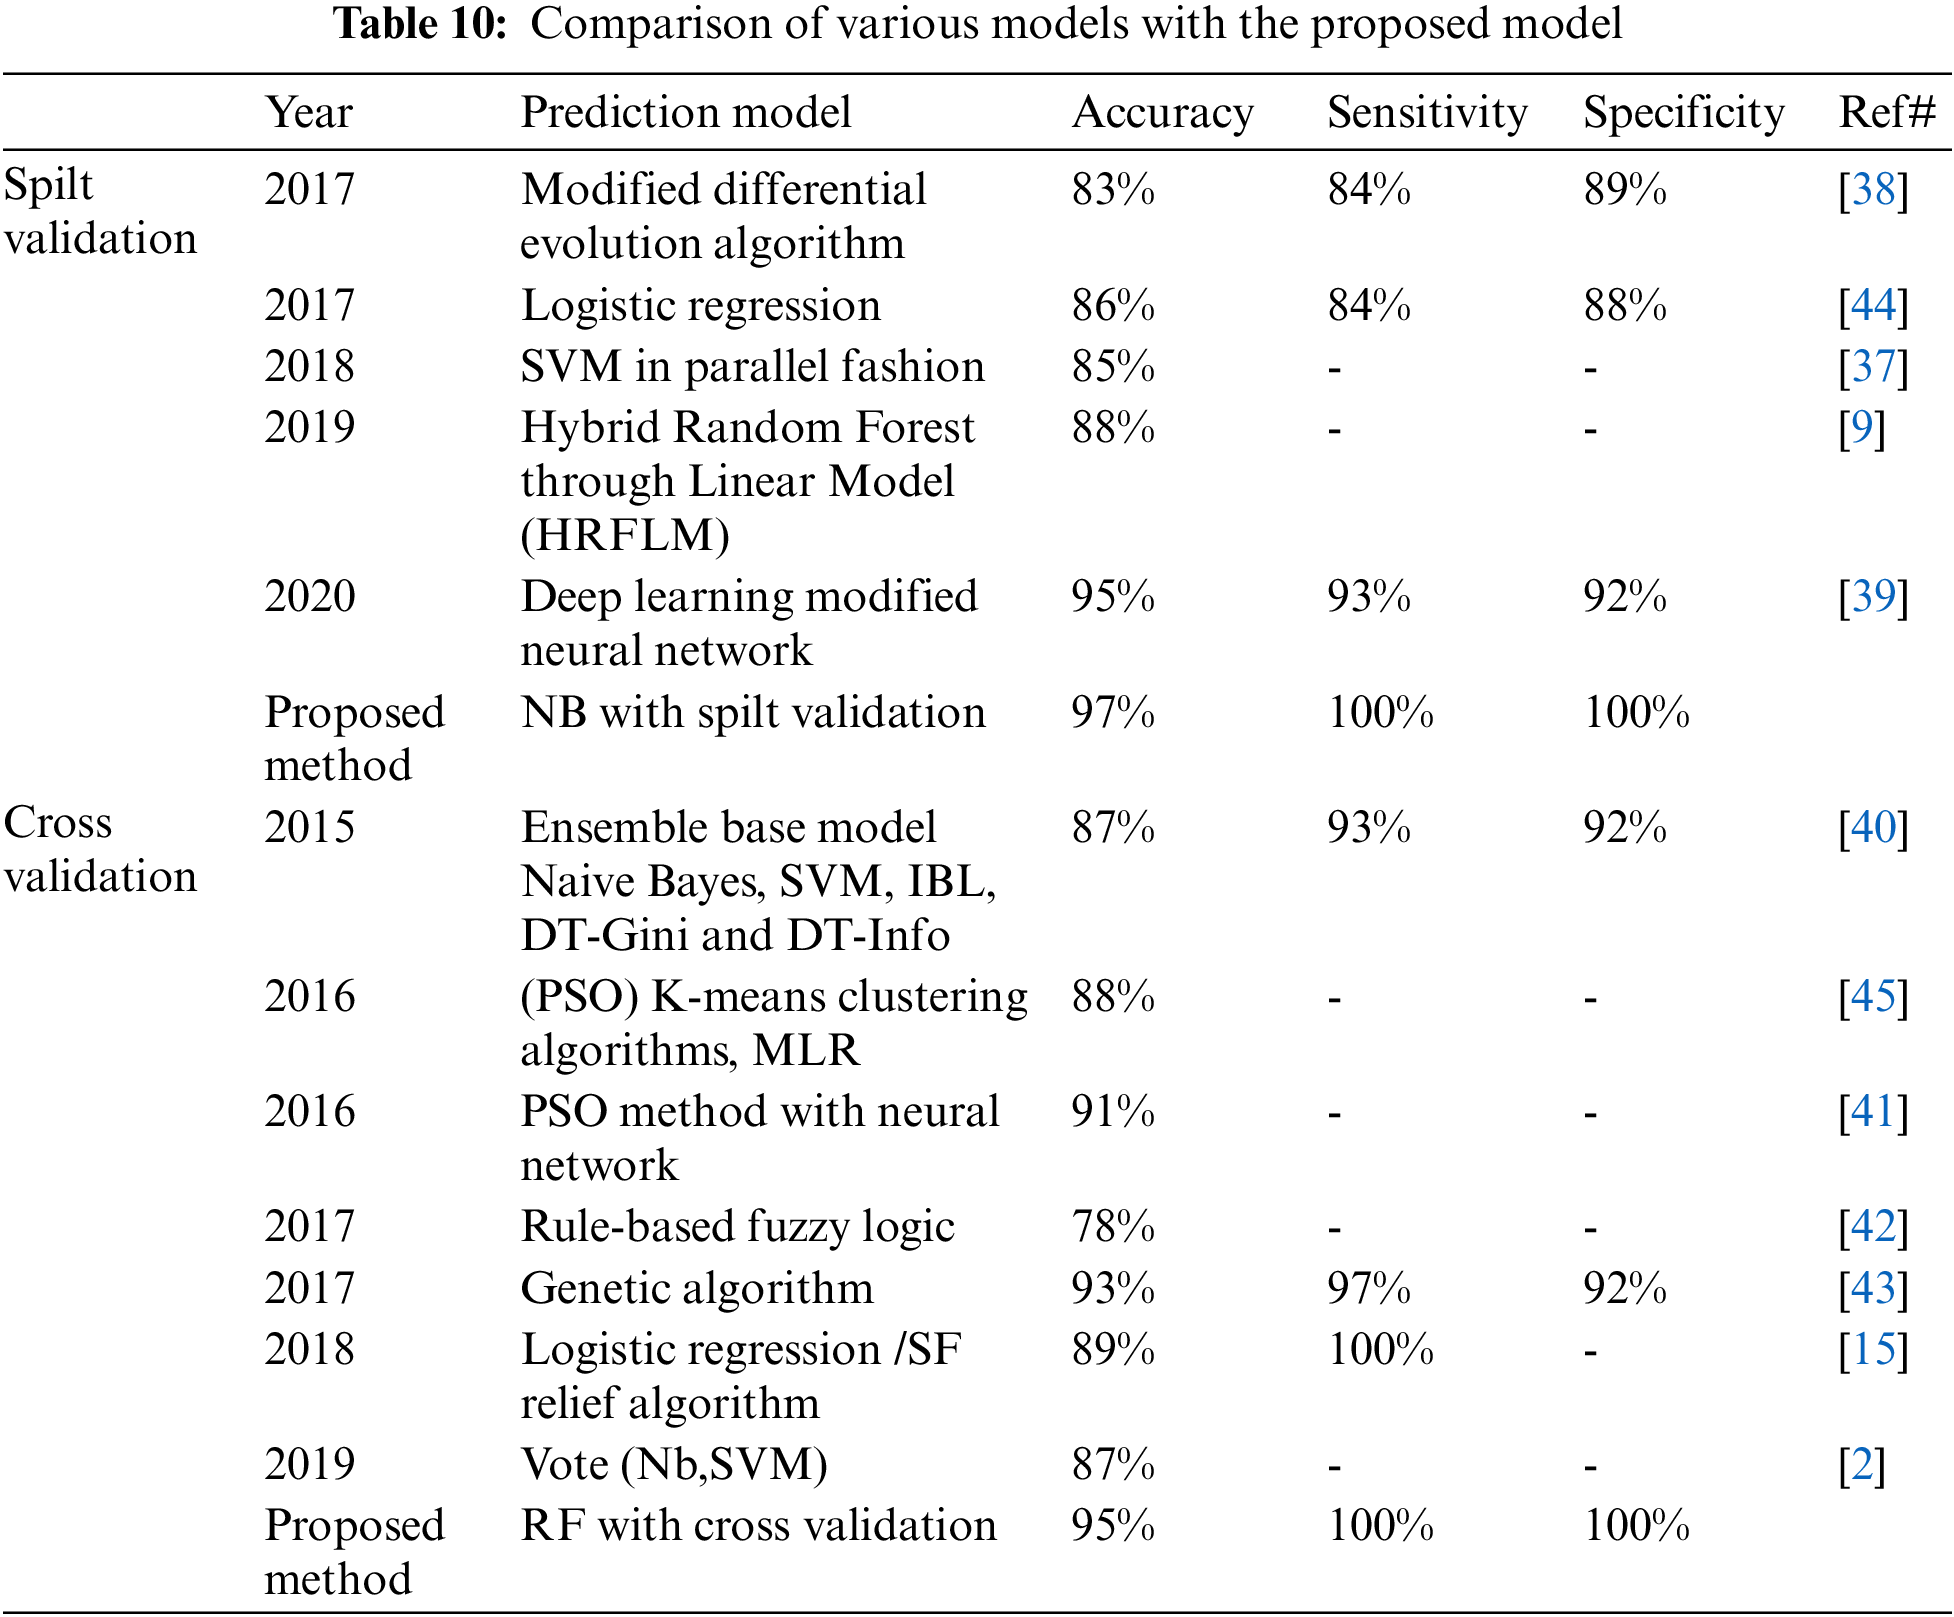
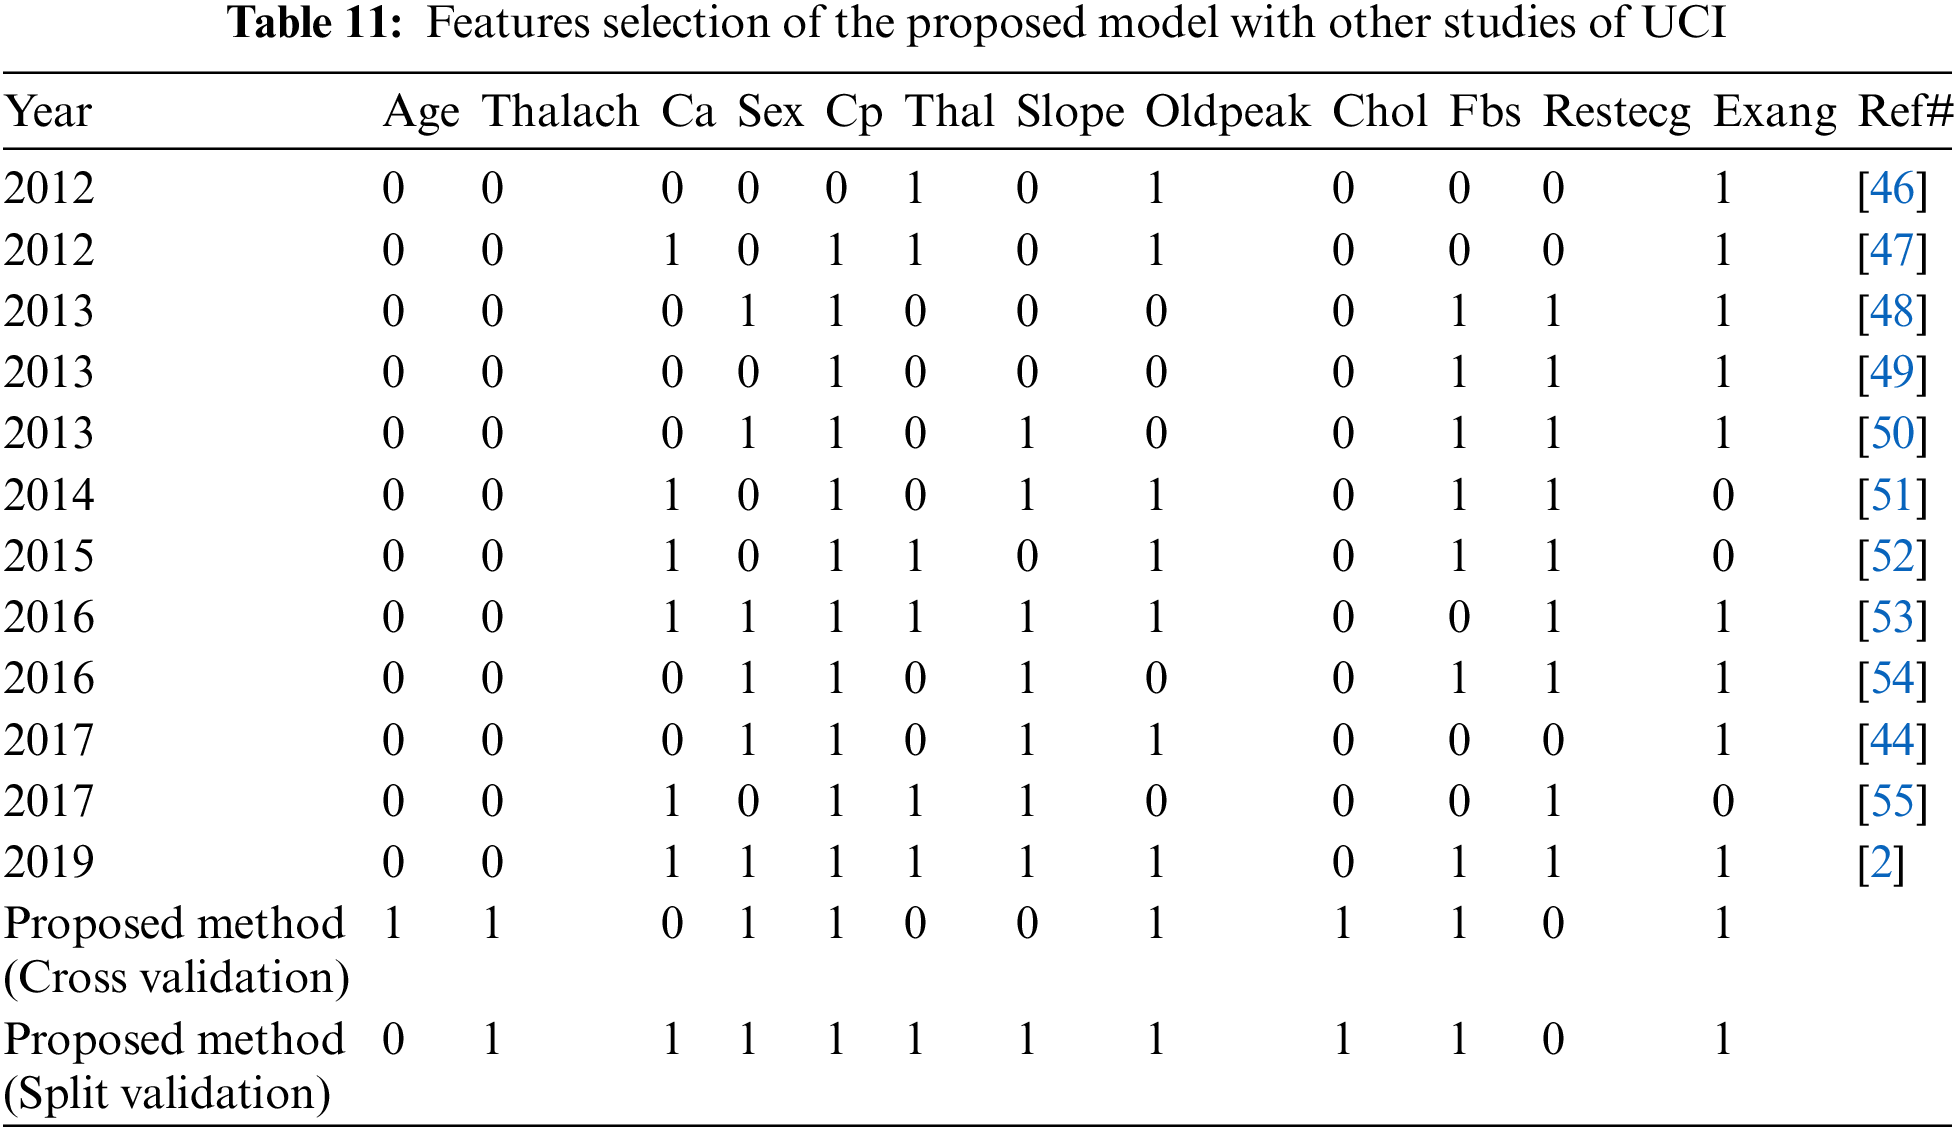
We compared the proposed model with previous state-of-the-art approaches. To evaluate the performance of the model with the performance of other models, benchmarking is useful. This approach has been used to determine whether the proposed model has attained reasonable accuracy compared to the accuracy obtained by other tests. Some research has been done on heart disease, but the results are not consistent. The work is contrasted with the available state-of-the-art that is similar to this work in Tab. 10. In Tab. 10 we compare our proposed method first with studies [11,37–39] using split validation and the same dataset on heart disease and secondly against these studies [17,40–42] on the same datasets, also an additional dataset [43] using cross-validation. To improve heart disease performance, the SVM provided 85% accuracy [9]. The study uses hybrid machine learning methods to predict heart disease, in which the Random Forest with the linear model is 88% accurate [37]. Another study predicted heart disease performance based on feature optimization. They obtained 83% accuracy using a modified differential evolution algorithm [38]. In [39], the deep learning model to predict heart disease attained 95% accuracy. Cross-validation and machine learning algorithms are used to predict heart disease when the relief algorithm achieves high accuracy [17]. Tab. 11 shows the features selected for the construction of predictive models by twelve different research using the UCI heart disease dataset. Based on Tabs. 10 and 11 related to the current research, we can see that the proposed model worked better. The performance accuracy of the proposed method with naive Bayes through split validation is 97%. The cross-validation performance of the proposed method is 95% with random forest. The overall results indicate that the accuracy of the proposed model is better as compared to previous approaches. In the prediction of heart disease, the selection of features is very critical. This study shows that convenient features increased efficiency with distinctive machine learning and feature selection algorithms. In our proposed method, the highest 100% sensitivity and specificity achieved with NB in case of spilt validation. In case of cross-validation, the highest sensitivity and specificity achieved with Random Forest.
Identifying the raw health data collection of cardiac information would help save human lives in the long term and early diagnosis of heart disease failure. Machine learning methods have been used to process raw data and offer innovative perspectives on heart disease. Predicting heart disease is challenging and very significant in the medical field. However, once the disease is detected, the mortality rate is significantly regulated. In the early stages, preventive measures will be implemented as soon as possible. In this paper, experiments are carried out using three mostly used UCI datasets. Optimal features are selected using a brute-force algorithm. The experimental results indicated that the proposed technique achieved 97% accuracy with Naive Bayes through split validation and 95% accuracy with the random forest through cross-validation and the results are better than previous methods. The proposed model achieved better performance of accuracy, specificity, and sensitivity. Overall, the proposed model is better for the diagnosis of heart disease compared to previous approaches. The potential direction of this research is to use various combinations of machine learning techniques to improve prediction techniques. It is definitely desirable to extend this work to direct the findings to real-world datasets rather than just theoretical techniques and simulations. In the future, different machine learning algorithms and deep learning methods such as LSTM will be used for large-scale data sets. Furthermore, new feature selection approaches are used to obtain an overall perspective on key features to increase prediction accuracy.
Funding Statement: This research was supported by Basic Science Research Program through the National Research Foundation of Korea (NRF) funded by the Ministry of Education (No. 2020R1I1A3069700).
Conflicts of Interest: The authors declare that they have no conflicts of interest to report regarding the present study.
1. P. M. Kumar and U. D. Gandhi, “A novel three-tier internet of things architecture with machine learning algorithm for early detection of heart diseases,” Computers and Electrical Engineering, vol. 65, no. 1, pp. 222–235, 2018. [Google Scholar]
2. M. S. Amin, Y. K. Chiam and K. D. Varathan, “Identification of significant features and data mining techniques in predicting heart disease,” Telematics and Informatics, vol. 36, no. 3, pp. 82–93, 2019. [Google Scholar]
3. V. Gerc, I. Masic, N. Salihefendic and M. Zildzic, “Cardiovascular diseases in covid-19 pandemic,” Materia Socio-Medica, vol. 32, no. 2, pp. 158–164, 2020. [Google Scholar]
4. T. Mythili, D. Mukherji, N. Padalia and A. Naidu, “A heart disease prediction model using SVM-decision trees-logistic regression,” International Journal of Computer Applications, vol. 68, no. 16, pp. 11–15, 2013. [Google Scholar]
5. M. Haissaguerre, N. Derval, F. Sacher, L. Jesel, I. Deisenhofer et al., “Sudden cardiac arrest associated with early repolarization,” New England Journal of Medicine, vol. 58, no. 19, pp. 2016–2023, 2008. [Google Scholar]
6. H. A. Esfahani and M. Ghazanfari, “Cardiovascular disease detection using a new ensemble classifier,” in 2017 IEEE 4th Int. Conf. on Knowledge Engineering and Innovation (KBEI), Tehran, Iran, pp. 488–496, 2017. [Google Scholar]
7. M. Gandhi and S. N. Singh, “Predictions in heart disease using techniques of data mining,” in 2015 Int. Conf. on Futuristic Trends on Computational Analysis and Knowledge Management (ABLAZE), Greater Noida, India, pp. 520–525, 2015. [Google Scholar]
8. P. M. Kumar, S. Lokesh, R. Varatharajan, G. C. Babu and P. Parthasarathy, “Cloud and IoT based disease prediction and diagnosis system for healthcare using fuzzy neural classifier,” Future Generation Computer Systems, vol. 86, no. 9, pp. 527–534, 2018. [Google Scholar]
9. Z. Malki, E. Atlam, G. Dagnew, A. Reda, E. Ghada et al., “Bidirectional residual LSTM based human activity recognition,” Journal of Computer and Information Science, vol. 13, no. 3, pp. 1–40, 2020. [Google Scholar]
10. H. Hashim, E. Atlam, M. Almalki, M. M. Sharkasy, R. Agamy et al., “Integrating data warehouse and machine learning to predict on covid-19 pandemic empirical data,” Journal of Theoretical and Applied Information Technology, vol. 99, no. 1, pp. 159–170, 2021. [Google Scholar]
11. E. J. Benjamin, S. S. Virani, C. W. Callaway, A. M. Chamberlain, A. R. Chang et al., “Heart disease and stroke statistics—2018 update: A report from the American heart association,” Circulation, vol. 137, no. 12, pp. e67–e492, 2018. [Google Scholar]
12. S. Motur, S. Tirumala Rao and S. Vemuru, “Frequent itemset mining algorithms: A survey,” Journal of Theoretical and Applied Information Technology, vol. 96, no. 3, pp. 744–755, 2018. [Google Scholar]
13. M. Shouman, T. Turner and R. Stocker, “Integrating clustering with different data mining techniques in the diagnosis of heart disease,” Journal of Computer Science and Engineering, vol. 20, no. 1, pp. 76–82, 2013. [Google Scholar]
14. J. Kelwade and S. Salankar, “Radial basis function neural network for prediction of cardiac arrhythmias based on heart rate time series,” in 2016 IEEE First Int. Conf. on Control, Measurement and Instrumentation (CMI), Kolkata, India, pp. 454–458, 2016. [Google Scholar]
15. A. U. Haq, J. P. Li, M. H. Memon, S. Nazir and R. Sun, “A hybrid intelligent system framework for the prediction of heart disease using machine learning algorithms,” Mobile Information Systems, vol. 18, no. 12, pp. 1–22, 2018. [Google Scholar]
16. F. Ahmed, “An internet of things application for predicting the quantity of future heart attack patients,” International Journal of Computer Applications, vol. 164, no. 6, pp. 36–40, 2017. [Google Scholar]
17. M. A. Khan and F. Algarn, “A healthcare monitoring system for the diagnosis of heart disease in the IoMT cloud environment using MSSO-ANFIS,” IEEE Access, vol. 8, no. 7, pp. 122259–122269, 2020. [Google Scholar]
18. Storn R., “Differential evolution-a simple and efficient adaptive scheme for global optimization over continuous spaces,” Technical Report, vol. 1, pp. 1–15, 1995. [Google Scholar]
19. A. Aada and S. Tiwari, “Predicting diabetes in medical datasets using machine learning techniques,” International Journal of Scientific Research and Engineering Trends, vol. 5, no. 2, pp. 257–267, 2019. [Google Scholar]
20. A. Sanchez and V. David, “Advanced support vector machines and kernel methods,” Neurocomputing, vol. 55, no. 1, pp. 2–20, 2003. [Google Scholar]
21. A. Sitar-taut, D. Zdrenghea and D. Pop, “Using machine learning algorithms in cardiovascular disease risk evaluation,” Age, vol. 1, no. 4, pp. 29–32, 2009. [Google Scholar]
22. S. K. Yadav and S. Pal, “Data mining: A prediction for performance improvement of engineering students using classification,” arXiv preprint arXiv:1203.3832, 2012. [Google Scholar]
23. S. Pattekari and A. Parveen, “Prediction system for heart disease using naive Bayes,” International Journal of Advanced Computer and Mathematical Sciences, vol. 3, no. 3, pp. 290–294, 2012. [Google Scholar]
24. U. Acharya, S. Sree, S. Chattopadhyay, W. Yu and P. Ang, “Application of recurrence quantification analysis for the automated identification of epileptic EEG signals,” International Journal of Neural Systems, vol. 21, no. 3, pp. 199–211, 2011. [Google Scholar]
25. D. M. Atallah, M. Badawy, A. El-Sayed and M. Ghoneim, “Predicting kidney transplantation outcome based on hybrid feature selection and KNN classifier,” Multimedia Tools and Applications, vol. 78, no. 14, pp. 20383–20407, 2019. [Google Scholar]
26. D. Dua and C. Graff, “UCI machine learning repository,” 2017. [Google Scholar]
27. E. P. Ephzibah, “Cost effective approach on feature selection using genetic algorithms and LS-SVM classifier,” IJCA Special Issue on Evolutionary Computation for Optimization Techniques, ECOT, vol. 3, no. 1, pp. 16–20, 2010. [Google Scholar]
28. A. P. Bradley, “The use of the area under the ROC curve in the evaluation of machine learning algorithms,” Pattern Recognition, vol. 30, no. 7, pp. 1145–1159, 1997. [Google Scholar]
29. S. Ayon, M. Islam and M. Hossain, “Coronary artery heart disease prediction: A comparative study of computational intelligence techniques,” IETE Journal of Research, vol. 2020, no.1, pp.1–20, 2020. [Google Scholar]
30. B. Tama, S. Im and S. Lee, “Improving an intelligent detection system for coronary heart disease using a two-tier classifier ensemble,” BioMed Research International, vol. 2020, no. 4, pp. 1–10, 2020. [Google Scholar]
31. D. Shah, S. Patel and S. K. Bharti, “Heart disease prediction using machine learning techniques,” SN Computer Science, vol. 1, no. 6, pp. 1–6, 2020. [Google Scholar]
32. G. Magesh and P. Swarnalatha, “Optimal feature selection through a cluster-based DT learning (CDTL) in heart disease prediction,” Evolutionary Intelligence, vol. 14, no. 1, pp. 1–11, 2020. [Google Scholar]
33. N. Mahmoudi, L. Olech and P. Docherty, “A comprehensive study of domain-specific emoji meanings in sentiment classification,” Computational Management Science, vol. 128, no. 8, pp. 1–39, 2021. [Google Scholar]
34. N. Fitriyani, M. Syafrudin, G. Alfian and J. Rhee, “HDPM: An effective heart disease prediction model for a clinical decision support system,” IEEE Access, vol. 8, no. 7, pp. 133034–133050, 2020. [Google Scholar]
35. I. Torre-Díez, B. Garcia-Zapirain, M. Lopez-Coronado and J. Rodrigues, “Proposing telecardiology services on cloud for different medical institutions: A model of reference,” Telemedicine and E-Health, vol. 23, no. 8, pp. 654–661, 2017. [Google Scholar]
36. M. A. Mohammed, B. Al-Khateeb, A. N. Rashid, D. A. Ibrahim DA, M. K. Ghani et al., “Neural network and multi-fractal dimension features for breast cancer classification from ultrasound images,” Computers & Electrical Engineering, vol. 8, no. 1, pp. 871–882, 2018. [Google Scholar]
37. R. Sharmila and S. Chellammal, “A conceptual method to enhance the prediction of heart diseases using the data techniques,” International Journal of Computer Science and Engineering, vol. 6, no. 4, pp. 21–25, 2018. [Google Scholar]
38. T. Vivekanandan and N. Iyengar, “Optimal feature selection using a modified differential evolution algorithm and its effectiveness for prediction of heart disease,” Computers in Biology and Medicine, vol. 90, no. 11, pp. 125–136, 2017. [Google Scholar]
39. S. Sarmah, “An efficient IoT-based patient monitoring and heart disease prediction system using deep learning modified neural network,” IEEE Access, vol. 8, no. 7, pp. 136784–135797, 2020. [Google Scholar]
40. S. Bashir, U. Qamar and F. H. Khan, “A multicriteria weighted vote-based classifier ensemble for heart disease prediction,” Computational Intelligence, vol. 32, no. 4, pp. 615–645, 2016. [Google Scholar]
41. M. G. Feshki and O. S. Shijani, “Improving the heart disease diagnosis by evolutionary algorithm of PSO and feed forward neural network,” in 2016 Artificial Intelligence and Robotics Conference (IRANOPEN), IEEE, Qazvin, Iran, pp. 48–53, 2016. [Google Scholar]
42. G. T. Reddy and N. Khare, “An efficient system for heart disease prediction using hybrid OFBAT with rule-based fuzzy logic model,” Systems and Computers, vol. 26, no. 4, pp. 1–21, 2017. [Google Scholar]
43. Z. Arabasadi, R. Alizadehsani, M. Roshanzamir, H. Moosaei and A. Yarifard, “Computer aided decision making for heart disease detection using hybrid neural network-genetic algorithm,” Computer Methods and Programs in Biomedicine, vol. 141, no. 4, pp. 19–26, 2017. [Google Scholar]
44. W. Wiharto, H. Kusnanto and H. Herianto, “Hybrid system of tiered multivariate analysis and artificial neural network for coronary heart disease diagnosis,” International Journal of Electrical and Computer Engineering, vol. 7, no. 2, pp. 1023–1031, 2017. [Google Scholar]
45. L. Verma, S. Srivastava and P. Negi, “A hybrid data mining model to predict coronary artery disease cases using non-invasive clinical data,” Journal of Medical Systems, vol. 40, no. 7, pp. 1–7, 2016. [Google Scholar]
46. N. Bhatla and K. Jyoti, “An analysis of heart disease prediction using different data mining techniques,” International Journal of Engineering, vol. 1, no. 8, pp. 1–4, 2012. [Google Scholar]
47. P. Anooj, “Clinical decision support system: Risk level prediction of heart disease using weighted fuzzy rules,” Journal of King Saud University-Computer and Information Sciences, vol. 24, no. 1, pp. 27–40, 2012. [Google Scholar]
48. A. K. Sen, S. B. Patel and D. P. Shukla, “A data mining technique for prediction of coronary heart disease using neuro-fuzzy integrated approach two level,” International Journal of Engineering and Computer Science, vol. 2, no. 9, pp. 1663–1671, 2013. [Google Scholar]
49. J. Nahar, T. Imam, K. S. Tickle and Y. P. Chen YP, “Computational intelligence for heart disease diagnosis: A medical knowledge driven approach,” Expert Systems with Applications, vol. 40, no. 1, pp. 94–103, 2013. [Google Scholar]
50. V. Chaurasia and S. Pal, “Early prediction of heart diseases using data mining techniques,” Caribbean Journal of Science and Technology, vol. 1, no. 6, pp. 208–217, 2013. [Google Scholar]
51. D. Tomar and S. Agarwal, “Feature selection based least square twin support vector machine for diagnosis of heart disease,” International Journal of Bio-Science and Bio-Technology, vol. 6, no. 2, pp. 69–82, 2014. [Google Scholar]
52. K. B. Nahato, K. N. Harichandran and K. Arputharaj, “Knowledge mining from clinical datasets using rough sets and backpropagation neural network,” Computational and Mathematical Methods in Medicine, vol. 3, no. 1, pp. 1–14, 2015. [Google Scholar]
53. A. Dey, J. Singh and N. Singh, “Analysis of supervised machine learning algorithms for heart disease prediction with reduced number of attributes using principal component analysis,” International Journal of Computer Applications, vol. 140, no. 2, pp. 27–31, 2016. [Google Scholar]
54. A. K. Paul, P. C. Shill PC, M. R. Rabin MR and M. A. Akhand, “Genetic algorithm based fuzzy decision support system for the diagnosis of heart disease,” in 5th Int. Conf. on Informatics, Electronics and Vision (ICIEV), Japan, pp. 145–150, 2016. [Google Scholar]
55. X. Liu X, X. Wang, Q. Su, M. Zhang, Y. Zhu et al., “A hybrid classification system for heart disease diagnosis based on the RFRS method,” Computational and Mathematical Methods in Medicine, vol. 2017, no. 1, pp. 1–11, 2017. [Google Scholar]
 | This work is licensed under a Creative Commons Attribution 4.0 International License, which permits unrestricted use, distribution, and reproduction in any medium, provided the original work is properly cited. |