DOI:10.32604/cmc.2022.026204
| Computers, Materials & Continua DOI:10.32604/cmc.2022.026204 | |
| Article |
Intelligent Feature Selection with Deep Learning Based Financial Risk Assessment Model
1College of Computer Engineering and Sciences, Prince Sattam bin Abdulaziz University, Al-Kharj, 16278, Saudi Arabia
2Department of Electronics and Communication Engineering, K.Ramakrishnan College of Engineering, Tiruchirappalli, 621112, India
3Department of Computer Science and Engineering, Panimalar Engineering College, Chennai, 600 123, India
4Department of Electronics and Communication Engineering, M. Kumarasamy College of Engineering, Karur, 639113, India
5Department of Computer Science and Information System, College of Applied Sciences, AlMaarefa University, Riyadh, 11597, Kingdom of Saudi Arabia
6Department of Entrepreneurship and Logistics, Plekhanov Russian University of Economics, 117997, Moscow, Russia
7Department of Logistics, State University of Management, 109542, Moscow, Russia
*Corresponding Author: Irina V. Pustokhina. Email: ivpustokhina@yandex.ru
Received: 18 December 2021; Accepted: 24 January 2022
Abstract: Due to global financial crisis, risk management has received significant attention to avoid loss and maximize profit in any business. Since the financial crisis prediction (FCP) process is mainly based on data driven decision making and intelligent models, artificial intelligence (AI) and machine learning (ML) models are widely utilized. This article introduces an intelligent feature selection with deep learning based financial risk assessment model (IFSDL-FRA). The proposed IFSDL-FRA technique aims to determine the financial crisis of a company or enterprise. In addition, the IFSDL-FRA technique involves the design of new water strider optimization algorithm based feature selection (WSOA-FS) manner to an optimum selection of feature subsets. Moreover, Deep Random Vector Functional Link network (DRVFLN) classification technique was applied to properly allot the class labels to the financial data. Furthermore, improved fruit fly optimization algorithm (IFFOA) based hyperparameter tuning process is carried out to optimally tune the hyperparameters of the DRVFLN model. For enhancing the better performance of the IFSDL-FRA technique, an extensive set of simulations are implemented on benchmark financial datasets and the obtained outcomes determine the betterment of IFSDL-FRA technique on the recent state of art approaches.
Keywords: Financial risks; intelligent models; financial crisis prediction; deep learning; feature selection; metaheuristics
Financial crisis prediction (FCP) is the most challenging requirement for the enterprise in making financial decisions. Artificial intelligence (AI) and Statistical techniques were utilized for recognizing the important aspects of FCP [1]. During this method, AI technique was utilized for performance validation and forecasts if the system faces a problem or not. The primary goal of this method is for extracting the financial parameter in a wide-ranging economical statement like financial features using maximal data with FCP [2]. Commonly, FCP takes a binary classification method that has been resolved in an efficient manner. The result from the classification algorithm could be classified into two kinds: failure and non-failure status of enterprises [3]. So far, a greater amount of classification methods has been proposed with several domain knowledge for FCP [4]. In general, the proposed predictive method could be separated into artificial intelligence (AI) or statistical methods.
In FCP, data mining (DM) methods have been employed by decision-making and primary detection modules [5]. On the other hand, financial risk could be evaluated by using Machine Learning (ML) algorithms, which are capable of extracting nonlinear relationships amongst the financial data contained in the balance sheet [6]. In a typical data science life cycle, model is selected for optimizing the prediction accuracy. In highly regulated areas, such as medicine or finance, model needs to be selected balancing accuracy with explainability. Enhance the choice selecting model-based prediction accuracy, and employs a posteriori a model attains explainability [7]. It doesn't limit the selection of the optimally executing methods. Therefore, it is appropriate to make decision in removing financial failures. In the event of imbalanced data, the data extraction method is extremely challenging [8]. Hence, the extraction of massive number of information is significant to detect financial errors; particularly in FCP. In this architecture, many arithmetical methods and estimations were applied for the management of FCP [9]. It can be accountable for removing the redundant and unwanted features in new information. Furthermore, FS has been employed to extract highly possible information through minimal feature subset and potential properties such as computation time, noise removal [10], minimization of impure feature, and decreased cost that is crucial to implement an estimated technique. Moreover, it is used to process the feature set under the applications of fixed value instead of utilizing elected features [11]. The most significant challenge in this model is discovering an optimum feature from existing feature named an NP-hard problem.
1.1 Recent State of Art Financial Risk Assessment Models
This section performs a detailed review of existing FCP techniques available from the literature. Uthayakumar et al. [12] proposed a clustering-based classification method, includes: fitness-scaling chaotic genetic ant colony algorithm (FSCGACA) and improved K-means clustering based classification technique. Firstly, an enhanced K-means method is introduced to remove the inaccurately clustered data. Subsequently, a rule-based method is elected for designing the offered dataset. Lastly, FSCGACA was used for seeking the ideal parameter of rule-based method. Tyagi et al. [13] presented a smart IoT assisted FCP method with meta-heuristic algorithm. The presented FCP model includes feature selection (FS), classification, pre-processing, and data acquisition. In the beginning, the financial information of the enterprises is accumulated by utilizing IoT gadgets like laptops, smartphones, and so on. Then, the quantum artificial butterfly optimization (QABO) method to FS was employed for choosing an optimum subset of features. Later, LSTM using RNN technique is exploited for categorizing the gathered financial data.
Metawa et al. [14] designed a novel FS with EHO using MWWO technique based on DBN to FCP. The EHO approach was employed as a feature selector, and MWWO-DBN is applied to the classifier model. The application of MWWO algorithms assist in tuning the parameter of DBN algorithm, and the selection of optimum feature set in the EHO model results in better classification accuracy. Ivanyuk et al. [15] resolved the problems of creating a weighted-average prediction that comprises numerous individual predictions. Original prediction models are utilized in the grouping include gradient boosting, Arima, and FC-FFNN models. NN is becoming more prominent nowadays since they allow prediction in the case of uncertainty and crisis. Wang et al. [16] created a novel index assessment scheme to supply chain finance dependent upon hesitant fuzzy linguistic PROMETHEE methodology, and the advantages and effectiveness of the models were established. To some extent, the SME financing the assessment model and enhanced PROMETHEE technique could assist financial institutions to decrease the survival threat of financial institutions as well as decrease the risk in certain financial transactions. Zheng et al. [17] presented architecture of privacy-preserving credit risk modelling based adversarial learning (PCAL). The presented model focus on masking the secret data within the original data set, when preserving the significant utility data for the target predictive performances, through (iteratively) weighing among utility oriented loss and privacy-risk loss.
The major contribution of this study is summarized here. This article introduces an intelligent feature selection with deep learning based financial risk assessment model (IFSDL-FRA). The proposed IFSDL-FRA technique derives a novel water strider optimization algorithm based feature selection (WSOA-FS) appraoch to an optimum selection of feature subsets. Also, Deep Random Vector Functional Link network (DRVFLN) classification method was applied to properly allot the class labels to the financial data. Eventually, improved fruit fly optimization algorithm (IFFOA) based hyperparameter tuning procedure was implemented. In order to make sure the enhanced predictive outcomes of the IFSDL-FRA technique, a wide range of experiments were performed on benchmark financial datasets.
The residual sections of the paper are arranged as follows. Section 2 offers a brief discussion of the IFSDL-FRA approach. Section 3 provides a detailed experimental analysis and Section 4 draws the concluding remarks of the study.
In this study, a novel IFSDL-FRA technique has been presented to determine the financial crisis of a company or enterprise. The proposed IFSDL-FRA technique comprises different major processes such as pre-processing, WSOA based optimal feature subset selection, DRVFLN based classification, and IFFOA based hyperparameter tuning. The utilization of WSOA to elect optimum features and IFFOA to select hyperparameters to help considerably boost the overall performance. Fig. 1 illustrates the overall process of IFSDL-FRA approach. The processes involved in these modules are elaborated in the succeeding sections.
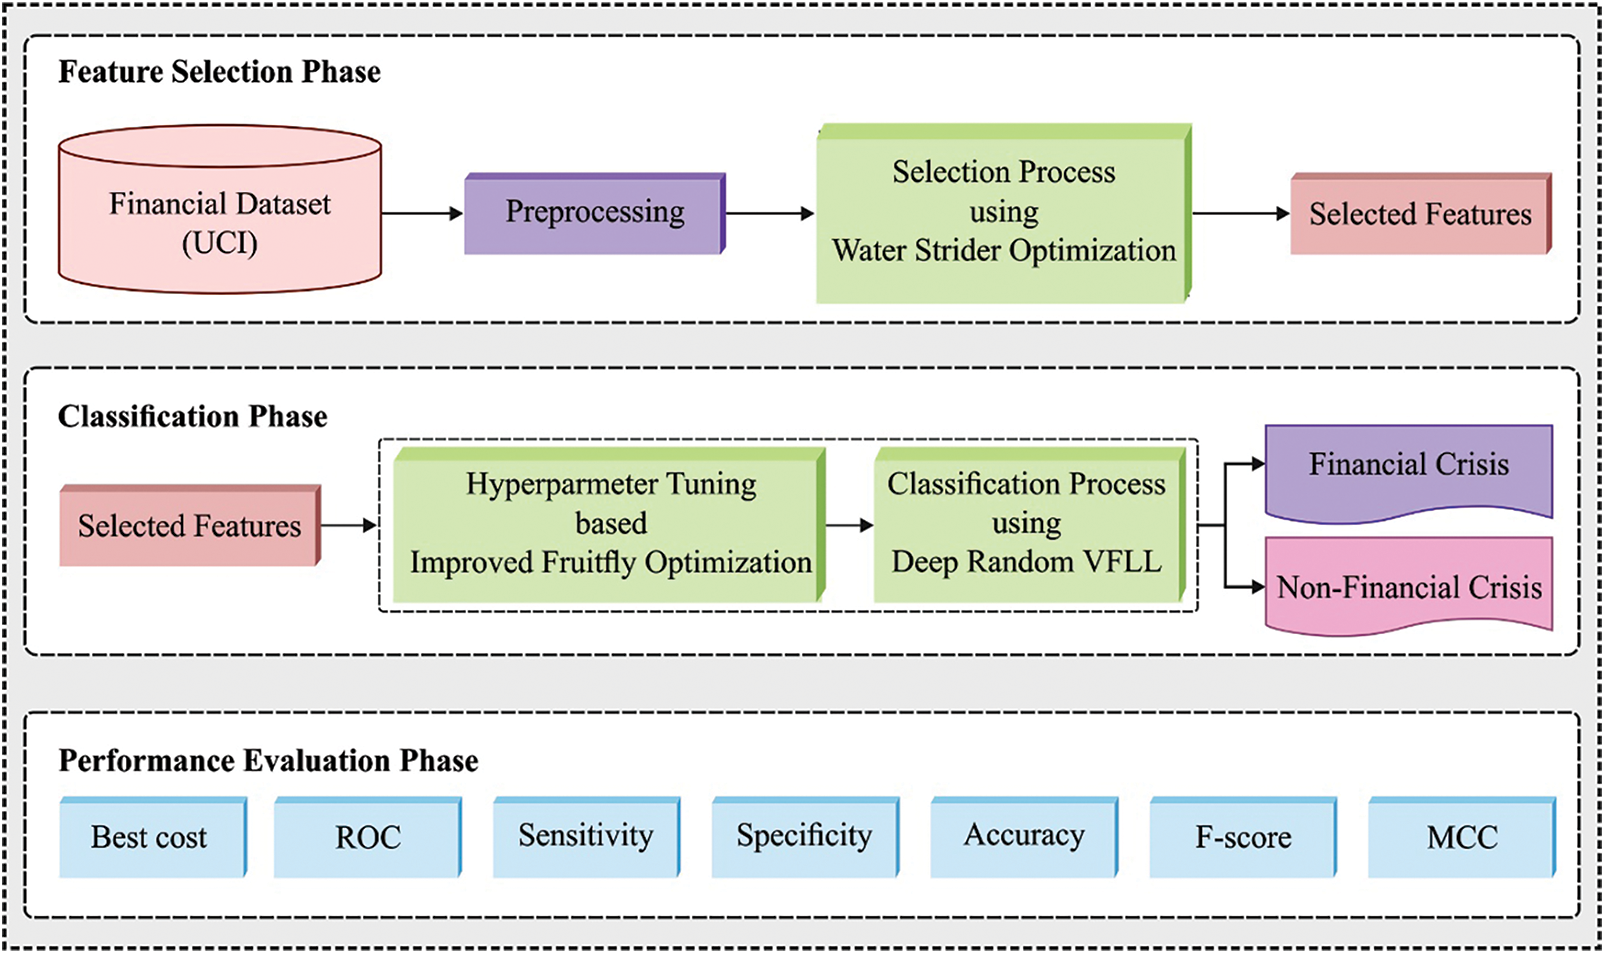
Figure 1: Overall process of IFSDL-FRA technique
To begin with, the dataset has appropriately normalization utilizing min-max normalized. In this procedure, the minimal and maximal values of data were attained and changed with utilizing in Eq. (1).
where X refers the parameter that exists from the data, min(X) and max(X) signifies the lower as well as upper levels of attribute values,
2.2 Design of WSOA-FS Technique
Next to data pre-processing, the preprocessed data is fed as input to WSOA-FS technique to choose optimal features. The WSOA is a meta-heuristic algorithm which is simulated as the nature of territorial, intellectual ripple interaction, mating style, feeding, and progression of water striders (WSs) bugs [18]. The mathematical modeling of the WSOA is given in the following. The WSs or candidate solutions can be arbitrarily produced in the searching area using Eq. (2):
where
The male
The length of R can be computed using Eq. (4):
where
Mating spends massive quantity of energy for WS and the male ones start foraging process next to mating process. The objective function can be assessed for checking the existence of food. When the FV exceeds the earlier FV, the male WS has identified food in new location, and vice versa. Then, the male
When the WS exist in newly generated location, the male
where
When the stopping criteria are unsatisfied, the WSOA returns the mating process for a new loop and highest number of FV determinations is treated as the ending criteria. The overall process of the WSOA is given in Algorithm 1.
In feature selection, when the size of the feature vector is N, the amount of distinct feature combination tends to be
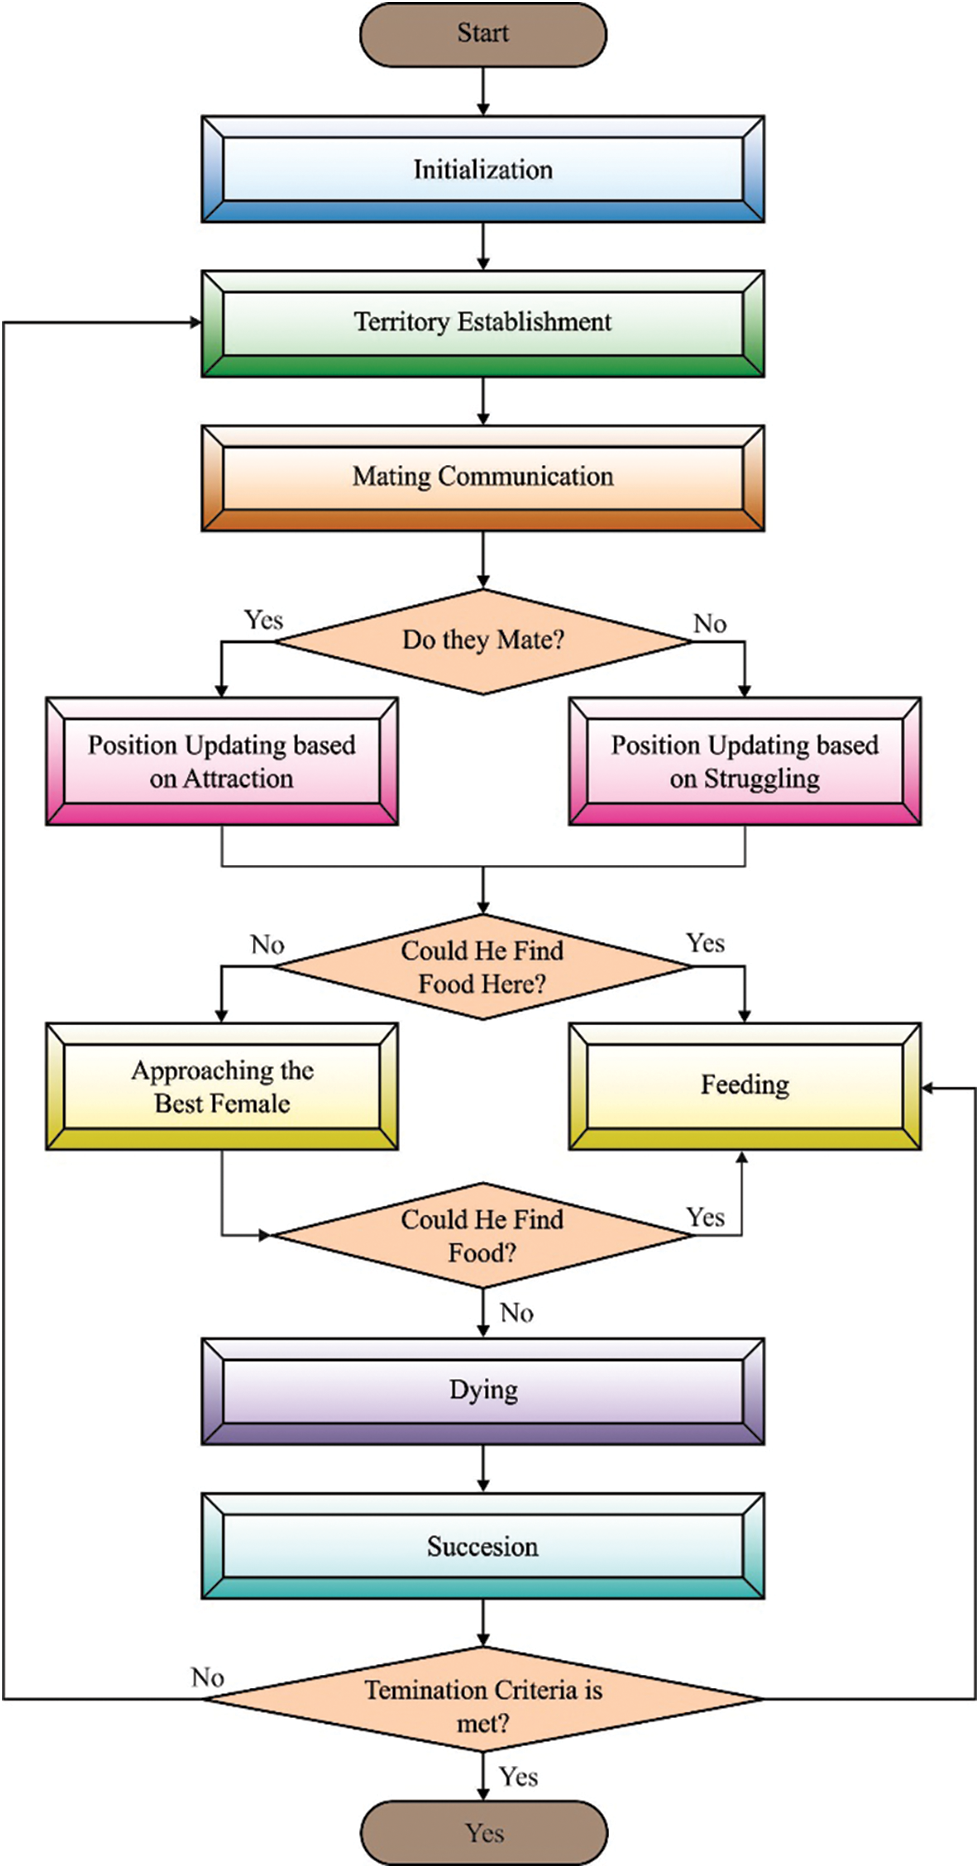
Figure 2: Flowchart of WSA
In this study, the fitness function to determine solution in this scenario was constructed to attain a balance among the two objectives is given as follows.
Whereas
2.3 Process Involved in Optimal DRVFLN Based Classification
During classification process, the chosen subset of features is passed into the DRVFLN based classifier to allot proper class labels. The DRVFLN network is extensive of shallow RVFL network regarding deep or representation learning. The input to all the layers in the stack is the outcome of previous layer where all the layers build an internal representation of input data. Now assume a stack of L hidden layers all of them have a similar amount of hidden nodes
For each layer
In which
This model framework is equivalent to RVFL network. Where input to output the layers consist of nonlinear features under stacked hidden layer and the novel feature. Then, the outcome can be determined by Eq. (11):
The resultant weight
To optimally tune the hyperparameters of the DRVFLN technique, the IFFOA technique is employed. The fundamental FOA is simulated as the foraging performance of fruit flies (FFs) naturally is presented by Pan [20]. The foraging performance of FF are separated as to 2 phases: the olfactory search phase and visual search phase. In olfactory foraging, the FF search and locate food sources nearby the populations, next estimates the odor focus equivalent to all feasible food sources. During the visual foraging stage, an optimum food source with maximal smell focus value was initiated, afterward, the FF group flies near it. The process of FOA has outlined as follows:
Step 1: Initialization parameters are containing the maximal amount of rounds and size of population.
Step 2: Initialization of the FF swarm place.
Step 3: Olfactory foraging stage: make various FF arbitrarily close to the present FF swarm place for constructing a population:
Step 4: Estimate the population for obtaining the fitness value of all FF.
Step 5: Visual foraging stage: determine the FF with optimum fitness values, later the FF group flies near optimum one.
Step 6: Once the maximal count of rounds is attained, this technique was ended; else, go back to Step 3.
Before creating novel solution with altering every decision variable of population place as the original FOA, IFFOA makes novel solution with arbitrarily chosen indexes for enhancing the search from the growth phase.
In Eq. (1),
The fitness function performs an important part in optimized problems. It computes a positive integer for specifying a better candidate outcome. During this work, classification error rate is considered as a minimalizing fitness function. The poor solution has maximum fitness score (error rate) and better solution is minimum fitness score (error rate).
The performance validation of the IFSDL-FRA technique is performed against 3 benchmark datasets like Qualitative [22], Polish [23], and Weislaw datasets. The former qualitative dataset contains 250 samples with 6 attributes and 2 classes. The second Polish dataset has 43405 samples with 64 attributes and 2 classes. The last Weislaw dataset includes 240 instances with 30 features.
The FS result analysis of the WSOA-FS technique takes place in Tab. 1. The results demonstrated that WSOA-FS technique has chosen an optimal number of features on all datasets. Tab. 2 offers the best cost (BC) analysis of the WSOA-FS technique under three datasets. The results show that the WSOA-FS technique has gained lower BC under all datasets. For instance, with qualitative dataset, the WSOA-FS technique has offered least average BC of 0.0320 whereas the GSO-FS, DFO-FS, and FFO-FS techniques have obtained increased average BC of 0.0520, 0.0810, and 0.0972.


Likewise, with Polish dataset, the WSOA-FS technique has provided minimal average BC of 0.1500 whereas the GSO-FS, DFO-FS, and FFO-FS techniques have resulted in maximum average BC of 0.1614, 0.1714, and 0.1719 respectively. Moreover, with Weislaw dataset, the WSOA-FS system has offered average BC of 0.0598 but the GSO-FS, DFO-FS, and FFO-FS techniques have obtained increased average BC of 0.0873, 0.0968, and 0.1020.
Fig. 3 illustrates the set of confusion matrices produced by the IFSDL-FRA technique. On the test qualitative dataset, the IFSDL-FRA technique has identified the 107 instances into financial crisis (FC) class and 142 instances into non-financial crisis (NFC) class. Besides, on the test Polish dataset, the IFSDL-FRA technique has identified the 2086 instances into FC class and 431294 instances into NFC class. In addition, on the test Weislaw dataset, the IFSDL-FRA technique has identified the 111 instances into FC class and 128 instances into NFC class.
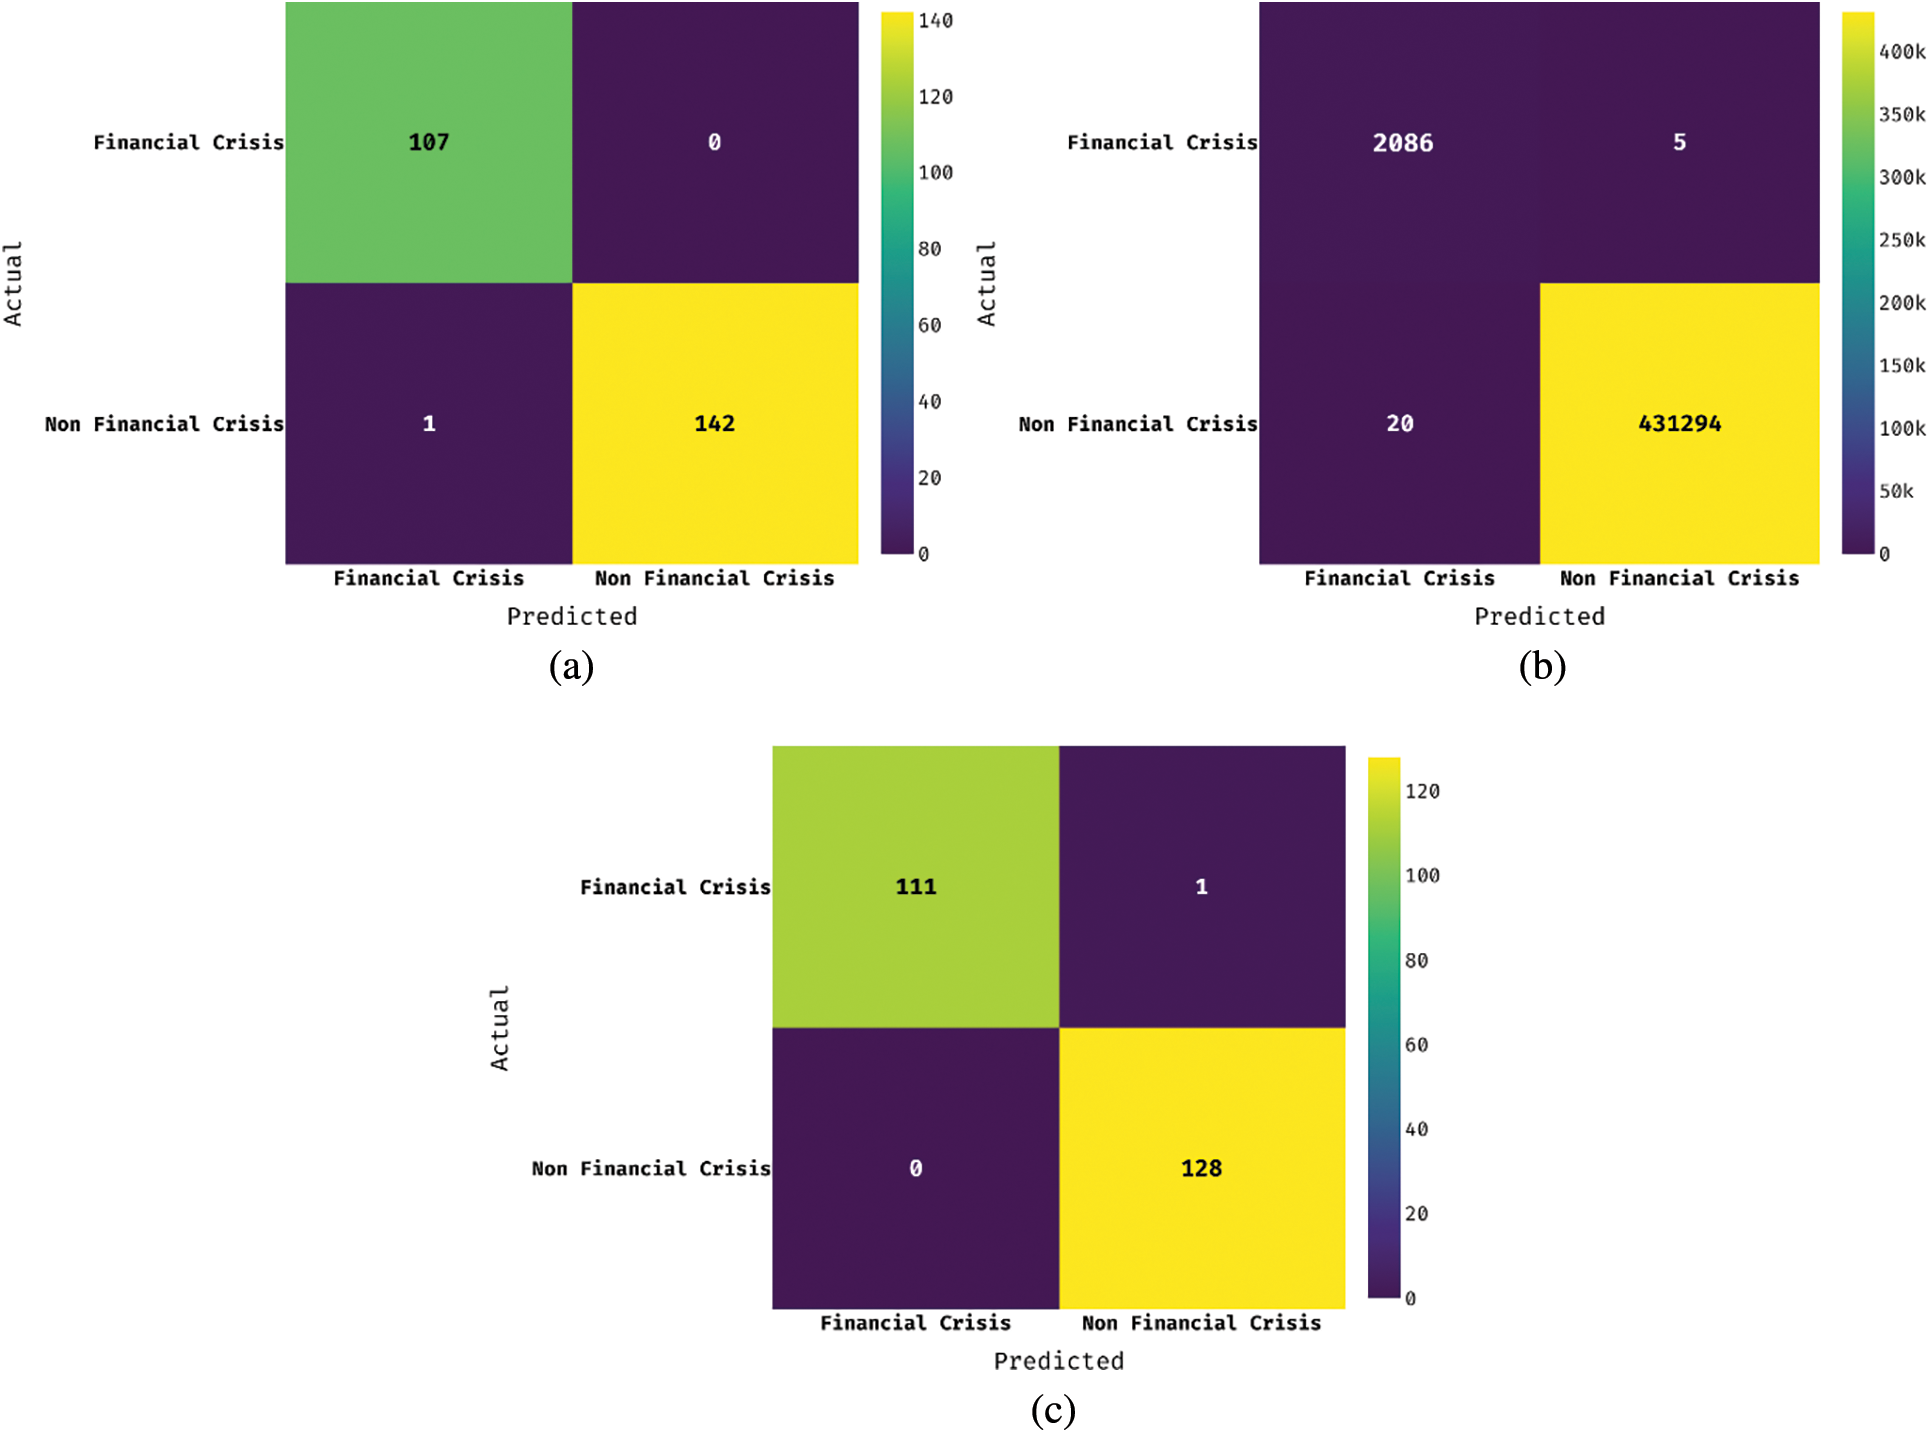
Figure 3: a) Qualitative dataset b) Polish dataset c) Weislaw dataset
Tab. 3 and Fig. 4 provide a detailed classification results analysis of the IFSDL-FRA technique on the qualitative bankruptcy dataset. The results show that the OlexGA model has shown worse classification results than the other techniques. At the same time, the Improved GACO and Genetic Ant Colony models have obtained slightly enhanced classification results. Followed by, the optimal SAE and ant colony techniques have reached reasonable classification performance.
However, the presented IFSDL-FRA technique has showcased maximum classifier results with the

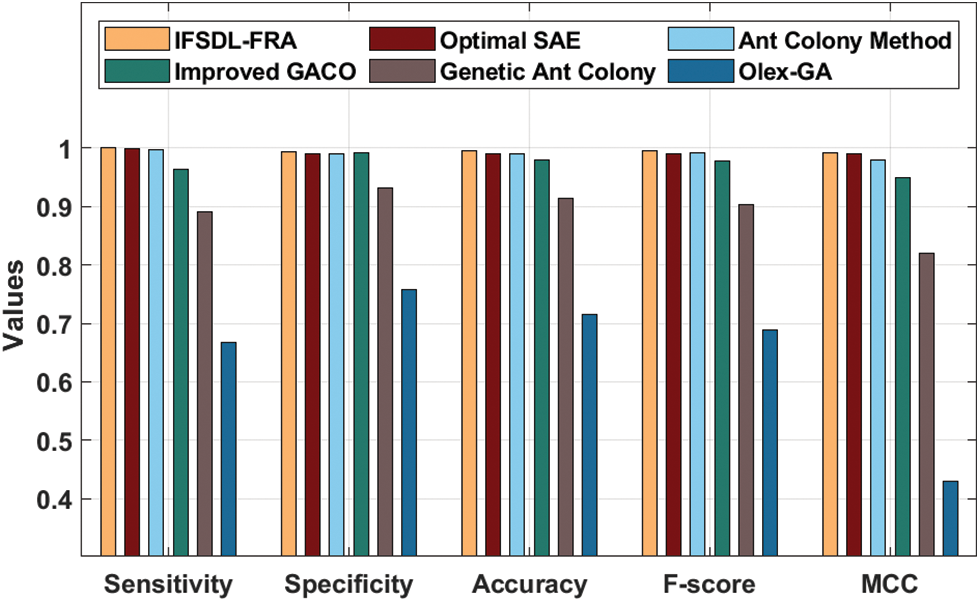
Figure 4: Result analysis of IFSDL-FRA technique on qualitative bankruptcy dataset
Fig. 5 offers a clear accuracy graph analysis of the IFSDL-FRA technique on the test qualitative bankruptcy dataset. The results revealed that the IFSDL-FRA technique has gained increased values of training and validation accuracies on the applied qualitative bankruptcy dataset.

Figure 5: Accuracy analysis of IFSDL-FRA technique on qualitative bankruptcy dataset
A loss graph analysis of the IFSDL-FRA technique on the test qualitative bankruptcy dataset is offered in Fig. 6. The results showcased that the IFSDL-FRA technique has resulted in minimal values of training and testing loss on the applied qualitative bankruptcy dataset.

Figure 6: Loss analysis of IFSDL-FRA technique on qualitative bankruptcy dataset
Tab. 4 and Fig. 7 demonstrate a comparative results analysis of the IFSDL-FRA technique on the Polish bankruptcy dataset. The experimental results demonstrated that the OlexGA model has depicted poor classification results over the other techniques. Along with that, the Improved GACO and Genetic Ant Colony models have gained moderately closer classification results. In line with, the optimal SAE and ant colony techniques have tried to accomplish somewhat improved classification performance. However, the presented IFSDL-FRA technique has outperformed the other techniques with the increased


Figure 7: Result analysis of IFSDL-FRA technique on polish bankruptcy dataset
Fig. 8 gives a clear accuracy graph analysis of the IFSDL-FRA approach on the test Polish bankruptcy dataset. The outcomes depicted that the IFSDL-FRA approach has gained improved values of training and validation accuracies on the applied qualitative bankruptcy dataset. A loss graph analysis of the IFSDL-FRA system on the test Polish bankruptcy dataset is offered in Fig. 9. The outcomes outperformed that the IFSDL-FRA manner has resulted in minimal values of training and testing loss on the applied qualitative bankruptcy dataset.
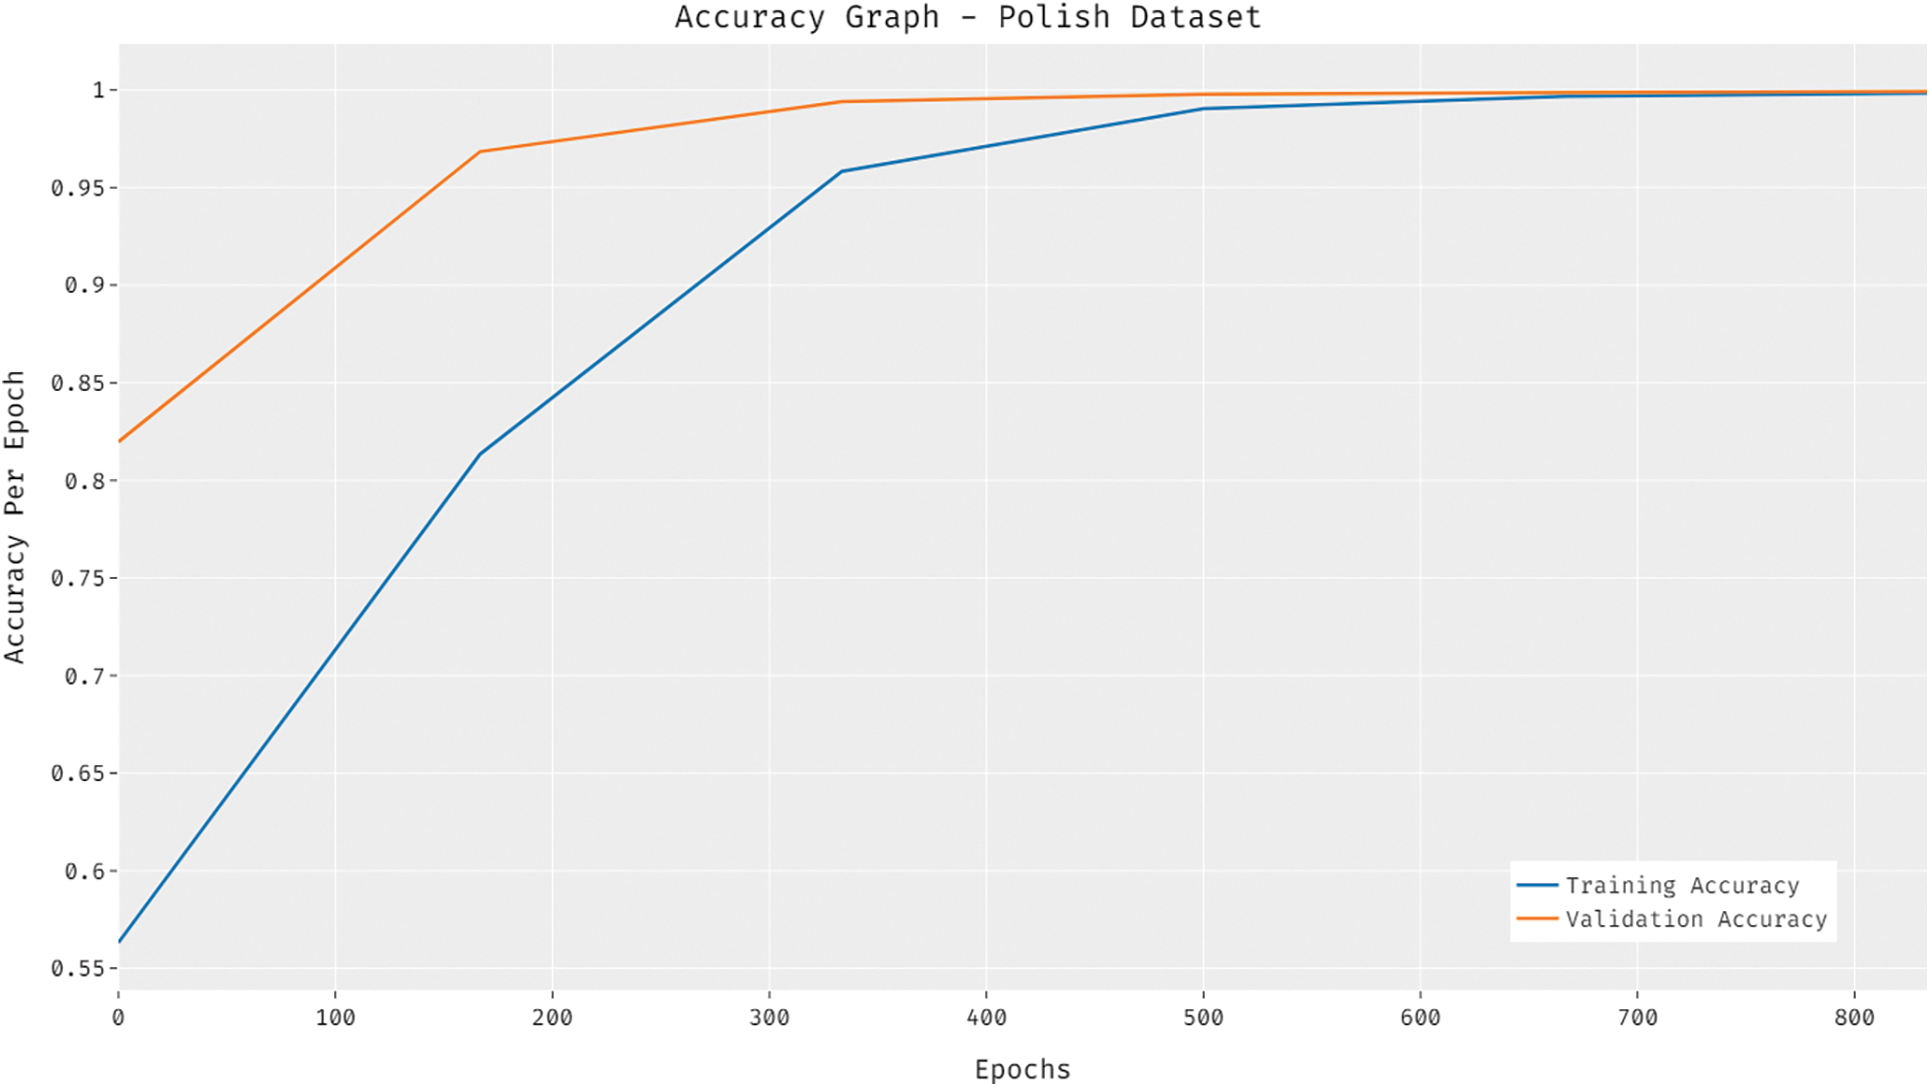
Figure 8: Accuracy analysis of IFSDL-FRA technique on polish bankruptcy dataset

Figure 9:
Tab. 5 and Fig. 10 offer a comprehensive performance validation of the IFSDL-FRA technique on the Weislaw bankruptcy dataset [24]. The experimental results demonstrated that the OlexGA model has reported reduced efficiency over the other techniques. Eventually, the Improved GACO and Genetic Ant Colony models have resulted in somewhat improved classifier outcomes. Next to that, the optimal SAE and ant colony techniques have accomplished acceptable classifier performance. But the presented IFSDL-FRA technique has demonstrated superior results over the other techniques with the higher

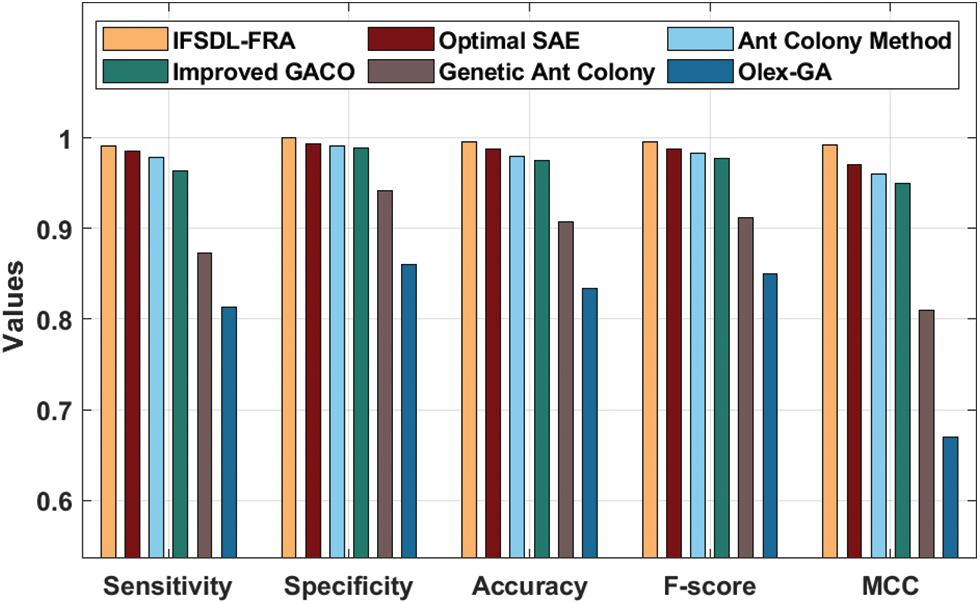
Figure 10: Result analysis of IFSDL-FRA technique on weislaw bankruptcy dataset
In this study, a novel IFSDL-FRA approach has been presented to determine the financial crisis of a company or enterprise. The proposed IFSDL-FRA technique comprises different major processes such as pre-processing, WSOA based optimal feature subset selection, DRVFLN based classification, and IFFOA based hyperparameter tuning. The utilization of WSOA to elect optimum features and IFFOA to select hyperparameters to help considerably boost the overall performance. In order to ensure the enhanced predictive outcomes of the IFSDL-FRA technique, a wide range of experiments were carried out on benchmark financial datasets and the obtained outcomes depict the betterment of the IFSDL-FRA technique over the recent state of art approaches. Therefore, the IFSDL-FRA technique was applied as proficient tools for predicting the financial condition of a firm. In future, outlier detection and clustering techniques can be integrated into the IFSDL-FRA technique to further improve the classification performance.
Funding Statement: The authors received no specific funding for this study.
Conflicts of Interest: The authors declare that they have no conflicts of interest to report regarding the present study.
1. R. Geng, I. Bose and X. Chen, “Prediction of financial distress: An empirical study of listed chinese companies using data mining,” European Journal of Operational Research, vol. 241, no. 1, pp. 236–247, 2015. [Google Scholar]
2. S. Vadlamudi, “The impacts of machine learning in financial crisis prediction,” Asian Business Review, vol. 10, no. 3, pp. 171–176, 2020. [Google Scholar]
3. J. Uthayakumar, N. Metawa, K. Shankar and S. K. Lakshmanaprabu, “Financial crisis prediction model using ant colony optimization,” International Journal of Information Management, vol. 50, no. 5, pp. 538–556, 2020. [Google Scholar]
4. Z. Huang, H. Chen, C. J. Hsu, W. H. Chen and S. Wu, “Credit rating analysis with support vector machines and neural networks: A market comparative study,” Decision Support Systems, vol. 37, no. 4, pp. 543–558, 2004. [Google Scholar]
5. T. Fischer and C. Krauss, “Deep learning with long short-term memory networks for financial market predictions,” European Journal of Operational Research, vol. 270, no. 2, pp. 654–669, 2018. [Google Scholar]
6. M. H. Fan, M. Y. Chen and E. C. Liao, “A deep learning approach for financial market prediction: Utilization of google trends and keywords,” Granular Computing, vol. 6, no. 1, pp. 207–216, 2021. [Google Scholar]
7. Y. Zhang, B. Yan and M. Aasma, “A novel deep learning framework: Prediction and analysis of financial time series using CEEMD and LSTM,” Expert Systems with Applications, vol. 159, pp. 113609, 2020. [Google Scholar]
8. Y. Lin, H. Guo and J. Hu, “An SVM-based approach for stock market trend prediction,” in The 2013 Int. Joint Conf. on Neural Networks (IJCNN), Texas, USA, pp. 1–7, 2013. [Google Scholar]
9. J. Sun and H. Li, “Financial distress prediction using support vector machines: Ensemble vs. individual,” Applied Soft Computing, vol. 12, no. 8, pp. 2254–2265, 2012. [Google Scholar]
10. M. Ala'raj and M. F. Abbod, “Classifiers consensus system approach for credit scoring,” Knowledge-Based Systems, vol. 104, no. 8, pp. 89–105, 2016. [Google Scholar]
11. S. P. Chatzis, V. Siakoulis, A. Petropoulos, E. Stavroulakis and N. Vlachogiannakis, “Forecasting stock market crisis events using deep and statistical machine learning techniques,” Expert Systems with Applications, vol. 112, pp. 353–371, 2018. [Google Scholar]
12. J. Uthayakumar, N. Metawa, K. Shankar and S. K. Lakshmanaprabu, “Intelligent hybrid model for financial crisis prediction using machine learning techniques,” Information Systems and e-Business Management, vol. 18, no. 4, pp. 617–645, 2020. [Google Scholar]
13. S. K. S. Tyagi and Q. Boyang, “An intelligent internet of things aided financial crisis prediction model in fintech,” IEEE Internet of Things Journal, pp. 1, 2021. https://doi.org/10.1109/JIOT.2021.3088753. [Google Scholar]
14. N. Metawa, I. V. Pustokhina, D. A. Pustokhin, K. Shankar and M. Elhoseny, “Computational intelligence-based financial crisis prediction model using feature subset selection with optimal deep belief network,” Big Data, vol. 9, no. 2, pp. 100–115, 2021. [Google Scholar]
15. V. Ivanyuk and K. Levchenko, “Intelligent methods for predicting financial time series,” in Proc. of the Computational Methods in Systems and Software, Cham, Springer, pp. 501–509, 2020. [Google Scholar]
16. K. Wang, F. Yan, Y. Zhang, Y. Xiao and L. Gu, “Supply chain financial risk evaluation of small and medium-sized enterprises under smart city,” Journal of Advanced Transportation, vol. 2020, pp. 1–14, 2020. [Google Scholar]
17. Y. Zheng, Z. Wu, Y. Yuan, T. Chen and Z. Wang, “PCAL: A privacy-preserving intelligent credit risk modeling framework based on adversarial learning,” arXiv preprint arXiv:2010.02529, 2020. [Google Scholar]
18. A. Kaveh, M. I. Ghazaan and A. Asadi, “An improved water strider algorithm for optimal design of skeletal structures,” Periodica Polytechnica Civil Engineering, vol. 64, no. 4, pp. 1284–1305, 2020. [Google Scholar]
19. Q. Shi, R. Katuwal, P. N. Suganthan and M. Tanveer, “Random vector functional link neural network based ensemble deep learning,” Pattern Recognition, vol. 117, pp. 107978, 2021. [Google Scholar]
20. W. T. Pan, “A new fruit Fly optimization algorithm: Taking the financial distress model as an example,” Knowledge-Based Systems, vol. 26, pp. 69–74, 2012. [Google Scholar]
21. L. Wang, R. Liu and S. Liu, “An effective and efficient fruit fly optimization algorithm with level probability policy and its applications,” Knowledge-Based Systems, vol. 97, pp. 158–174, 2016. [Google Scholar]
22. A. Martin, J. Uthayakumar, M. Nadarajan and V. Prasanna Venkatesan, 2014. https://archive.ics.uci.edu/ml/datasets/qualitative_bankruptcy. [Google Scholar]
23. S. Tomczak, 2016. https://archive.ics.uci.edu/ml/datasets/Polish+companies+bankruptcy+data. [Google Scholar]
24. M. A. Duhayyim, H. Alsolai, F. N. Al-Wesabi, N. Nemri, H. Mahgoub et al. “Optimized stacked autoencoder for iot enabled financial crisis prediction model,” Computers, Materials & Continua, vol. 71, no. 1, pp. 1079–1094, 2022. [Google Scholar]
 | This work is licensed under a Creative Commons Attribution 4.0 International License, which permits unrestricted use, distribution, and reproduction in any medium, provided the original work is properly cited. |