DOI:10.32604/cmc.2022.026226

| Computers, Materials & Continua DOI:10.32604/cmc.2022.026226 |  |
| Article |
Intelligent Forensic Investigation Using Optimal Stacked Autoencoder for Critical Industrial Infrastructures
1Information Systems Department, Faculty of Computing and Information Technology King Abdulaziz University, Jeddah, 21589, Saudi Arabia
2Information Technology Department, Faculty of Computing and Information Technology, King Abdulaziz University, Jeddah, 21589, Saudi Arabia
3Centre of Artificial Intelligence for Precision Medicines, King Abdulaziz University, Jeddah, 21589, Saudi Arabia
4Mathematics Department, Faculty of Science, Al-Azhar University, Naser City, 11884, Cairo, Egypt
5Computer Science Department, Faculty of Computing and Information Technology King Abdulaziz University, Jeddah, 21589, Saudi Arabia
6Biochemistry Department, Faculty of Science, King Abdulaziz University, Jeddah, 21589, Saudi Arabia
7Computer Science and Engineering Department, College of Computer Science and Engineering, University of Hafr Al Batin, Al Jamiah, Hafar Al Batin, 39524, Saudi Arabia
*Corresponding Author: Mahmoud Ragab. Email: mragab@kau.edu.sa
Received: 19 December 2021; Accepted: 24 January 2022
Abstract: Industrial Control Systems (ICS) can be employed on the industrial processes in order to reduce the manual labor and handle the complicated industrial system processes as well as communicate effectively. Internet of Things (IoT) integrates numerous sets of sensors and devices via a data network enabling independent processes. The incorporation of the IoT in the industrial sector leads to the design of Industrial Internet of Things (IIoT), which find use in water distribution system, power plants, etc. Since the IIoT is susceptible to different kinds of attacks due to the utilization of Internet connection, an effective forensic investigation process becomes essential. This study offers the design of an intelligent forensic investigation using optimal stacked autoencoder for critical industrial infrastructures. The proposed strategy involves the design of manta ray foraging optimization (MRFO) based feature selection with optimal stacked autoencoder (OSAE) model, named MFROFS-OSAE approach. The primary objective of the MFROFS-OSAE technique is to determine the presence of abnormal events in critical industrial infrastructures. The MFROFS-OSAE approach involves several subprocesses namely data gathering, data handling, feature selection, classification, and parameter tuning. Besides, the MRFO based feature selection approach is designed for the optimal selection of feature subsets. Moreover, the OSAE based classifier is derived to detect abnormal events and the parameter tuning process is carried out via the coyote optimization algorithm (COA). The performance validation of the MFROFS-OSAE technique takes place using the benchmark dataset and the experimental results reported the betterment of the MFROFS-OSAE technique over the recent approaches interms of different measures.
Keywords: Industrial control systems; internet of things; artificial intelligence; feature selection; deep learning
In recent time, new technologies for example Cloud computing (CC) [1] and Internet of Things (IoT) depends largely on Internet and network services for data communication and exchange. Cybersecurity has become an effective area for several experts worldwide in diverse areas of researches like Critical Infrastructure Security, Data Hiding, Big Data Security, cloud, and IoT forensics [2]. Industrial Control System (ICS) comprises different classes of control system namely Distributed Control Systems (DCS), Programmable Logic Controllers (PLC), and Supervisory Control and Data Acquisition (SCADA) [3]. Each control scheme is found in the crucial infrastructure and industrial sectors namely transportation network, Gas Pipelines, water distribution network, gas, nuclear power generation, and electric power distribution network [4]. The major variation among the conventional Information Technology (IT) environments and ICSs is that ICS strongly interacts with the physical devices and instruments. At the present time, ICS is considered cyber-system, hence, they are susceptible to attacks from outside and inside environments. ICS is very difficult when compared to conventional IT systems since they involve various parts found in single geographical area [5]. From a cybersecurity viewpoint, the ICS system consists of Field, Enterprise, and Control tiers. Fig. 1 illustrates the process involved in digital forensics method.
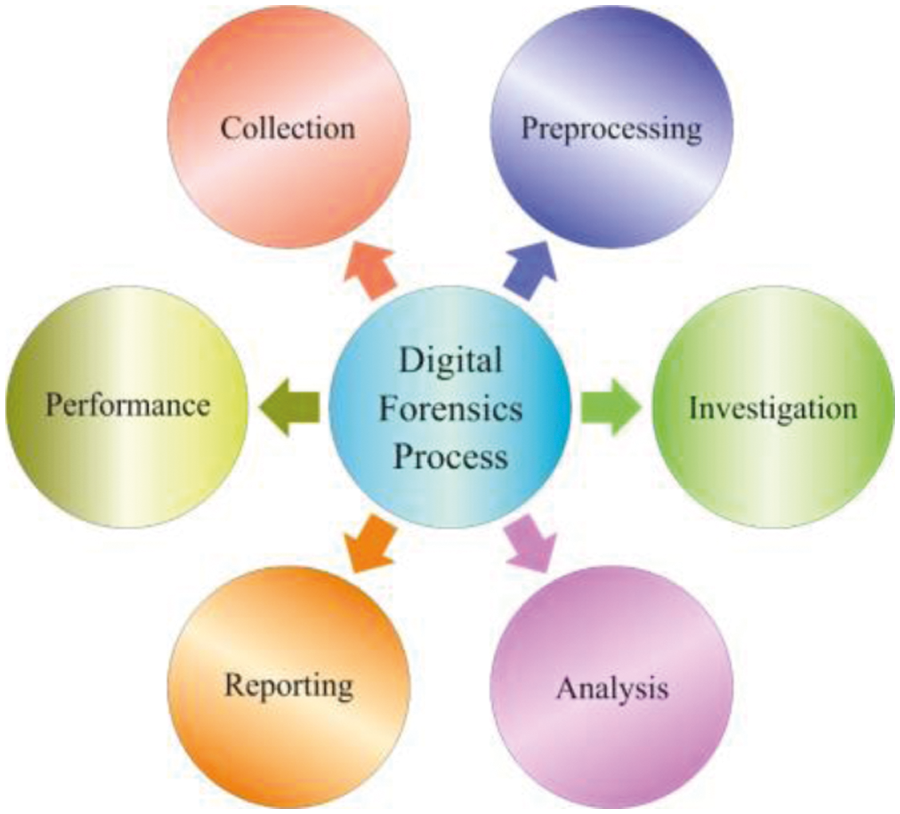
Figure 1: Process involved in digital forensics method
Over the last decades, Smart device has been turning out at fast speed. The IoT is an emerging innovation that allows the capability to connect objects or things to the computerized world for information forwarding [6]. But, most of these IoT object is easily compromised and hacked. Accordingly, the security of IoT has become a challenging consideration. The risk revealed to the smart device should be resolved [7]. The battle among malware designers and security experts is an everlasting fight. Current studies emphasize the growth of things as a result of which the pattern of malware is emerging. For identifying and detecting this malware the ML method is employed. To remain conscious of malware, security specialists and experts should continually extend their cyber defences. One key element is a maximal secured system at the endpoint. Endpoint defence offers a set of security strategies e.g., email security, firewall, anti-spam, sandboxing, and URL filtering. Currently, ML method plays an important role in cyber-security for detecting anomalies. Various methods like behavioural-based methods, anomaly-based methods, signature-based systems, and so on. But, behavioural-based method is very effective when compared to the anomaly and signature-based methods. Because of the heterogeneous norm of IoT deployment, emerging an effective network forensic solution demand depth-analysis for detecting and tracing attacks [8–10].
Koroniotis et al. [11] proposed a network forensic architecture called Particle Deep Framework (PDF), depending on deep learning and optimization method. Next, usage of optimization technique based PSO to choose the hyperparameter of the DNN. Then, the comparison and of evaluation the performances demonstrated by the DNN with another classification method. Chhabra et al. [12] presented a method for big data forensics, with effective precision and sensitivity. In the suggested method, a comprehensive forensic architecture was presented that uses Google programming method, MapReduce as the support for traffic analysis, translation, and extraction of dynamic traffic feature. For the presented method, researchers have employed publicly available tools such as Mahout, Hadoop, and Hive.
Selim et al. [13] introduced investigative research of finding malicious activities, cyberattacks, and anomalies in a cyber-physical of crucial water framework in the IIoT architecture. This work employs different ML methods for classifying the anomalies event including IIoT hardware failures and attacks. A real-time data set covering fifteen anomaly events of standard system activity were examined for the study of presented model. The test situation includes a wider-ranging of occurrences from hardware failure to water SCADA device damage. Usman et al. [14] presented a hybrid model based on Cyber Threat Intelligence, Dynamic Malware Analysis, Data Forensics, and ML. The presented technique compute severity and highlight the big data forensic problems, assessing the confidence, risk score as well as lifespan at the same time.
Cui et al. [15] examined the usage of a multilayer model to security which generates an exhaust-trail of digital evidence, based on the features of the system attacks. Then, this method is estimated regarding general features of system breaches, and a set of considerations and characteristics for structure designer has been introduced. Zheng et al. [16] proposed a secured storage auditing system that supports effective key updates and is utilized in cognitive industrial IoT platforms. Furthermore, the presented method prolonged to assist batch auditing viz. appropriate for many end devices to audit the data block instantaneously.
This study offers the design of a manta ray foraging optimization (MRFO) based feature selection with optimal stacked autoencoder (OSAE) model, named MFROFS-OSAE model. The primary aim of the MFROFS-OSAE system is to determine the presence of abnormal events in critical industrial infrastructures. The MFROFS-OSAE technique involves several subprocesses namely data gathering, data handling, feature selection, classification, and parameter tuning. Besides, the MRFO based feature selection approach is designed for the optimal selection of feature subsets. Moreover, the OSAE based classifier is derived to detect abnormal events and the parameter tuning process is carried out via the coyote optimization algorithm (COA). The performance validation of the MFROFS-OSAE technique takes place using the benchmark dataset.
The rest of the paper is planned as follows. Section 2 introduces the proposed model, Section 3 develops the experimental validation, and Section 4 draws the conclusion.
This study has designed an MFROFS-OSAE technique for intelligent forensic investigation on critical industrial infrastructures. The proposed model effectively determines the presence of abnormal events in critical industrial infrastructures. The MFROFS-OSAE technique involves several subprocesses namely data gathering, data handling, MFRO based feature selection, SAE based classification, and COA parameter tuning. Fig. 2 demonstrates the overall process of MFROFS-OSAE technique.
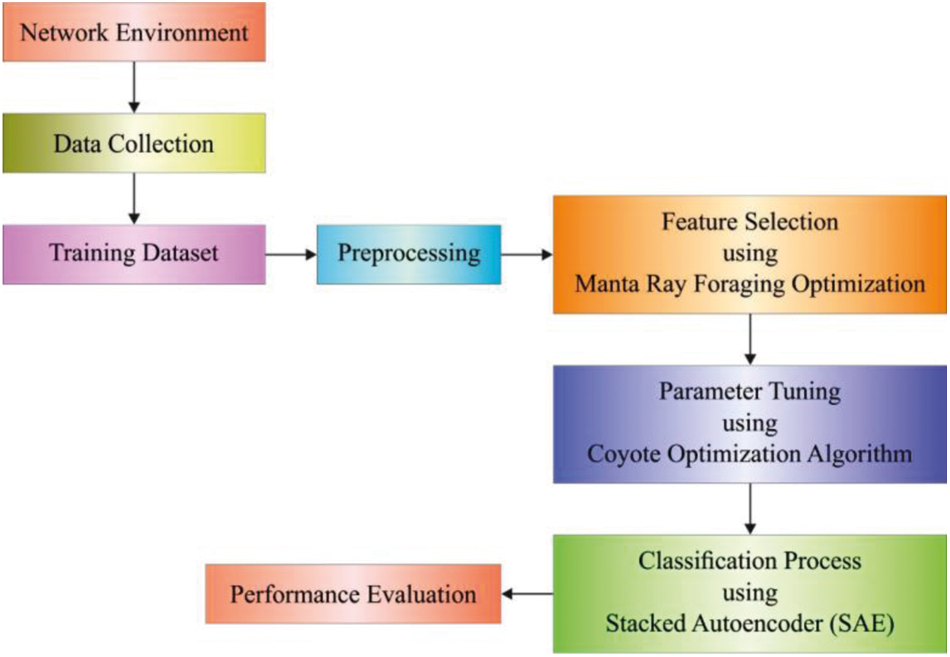
Figure 2: Overall process of MFROFS-OSAE technique
IoT device has been deployed on a network which is under examination. The device has been organized in a promiscuous model, therefore allowing us to view each traffic in a local network. Then, Network packets is performed by applying network capturing tools namely Ettercap, Wireshark, and Tcpdump. The gathered pcap files are later transmitted to the data gathering phase.
This is the initial phase in the network investigation method, where the information is collected in a form that could be further examined and analyzed, namely the UNSW-NB15 and BoT-IoT datasets. At first, for the preservation purpose, an SHA-256 hashing function is applied for maintaining the privacy of the gathered information. By using this hashing function, the generated digest of the gathered files is utilized post-investigation to declare that the primary information hasn't been compromised. Then, the gathered pcaps are treated by data flow extraction models such as Bro or Argus, which extracts the network flow from the pcap file. A further step during this phase is pre-processing, by managing unuseful and missing feature values, producing and re-scaling original features that could help a model training. Afterward cleaning and filtering data sets, the OSAE method is employed for discovering cyberattacks and traces their origin.
2.3 MRFO Based Feature Selection Process
At this stage, the MRFO algorithm can be used to choose an optimal subset of features. Zhao et al. [17] proposed a meta heuristic optimization method called manta ray foraging optimizer (MRFO) stimulated from the manta rays in catching the prey and the foraging behavior. Followed, chain, somersault, and cyclone foraging are the three foraging operators. The chain foraging is mathematically formulated by:
In which
Regarding the location of ith individual excepting the initial one is reliant on the optimal one
where
In which
In the equation, t signifies the existing iteration, T represent the maximal amount of iterations and
In which
Whereas S denotes a factor of somersault applied in determining the manta rays somersault range,
2.4 OSAE Based Classification Process
During classification process, the chosen subset of features is passed into the OSAE model. From the fundamental viewpoint, the AE is an axisymmetric SLNN [19]. The AE encoded the input sensor information by utilizing the hidden state, estimating the minimal error, and attaining the optimum-feature hidden state term. For sample, the AE doesn't learn some practical features with copy and input memory as to implicit state, but it is recreate input data with maximum precision. In order to the adhesion state recognition of locomotive, k groups of observing information
The hidden state was retained at lesser value for ensuring that standard activation value of sparse variable was determined as
When
where
In which, c determines the number and p determined the group and t describes the simulation time for the model variable. In the beginning, random cayote has been produced as a solution candidate in the searching space as follows
In the equation,
The process randomly upgrades the group position. As well, the candidate updated their location by leaving their groups to another one as follows:
The optimal solution of all the iterations is taken into account as the alpha coyotes in the equation:
The general characteristics of the coyote for the culture transformation are given in the following:
Let,
In the equation,
While d defines the dimension for variable. The cultural transition amongst the groups is determined by
Consider,
Whereas
A significant part of this technique is its capacity to escape from the local optimal point.
The performance validation of the MFROFS-OSAE technique takes place using two benchmark datasets namely Bot-IoT and UNSW_NB15 datasets.
Tab. 1 and Fig. 3 offer a brief result analysis of the MFROFS-OSAE technique under various epochs. The results show that the MFROFS-OSAE technique has effectually attained maximum detection performance. For instance, with 10 epochs, the MFROFS-OSAE technique has obtained accuracy, precision, recall, and F-score of 99.94%, 100%, 99.94%, and 99.92% respectively. Moreover, with 30 epochs, the MFROFS-OSAE method has achieved accuracy, precision, recall, and F-score of 99.92%, 100%, 99.95%, and 99.93% correspondingly. Simultaneously, with 50 epochs, the MFROFS-OSAE algorithm has gained accuracy, precision, recall, and F-score of 99.91%, 100%, 99.91%, and 99.91% respectively. Concurrently, with 60 epochs, the MFROFS-OSAE methodology has reached accuracy, precision, recall, and F-score of 99.94%, 100%, 99.95%, and 99.94% correspondingly.

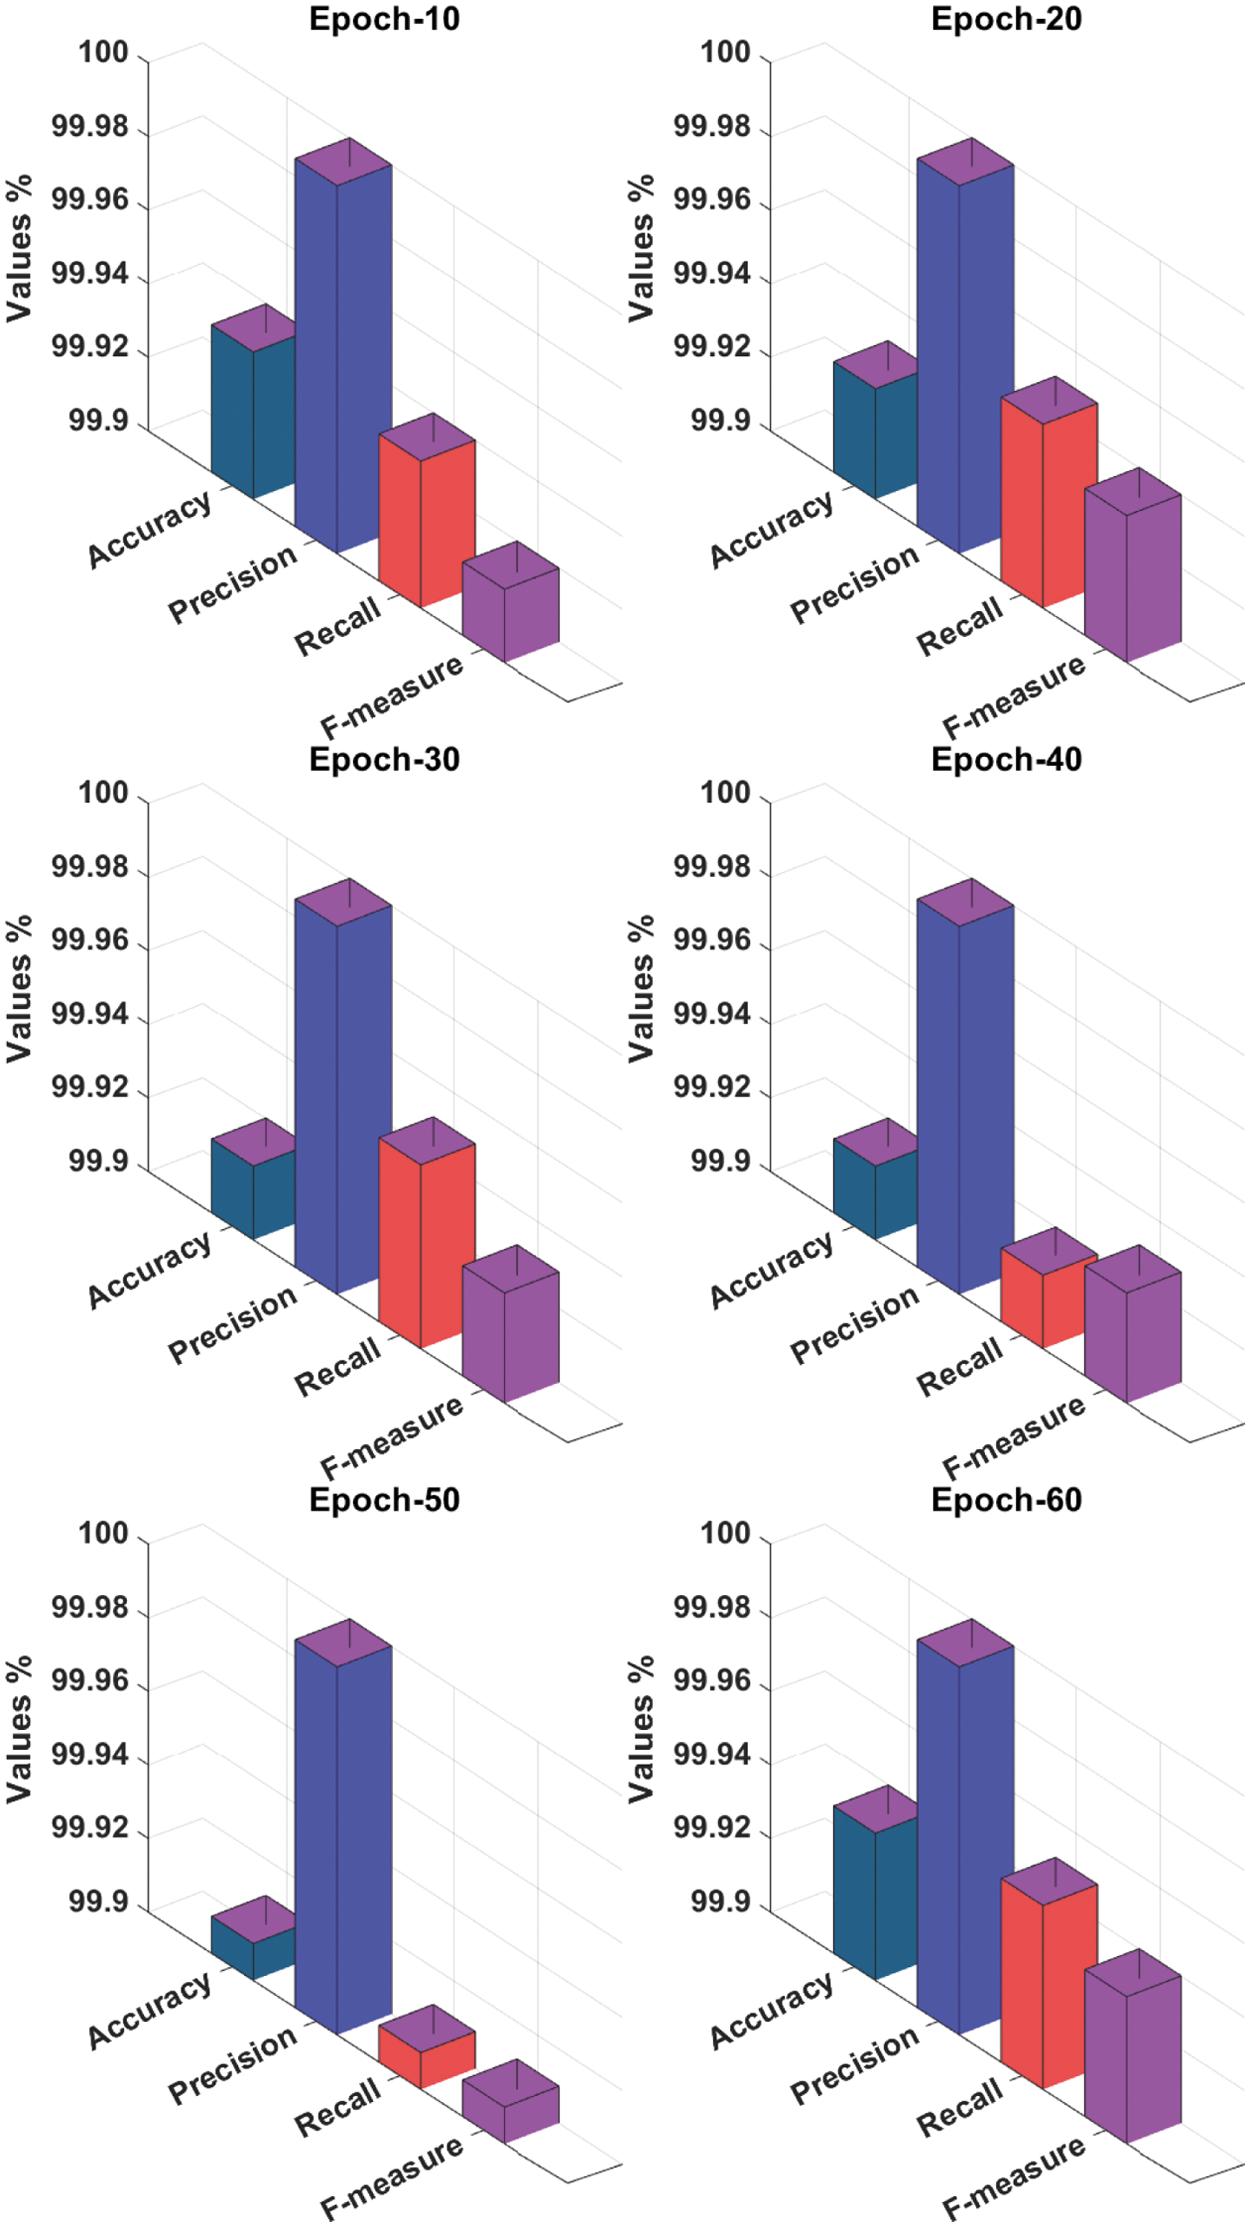
Figure 3: Result analysis of MFROFS-OSAE technique with varying measures
Fig. 4 illustrates the ROC analysis of the MFROFS-OSAE system on the test dataset. The figure shows that the MFROFS-OSAE technique has reached increased outcomes with the minimal ROC of 99.8869.
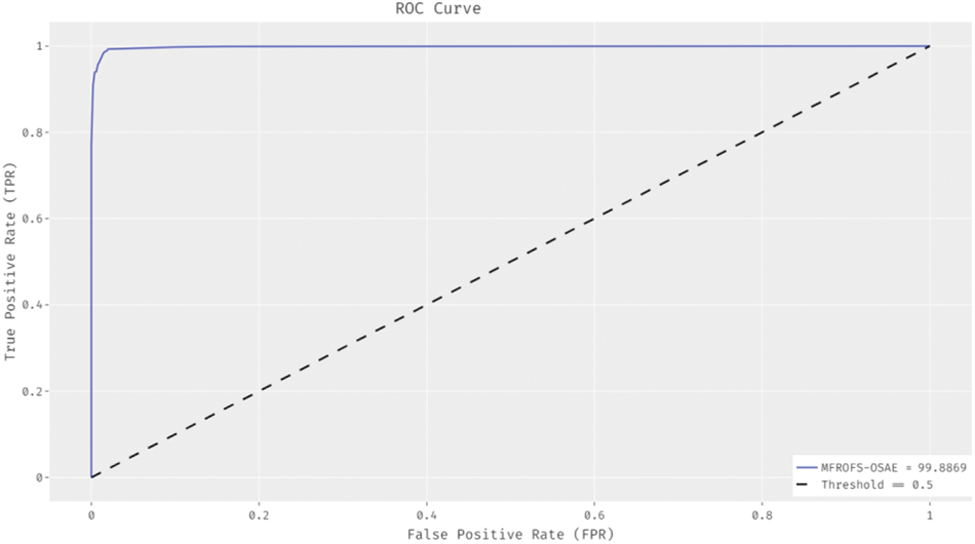
Figure 4: ROC analysis of MFROFS-OSAE technique
Fig. 5 demonstrates the ROC analysis of the OSAE algorithm on the test dataset. The figure depicted that the OSAE method has gained improved outcomes with the lower ROC of 99.8341.
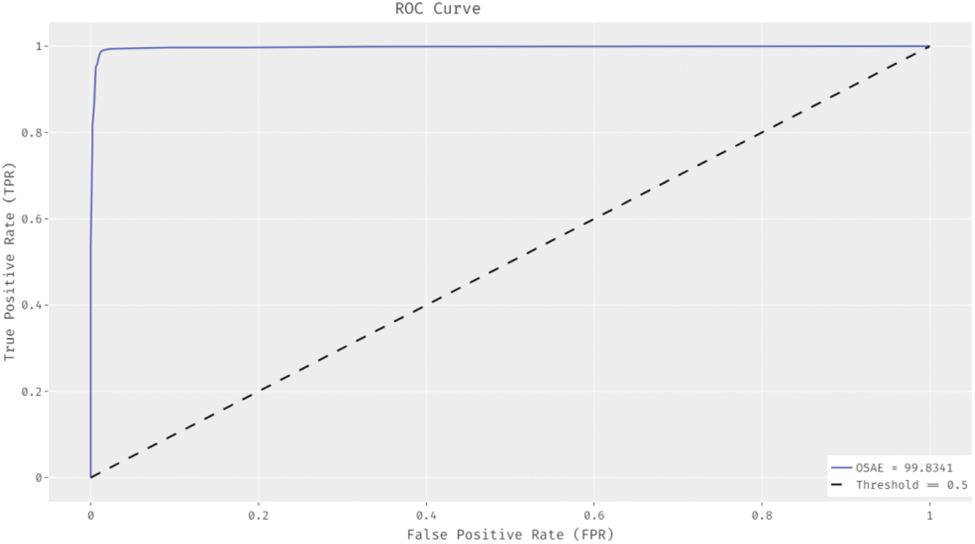
Figure 5: ROC analysis of OSAE technique
Fig. 6 showcases the ROC analysis of the SAE technique on the test dataset. The figure revealed that the SAE algorithm has achieved enhanced outcomes with the minimal ROC of 99.7124.
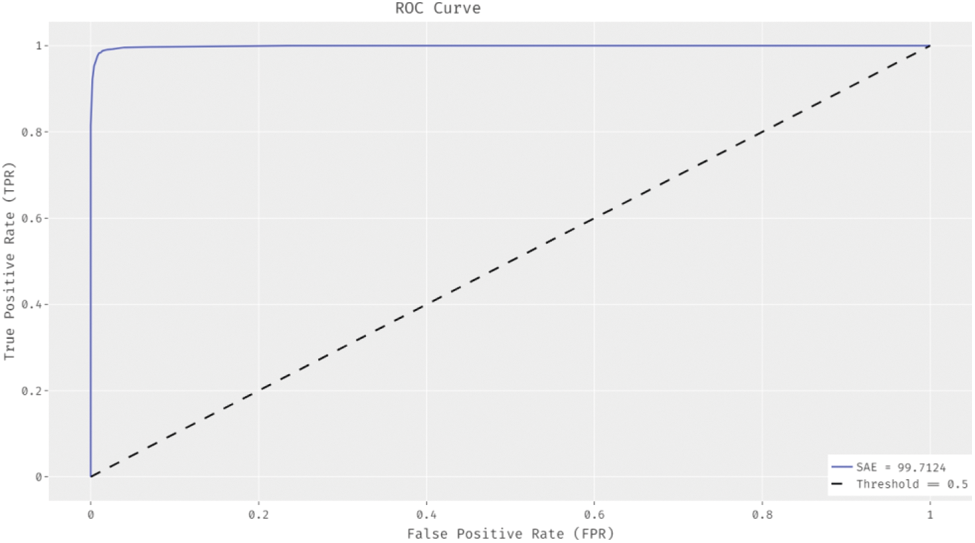
Figure 6: ROC analysis of SAE technique
The DR analysis of the MFROFS-OSAE method with FS-DNN model on the Bot-IoT dataset is given in Tab. 2 and Fig. 7. The results show that the MFROFS-OSAE system has resulted in maximal efficiency over the other one. For instance, the MFROFS-OSAE algorithm has classified the instances under DDoS class with the higher DR of 99.21% whereas the FS-DNN technique has obtained lower DR of 99%. Similarly, the MFROFS-OSAE technique has classified the instances under DoS class with the increased DR of 99.30% whereas the FS-DNN method has attained decreased DR of 99%. Followed by, the MFROFS-OSAE method has classified the instances under Information theft class with the superior DR of 99.01% whereas the FS-DNN system has reached a reduced DR of 99%. At last, the MFROFS-OSAE approach has classified the instances under Normal class with the superior DR of 99.30% whereas the FS-DNN technique has attained lower DR of 99%.

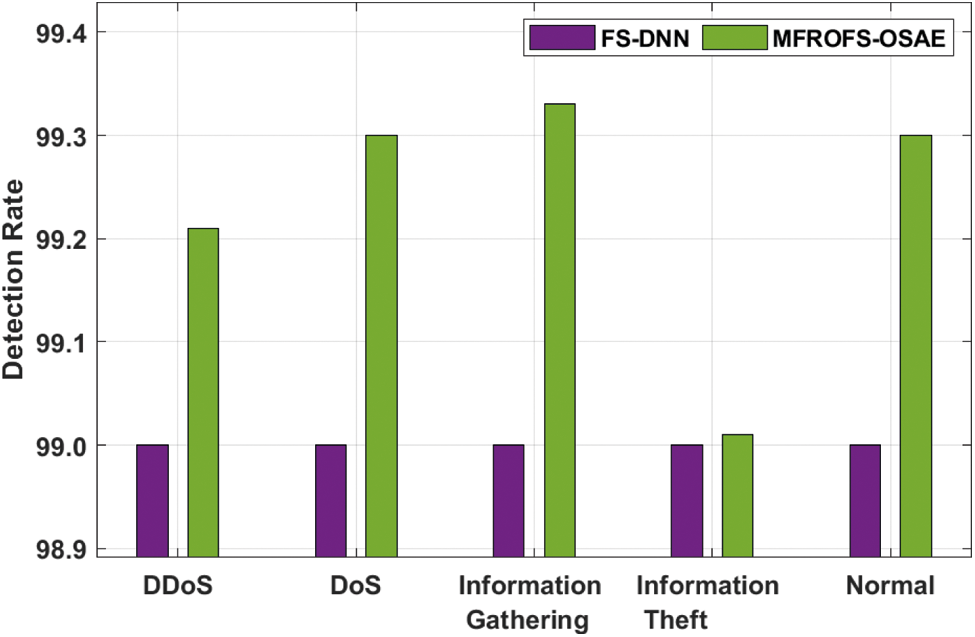
Figure 7: DR analysis of MFROFS-OSAE technique on Bot-IoT dataset
The DR analysis of the MFROFS-OSAE technique with FS-DNN model on the UNSW_NB15 dataset is given in Tab. 3 and Fig. 8. The results show that the MFROFS-OSAE technique has resulted in maximum efficiency over the other one. For instance, the MFROFS-OSAE technique has classified the instances under Normal class with the higher DR of 99.92% whereas the FS-DNN technique has attained lower DR of 99.90%. Likewise, the MFROFS-OSAE approach has classified the instances under Backdoor class with the superior DR of 99.93% whereas the FS-DNN system has attained minimum DR of 99.90%. Similarly, the MFROFS-OSAE technique has classified the instances under Generic class with the maixmum DR of 99.93% whereas the FS-DNN technique has gained minimal DR of 99.90%. Eventually, the MFROFS-OSAE methodology has classified the instances under Shellcode class with the higher DR of 99.92% whereas the FS-DNN algorithm has achieved reduced DR of 99.90%.

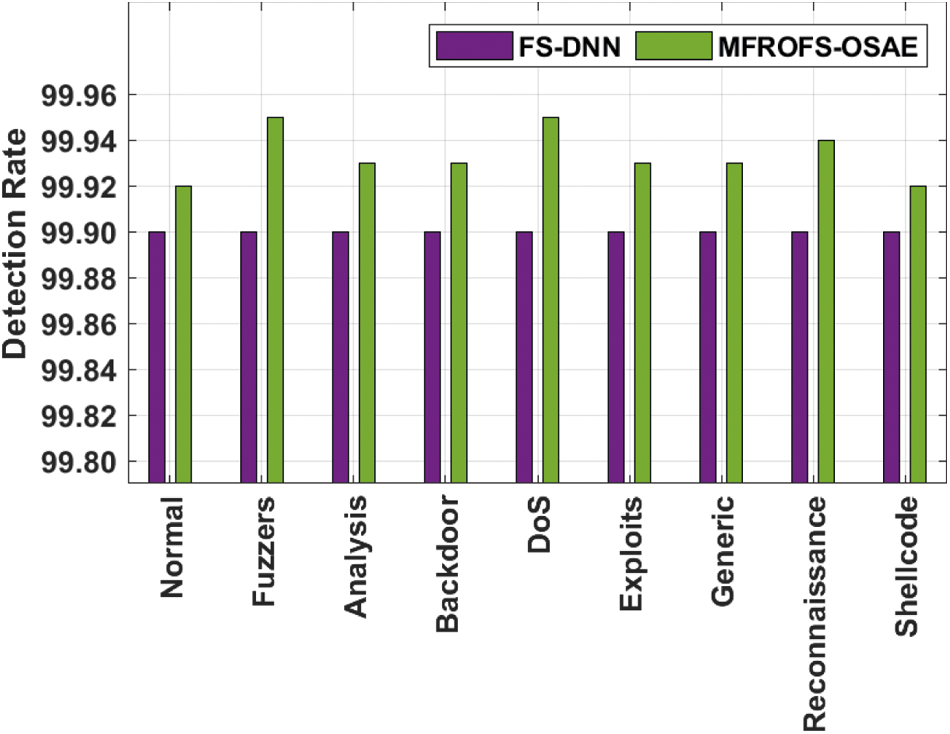
Figure 8: DR analysis of MFROFS-OSAE technique on UNSW_NB15 dataset
Finally, a detailed comparative result analysis of the MFROFS-OSAE technique with existing techniques is made in Tab. 4.

Fig. 9 offers the accuracy and precision analysis of the MFROFS-OSAE technique with recent methods. The results show that the MLP, DT, and SVM models have obtained ineffectual outcomes with lower values of accuracy and precision. Followed by, the NB model has reported moderate accuracy and precision of 93.20% and 94.80% respectively. Though the FS-DNN and RNN models have demonstrated competitive performance, the MFROFS-OSAE technique has resulted in higher accuracy and precision of 99.93% and 100% respectively.
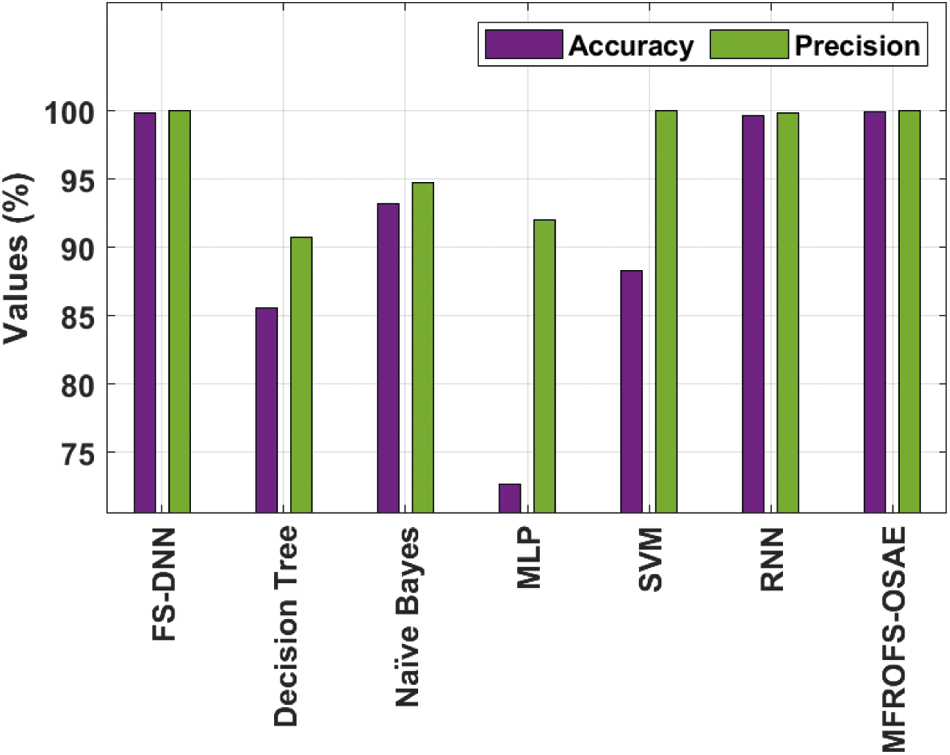
Figure 9: Accuracy and precision analysis of MFROFS-OSAE technique
Fig. 10 provides the recall and F-measure analysis of the MFROFS-OSAE technique with recent approaches. The results demonstrated that the MLP, DT, and SVM techniques have obtained ineffectual outcomes with the minimum values of recall and F-measure. Afterward, the NB methodology has reported moderate recall and F-measure of 94.40% and 94.60% correspondingly. But, the FS-DNN and RNN techniques have demonstrated competitive performance, the MFROFS-OSAE approach has resulted in superior recall and F-measure of 99.94% and 99.93% correspondingly.
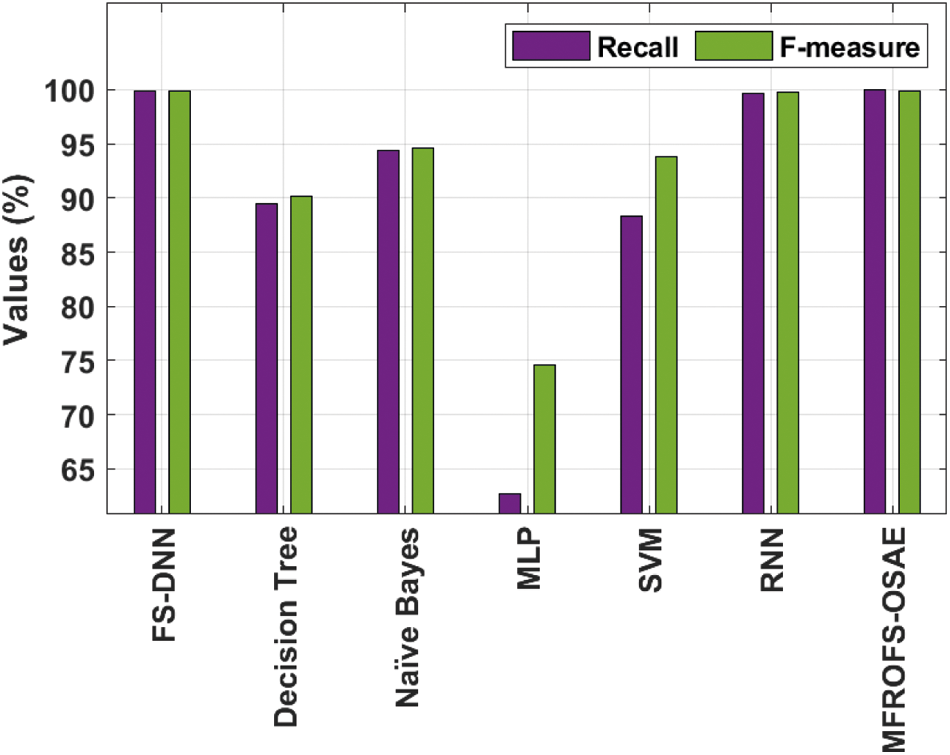
Figure 10: Recall and F-measure analysis of MFROFS-OSAE technique
This study has designed an MFROFS-OSAE technique for intelligent forensic investigation on critical industrial infrastructures. The proposed model effectively determines the presence of abnormal events in critical industrial infrastructures. The MFROFS-OSAE technique involves several subprocesses namely data gathering, data handling, MFRO based feature selection, SAE based classification, and COA parameter tuning. The OSAE based classifier is derived to detect abnormal events and the parameter tuning process is carried out via the COA. The performance validation of the MFROFS-OSAE technique takes place using the benchmark dataset and the experimental results reported the betterment of the MFROFS-OSAE technique over the recent approaches interms of different measures. In future, advanced DL models can be used instead of SAE to accomplish maximum detection rate.
Acknowledgement: The authors extend their appreciation to the Deputyship for Research & Innovation, Ministry of Education in Saudi Arabia for funding this research work through the Project Number (IFPIP-153-611-1442) and King Abdulaziz University, DSR, Jeddah, Saudi Arabia.
Funding Statement: This project was supported financially by Institution Fund projects under Grant No. (IFPIP-153-611-1442).
Conflicts of Interest: The authors declare that they have no conflicts of interest to report regarding the present study.
1. T. J. Holt, Cybercrime Through an Interdisciplinary Lens, New York: Routledge, Taylor & Francis Group, 2017. [Google Scholar]
2. M. Ahmad, Q. Riaz, M. Zeeshan, H. Tahir, S. A. Haider et al., “Intrusion detection in internet of things using supervised machine learning based on application and transport layer features using UNSW-NB15 data-set,” EURASIP Journal on Wireless Communications and Networking, vol. 2021, no. 1, pp. 10, 2021. [Google Scholar]
3. B. Ali and A. Awad, “Cyber and physical security vulnerability assessment for iot-based smart homes,” Sensors, vol. 18, no. 3, pp. 817, 2018. [Google Scholar]
4. S. Prabakaran and S. Mitra, “Survey of analysis of crime detection techniques using data mining and machine learning,” Journal of Physics: Conference Series, vol. 1000, pp. 012046, 2018. [Google Scholar]
5. E. E. D. Hemdan and D. H. Manjaiah, “A cloud forensic strategy for investigation of cybercrime,” in 2016 Int. Conf. on Emerging Technological Trends (ICETT), Kollam, India, pp. 1–5, 2016. [Google Scholar]
6. L. Cheng, K. Tian and D. (Daphne) Yao, “Orpheus: Enforcing cyber-physical execution semantics to defend against data-oriented attacks,” in Proc. of the 33rd Annual Computer Security Applications Conf., Orlando FL USA, pp. 315–326, 2017. [Google Scholar]
7. E. J. Colbert, Cyber-security of SCADA and other Industrial Control Systems, New York, NY: Springer Science + Business Media, 2016. [Google Scholar]
8. C. J. Hsieh and T. Y. Chan, “Detection DDoS attacks based on neural-network using apache spark,” in 2016 Int. Conf. on Applied System Innovation (ICASI), Okinawa, Japan, pp. 1–4, 2016. [Google Scholar]
9. R. Égelé, P. Balaprakash, I. Guyon, V. Vishwanath, F. Xia et al., “AgEBO-tabular: Joint neural architecture and hyperparameter search with autotuned data-parallel training for tabular data,” in Proc. of the Int. Conf. for High Performance Computing, Networking, Storage and Analysis, St. Louis Missouri, pp. 1–14, 2021. [Google Scholar]
10. N. R. Sabar, X. Yi and A. Song, “A bi-objective hyper-heuristic support vector machines for big data cyber-security,” IEEE Access, vol. 6, pp. 10421–10431, 2018. [Google Scholar]
11. N. Koroniotis, N. Moustafa and E. Sitnikova, “A new network forensic framework based on deep learning for Internet of Things networks: A particle deep framework,” Future Generation Computer Systems, vol. 110, pp. 91–106, 2020. [Google Scholar]
12. G. S. Chhabra, V. P. Singh and M. Singh, “Cyber forensics framework for big data analytics in IoT environment using machine learning,” Multimedia Tools and Applications, vol. 79, no. 23–24, pp. 15881–15900, 2020. [Google Scholar]
13. G. E. I. Selim, E. E. D. Hemdan, A. M. Shehata and N. A. El-Fishawy, “Anomaly events classification and detection system in critical industrial internet of things infrastructure using machine learning algorithms,” Multimedia Tools and Applications, vol. 80, no. 8, pp. 12619–12640, 2021. [Google Scholar]
14. N. Usman, S. Usman, F. Khan, M. A. Jan, A. Sajid et al., “Intelligent dynamic malware detection using machine learning in ip reputation for forensics data analytics,” Future Generation Computer Systems, vol. 118, pp. 124–141, 2021. [Google Scholar]
15. H. Cui, R. H. Deng, J. K. Liu, X. Yi and Y. Li, “Server-aided attribute-based signature with revocation for resource-constrained industrial-internet-of-things devices,” IEEE Transactions on Industrial Informatics, vol. 14, no. 8, pp. 3724–3732, 2018. [Google Scholar]
16. W. Zheng, C. F. Lai, D. He, N. Kumar and B. Chen, “Secure storage auditing with efficient key updates for cognitive industrial iot environment,” IEEE Transactions on Industrial Informatics, vol. 17, no. 6, pp. 4238–4247, 2021. [Google Scholar]
17. W. Zhao, Z. Zhang and L. Wang, “Manta ray foraging optimization: An effective bio-inspired optimizer for engineering applications,” Engineering Applications of Artificial Intelligence, vol. 87, pp. 103300, 2020. [Google Scholar]
18. A. Fathy, H. Rezk and D. Yousri, “A robust global MPPT to mitigate partial shading of triple-junction solar cell-based system using manta ray foraging optimization algorithm,” Solar Energy, vol. 207, pp. 305–316, 2020. [Google Scholar]
19. J. Xu, L. Xiang, Q. Liu, H. Gilmore, J. Wu et al., “Stacked sparse autoencoder (SSAE) for nuclei detection on breast cancer histopathology images,” IEEE Transactions on Medical Imaging, vol. 35, no. 1, pp. 119–130, 2016. [Google Scholar]
20. C. Zhang, X. Cheng, J. Liu, J. He and G. Liu, “Deep sparse autoencoder for feature extraction and diagnosis of locomotive adhesion status,” Journal of Control Science and Engineering, vol. 2018, pp. 1–9, 2018. [Google Scholar]
21. M. H. Qais, H. M. Hasanien, S. Alghuwainem and A. S. Nouh, “Coyote optimization algorithm for parameters extraction of three-diode photovoltaic models of photovoltaic modules,” Energy, vol. 187, pp. 116001, 2019. [Google Scholar]
22. Z. Yuan, W. Wang, H. Wang and A. Yildizbasi, “Developed coyote optimization algorithm and its application to optimal parameters estimation of PEMFC model,” Energy Reports, vol. 6, pp. 1106–1117, 2020. [Google Scholar]
 | This work is licensed under a Creative Commons Attribution 4.0 International License, which permits unrestricted use, distribution, and reproduction in any medium, provided the original work is properly cited. |