DOI:10.32604/cmc.2022.026272
| Computers, Materials & Continua DOI:10.32604/cmc.2022.026272 | |
| Article |
AI-based Automated Extraction of Location-Oriented COVID-19 Sentiments
1Federal Government, Melbourne, VIC, 3000, Australia
2Information Systems Department, Umm Al-Qura University (UQU), Makkah, 24382, Saudi Arabia
*Corresponding Author: Fahim K. Sufi. Email: research@fahimsufi.com
Received: 20 December 2021; Accepted: 22 February 2022
Abstract: The coronavirus disease (COVID-19) pandemic has affected the lives of social media users in an unprecedented manner. They are constantly posting their satisfaction or dissatisfaction over the COVID-19 situation at their location of interest. Therefore, understanding location-oriented sentiments about this situation is of prime importance for political leaders, and strategic decision-makers. To this end, we present a new fully automated algorithm based on artificial intelligence (AI), for extraction of location-oriented public sentiments on the COVID-19 situation. We designed the proposed system to obtain exhaustive knowledge and insights on social media feeds related to COVID-19 in 110 languages through AI-based translation, sentiment analysis, location entity detection, and decomposition tree analysis. We deployed fully automated algorithm on live Twitter feed from July 15, 2021 and it is still running as of 12 January, 2022. The system was evaluated on a limited dataset between July 15, 2021 to August 10, 2021. During this evaluation timeframe 150,000 tweets were analyzed and our algorithm found that 9,900 tweets contained one or more location entities. In total, 13,220 location entities were detected during the evaluation period, and the rates of average precision and recall rate were 0.901 and 0.967, respectively. As of 12 January, 2022, the proposed solution has detected 43,169 locations using entity recognition. According to the best of our knowledge, this study is the first to report location intelligence with entity detection, sentiment analysis, and decomposition tree analysis on social media messages related to COVID-19 and has covered the largest set of languages.
Keywords: Entity recognition; AI-based social media monitoring; sentiment analysis; decision support system; COVID-19
Currently, there are about 4.48 million social media users worldwide [1]. Among them, 24.9% share and discuss opinions with others and 21.1% post about their lives [1]. During the ongoing coronavirus disease (COVID-19) pandemic, most of these social media users have been publicly posting periodic contents and status updates on the effects of the COVID-19 situation on their lives or that of others. Analyses of such publicly available social media content can generate valuable information that may assist a strategic decision-maker to make evidence-based policy decisions. For example, a mayor or a counsellor of a city may have the following queries:
• Are people in my city happy about the COVID-19 vaccine roll-out plan?
• Are people upset about lockdowns in my metropolitan area for tackling this situation?
• Do residents in my area have access to polymerase chain reaction (PCR) test centers for screening for this disease?
• Do parents in my locality support distance learning during this pandemic?
There could literally be an unlimited number of location-oriented questions that could facilitate data-driven decision-making. Going through all the social media messages manually to identify the location of interest is often not feasible, since a location might have millions of users (or millions of users could post their comments on a particular location). Therefore, in this study, we propose a new method of fully automated extraction of location-based public sentiments on the COVID-19 situation from social media.
Fig. 1. shows the high-level functional diagram of the proposed system. As the figure shows, Users 1 and 2 have shared their positive feelings about location B. Conversely Users 2, 3, and 4 have negative feelings about the COVID situation in Location A. The proposed system would allow a decision-maker to receive real-time updates about public sentiments on all locations worldwide. As Fig. 1 shows, a strategic decision-maker would see red, green, and yellow traffic light signals across the globe, which highlight public sentiment on the COVID-19 situation in that area. Moreover, by clicking on a particular location (i.e., red, green, or yellow), the user of the proposed system can also view the major concerns of the public about that location, such as about the lack of vaccine and PCR testing centers and about the government policy on lockdowns.

Figure 1: Functional diagram of the automated location-based sentiment extraction on the COVID-19
The proposed system uses techniques based on artificial intelligence (AI) for language detection, automated translation, sentiment analysis, and entity recognition to perform the functionality depicted in Fig. 1. We have deployed the prototype system in Microsoft Office 365 Cloud with Microsoft Power Bi [2], Microsoft Power Automate, and Microsoft Azure and tested the proposed system with Twitter messages from July 15, 2021 to August 10, 2021 that have the word “COVID” or “Corona” [3,4]. Our system automatically extracted 24 different types of entities from these messages from which it automatically clustered five types of location-oriented entities (i.e., City, Continent, Country Region, Language, and State) with aggregated sentiments. Then, we used AI-based decomposition tree analysis to obtain location intelligence from COVID-related social media messages. We evaluated the performance of the location entity algorithm in detail with true positives (TP), false positives (FP), false negatives (FN), Precision, Recall, and F1-score values. The overall entity detection accuracy, including of all non-location entities, was 82.9%. The average precision and recall on the five detected location entities were 0.901 and 0.967, respectively.
We have reported on the use of AI for solving multidisciplinary problems, ranging from abnormality detection from biomedical signals [5–7], person identification from electrocardiograms [8], knowledge discovery from landslide data [9], and global event analysis from online news data [10]. Sentiment analysis, entity detection and translation techniques were used in [10], decomposition tree analysis was used in [9] and other AI based techniques were used in [5–8]. However, none of our previous study were focused into COVID-19 data analysis. In this study, we used AI to automate location-sensitive COVID-19-related situational awareness for supporting evidence-based decision-making.
According to the literature and to the best of our knowledge, the contributions of the presented solution are as follows:
• It is the most accurate aggregation of location-oriented sentiments on the COVID-19 situation.
• It is the first to use AI-based decomposition tree analysis on COVID-related data.
• It employs end-to-end automation in obtaining tweets related to COVID-19, pre-processing, and analyzing with AI.
• It is available to the strategic decision-maker on a diverse range of platforms, including mobiles (both iOS and Android), tablets, and the web.
• It is capable of analyzing COVID-related messages for a robust set of 110 languages.
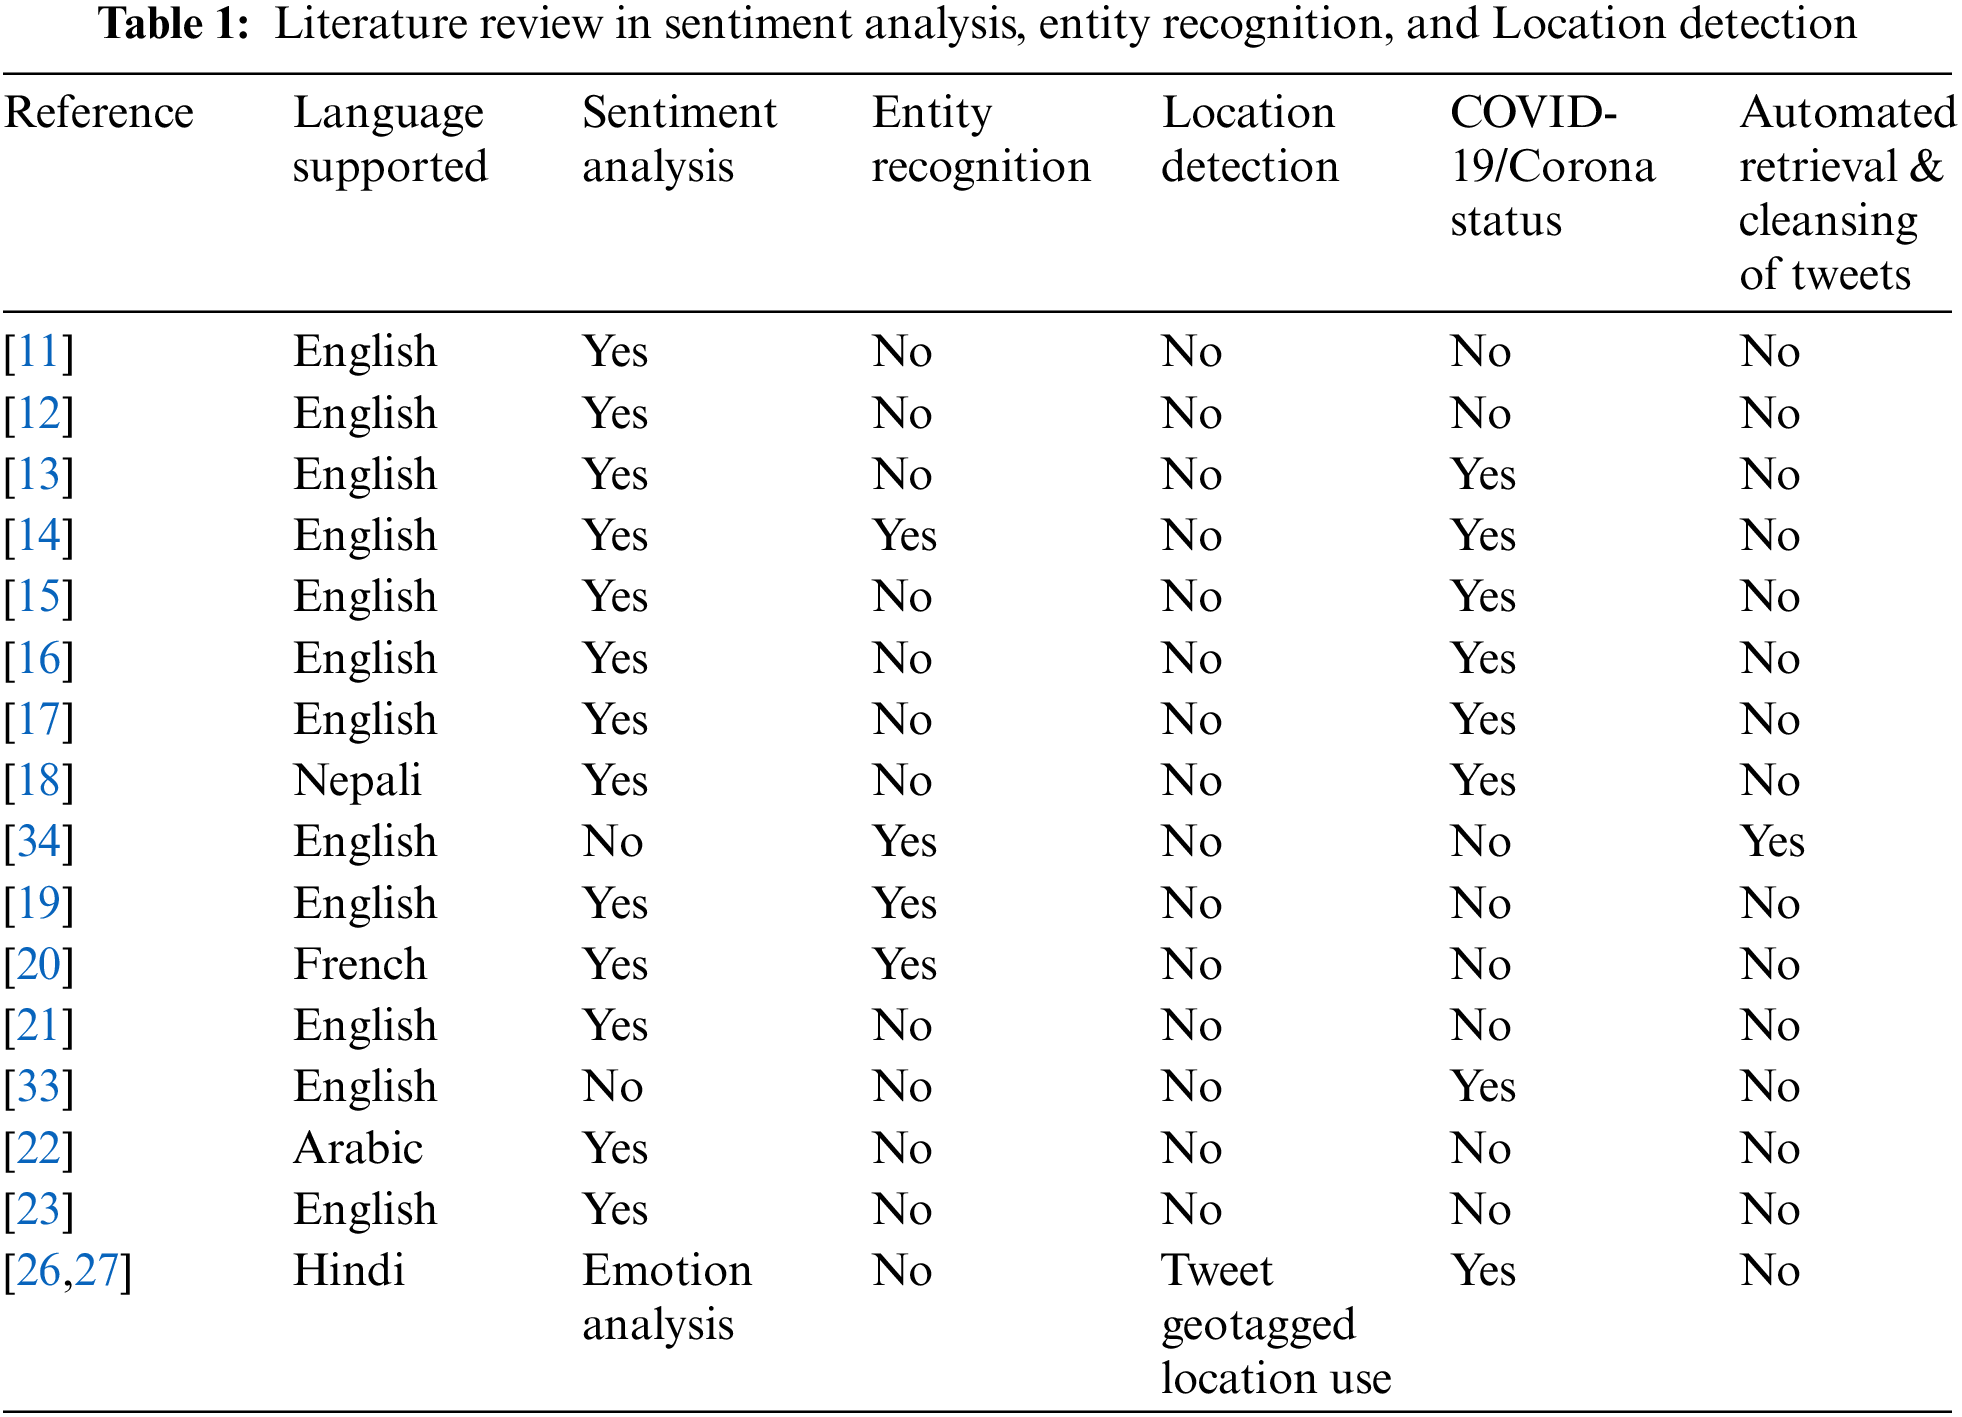
Social media platforms are pervasively used by people to reflect information on different situations. Therefore, social media analysis can provide rich situational information at any given point in time. Research on the sentiment analysis of English text started in 2002 with the publication of two studies: [11,12]. Of these, [11] presented a supervised learning corpus-based machine classifier and [12] presented an unsupervised classifier based on linguistic analysis. In prior studies, sentiment analysis was mostly focused on product and movie reviews. It expanded to other domains with the emergence of social media websites. Several studies followed, such as [11–23]. Recent systematic reviews on sentiment analysis are available in [24]. Sentiment analysis has been used to assess customer feedback for understanding political sentiment, specifically to predict election results [25]. Prior research has collected location-based political messages from Twitter. However, it extracted the tweet locations using the location field of the tweeters [23,26,27]. The main drawback of this method is that people tend to move around, and tweets can retain an old, invalid user address. Moreover, if users have not enabled location services, the analysis of tweets could be flawed. Recent research has demonstrated that fusing the location feature with the sentiment analysis process improves tweet sentiment classification [28].
A study has already reported the sentiment analysis of a large-scale dataset consisting of 90,000 COVID-19-related tweets collected in the first two months of the pandemic (February to March 2020) [13]. The study [13] compared the results of analyses using traditional machine learning methods, such as support vector machine, naive Bayes, decision tree, and random forest, and those of deep learning methods, such as convolution neural network, and bidirectional long short-term memory, in combination with various embedding vectors, such as fastText, Glove, and Word2Vec to classify this COVID-19 tweet dataset into three classes (negative, positive, and neutral). Their results depict that deep learning-based methods outperform traditional machine learning methods. They also fine-tuned transformer-based learning methods, such as BERT, XLNET, and ALBERT [29], and revealed that ALBERT achieved the highest accuracy of 92.90% [13,29]. Another study [14] proposed a sentiment analysis and topic modeling study on COVID-19 tweets to increase the understanding of its trend and concerns. They analyzed 107,990 tweets extracted from December 13 to March 9, 2020. Their results indicate that people have a negative outlook towards COVID-19 and express their views under three themes: COVID-19 pandemic, Control, and Reports.
Further, [15] classified tweets into either positive or negative using the recurrent neural network. They classified their dataset of COVID-19 tweets into four fine-grained classes: weak positive, strong positive, weak negative, and strong negative. Their method outperforms TextBlob [30]. Moreover, [16] collected seven days of tweets on COVID-19 and performed sentiment analysis using TextBlob [30]. Their results show that 60% of tweets were about “smooth and relaxed,” whereas 13% were related to “feeling hopeful.” In contrast, only 7% were related to “relieved mood.” The literature has described situational information on COVID-19 in terms of “caution and advice,” “notifications and measures been taken,” “donations of money, goods, or services,” “emotional support,” “help seeking,” “doubt casting and criticizing,” and “counter rumor” [17]. Researchers in [18] used Nepali tweets and extracted features using fastText-based (ft), domain-specific (ds), and domain-agnostic (da) methods followed by deep learning methods based on convolution neural networks for sentiment analysis.
In addition, [31] provides a comprehensive review of studies that analyzed social media posts on the abuse of prescriptive medication. One finding is that with the help of AI, it becomes easy to find an epidemic at the early stage, track the close contacts of those infected, improve diagnosis and treatment efficiency, predict the possible evolution of viruses, and even predict when and where future outbreaks will occur [32].
One study [19] developed a semantic web platform called PREDOSE (PREscription Drug abuse Online Surveillance and Epidemiology), designed to facilitate the epidemiologic study of prescription (and related) drug abuse practices using social media. It used a drug abuse ontology to recognize three types of data: entities, relationships, and triples [19]. In [19], basic natural language processing approaches are used to extract entities and relationships and to identify sentiment. The keywords searched within [19] were Drug Abuse – Cannabinoids, Buprenorphine, Opioids, Sedatives, and Stimulants. Another study [20] qualitatively analyzed posts about methylphenidate from five French patient web forums, and also analyzed information about misuse or abuse. It collected data from French social networks that mentioned methylphenidate keywords. It used text mining methods, such as named entity recognition and topic modeling, to analyze the chatter as well as to identify adverse reactions.
Another study [21] explored the sentiment expressed by opioid abusers and their endorsement behavior on internet forums automatically. For this study, the keywords searched were oxymorphone, hydromorphone, hydrocodone, oxycodone, morphine, and tramadol [21]. Some authors [22] proposed learning sentiment-specific word embeddings from massive distant supervised Arabic tweets collected by using positive and negative keywords. Then, they [22] used these sentiment embeddings as features in the sentiment classification of Arabic tweets. Authors in [33], used evolutionary K-Means clustering on preprocessed tweets without sentiment analysis or location extractions. Another study extracted three types of entities from health-related tweets [34] for discovering public health information and developing real-time prediction systems with respect to disease outbreak prediction and drug interactions. These entity types were “Disease or Syndrome,” “Sign or Symptom,” and “Pharmacologic Substance” [34]. Studies in [26,27] performed detailed emotional analysis of COVID-19 related social media messages from Hindi language. However, these studies [26,27] did not performed entity extraction based location information extraction and rather used geotagged location information or user specified location information found on the tweeter feed.
Tab. 1 shows that none of the existing studies on AI-based social media analysis has performed location detection for obtaining location-based intelligence. Moreover, none of the existing solutions has used AI-based decompression tree analysis [9,35]. Additionally, these studies have focused on only a single language. The solution we propose in this study addresses the deficiencies of the existing research and introduces a new methodology and algorithm that automates location-sensitive COVID-19 related situational awareness using language detection and translation, sentiment analysis, and entity recognition technology. Moreover, we have implemented the solution and deployed a prototype version in Microsoft Office 365 and Azure cloud using Microsoft ML.Net [3–4,36].
The global proliferation of COVID-19 requires the use of AI) and big data analysis to tackle the problem [32]. Hence, as shown in Fig. 2, we utilized the power of AI-based algorithms, such as sentiment analysis, entity detection, language detection and translation, and decomposition tree analysis, using Microsoft ML.Net [36–39]. In this section, we define and describe the proposed AI-based algorithm mathematically.

Figure 2: Methodology for the proposed location-oriented sentiment analysis algorithm
As shown in Fig. 2, we used the Twitter database for conducting the experimentations we describe in this paper. However, the methodology could be used for any number of social media sites, including Facebook, Instagram, Telegram, and LinkedIn. First, we pre-processed Twitter data and extracted features. Then, on the extracted feature, we performed decompression tree analysis [35] (Fig. 2). We have recently used decompression tree analysis on landslide data [9]. Last, we obtained location intelligence from COVID-19 related messages.
The pre-processing and feature extraction process has multiple stages, such as filtering, language detection, translation, location detection, and sentiment analysis, as Fig. 3 illustrates.

Figure 3: Schematic diagram of pre-processing and feature extraction stage for the proposed solution
All social media messages are denoted by
In the filter stage, messages containing one or more of the selected keywords are captured separately. Therefore, the filtered set of messages,
For all the selected tweets containing the keywords, the language of the tweet needs to be detected by using the Detect_Language() function as follows:
Therefore, going over all the elements of S, a separate language set L is created as
The Translate_English() function translates the non-English tweets into English, so that all the selected tweets of S set transfer into a new English tweet set E. This translation process uses Microsoft Translator API [37–39]. Microsoft Translator is a cloud based machine translation service that can be used to build applications requiring multi-language support. It uses neural machine translation (NMT) for hundreds of supported languages [38,39].
At the end of this stage, all selected tweets are translated into a new set
In this stage, the Detect_Entity() function is used to detect entities for each
As a result, the country set C is created, after going through the entire set of E.
The Analyse_Sentiment() function goes through the selected English translated tweet set having locations, F and creates a new Sentiment Set,
Summarized sentiments yn are generated for all Cn for n = 1 to N, as follows:
where, hm = Analyse_Sentiment (fm), fm refers to location cn, and yn refers to the average sentiment of cn. Fig. 3 was implanted with Algorithm 1 and was deployed using Microsoft's ML.Net [36–39] using Microsoft-based platforms, such as MS Power Automate, MS Power BI, and Microsoft Azure SQL.
3.6 Decomposition Tree Analysis
Microsoft Power BI's Decomposition Tree Visual is a valuable tool for ad hoc exploration and for conducting root-cause analysis, while allowing the user to visualize the data across multiple filter attributes [9,35]. Our implementation of decomposition analysis allows the visualization of location counts over a range of feature attributes, namely, entity type, location, sentiment, and retweets. Our decomposition tree visualization (supported by AI) allows the user to find the next filter attribute condition to drill down into based on either high or low values [9,35].
Since a typical decision-maker requires information to be presented on a wide range of devices to support instant decision-making, we made the deployed solution accessible on a range of devices, including web, tablet, and mobile platforms. As Fig. 3 shows, we used Microsoft Power Automate along with ML.Net and various Application Programming Interfaces (APIs) to implement Algorithm 1. First, using social media APIs and cloud-based MS Power Automate integration tool, the proposed system can integrate social media feeds. As Fig. 4 illustrates, the system is also capable of integrating real-time social media feeds using web scraping with M Language within the Microsoft Power Platform. Social media data with sentiments, translations, and entities were maintained within the MS Azure SQL Server. MS Power BI Service maintains a connection with MS Azure SQL Server for presenting the dynamic content to the strategic decision-maker through mobile, tablet or web interfaces.

Figure 4: Implementation of AI-based COVID-19 situation analysis within Microsoft Power Platform

Twitter is the most popular source for mining medical information [31]. The other social media used for mining of medical data were Instagram, Reddit, Forums, and websites [31]. Therefore, for deploying the proof of concept of the proposed methodology, we selected Twitter as a source of messages on COVID-19. However, the proposed system can work with any other social media platforms, such as Facebook, Instagram, and LinkedIn, via supported APIs with Microsoft Power Platform as depicted in Fig. 4. Moreover, the system can also extract live information from websites by using web scraping technology support in the Microsoft Power Platform (i.e., by using M language).
The proposed system captured all Twitter messages with the word “COVID” or “Corona” from July 15, 2021 to August 10, 2021. During these 25 days, it captured and analyzed 150000 tweet messages on which detailed evaluation was performed. Entities detected with more than 75% confidence were only processed subsequently. There were about 18660 messages with entities detected with a high-level confidence. During the analysis process, first all the non-English language tweets were translated into English. Then, entity detection was performed, and as a result, the 24 entity categories were detected from the 1,866 tweets. These entity categories were Age, City, Color, Continent, Country Region, Date Time, Duration, Event, Language, Length, Money, Number, Number Unit, Organization, Percentage, Person Name, Phone Number, Postal Code, Product, State, Street Address, Temperature, URL and Volume. Of these 24 entity categories, City, Continent, Country Region, Language, and State were selected as entities related to location. Out of the 150 K tweets analyzed, 9900 Tweets contained one or more location entities. In total, 13220 location entities were found, on which detailed sentiment analysis was performed with sentiment confidence. Tab. 2 shows the results of the sentiment analysis for each of the location entity types. As seen from Tab. 2, 5670 locations were assigned with negative sentiments, 5000 locations were assigned with positive sentiment, 1830 locations were assigned with neutral sentiment and 720 locations were found to be of mixed sentiments. Moreover, Tab. 3 presents the average sentiments along with detected entities against each of the location entity types. Tabs. 2, 3, 4, Figs. 5 to 8 reflects data captured during evaluation.
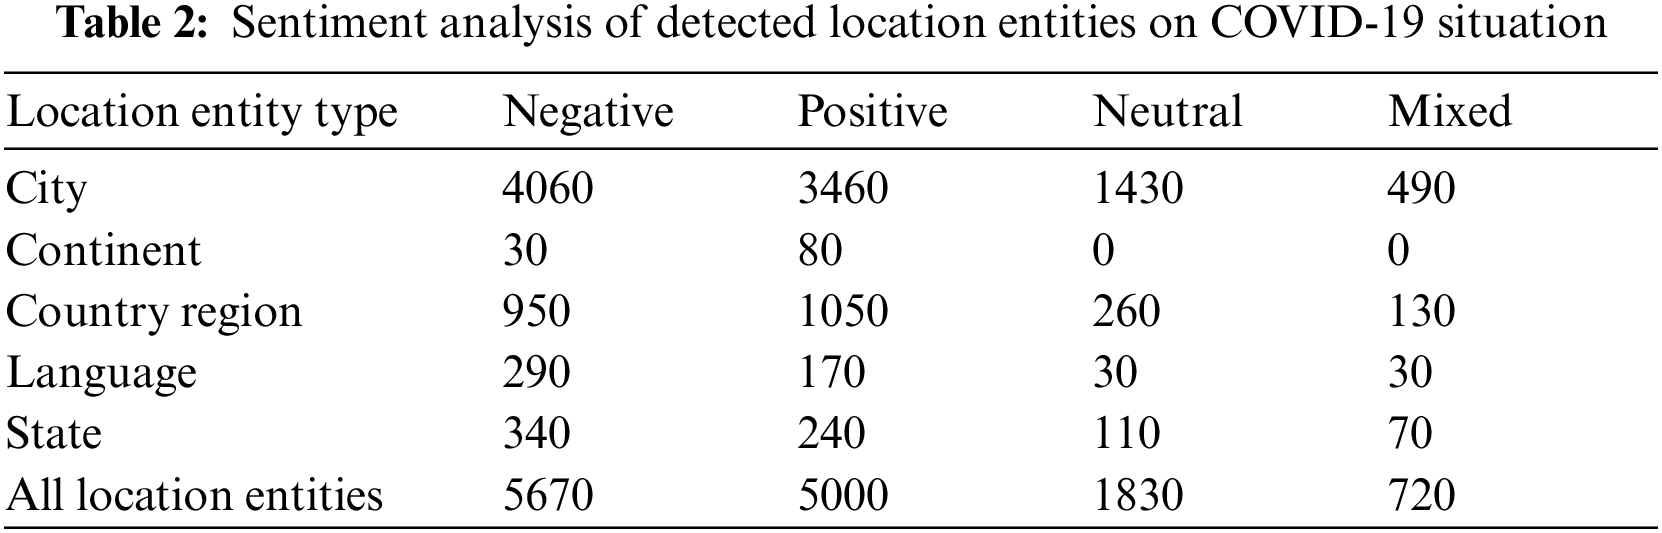
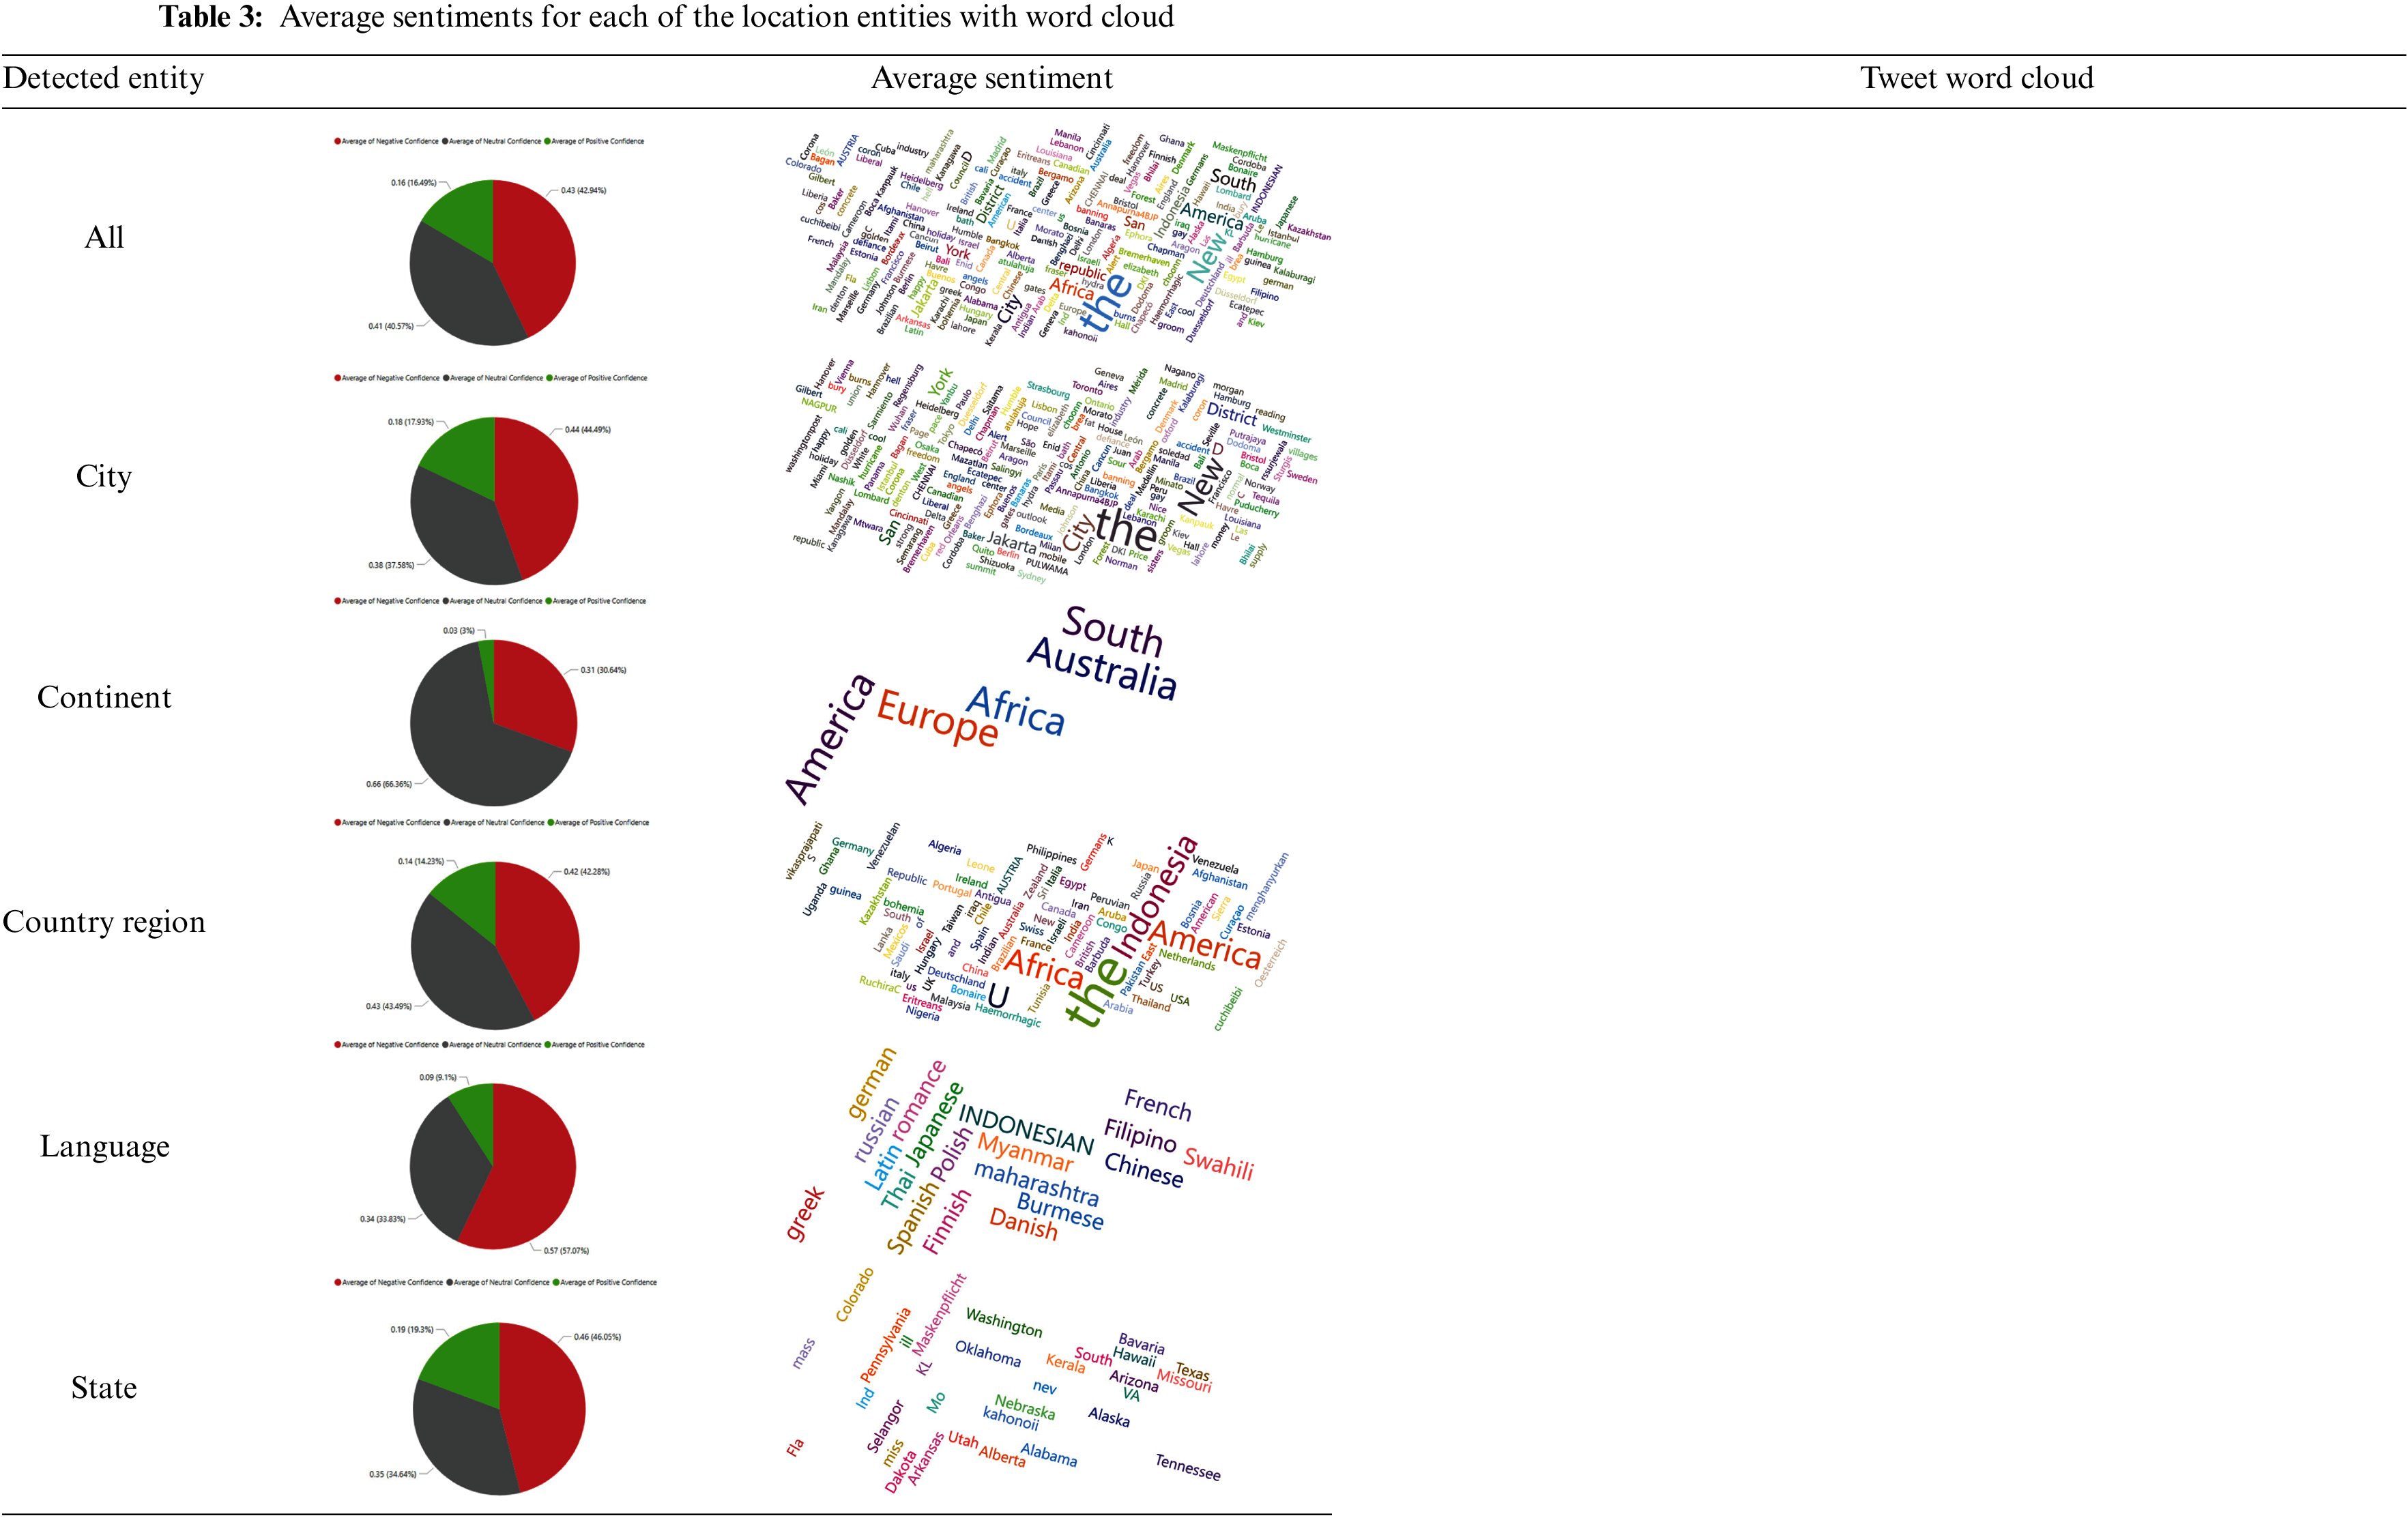


Figure 5: Two-dimensional location showing user of one location commenting about another location

Figure 6: User sentiments from originating to targeted locations and aggregated global sentiments

Figure 7: The most retweeted tweet messages that includes location entities

Figure 8: Decomposition tree analysis shows that entity city type contains highest number of locations
As one study has shown, combining location information with social media messages improves the performance and confidence of sentiment analysis [28]. However, that study [28] used only the geotagged location, which is specified by users. Our proposed system not only uses the user-specified location but also introduces another location dimension through automated location entity extraction from the user's social media posts. Therefore, a decision-maker can gather situational awareness on the COVID-19 situation in a way that was never possible using the methods of related prior studies [11–23,34].
Fig. 5a shows a user from “Colorado, USA” is commenting something negative about the COVID-19 situation of “Texas.” Similarly, Fig. 5b shows a user from “New Delhi, India” is unhappy about the situation in “UK.” Likewise, Fig. 5c shows that a user from “Rio” is dissatisfied about the “Chinese” situation regarding COVID-19 cases. The decision-maker can easily switch between multiple geospatial views from a high-level aggregated view to a detailed view that clearly portrays the origin of the sentiments (i.e., from where the positive, negative, mixed, and neutral sentiments are originating), as shown in Fig. 6. Some tweets have a higher impact in terms of how many times a message has been retweeted. A system user can easily view all the detected locations and the average sentiments for those locations along with the tweet impact (in terms of number of retweets), as Fig. 7 depicts. This figure shows that Greek was the most retweeted word, with 19,628 retweets and average negative confidence of 0.99. This result suggests that during the monitored period, that is, from July 15, 2021 to August 10, 2021, a significant number of social media users showed their dissatisfaction over how Greece handled their COVID-19 situation. The system user can easily click on the desired location to find the key matters with which social media users are dissatisfied. Lastly, Fig. 8 shows how AI-based analyses, such as the decomposition tree analysis, can successfully execute on the extracted features to provide detailed insights and root-cause analysis capability. Fig. 8 shows that the entity type city had the highest number of occurrences. Country region had the second largest number of occurrences, followed by state, language, and continent. Fig. 8 also shows that Lahore (a city in Pakistan) was detected on four social media messages about COVID-19 with three negative and one neutral sentiment. Moreover, the figure also shows the number of retweets, which represents the impact of the relevant social media message.
During our investigation, we observed that our algorithm incorrectly classified a few terms as location entities (i.e., false positives) and could not identify some valid location entities as location entities (i.e., false negatives). Therefore, to assess the performance of our algorithm and system, we used several evaluation metrics, including Precision, Recall, and F1-score. Precision informs what fraction of predictions as a positive class were actually positive. Recall informs what fraction of all positive samples the classifier correctly predicted as positive. The F1-score combines precision and recall into a single measure. Tab. 4 provides the detailed performance evaluation across location entity categories.
As seen from Tab. 4, the average precision, recall and F1-score for the proposed algorithms was found to be 0.829, which significantly higher than previous studies [11–23,34].
As Tab. 4 reveals, the entity types Continent and Language performed the best in terms of Precision and Recall (i.e., both were 1). Country Region had a precision of 0.961 and recall of 0.974 with an F1-score of 0.967. The root cause for the misclassification of country-region entities was that two isolated cases, MENGHANYURKAN and VIKASPRAJAPATI, were classified as country or region. This was because the entity detection process faced difficulties while performing entity detection in some unidentified languages. However, the proposed system was implemented with the language-detection and translation APIs of Microsoft Cognitive Service and Microsoft Text Analytics service that supports more than 110 different languages [37–39]. According to the literature (as shown in Tab. 1), the proposed system is the most comprehensive solution that supports sentiment analysis and entity detection and provides the most comprehensive language coverage. For example, during our tests, there were tweets referring to “Österreich,” and our algorithm correctly classified it as a country (since Österreich is the German name for Austria). Therefore, our system was proven to be robust enough to detect country names translated in different languages.
The Precision score for city was slightly lower, since in many tweets related to COVID-19, the word “ILL” (signifying ill or unwell) appeared. However, ILL was being recognized as Illinois State. Similarly, a few words, such as “Media” and “Nice,” were misclassified as Cities (since Media is a city in Dubai and Nice is a city in France). Except for these errors in classification, the proposed system could successfully detect almost all the locations that were mentioned in the tweets. Moreover, these detected locations were analyzed for location-specific sentiment that would assist a decision-maker in terms of obtaining public perception on a desired location, with a click of a button.
Since we deployed the entire solution on the Microsoft BI service (as shown in Fig. 3), a strategic decision-maker would be able to access the solution through several means, such as tablets, the web, and even mobiles. Fig. 9 shows a user using the deployed solution on a Samsung Note 10 Lite mobile device. In addition to testing the deployed solution in the Android environment, it was successfully tested on iOS devices. It should be mentioned that even though Tabs. 2, 3, 4, Figs. 5 to 8 reflects data captured during evaluation, the deployed system is still running as of 12 January, 2022 and COVID-19 related tweets are automatically being analyzed. Tab. 5 summarized the result July, 2021 to January, 2022. As seen from Tab. 5 the highest number of locations detected was for the month of December, 2021 (7369 locations detected). The highest number of translations to English language carried out in November, 2021 (i.e., 4525).

Figure 9: COVID-19 location detection system deployed in mobile environment (Samsung Note 10 Lite)

The COVID-19 pandemic has affected the lives of social media users in an extraordinary manner. People are constantly updating their social media feeds with posts about its various related aspects, such as lockdowns, restrictions, vaccinations, treatments, and testing, against one or more locations. It is technically possible to extract location-specific social media messages for answering questions such as “Are citizens within a particular location becoming frustrated about the borders being closed for such a long time? Should the government implement strategies towards opening the border?”. Obtaining real-time feedback on these and other questions related to location is of critical importance to a strategic decision-maker for evidence-based decision-making.
According to the best of our knowledge, this study is the first to report the extraction of location entities from COVID-19-related social media posts for understanding users’ sentiments about the desired location. Through the usage of a new algorithm (presented in Algorithm 1) and a scalable cloud-based architecture (presented in Fig. 4), the proposed system harnesses novelty in terms of the following:
• Unlike the solutions proposed in other studies [11–23,34], the proposed system is capable of detecting and translating social media opinions in 110 languages. Therefore, the presented solution has a greater awareness of social media content than these solutions do.
• Prior studies [19–20,34] have performed entity detection for less than 10 entity types. However, the proposed system detected 24 different types of entities with 82.9% accuracy. The average precision and recall on the five detected location entities were 90.10% and 96.70%, respectively.
• Other studies (as shown in [11–23,34]) have performed sentiment analysis on a single language, such as English, Hindi, Arabic, French, and Nepali. However, the proposed system can perform sentiment analysis on more than 110 languages. As shown is Tab. 5, our system performed more than 25 K automatic translations between 15 July, 2021 to 12 January, 2022.
• Unlike the solutions in earlier studies, the presented solution is fully automated, and cloud-hosted. A decision-maker (i.e., a politician, a government official, or even a researcher) can easily access location-based sentiments on COVID-19 and perform a wide variety of analysis, as shown in Figs. 5–8, and Tab. 3, through multiple platforms, including the web, tablets, and mobiles.
In our future research, we aim to elaborate our deployment and include other social media feeds (e.g., Facebook, Instagram, LinkedIn, and YouTube) for a more robust location-oriented situational awareness dashboard on COVID-19 monitoring. Moreover, in future, we would also like to elaborate the sentiment analysis with detailed emotional model analysis [26,27] for multiple languages.
Funding Statement: The authors received no specific funding for this study.
Conflicts of Interest: The authors declare that they have no conflicts of interest to report regarding the present study.
1. Datareportal, “Global social media stats,” 2022. [Online]. Available: https://datareportal.com/social-media-users. [Accessed 20 August 2021]. [Google Scholar]
2. Microsoft Power BI, “Download power BI desktop,” 2021. [Online]. Available: https://app.powerbi.com/. [Google Scholar]
3. F. Sufi, “Entity detection and sentiment analysis on COVID-19 situation,” 17 8 2021. [Online]. Available: https://app.powerbi.com/view?r=eyJrIjoiZGQzNDhhYjctYjZkZi00ZDllLWExZDgtZTJjMjk1NTQ4ZTc4IiwidCI6IjBkMWI4YmRlLWZmYzEtNGY1Yy05NjAwLTJhNzUzZGFjYmEwNSJ9. [Google Scholar]
4. F. Sufi, “GitHub repository of COVID-19 entities with sentiment analysis,” 17 8 2021. [Online]. Available: https://github.com/DrSufi/COVID_Sentiment_Entity. [Google Scholar]
5. F. Sufi, Q. Fang, I. Khalil and S. S. Mahmoud, “Novel methods of faster cardiovascular diagnosis in wireless telecardiology,” IEEE Journal on Selected Areas in Communications, vol. 27, no. 4, pp. 537–552, 2009. [Google Scholar]
6. F. Sufi and I. Khalil, “Diagnosis of cardiovascular abnormalities from compressed ECG: A data mining-based approach,” IEEE Transactions on Information Technology in Biomedicine, vol. 15, no. 1, pp. 33–39, 2010. [Google Scholar]
7. F. Sufi and I. Khalil, “A clustering based system for instant detection of cardiac abnormalities from compressed ECG,” Expert Systems with Applications, vol. 38, no. 5, pp. 4705–4713, 2011. [Google Scholar]
8. F. Sufi and I. Khalil, “Faster person identification using compressed ECG in time critical wireless telecardiology applications,” Journal of Network and Computer Applications, vol. 34, no. 1, pp. 282–293, 2011. [Google Scholar]
9. F. K. Sufi and M. Alsulami, “Knowledge discovery of global landslides using automated machine learning algorithms,” IEEE Access, vol. 9, pp. 131400–131419, 2021. [Google Scholar]
10. F. Sufi and M. Alsulami, “Automated multidimensional analysis of global events with entity detection, sentiment analysis and anomaly detection,” IEEE Access, vol. 9, no. 21276826, pp. 152449–152460, 2021. [Google Scholar]
11. B. Pang, L. Lee and S. Vaithyanathan, “Thumbs up?: Sentiment classification using machine learning techniques,” in Proc. of the 2002 Conf. on Empirical Methods in Natural Language Processing (EMNLP 2002), Philadelphia, pp. 79–86, 2002. [Google Scholar]
12. P. D. Turney, “Thumbs up or thumbs down?: Semantic orientation applied,” in Proc. of the 40th Annual Meeting on Association for Computational Linguistics, Philadelphia, pp. 417–424, 2002. [Google Scholar]
13. U. Naseem, I. Razzak, M. Khushi, P. W. Eklund and J. Kim, “COVIDSenti: A large-scale benchmark twitter,” IEEE Transactions on Computational Social Systems, vol. 8, no. 4, pp. 1003–1015, 2021. [Google Scholar]
14. S. Boon-Itt and Y. Skunkan, “Public perception of the COVID-19 pandemic on twitter: Sentiment analysis and topic modeling study,” JMIR Public Health and Surveillance, vol. 6, no. 4, pp. e21978:1–17, 2020. [Google Scholar]
15. L. Nemes and A. Kiss, “Social media sentiment analysis based on COVID-19,” Journal of Information and Telecommunication, vol. 5, no. 1, pp. 1–15, 2020. [Google Scholar]
16. K. H. Manguri, R. N. Ramadhan and P. R. M. Amin, “Twitter sentiment analysis on worldwide COVID-19 outbreaks,” Kurdistan Journal of Applied Research (KJAR), vol. 5, no. 3, pp. 54–63, 2020. [Google Scholar]
17. L. Li, Q. Zhang, X. Wang and J. Zhang, “Characterizing the propagation of situational information in social media during COVID-19 epidemic: A case study on weibo,” IEEE Transactions on Computational Social Systems, vol. 7, no. 2, pp. 556–562, 2020. [Google Scholar]
18. C. Sitaula, A. Basnet, A. Mainali and T. B. Shahi, “Deep learning-based methods for sentiment analysis on nepali COVID-19-related tweets,” Computational Intelligence and Neuroscience, vol. 2021, no. 2158184, pp. 1–11, 2021. [Google Scholar]
19. D. Cameron, G. A. Smith, R. Daniulaityte, A. P. Sheth, D. Dave, L. Chen, G. Anand, R. Carlson, K. Z. Watkins and R. Falck, “PREDOSE: A semantic web platform for drug abuse epidemiology using social media,” Journal of Biomedical Informatics, vol. 46, no. 6, pp. 985–997, 2013. [Google Scholar]
20. X. Chen, C. Faviez, S. Schuck, A. Lillo-Le-Louët, N. Texier et al., “Mining patients’ narratives in social media for pharmacovigilance: Adverse effects and misuse of methylphenidate,” Frontiers in Pharmacology, vol. 9, no. 541, pp. 1–17, 2018. [Google Scholar]
21. E. C. McNaughton, R. A. Black, M. G. Zulueta, S. H. Budman and S. F. Butler, “Measuring online endorsement of prescription opioids abuse: An integrative methodology,” Pharmacoepidemiology and Drug Safety, vol. 21, no. 10, pp. 1081–1092, 2012. [Google Scholar]
22. N. Al-Twairesh and H. Al-Negheimish, “Surface and deep features ensemble for sentiment analysis of arabic tweets,” IEEE Access, vol. 7, pp. 84122–84131, 2019. [Google Scholar]
23. G. Vashisht and Y. N. Sinha, “Sentimental study of CAA by location-based tweets,” International Journal of Information Technology, vol. 13, pp. 1555–1567, 2021. [Google Scholar]
24. M. V. Mäntylä, D. Graziotin and M. Kuutila, “The evolution of sentiment analysis-A review of research topics, venues, and top cited papers,” Computer Science Review, vol. 27, pp. 16–32, 2018. [Google Scholar]
25. M. Ebrahimi, A. H. Yazdavar and A. Sheth, “Challenges of sentiment analysis for dynamic events,” IEEE Intelligent Systems, vol. 32, no. 5, pp. 70–75, 2017. [Google Scholar]
26. V. Gupta, N. Jain, P. Katariya, A. Kumar, S. Mohan et al., “An emotion care model using multimodal textual analysis on COVID-19,” Chaos, Solitons & Fractals, vol. 144, no. 110708, pp. 1–9, 2021. [Google Scholar]
27. S. Dhingra, R. Arora, P. Katariya, A. Kumar, V. Gupta et al., “Understanding emotional health sustainability amidst COVID-19 imposed lockdown,” in Sustainability Measures for COVID-19 Pandemic, Singapore, Springer, 2021. [Google Scholar]
28. W. L. Lim, C. C. Ho and C. -Y. Ting, “Sentiment analysis by fusing text and location features of Geo-tagged tweets,” IEEE Access, vol. 8, pp. 181014–181027, 2020. [Google Scholar]
29. Z. Lan, M. Chen, S. Goodman, K. Gimpel, P. Sharma et al., “Albert: A lite bert for self-supervised learning of language representations,” 2020. [Online]. Available: https://arxiv.org/abs/1909.11942v6. [Accessed 1 November 2021]. [Google Scholar]
30. S. Loria, “Textblob documentation, release 0.16,” 26 04 2020. [Online]. Available: https://buildmedia.readthedocs.org/media/pdf/textblob/latest/textblob.pdf. [Accessed 1 November 2021]. [Google Scholar]
31. A. Sarker, A. DeRoos and J. Perrone, “Mining social media for prescription medication abuse monitoring: A review and proposal for a data-centric framework,” Journal of the American Medical Informatics Association, vol. 27, no. 2, pp. 315–329, 2020. [Google Scholar]
32. J. Dong, H. Wu, D. Zhou, K. Li, Y. Zhang et al., “Application of Big data and artificial intelligence in COVID-19 prevention, diagnosis, treatment and management decisions in China,” Journal of Medical Systems, vol. 45, no. 84, pp. 1–11, 2021. [Google Scholar]
33. I. Arpaci, S. Alshehabi, M. Al-Emran, M. Khasawneh, I. Mahariq et al., “Analysis of twitter data using evolutionary clustering during the COVID-19 pandemic,” Computers, Materials & Continua, vol. 65, no. 1, pp. 193–203, 2020. [Google Scholar]
34. E. Batbaatar and K. H. Ryu, “Ontology-based healthcare named entity recognition from twitter messages using a recurrent neural network approach,” International Journal of Environmental Research and Public Health, vol. 16, no. 3628, pp. 1–19, 2019. [Google Scholar]
35. Microsoft Documentation, “Decomposition tree visual: AI split,” 1 Oct 2020. [Online]. Available: https://docs.microsoft.com/en-us/power-bi/visuals/power-bi-visualization-decomposition-tree#ai-splits. [Accessed 10 Jun 2021]. [Google Scholar]
36. Microsoft Documentation, “Machine learning: Algorithms,” 31 3 2021. [Online]. Available: https://docs.microsoft.com/en-gb/dotnet/machine-learning/how-to-choose-an-ml-net-algorithm. [Accessed 6 July 2021]. [Google Scholar]
37. Microsoft Documentation, “Microsoft text analytics API: Languate detection,” 2022. [Online]. Available: https://docs.microsoft.com/en-us/azure/cognitive-services/text-analytics/language-support?tabs=language-&detection. [Accessed 10 August 2021]. [Google Scholar]
38. Microsoft Documentation, “Text translation,” 2022. [Online]. Available: https://www.microsoft.com/en-us/translator/business/translator-api/. [Accessed 10 Jan 2022]. [Google Scholar]
39. Microsoft Documentation, “What is language detection in azure cognitive service for language?” 2021. [Online]. Available: https://docs.microsoft.com/en-us/azure/cognitive-services/text-analytics/how-tos/text-analytics-how-to-language-detection. [Accessed 20 August 2021]. [Google Scholar]
 | This work is licensed under a Creative Commons Attribution 4.0 International License, which permits unrestricted use, distribution, and reproduction in any medium, provided the original work is properly cited. |