DOI:10.32604/cmc.2022.026338
| Computers, Materials & Continua DOI:10.32604/cmc.2022.026338 | |
| Article |
Metaheuristics with Deep Learning Empowered Biomedical Atherosclerosis Disease Diagnosis and Classification
1Department of Industrial and Systems Engineering, College of Engineering, Princess Nourah Bint Abdulrahman University, Riyadh, 11671, Saudi Arabia
2Department of Computer Science, College of Science and Arts, King Khalid University, Mahayil, Asir, Saudi Arabia
3Department of Computer and Self Development, Preparatory Year Deanship, Prince Sattam bin Abdulaziz University, Al-Kharj, 16278, Saudi Arabia
*Corresponding Author: Manar Ahmed Hamza. Email: ma.hamza@psau.edu.sa
Received: 22 December 2021; Accepted: 24 January 2022
Abstract: Atherosclerosis diagnosis is an inarticulate and complicated cognitive process. Researches on medical diagnosis necessitate maximum accuracy and performance to make optimal clinical decisions. Since the medical diagnostic outcomes need to be prompt and accurate, the recently developed artificial intelligence (AI) and deep learning (DL) models have received considerable attention among research communities. This study develops a novel Metaheuristics with Deep Learning Empowered Biomedical Atherosclerosis Disease Diagnosis and Classification (MDL-BADDC) model. The proposed MDL-BADDC technique encompasses several stages of operations such as pre-processing, feature selection, classification, and parameter tuning. Besides, the proposed MDL-BADDC technique designs a novel Quasi-Oppositional Barnacles Mating Optimizer (QOBMO) based feature selection technique. Moreover, the deep stacked autoencoder (DSAE) based classification model is designed for the detection and classification of atherosclerosis disease. Furthermore, the krill herd algorithm (KHA) based parameter tuning technique is applied to properly adjust the parameter values. In order to showcase the enhanced classification performance of the MDL-BADDC technique, a wide range of simulations take place on three benchmarks biomedical datasets. The comparative result analysis reported the better performance of the MDL-BADDC technique over the compared methods.
Keywords: Atherosclerosis disease; biomedical data; data classification; machine learning; disease diagnosis; deep learning
Cardiovascular disease (CVD) is a common term for a multitude of heart illness conditions and disorders. There is another form of CVD, particularly coronary artery disease (CAD), so called atherosclerosis [1]. The number of persons are impacted by heart disease, particularly atherosclerosis. This disease is the major cause of mortality in many nations as per the World Health Organization (WHO). For clinical diagnoses, automatic extraction of data from individual records is problematic [2]. Henceforth, the significance of developing and establishing a Medicinal Diagnostic Support Scheme (MDSS) for automating patients’ prediction and classification of CVD. But healthcare diagnoses study needs higher efficiency and accuracy for making a better medical decision. Although classical MDSS has demonstrated the ability to cover many diagnosis problems, they provide a low precision rate and could not offer accurate diagnoses [3]. In the past few decades, clinical therapy and diagnoses schemes utilizing Machine Learning (ML) and artificial intelligence (AI) techniques have received much recognition. Therefore, this study topic has influenced academic fields namely applied sciences, finances, medical, and biology applications. Subsequently, various studies were introduced for developing MDSS to classify or predict patients with CVD to enhance healthcare [4]. The abovementioned methods predict the existence of disease by using statistical models that need tested objects which should meet the precondition of the models, like logistic regression, time series models, etc. for evaluating the occurrence of disease [5].
Current researches have employed machine learning (ML) methods for diagnosing distinct CVD issues and making a calculation. Fig. 1 illustrates the applications involved in computer aided healthcare. A main challenge of ML is the higher dimension of the data set [6]. The study of various features needs a massive number of storage and results in over-fitting; hence the weighting feature decreases processing time and unwanted information, therefore enhancing the efficiency of the model [7]. Finding a smaller set of features describes distinct diseases of medical images, health management, IoT, and genome expression. Reduction Dimension employs feature extraction to simplify and transform information, whereas feature selection decreases the data set by eliminating unwanted features.
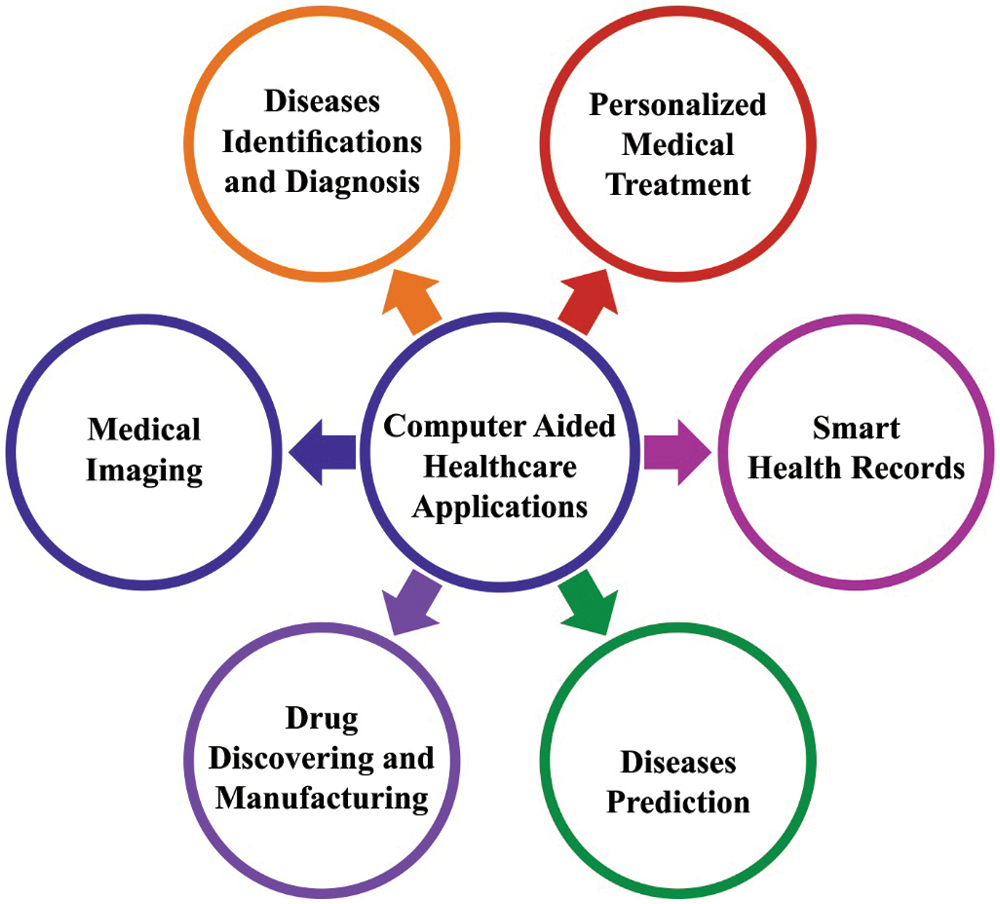
Figure 1: Applications of computer aided healthcare
He et al. [8] presented an evolutionary classification method. The fundamental of the predictive method is a kernel extreme learning machine (KELM) enhanced using salp swarm algorithm (SSA). For getting a good set of features and parameters, the space transformation method is presented from the optimization for improving SSA to obtain an optimum KELM method. Terrada et al. [9] determined an MDSS of CAD disease. This method is capable of giving heart disease predictions via the patient medical information. This MDSS is depending on ML methods like k-means clustering and K-medoids for K-Nearest Neighbor (KNN), classification, and Artificial Neural Network (ANN) for forecasting the absence and presence of Atherosclerosis diseases.
Terrada et al. [10] apply KNN and ANN for predicting patients with or without CVD disease. The method is authorized on Hungarian, Cleveland heart disease, Long Beach VA, and Switzerland datasets. This MDSS is depending on supervised ML models. Munger et al. [11] aim at the present application of ML for providing insights into the atherosclerotic plaque formation and good understanding of atherosclerotic plaque evolution in patients with CVD.
Zhao et al. [12] presented an automated multiclass coronary atherosclerosis plaque classification and detection architecture. First, recovered the transverse cross section and centrelines from the CT angiography. Next, extract the ROI according to the coarse segmentation. Then, extract a random radius symmetry (RRS) feature vector that integrates various determinations into a random approach and significantly increases the trained data. Lastly, fed the RRS feature vectors to the multiclass coronary plaque classifiers.
Parameswari et al. [13] aims at decreasing the disease independent variation without damaging data-based variances among the atherosclerotic eyes and images of healthy. The presented approach allows improvement of illumination in the blood vessel, via renovating them. Lastly, Enhanced Bayesian Arithmetic Classifier (EBAC) is executed for efficient classifier. Cherradi et al. [14] presented a CAD scheme based on KNN and ANN models. Next, employed K-fold cross-validation for splitting the datasets and attaining the optimal method with greater precision and lesser results.
This study develops a novel Metaheuristics with Deep Learning Empowered Biomedical Atherosclerosis Disease Diagnosis and Classification (MDL-BADDC) model. The proposed MDL-BADDC technique designs a novel Quasi-Oppositional Barnacles Mating Optimizer (QOBMO) based feature selection technique. In addition, the deep stacked autoencoder (DSAE) based classification model is designed for the detection and classification of atherosclerosis disease. Finally, the krill herd algorithm (KHA) based parameter tuning technique is applied to properly adjust the parameter values. To showcase the enhanced classification performance of the MDL-BADDC approach, a wide range of simulations take place on three benchmarks biomedical datasets.
In this study, a novel MDL-BADDC technique has been developed for atherosclerosis disease diagnosis and classification. The MDL-BADDC technique incorporates pre-processing, QOBMO based feature selection, DSAE based classification, and KHA based parameter tuning. The application of KHA helps to properly tune the parameters contained in the DSAE model and thereby enhances the detection outcomes. Fig. 2 illustrates the overall process of MDL-BADDC technique.
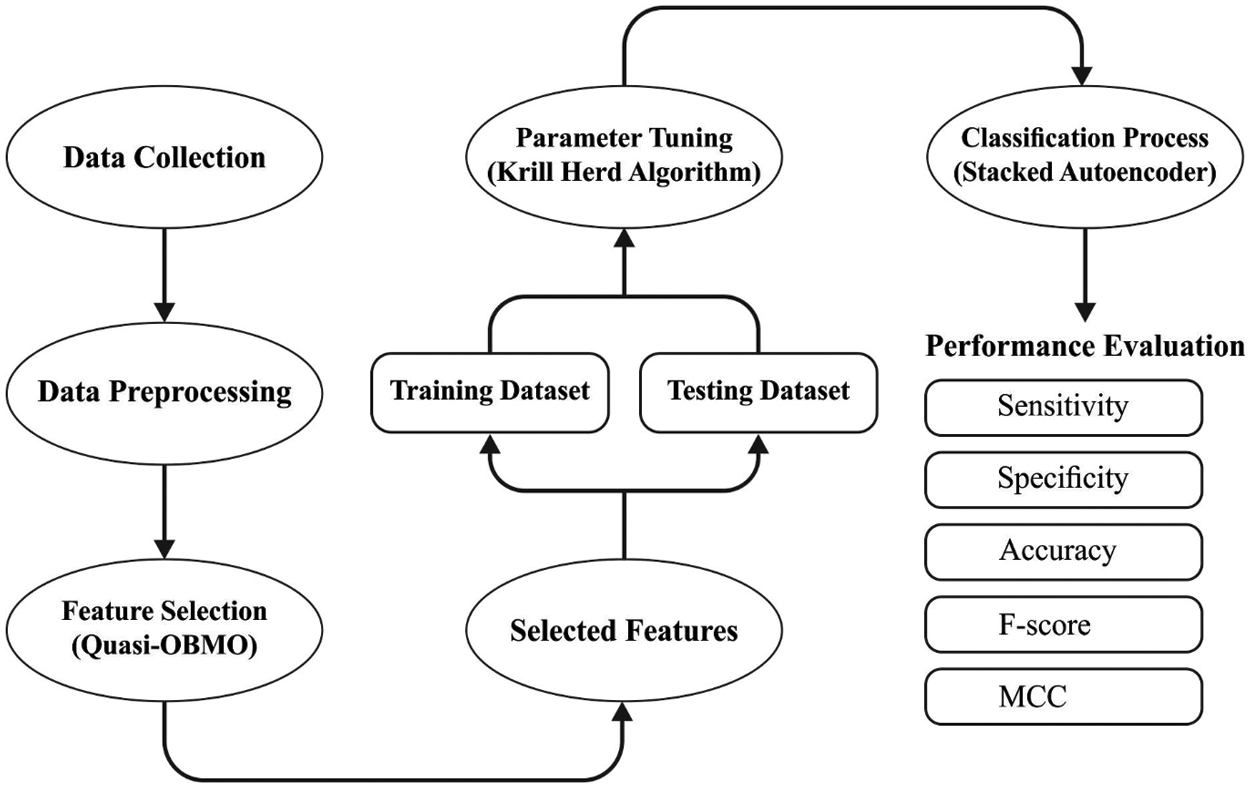
Figure 2: Overall process of MDL-BADDC technique
At first, the preprocessing method takes place for the conversion of non-traditional data set into traditional data set for improving the performance of the presented method. For this, min-max normalization method is performed. NN training is developed an effective on the achievement of pre-processing phase on the network targets inputs. The normalization process for raw input has a better result on making the data that suitable for training [15]. Generally, the feature is being rescaled to be in the interval of [0, 1] or from [−1, 1].
In which
2.2 Design of QOBMO Based Feature Selection
At this stage, the pre-processed biomedical data is passed into the QOBMO algorithm to choose an optimum subset of features. A barnacle is a microorganism that attaches itself to object in the water. The mating groups comprise each neighbor and competitor within reach of the penis. BMO is stimulated by the mating procedure. With simulates initialization, selection, and reproduction processes the realtime optimization issue was resolved [16]: First, considered the candidate solution is barnacle, in which the matrix of the population is formulated by Eq. (2). The calculation of population and sorting procedure are performed for locating the optimal solution at X.
Whereas N represent the barnacle population count, n indicates the amount of control parameters and
whereas p represent the random distribution numbers from the range of zero and one,
In which rand
The OBL is fundamentally established to the drive of decreasing the computational time and enhancing the convergence capabilities of distinct EA [18]. With assuming every of the present population and its opposite population dependent upon OBL, the candidate solution was enhanced. This method is easy and simple for implementing that creates it appropriate for enhancing the efficiency of BMO technique. So, the primary population of this technique was created dependent upon the QOBL technique. Since, the outcome of this comparative, an optimum amongst novel and quasi-opposite solutions was retained from the primary populations. It can improve the variety and exploration of created primary population. Therefore, the technique is typically converged to global optimal with faster rate. The definition of opposite point, opposite number, quasi-opposite point, and quasi-opposite number are provided as follows [19]:
To some arbitrary number
But, the opposite-point to multi-dimension search space (
and the quasi-opposite number
Likewise, the quasi-opposite point to multi-dimension search space (
2.3 Design of Optimal DSAE Based Classification
During classification process, the optimal DSAE model is utilized for the detection and classification of atherosclerosis disease. The AE is an axisymmetric single hidden-layer neural network (SLNN). The AE encodes as input data by utilizing the hidden layer, approximating the minimal error, and attaining the optimal-feature hidden-state [20]. For instance, the AE doesn't learn realtime features by inputting and copying memory into implicit layer, even though it could recreate input data with higher accuracy. In order to adhesion state of locomotive, k set of monitored information
The hidden state was retained at a low value to make sure that average activation values of sparse variable are determined by
If
In which
Antarctic krill is the leading animal species on Earth. The capability to generate huge swarm is most important feature of this species. An individual krill move from the herd if predators like whales, seal, and some another species attacked the herds. This attack decreases the density of KH. The improvement of KH then predation was caused by several parameters. An important purpose of the herd performance of the krill individual is improving krill density and attaining food. KH technique utilizes this multi-objective herd to resolve global optimized issues [22]. To determine food (maximum food focus) and density dependent attractiveness of krill's were utilized as objective. Thus the outcome, a krill individual transfers near-optimum results once it explores to maximum densities of herd and food. This performance generates a KH about the global minimal of optimized issue.
The time-dependent place of individual krill's from
1. Progress induced by another krill individual;
2. Foraging motion
3. Physical or arbitrary diffusion
The subsequent Lagrangian method was generalizing to n dimension decision space:
where
The progress of all krill's individual is determined as:
where
The effects of neighbors are considered as an attraction or repulsion tendency amongst the individuals to a local search.
where
where
The experimental result analysis of the proposed technique takes place using three medical datasets namely Cleveland dataset, Hungarian dataset, and Z-Alizadeh Sani dataset.
The Cleveland dataset has 76 attributes, of that only 14 features are generally utilized in maximum published research: 13 inputs and 1 output. During this case, only 303 instances were utilized by 164 healthy subjects and 139 CAD (coronary artery disease) patients.
The Hungarian dataset [24] has 14 features 13 inputs and 1 output. During this case, only 294 instances were utilized with 188 healthy subjects and 106 CAD patients.
Z-Alizadeh Sani dataset [25] is gathered arbitrarily in heart disease patients at Tehran's Shaheed Rajaei Cardiovascular, Medical and Research Center. This dataset was constructed for CAD diagnosis, having 303 samples by 56 features to all the patients. Classes: 71% of patients ensured CAD and 29% were healthy.
The FS results obtained by the QOBMO technique take place using three datasets [26]. The results show that the QOBMO technique has chosen 9, 8, and 12 features from the test Cleveland, Hungarian, and Z-Alizadeh datasets respectively.
3.1 Result Analysis on Cleveland Dataset
The confusion matrix offered by the MDL-BADDC technique on the test Cleveland dataset is shown in Fig. 3. The figure reported that the MDL-BADDC technique has effectually identified the class labels under all epochs. For instance, with 200 epochs, the MDL-BADDC technique has identified 162 samples under Absent class and 135 samples under Present class. In addition, with 600 epochs, the MDL-BADDC method has identified 160 samples under Absent class and 136 samples under Present class. Along with that, with 1000 epochs, the MDL-BADDC approach has identified 163 samples under Absent class and 137 samples under Present class.
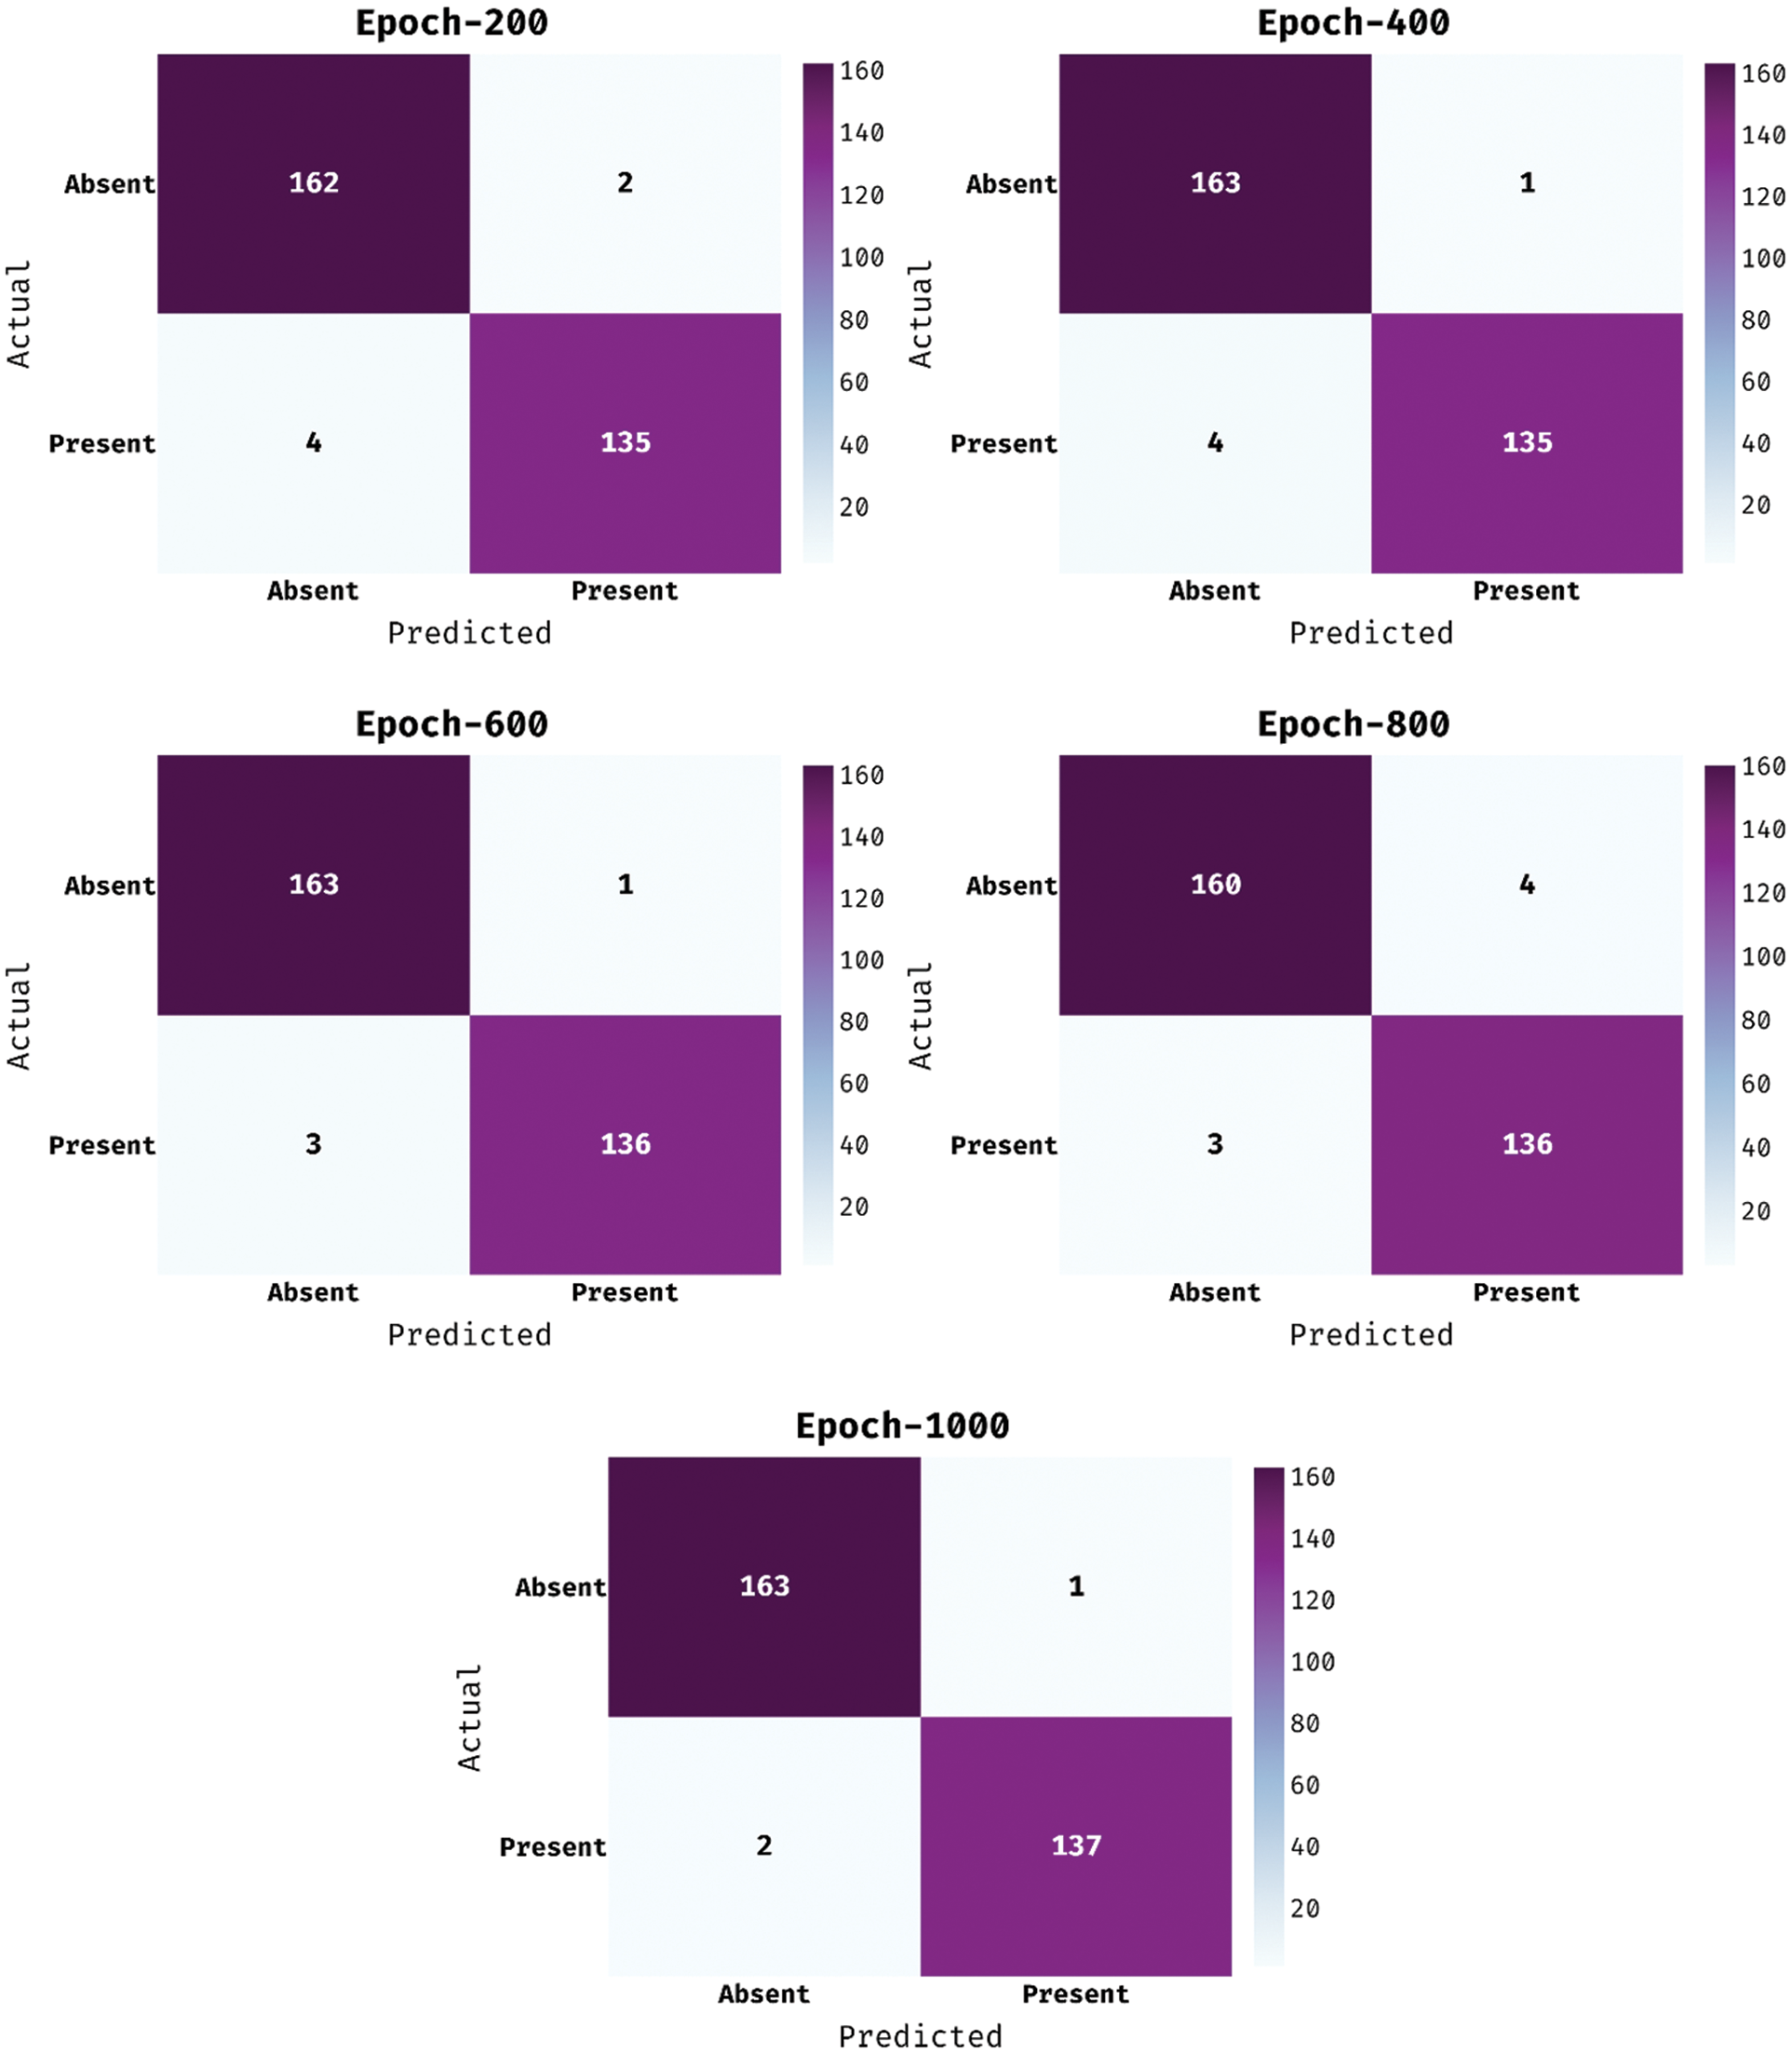
Figure 3: Confusion matrix of MDL-BADDC technique on Cleveland dataset
Detailed result analysis of the MDL-BADDC technique on the test Cleveland dataset is depicted in Tab. 1. The experimental results stated that the MDL-BADDC technique has accomplished effective outcomes under every epoch.

For instance, under 200 epochs, the MDL-BADDC technique has obtained
A comparative result analysis of the MDL-BADDC technique takes place with recent methods in Tab. 2. The figure shows that the weighted fuzzy rules (WFR), C4.5, and Fast Detection Tree (FDT) techniques have obtained lower

3.2 Result Analysis on Hungarian Dataset
The confusion matrix presented by the MDL-BADDC method on the test Hungarian dataset is illustrated in Fig. 4. The figure stated that the MDL-BADDC methodology has effectually identified the class labels under all epochs.
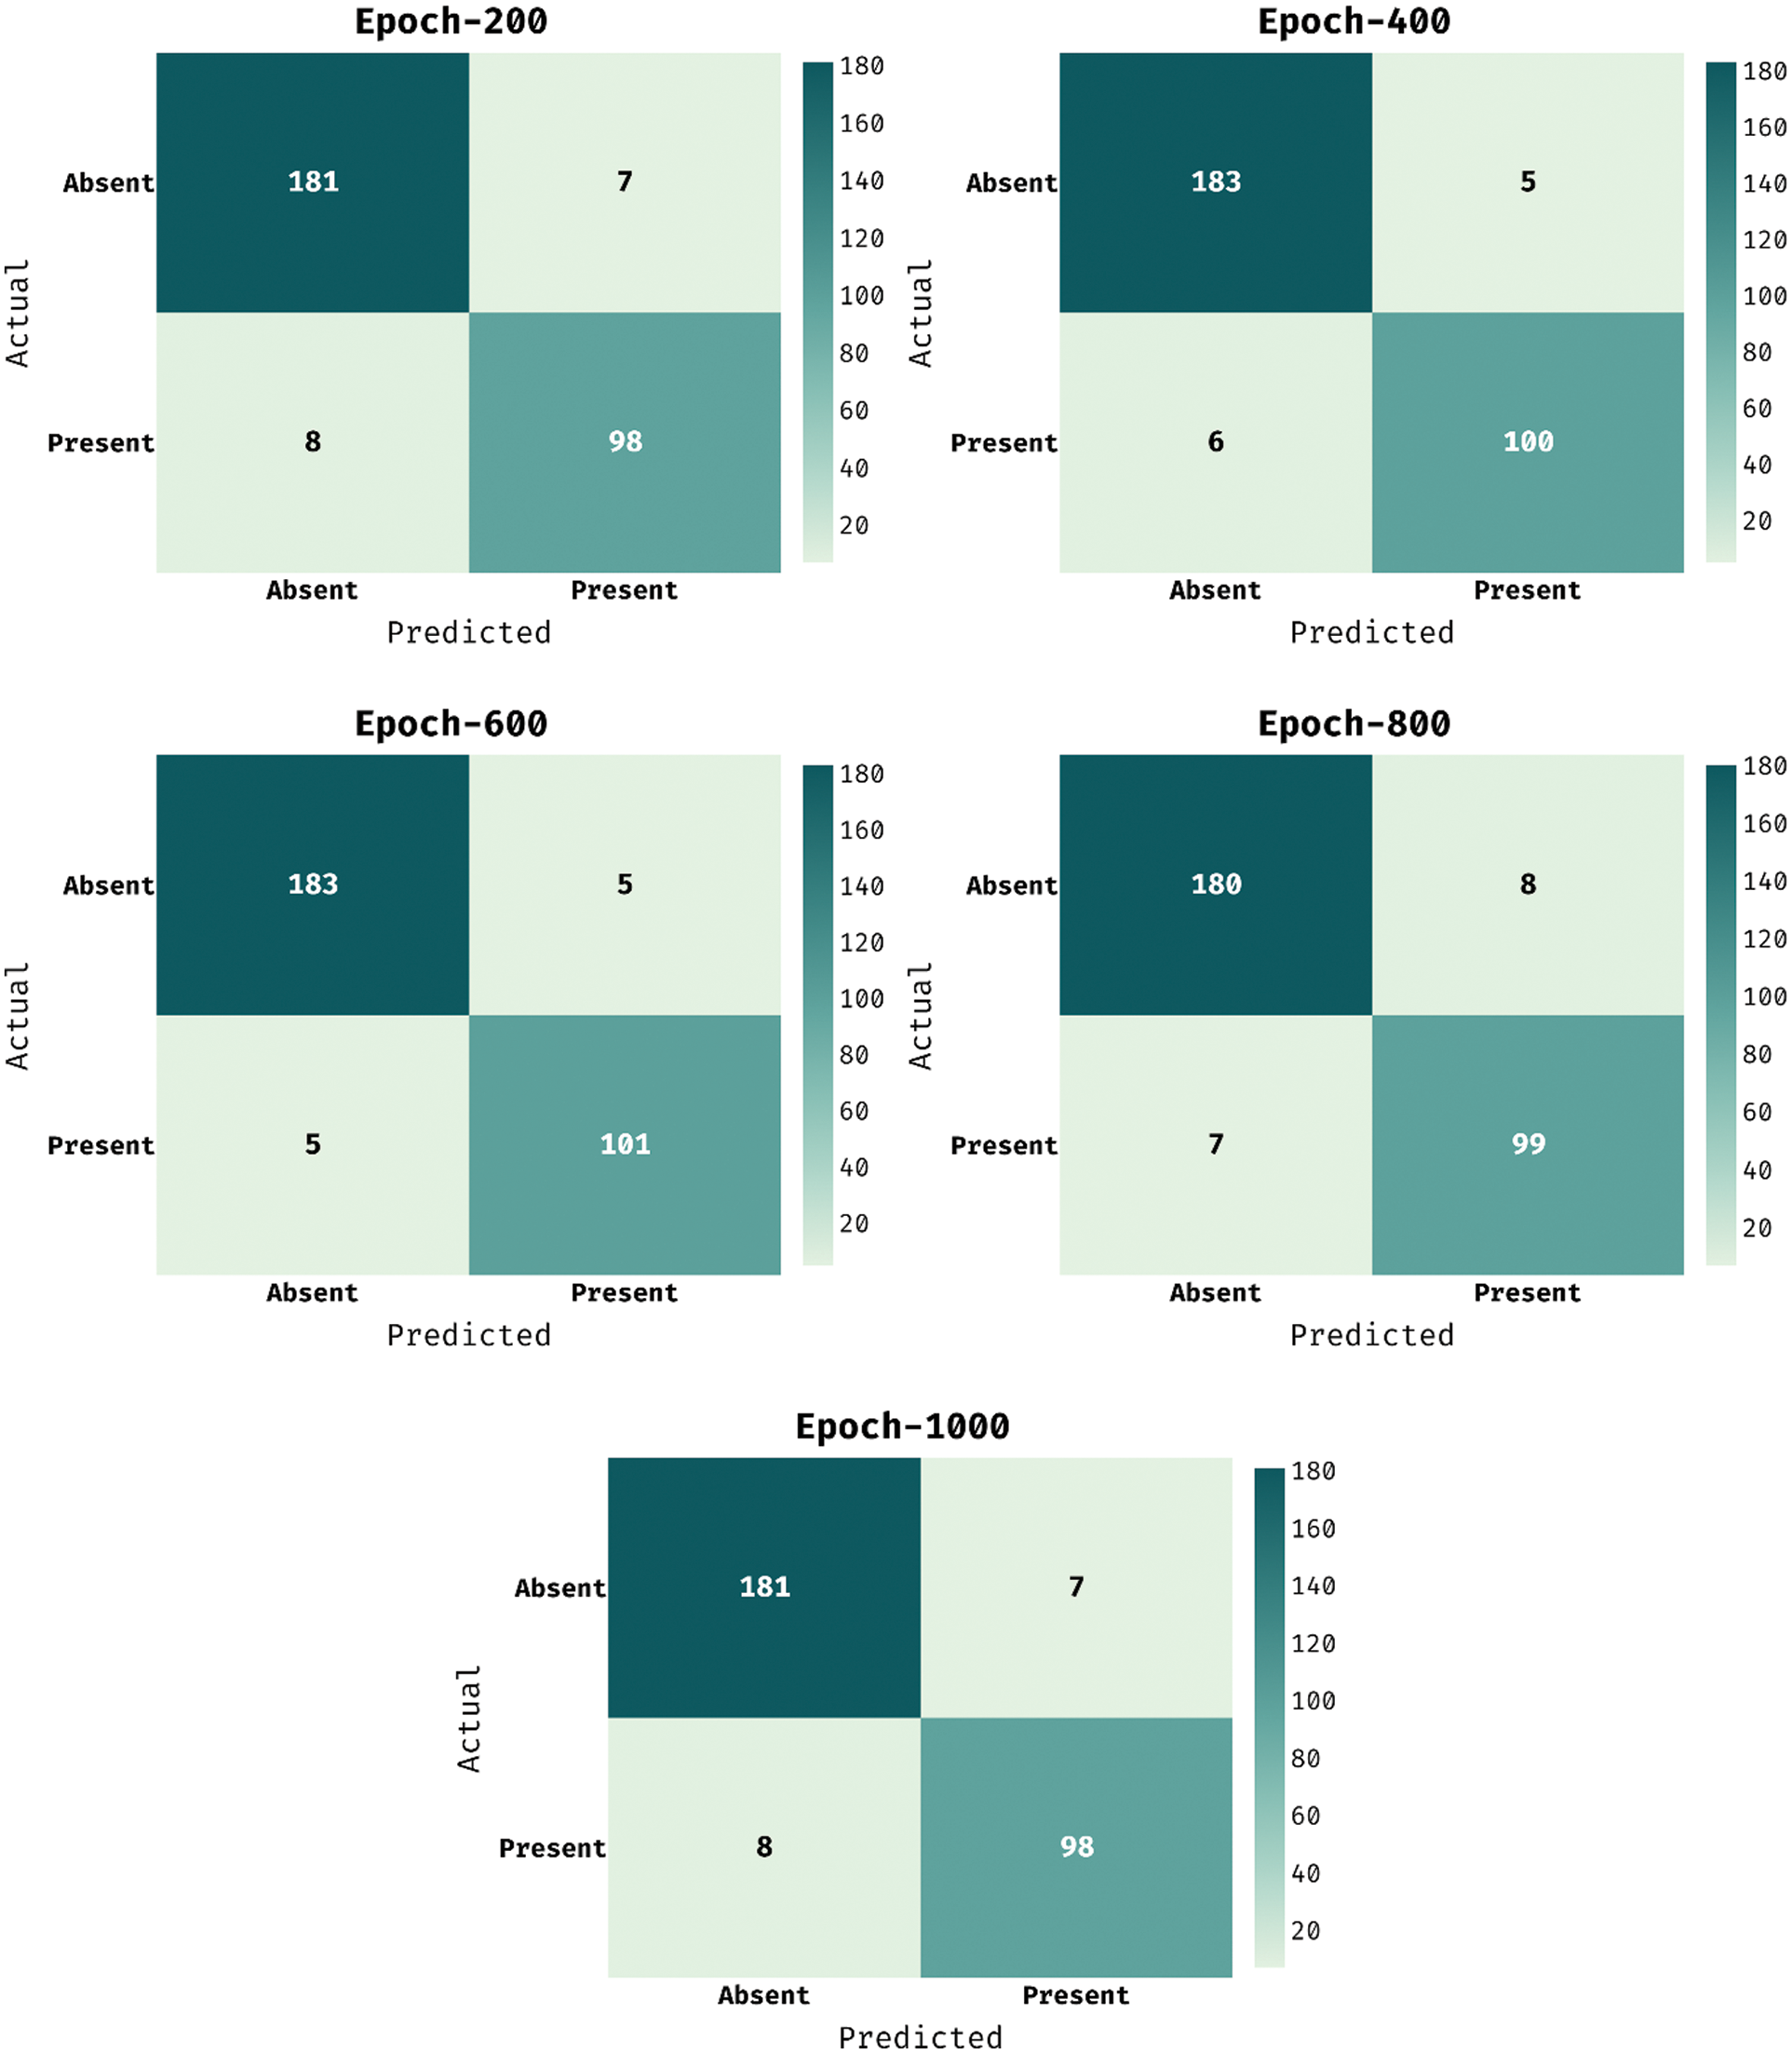
Figure 4: Confusion matrix of MDL-BADDC technique on Hungarian dataset
For instance, with 200 epochs, the MDL-BADDC approach has identified 181 samples under Absent class and 98 samples under Present class. Besides, with 600 epochs, the MDL-BADDC system has identified 183 samples under Absent class and 101 samples under Present class. At last, with 1000 epochs, the MDL-BADDC algorithm has identified 181 samples under Absent class and 98 samples under Present class.
A comprehensive outcome analysis of the MDL-BADDC approach on the test Hungarian dataset is illustrated in Tab. 3. The experimental outcomes referred that the MDL-BADDC method has accomplished effectual outcomes under every epoch. For instance, under 200 epochs, the MDL-BADDC methodology has achieved

A brief result analysis of the MDL-BADDC method take place with recent algorithms in Tab. 4. The figure outperformed that the WFR, C4.5, and FDT systems have obtained lesser

3.3 Result Analysis on Z-Alizadeh Dataset
The confusion matrix existing by the MDL-BADDC system on the test Z-Alizadeh dataset is depicted in Fig. 5. The figure stated that the MDL-BADDC approach has effectually identified the class labels under all epochs. For instance, with 200 epochs, the MDL-BADDC algorithm has identified 214 samples under Absent class and 86 samples under Present class. Furthermore, with 600 epochs, the MDL-BADDC system has identified 214 samples under Absent class and 84 samples under Present class. Moreover, with 1000 epochs, the MDL-BADDC method has identified 213 samples under Absent class and 85 samples under Present class.
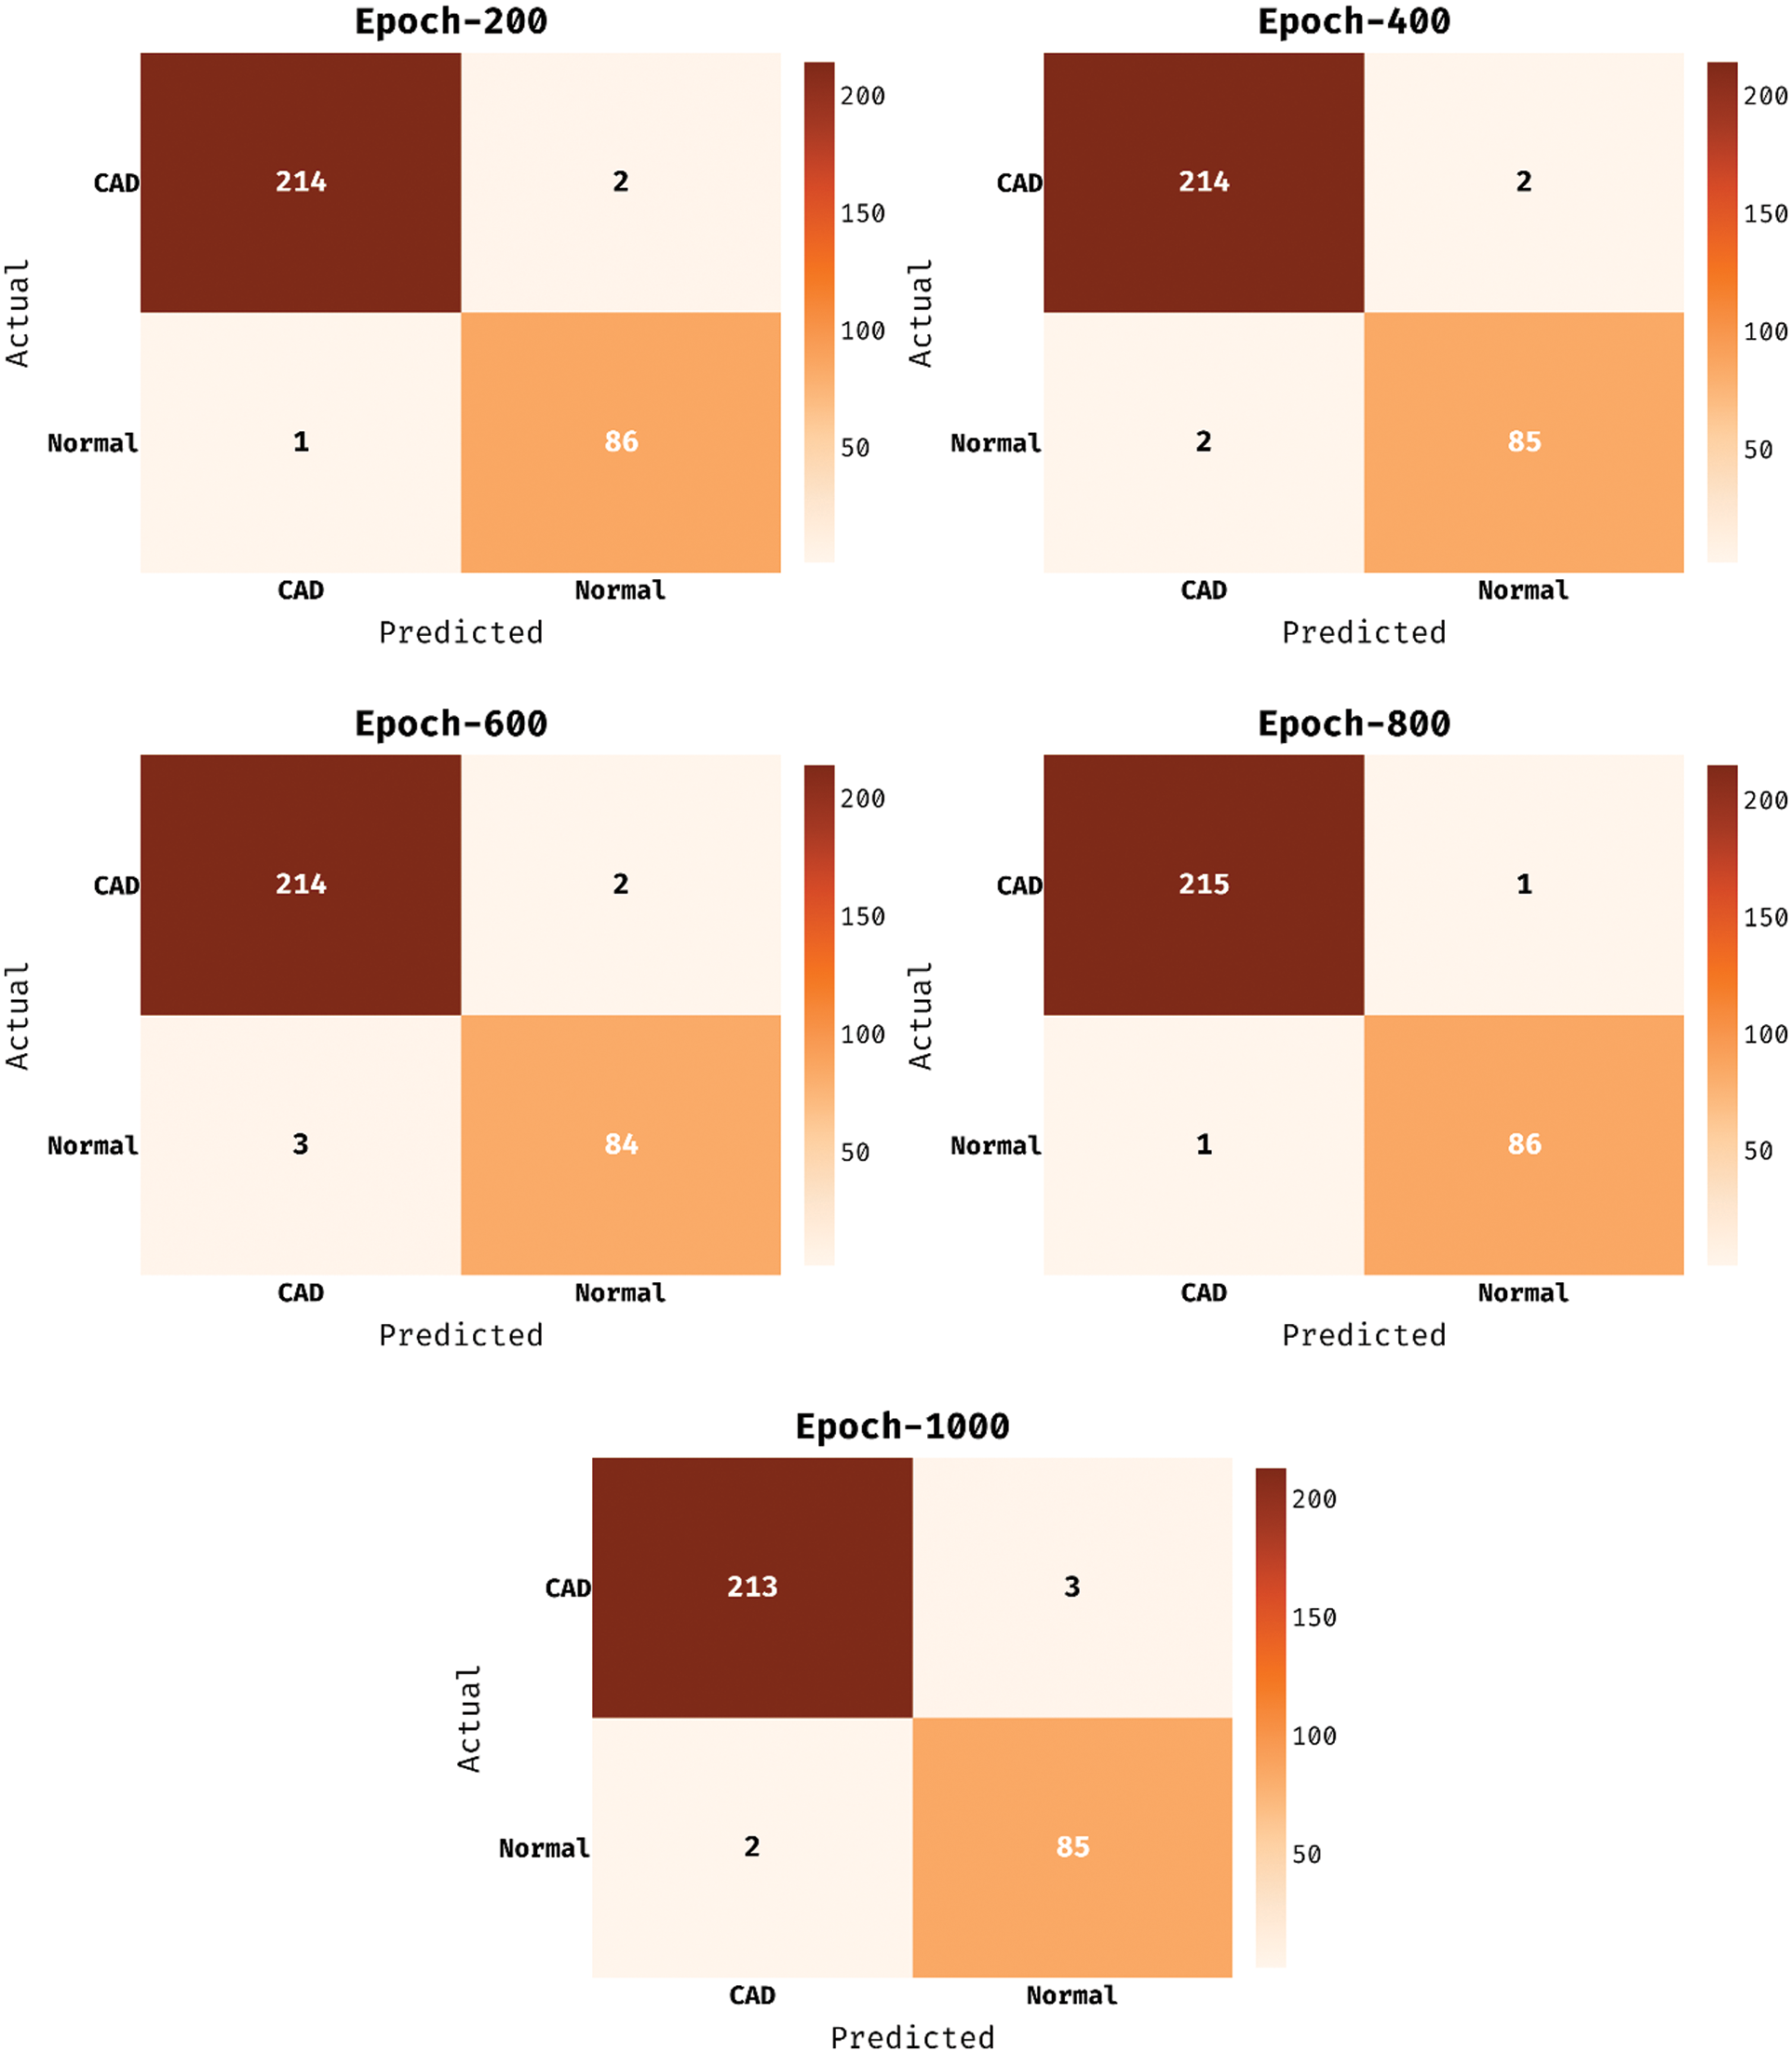
Figure 5: Confusion matrix of MDL-BADDC technique on Z-Alizadeh dataset
A detailed outcome analysis of the MDL-BADDC technique on the test Z-Alizadeh dataset is depicted in Tab. 5. The experimental outcomes stated that the MDL-BADDC system has accomplished effectual outcomes under every epoch. For instance, under 200 epochs, the MDL-BADDC algorithm has achieved

A comparative outcome analysis of the MDL-BADDC technique take place with recent methods in Tab. 6. The figure portrayed that the NN Model, 2 Hybrid Feature Selection (HFS), and SVC method have reached lesser
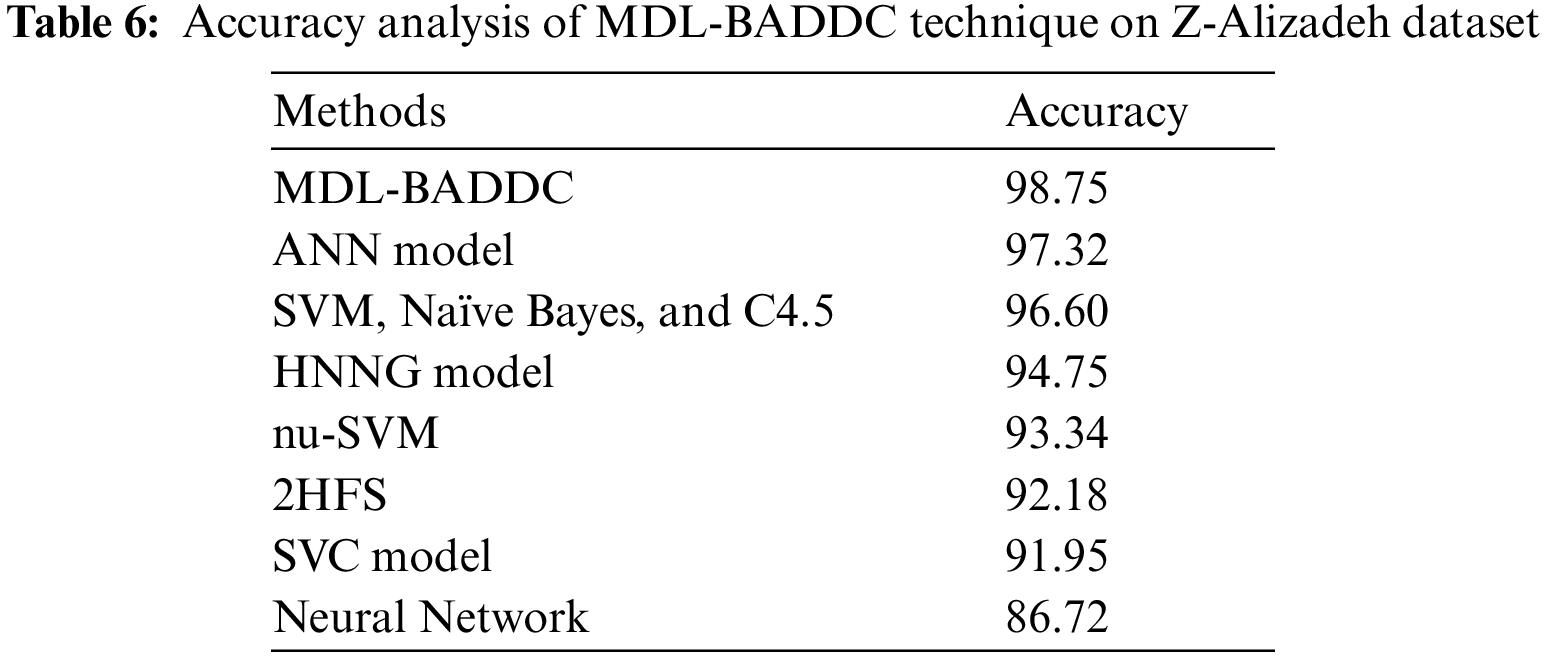
Fig. 6 portrays the accuracy and loss analysis of the MDL-BADDC technique on three datasets. The results demonstrated that the MDL-BADDC system has accomplished improved performance with enhanced training and validation accuracy. It can be stated that the MDL-BADDC method has reached improved validation accuracy over the training accuracy. The figure demonstrates loss analysis of the MDL-BADDC technique on three datasets. The outcomes established that the MDL-BADDC approach has resulted in a proficient outcome with the minimum training and validation loss. It can be obvious that the MDL-BADDC methodology has offered decreased validation loss over the training loss.
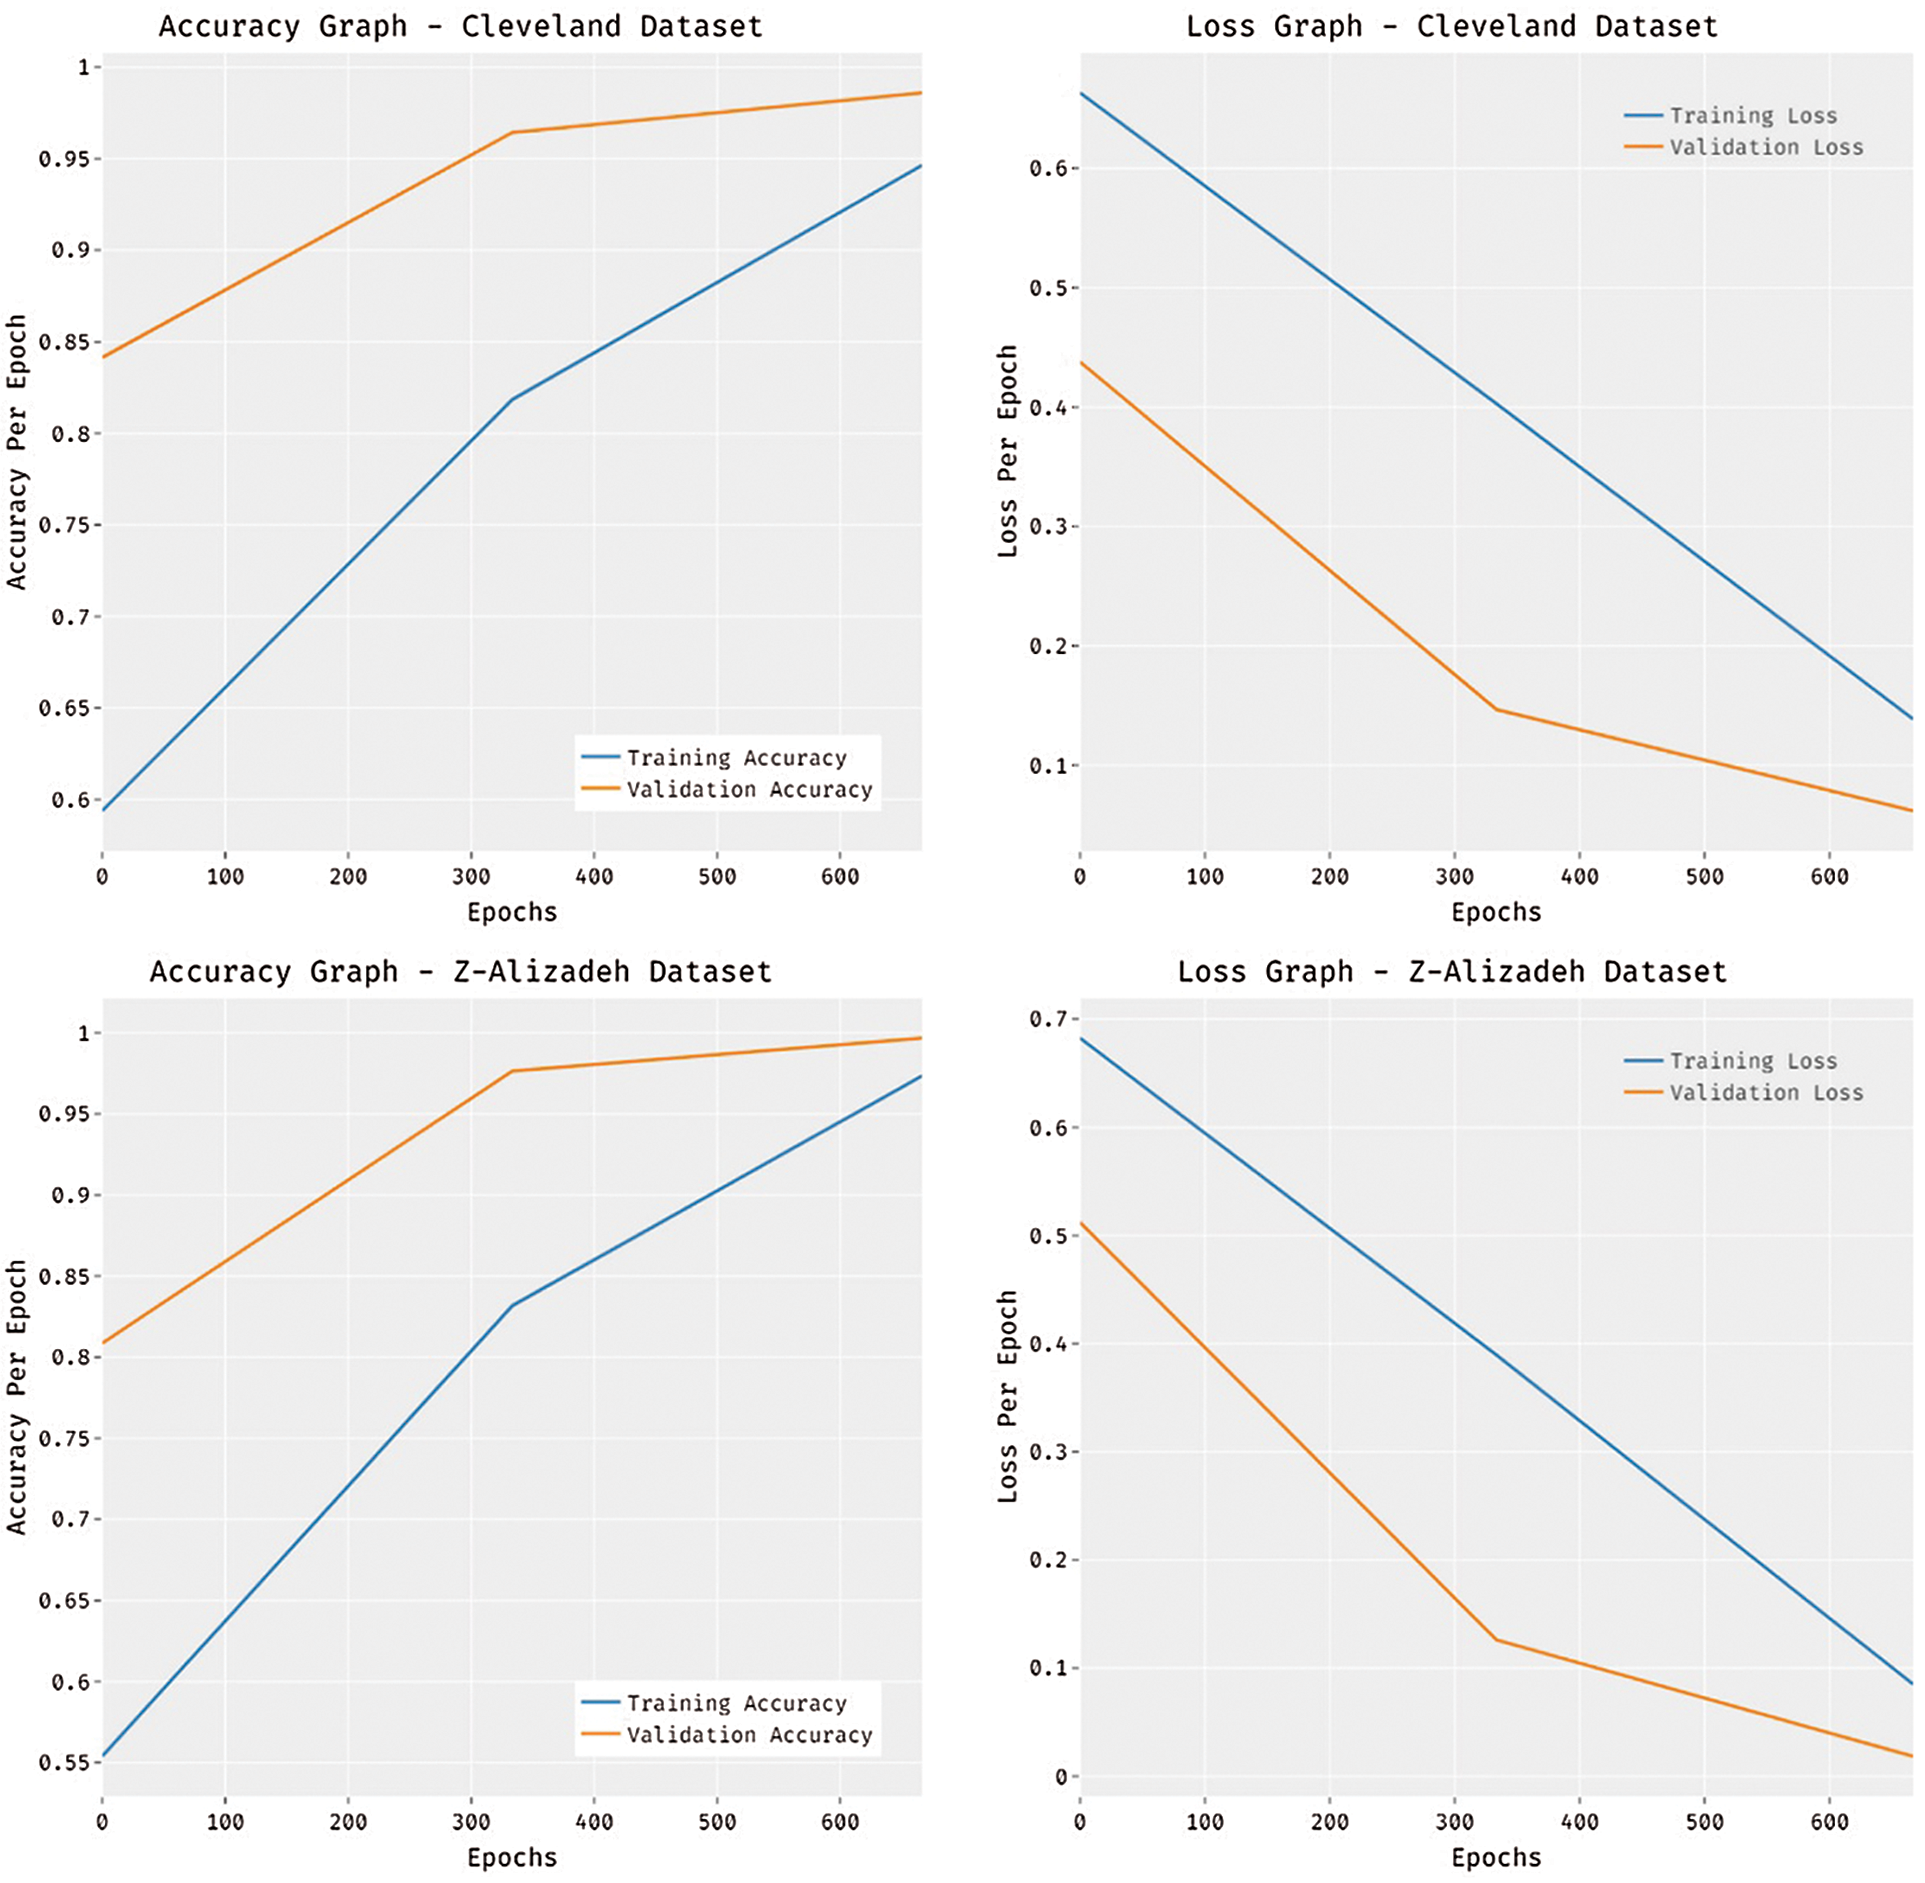
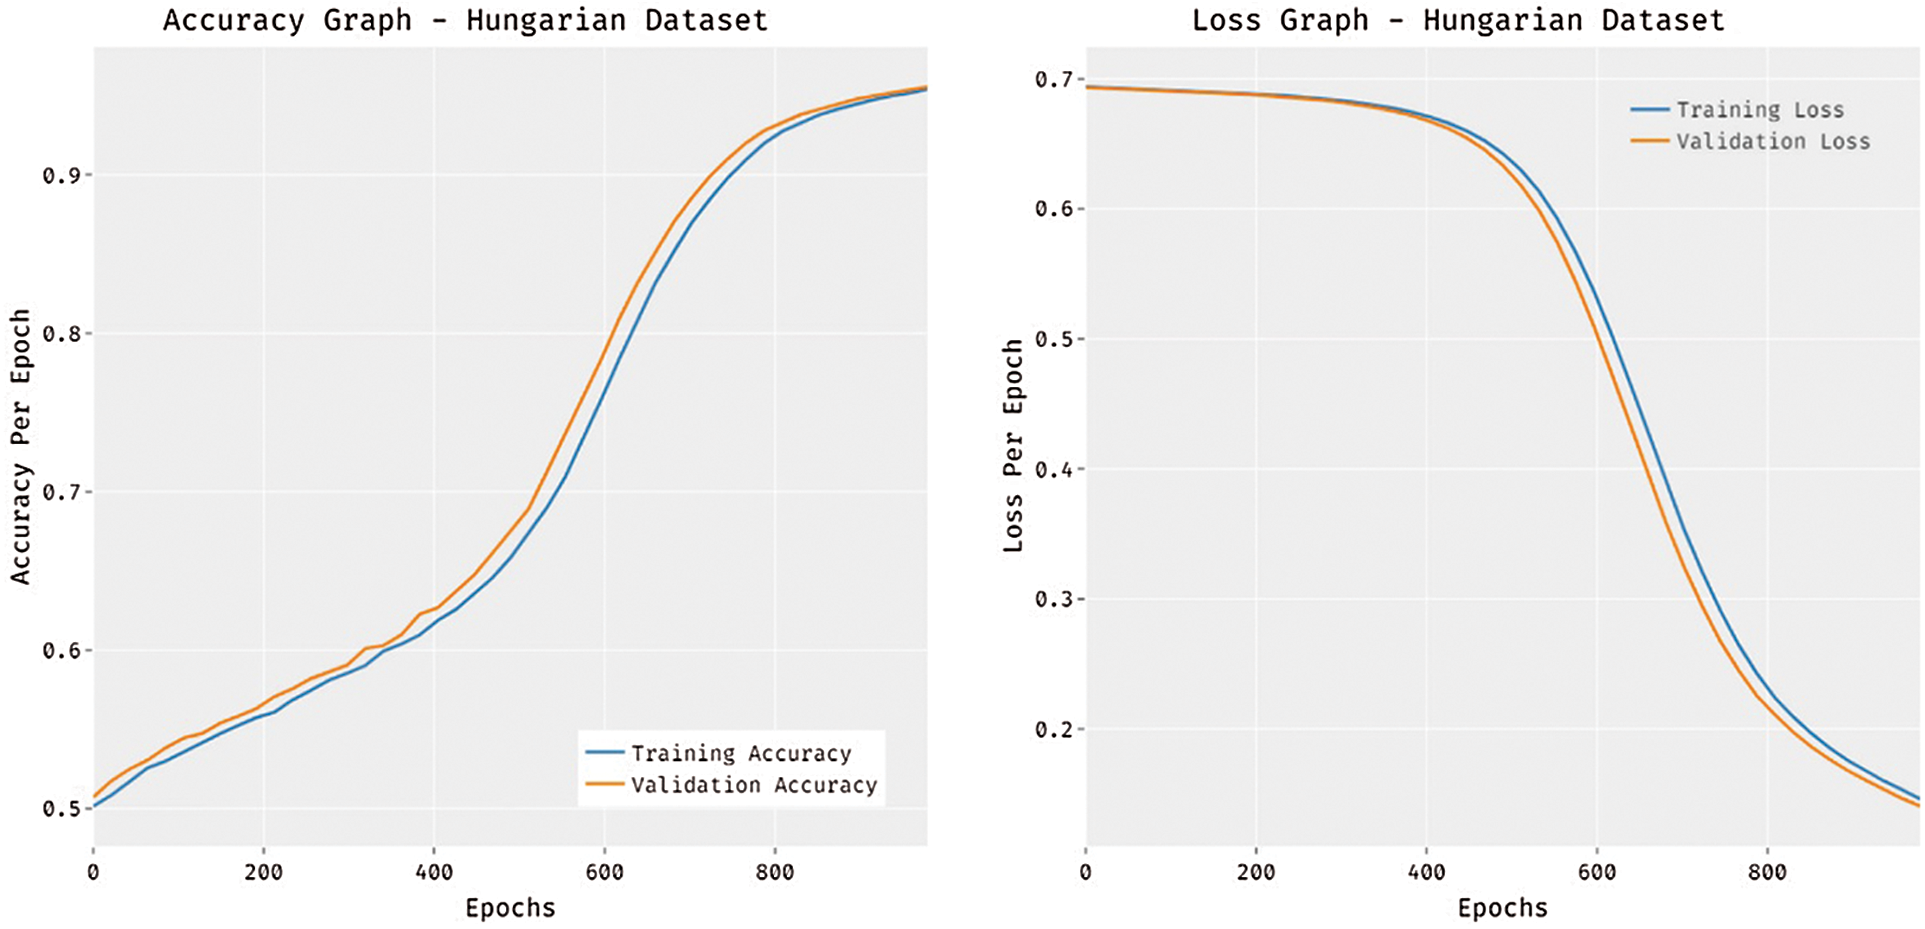
Figure 6: Accuracy and Loss graph analysis of MDL-BADDC technique on three datasets
In this study, a novel MDL-BADDC technique has been developed for atherosclerosis disease diagnosis and classification. The MDL-BADDC technique incorporates pre-processing, QOBMO based feature selection, DSAE based classification, and KHA based parameter tuning. The application of KHA helps to properly tune the parameters involved in the DSAE model and thereby enhances the detection outcomes. To showcase the enhanced classification performance of the MDL-BADDC approach, a wide range of simulations take place on three benchmark biomedical datasets. The comparative result analysis reported the better performance of the MDL-BADDC technique over the compared methods. In future, the MDL-BADDC technique can be extended to other disease diagnoses such as lung cancer, brain tumor, etc.
Funding Statement: The authors extend their appreciation to the Deanship of Scientific Research at King Khalid University for funding this work under Grant Number (RGP 2/279/43). Princess Nourah bint Abdulrahman University Researchers Supporting Project Number (PNURSP2022R151), Princess Nourah bint Abdulrahman University, Riyadh, Saudi Arabia.
Conflicts of Interest: The authors declare that they have no conflicts of interest to report regarding the present study.
1. A. K. G. Escamila, A. H. E. Hassani and E. Andrès, “Classification models for heart disease prediction using feature selection and PCA,” Informatics in Medicine Unlocked, vol. 19, pp. 100330, 2020. [Google Scholar]
2. P. Libby, P. M. Ridker and G. K. Hansson, “Progress and challenges in translating the biology of atherosclerosis,” Nature, vol. 473, no. 7347, pp. 317–325, 2011. [Google Scholar]
3. G. Parthiban and S. K. Srivatsa, “Applying machine learning methods in diagnosing heart disease for diabetic patients,” International Journal of Applied Information Systems, vol. 3, no. 7, pp. 25–30, 2012. [Google Scholar]
4. P. Melillo, N. D. Luca, M. Bracale and L. Pecchia, “Classification tree for risk assessment in patients suffering from congestive heart failure via long-term heart rate variability,” IEEE Journal of Biomedical and Health Informatics, vol. 17, no. 3, pp. 727–733, 2013. [Google Scholar]
5. G. Guidi, M. C. Pettenati, P. Melillo and E. Iadanza, “A machine learning system to improve heart failure patient assistance,” IEEE Journal of Biomedical and Health Informatics, vol. 18, no. 6, pp. 1750–1756, 2014. [Google Scholar]
6. R. Das, I. Turkoglu and A. Sengur, “Effective diagnosis of heart disease through neural networks ensembles,” Expert Systems with Applications, vol. 36, no. 4, pp. 7675–7680, 2009. [Google Scholar]
7. M. Abdar, U. R. Acharya, N. Sarrafzadegan and V. Makarenkov, “NE-Nu-SVC: A new nested ensemble clinical decision support system for effective diagnosis of coronary artery disease,” IEEE Access, vol. 7, pp. 167605–167620, 2019. [Google Scholar]
8. W. He, Y. Xie, H. Lu, M. Wang and H. Chen, “Predicting coronary atherosclerotic heart disease: An extreme learning machine with improved salp swarm algorithm,” Symmetry, vol. 12, no. 10, pp. 1651, 2020. [Google Scholar]
9. O. Terrada, B. Cherradi, A. Raihani and O. Bouattane, “Classification and prediction of atherosclerosis diseases using machine learning algorithms,” in 2019 5th Int. Conf. on Optimization and Applications (ICOA), Kenitra, Morocco, pp. 1–5, 2019. [Google Scholar]
10. O. Terrada, B. Cherradi, A. Raihani and O. Bouattane, “Atherosclerosis disease prediction using supervised machine learning techniques,” in 2020 1st Int. Conf. on Innovative Research in Applied Science, Engineering and Technology (IRASET), Meknes, Morocco, pp. 1–5, 2020. [Google Scholar]
11. E. Munger, J. W. Hickey, A. K. Dey, M. S. Jafri, J. M. Kinser et al., “Application of machine learning in understanding atherosclerosis: Emerging insights,” APL Bioengineering, vol. 5, no. 1, pp. 011505, 2021. [Google Scholar]
12. F. Zhao, B. Wu, F. Chen, X. Cao, H. Yi et al., “An automatic multi-class coronary atherosclerosis plaque detection and classification framework,” Medical & Biological Engineering & Computing, vol. 57, no. 1, pp. 245–257, 2019. [Google Scholar]
13. C. Parameswari and S. S. Ranjani, “Prediction of atherosclerosis pathology in retinal fundal images with machine learning approaches,” Journal of Ambient Intelligence and Humanized Computing, vol. 12, no. 6, pp. 6701–6711, 2021. [Google Scholar]
14. B. Cherradi, O. Terrada, A. Ouhmida, S. Hamida, A. Raihani et al., “Computer-aided diagnosis system for early prediction of atherosclerosis using machine learning and k-fold cross-validation,” in 2021 Int. Congress of Advanced Technology and Engineering (ICOTEN), Taiz, Yemen, pp. 1–9, 2021. [Google Scholar]
15. R. Ramani, K. V. Devi and K. R. Soundar, “MapReduce-Based big data framework using modified artificial neural network classifier for diabetic chronic disease prediction,” Soft Computing, vol. 24, no. 21, pp. 16335–16345, 2020. [Google Scholar]
16. M. H. Sulaiman, Z. Mustaffa, M. M. Saari and H. Daniyal, “Barnacles mating optimizer: A new bio-inspired algorithm for solving engineering optimization problems,” Engineering Applications of Artificial Intelligence, vol. 87, pp. 103330, 2020. [Google Scholar]
17. H. Jia and K. Sun, “Improved barnacles mating optimizer algorithm for feature selection and support vector machine optimization,” Pattern Analysis and Applications, vol. 24, no. 3, pp. 1249–1274, 2021. [Google Scholar]
18. H. R. Tizhoosh, “Opposition-based learning: A new scheme for machine intelligence,” in Int. Conf. on Computational Intelligence for Modelling, Control and Automation and Int. Conf. on Intelligent Agents, Web Technologies and Internet Commerce (CIMCA-IAWTIC’06), Vienna, Austria, vol. 1, pp. 695–701, 2005. [Google Scholar]
19. R. J. Mahfoud, Y. Sun, N. F. Alkayem, H. H. Alhelou, P. Siano et al., “A novel combined evolutionary algorithm for optimal planning of distributed generators in radial distribution systems,” Applied Sciences, vol. 9, no. 16, pp. 3394, 2019. [Google Scholar]
20. H. Chen, G. Hu, Z. Lei, Y. Chen, N. M. Robertson et al., “Attention-based two-stream convolutional networks for face spoofing detection,” IEEE Transactions on Information Forensics and Security, vol. 15, pp. 578–593, 2020. [Google Scholar]
21. C. Zhang, X. Cheng, J. Liu, J. He and G. Liu, “Deep sparse autoencoder for feature extraction and diagnosis of locomotive adhesion status,” Journal of Control Science and Engineering, vol. 2018, pp. 1–9, 2018. [Google Scholar]
22. A. H. Gandomi and A. H. Alavi, “Krill herd: A new bio-inspired optimization algorithm,” Communications in Nonlinear Science and Numerical Simulation, vol. 17, no. 12, pp. 4831–4845, 2012. [Google Scholar]
23. H. Bilal and F. Öztürk, “Rubber bushing optimization by using a novel chaotic krill herd optimization algorithm,” Soft Computing, vol. 25, no. 22, pp. 14333–14355, 2021. [Google Scholar]
24. https://archive.ics.uci.edu/ml/datasets.php. 2020. [Google Scholar]
25. R. Alizadehsani, A. Khosravi, M. Roshanzamir, M. Abdar, N. Sarrafzadegan et al., “Coronary artery disease detection using computational intelligence methods,” Knowledge-Based Systems, vol. 109, pp. 187–197, 2016. [Google Scholar]
26. O. Terrada, B. Cherradi, A. Raihani and O. Bouattane, “A novel medical diagnosis support system for predicting patients with atherosclerosis diseases,” Informatics in Medicine Unlocked, vol. 21, pp. 100483, 2020. [Google Scholar]
 | This work is licensed under a Creative Commons Attribution 4.0 International License, which permits unrestricted use, distribution, and reproduction in any medium, provided the original work is properly cited. |