DOI:10.32604/cmc.2022.026363
| Computers, Materials & Continua DOI:10.32604/cmc.2022.026363 | |
| Article |
An Interpretable Artificial Intelligence Based Smart Agriculture System
1School of Engineering and Technology, Central Queensland University, Sydney, Australia
2College of Engineering, Science and Environment, The University of Newcastle, Sydney, Australia
3School of Social Sciences, Western Sydney University, Sydney, Australia
4Department of Environmental Sciences, Macquarie University, Sydney, Australia
5School of Computing, Data and Mathematical, Sciences, Western Sydney University, Sydney, Australia
6School of Engineering and Technology, Central Queensland University, Cairns, Australia
*Corresponding Author: Fariza Sabrina. Email: f.sabrina@cqu.edu.au
Received: 23 December 2021; Accepted: 22 February 2022
Abstract: With increasing world population the demand of food production has increased exponentially. Internet of Things (IoT) based smart agriculture system can play a vital role in optimising crop yield by managing crop requirements in real-time. Interpretability can be an important factor to make such systems trusted and easily adopted by farmers. In this paper, we propose a novel artificial intelligence-based agriculture system that uses IoT data to monitor the environment and alerts farmers to take the required actions for maintaining ideal conditions for crop production. The strength of the proposed system is in its interpretability which makes it easy for farmers to understand, trust and use it. The use of fuzzy logic makes the system customisable in terms of types/number of sensors, type of crop, and adaptable for any soil types and weather conditions. The proposed system can identify anomalous data due to security breaches or hardware malfunction using machine learning algorithms. To ensure the viability of the system we have conducted thorough research related to agricultural factors such as soil type, soil moisture, soil temperature, plant life cycle, irrigation requirement and water application timing for Maize as our target crop. The experimental results show that our proposed system is interpretable, can detect anomalous data, and triggers actions accurately based on crop requirements.
Keywords: Explainable artificial intelligence; fuzzy logic; internet of things; machine learning; sensors; smart agriculture
Agriculture is very important for all mankind as its major contribution is the production of food. According to the Food and Agriculture Organization (FAO) of the United Nations report [1], there is a huge scarcity in the food supply in some parts of the world. As mentioned in [2], there will be 8.5 billion human beings on planet earth by 2030 and 9.6 billion by the year 2050. To feed this population the food production must be increased. Climate change along with an increase in scarcity of water poses a huge challenge in increasing crop production [1,3]. Hence, at this moment, it is crucial to find ways to increase crop yield.
Crop productivity is also affected by over and under irrigation due to insufficiency of water and uncertain rainfalls [4]. Especially, in arid or semi-arid climatic conditions water is the most limiting factor in agricultural production [5,6]. Therefore, an efficient and effective smart irrigation system is attracting more and more attention due to its potential to promote high yielding and sustainable agriculture [7]. However, in a smart irrigation system, the effects of soil types or soil properties, including soil texture, is a crucial matter, which determines the soil water-holding capacity, infiltration, water distribution in the soil profile and transfer pattern, and water retention time in the soil. Hence, significant variation in irrigation water requirement is an utmost consideration between diverse soils with unlike textures [8]. Smart irrigation system operates automatic and rational management of agricultural water supplies based on estimation and understanding of plant and/or soil water status. In short, under effective smart irrigation, water usage can be managed and scheduled according to any attainable target of yield [7]. With the advancement in technology, numerous data-driven smart irrigation systems have been developed in the last few decades with a purpose to calculate when and how much water to irrigate, based on relevant data like weather, plant, soil, or their combinations [9]. Weather-based systems use meteorological data to estimate evapotranspiration and thus use soil water balance, whereas plant or soil-based systems trigger irrigation when an index or value, indicating plant water deficit status or the level of water stress, surpasses a predefined threshold. All these approaches to schedule irrigation, however, still face some unavoidable difficulties in both theory and practice [7,10,11]. Therefore, more simple and convenient soil-based smart agricultural approaches with technologies such as the Internet of Things (IoT), Big Data and Artificial Intelligence (AI) can be incorporated to attain the desired goal.
Smart agriculture uses a number of different sensors to monitor environmental, crop and soil-related factors and data collected by these sensors is used to make decisions to improve crop production. However, these sensors produce a huge amount of data. AI and Machine Learning (ML) algorithms could be used to successfully process and analyse the data. While the development of ML algorithms is leading to improved decision making, the inherent complexity of the algorithms makes it difficult for non-experts to understand the decisions. As a result, the end-user may ignore the decisions, making the ML algorithms ineffective. Hence, the requirement of transparency for the AI-related decision-making process is crucial for the widespread acceptance and reliance of these systems [12]. In the field of machine learning, interpretability is defined as explaining machine learning models in a term that is easy to understand by a human [13]. On the other hand, Explainability aims at providing explanations for the blackbox model post hoc. However, in machine learning, the terms interpretability and explainability are used interchangeably [14].
Fuzzy logic systems (FLSs) provide linguistic representations of numerical variables and partial memberships to accommodate uncertainty. FLSs use a fuzzy rule-based system (FRBS) consisting of IF-THEN rules and inference engines. The ability of linguistic labeling plays an important role in providing direct human interpretation [15]. Also, the IF-THEN rules used for making decisions are intuitively easy to understand and explain. FLS has a natural inclination towards interpretability, which is an essential component for user acceptance [16].
In this paper, we have proposed a machine learning and Fuzzy logic based multi-tier smart agriculture system consisting of an intelligent controller that increases crop production using IoT sensors. The main strength of the proposed system is in the use of an interpretable model to build farmers’ trust in using the system. In addition, the multi-tier intelligent controller detects anomalies at the earliest stage in order to provide real-time alerts, this also ensures the fuzzy model gets the anomaly free data. The contribution of this research is:
• Design of a novel multi-tiered intelligent controller for smart agriculture system that can improve crop yield and can be customised for any crop in any part of the world.
• Analysis of interpretability index of the proposed system to show the system fulfils interpretability requirements.
• Incorporation of detection of anomalous data that can be used to detect security or hardware issues in the smart irrigation system.
• Initial testing, analysis and results of our proposed system.
The rest of the paper is organised as follows: Section 2 reviews research related to our proposed system. Section 3 introduces our proposed intelligent controller, including how our system incorporates interpretability. Section 4 describes how our proposed system can be applied in a use case scenario for maize. Section 5 describes the experimental set-up and Section 6 presents results from applying our proposed system to the maize use case. Section 7 shows how modifications of the fuzzy inference system can improve interpretability in the analysed scenario. The system output of the smart irrigation system is detailed in Section 8. Finally, Section 9 concludes the paper.
Smart agriculture has been an active field of research in recent times. However, a point to emphasise is that authors are unable to find a solution with the features of customisability, interpretability and anomaly detection in the smart agriculture field. In this section, we discuss the existing literature related to different modules of our architecture.
Azaza et al. [17] has proposed a greenhouse climate control system for optimal plant growth while focusing on energy and water savings. A fuzzy logic system provided the smart automation for a sustainable greenhouse for that work. The use of fuzzy logic was claimed as a reliable control strategy to optimise irrigation systems.
Thakur et al. [18] proposed a prototype system for smart irrigation system which uses various sensors to collect data that could be used for precise irrigation. This data is also analysed for intrusion detection in the field and this information is sent to the farmer to alert them about these events.
Pezol et al. [19] proposed a fuzzy logic-based smart irrigation and fertilisation system that uses Internet of Things (IoT) devices to collect field data. The fuzzy logic module was used to control the flow rate of water, alkali and acid solution into the soil. The system was tested on chilli plants and results show that the growth of the plants is better in the controlled environment using the proposed system compared to a traditional method.
Khummanee et al. [20] proposed Fuzzy logic and IoT based automated smart farming for Orchids cultivation. The proposed system used temperature, humidity, light, and soil moisture sensors to collect data. The fuzzy logic-based system has been used to control all essential environmental variables inside a greenhouse such as heating, cooling, controlling fogger, fanning, sprinkling water, turning the light on and controlling the plastic curtain. The result shows that using this proposed system orchid plants had steady growth over ten weeks of the trial period.
Kokkonis et al. [21] proposed a novel fuzzy computational algorithm for IoT smart irrigation systems. In this system data from soil moisture, humidity, and temperature sensors are collected for analysis, and the fuzzy algorithm is used to decide whether to open or close the valve or to keep it half-opened. Puri et al. [22] proposed a Fuzzy logic and IoT based system to improve the accuracy and power consumption of the farming system. Priyadharshini et al. [23] proposed a smart agriculture monitoring system using fuzzy logic that provides automation to increase the efficiency of irrigation. The authors argue that fuzzy logic can effectively be used for irrigation scheduling to optimise water usage.
Rudy Hendrawan et al. [24] proposed a fuzzy-based irrigation system that uses sensor data to automatically control the water pump. They have used air temperature, humidity and light intensity as input and generated 54 fuzzy rules to water pump state as an output. The huge number of fuzzy rules in the system results in a very low interpretability of the fuzzy system.
The above-mentioned research works do not consider interpretability and customisability aspects as considered in our proposed system. As already mentioned, interpretable machine learning and eXplainable Artificial Intelligence (XAI) are closely tied concepts and aim at providing understandings of the underlying AI model while explaining the process of decision making to the users of the system. A huge number of use cases for XAI have been identified like healthcare, manufacturing, autonomous vehicles etc. However, a limited research has been conducted in the field of smart agriculture using interpretable and explainable approaches.
Tsakiridis et al. [25] proposed and tested an irrigation system, Vital, that use fuzzy logic and the principles of interpretability. The sensors collect and send values to the web-based application that uses Vital to generate irrigation decisions based on a fuzzy rule base. The fuzzy rule base may be created with domain experts’ input or may learn based on the dataset values as presented in [26]. The learning approach method performed very well for providing irrigation related decisions while providing means to inspect the decision-making model. However, security and device malfunctioning issues have not been considered in the proposed system.
After analysing the above mentioned related work, we identified a significant research gap for a system that provides not only s smart agriculture solutions but also considers customisability for easy adaptation. We would like to emphasise that our proposed system can be applied in different settings while providing understandability to the end-users.
3 Proposed Intelligent Controller-Based System
In this section, we introduce our proposed intelligent controller based system. The subsections give details of the components of our proposed system.
Fig. 1a shows the IoT based smart agriculture scenario used to discuss the working of our model. The sensors collect environmental data and send it to the IoT gateway. The IoT gateway is connected to an intelligent controller in the cloud. The intelligent controller maintains an up to date data repository for real-time decision making. The decisions are conveyed in real-time in order to provide opportunities for quick and appropriate action. The scenario only shows two types of sensors, however, we want to emphasise that our system is flexible to incorporate data from any type and number of sensors.
The major functionality of our system is encompassed in two-tiered intelligent controller as shown in Fig. 1b. The intelligent controller uses machine learning and soft computing techniques to detect anomalies in the sensor data and alert farmers to take appropriate actions for achieving optimized crop growth. The strength of the controller is its interpretability that creates intelligent models that are understandable by the farmers. This understanding can help farmers to build trust in our system which can play an important role in the adaptation of our system to monitor their livelihood. Interpretability has been used as a measure to indicate how easily the fuzzy logic system could be understood [27]. We use the Nauck index to assess the interpretability of our fuzzy system [28] as discussed in Subsection 3.4. The objectives of the proposed system are an easily interpretable smart agricultural solution for farmers, customisable modules for all crops with varying requirements, accurate and precise detection of anomalous behaviour and real-time event monitoring, detection and response.
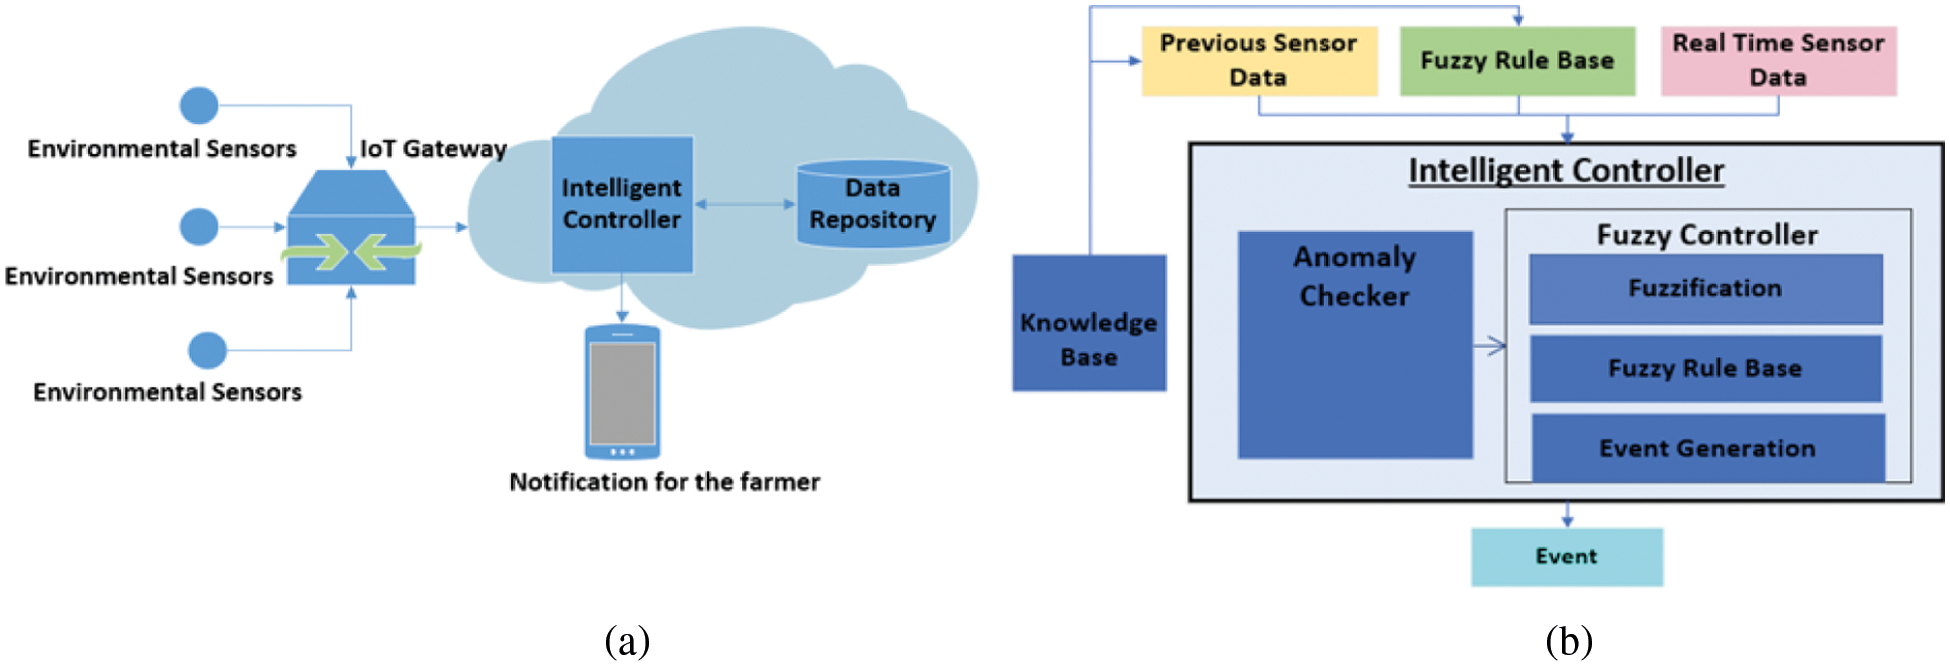
Figure 1: (a) IoT based smart agriculture scenario, (b) Intelligent controller
Smart agriculture is based on the use of different types of sensors such as atmospheric temperature, humidity, soil temperature, soil moisture, soil pH etc. for monitoring environmental factors in order to make timely decisions to support better crop yield. Our architecture can incorporate any sensors to get data for intelligent decision making. In the next section, we discuss the use case of our architecture that collects soil temperature and soil moisture values for making irrigation related decisions.
The sensors pass collected data to the IoT gateway as sensors have limited processing, storing and communication capabilities. In its simplest form, the IoT gateway collects all the data and passes it to a server in the cloud for processing. Depending on the application requirements IoT gateway may be configured to perform initial processing of data to minimise latency and network load as in Fog/Edge computing. For our architecture, we propose the use of an IoT gateway only for collecting and forwarding data to minimize the network setup and configuration expertise required at the farm.
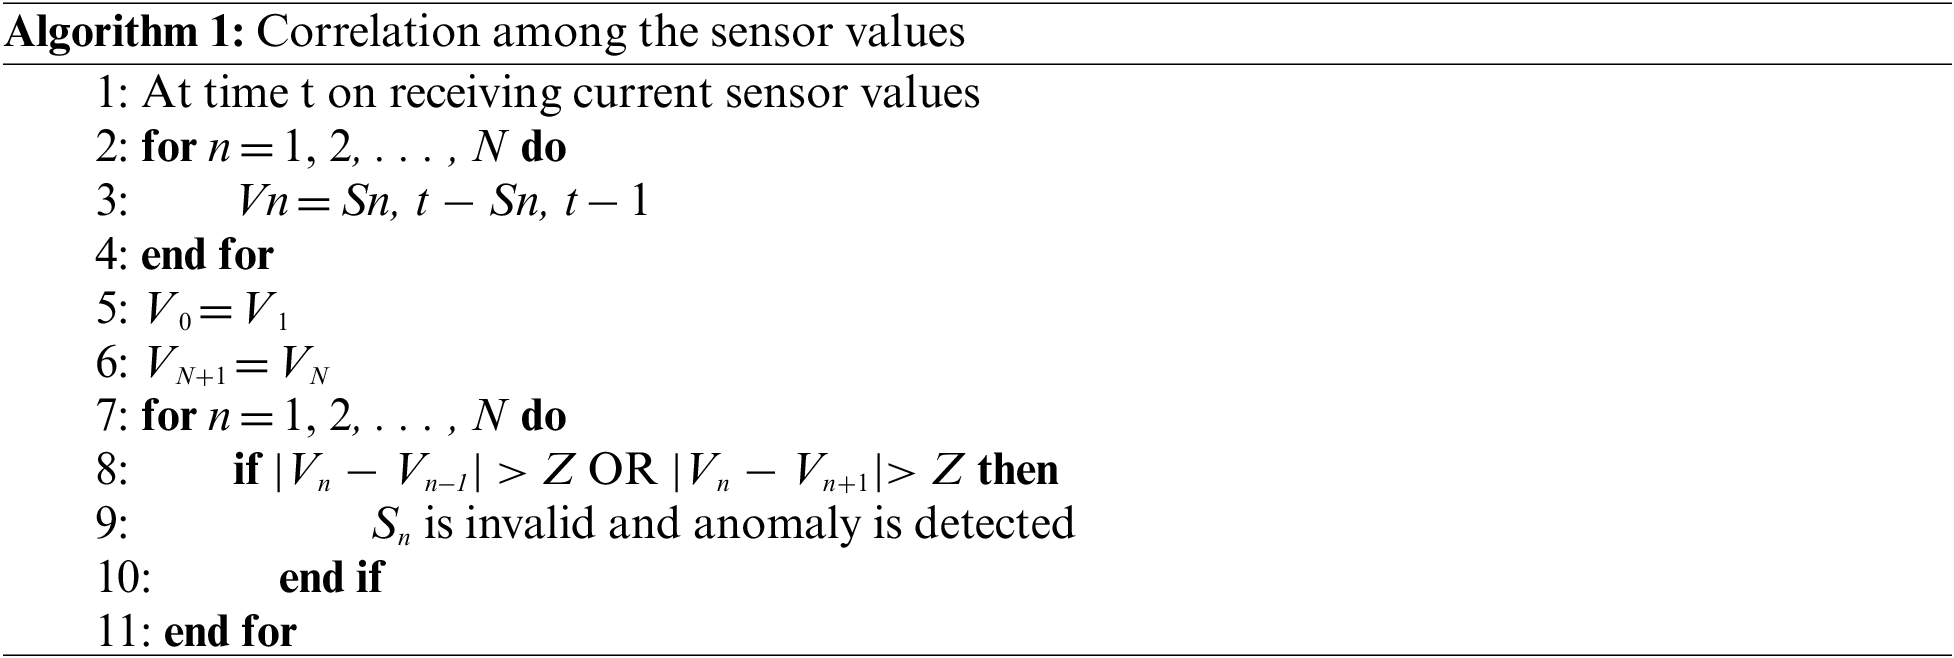
The intelligent controller functionality is divided into two tiers. At the first tier, the Anomaly Checker applies an ML algorithm to identify anomalous data from the sensors. The anomalous data may be a result of either hardware/software malfunctions or a security attack. Sensors used in agriculture are typically low cost and low power, and they may be designed without extensive error detection/correction or security capabilities. Hence, they are prone to failures and attacks, such as Denial of Service (DoS), impersonation, man-in-the-middle and information attack [29]. The intelligent controller detects anomalies based on the deviation from expected values. For example, if an intruder intercepts and modifies data between the sensor and gateway (man-in-the-middle attack), the anomaly checker can identify unexpected values. Note that while anomalous data is detected, the cause of the anomaly is not, i.e., the anomaly checker does not distinguish between failure and attack. That is an area of future research.
At the second tier, a fuzzy controller checks the sensor data to decide on the type of action that needs to be taken according to the information provided by the farmer. The Intelligent controller uses the following parameters:
• Previous sensor data: Every time a new sensor data value is received it is compared with the previous value in order to check a big difference that shows anomalies.
• Real-time sensor data: The sensors periodically send the monitored environmental factor to the IoT gateway at predefined intervals.
• Correlation factors among sensor data: A number of different sensors are sending data to the IoT gateway. The correlation among these values is calculated in order to see how one sensor data changes concerning other sensors data.
An anomaly checker can identify missing, out of range and anomalous values due to external or internal security breaches and sensors malfunctioning. Low-cost and low-power sensors in the field can be easy targets for hackers and may have performance issues.
After acquiring sensor data from the IoT gateway the data is checked for any anomalies. Based on the previous sensor values and correlation among the sensor values, the machine learning algorithm checks the current values for any anomalous behaviour. The anomaly checker performs two tasks: checks missing or out of range value and checks the change in the sensor value from its previous value as compared to the neighbouring sensors is within the threshold.
The first step in anomaly checking is to make sure that all sensors have been sending data at the required interval. The missing value may indicate sensors malfunction due to hardware or software faults that need to be fixed and/or sensors not responding due to intentional sabotage which is a security threat and needs attention.
The system tries to detect such anomalies which will generate a security event to notify the farmer that there may be a security or performance issue with the sensors which needs to be looked at. The second step is to check the variation in the current sensor value from the previous value is similar to what other sensors in close vicinity are detecting. Sn,t is the value sent by the sensor Sn at time t. The sensors are given numbers based on their location; hence, Sn is geographically closely located to Sn−1 and Sn+1 where 1 < n < N, N is the total number of sensors. A threshold value Z is provided to accommodate the acceptable variation of sensor values, the value of Z depends on the distance between the sensors. This process is shown in Algorithm 1. In addition, machine learning algorithms can also be used to identify correlation related anomalies, as discussed in Section 7. If no anomaly is detected the data is passed to the Fuzzy Controller.
The fuzzy controller maps the sensor data to the Fuzzy sets based on the membership functions. The fuzzy rule base is used to check the mapped values against the given rules. Due to the vast differences among crops and weather conditions in different parts of the world, the controller is given customised membership functions and rules suitable for a particular crop in that region in order to choose the most suitable action for best crop health considering farmer input.
The input variables used in our Fuzzy systems are the types of sensor data. The range of these sensor values are categorised into a number of membership functions, and fuzzy rules are designed to generate possible outputs. The output variables are the events that identify if any action is required from the farmer in order to maintain optimal crop health. The customised membership and fuzzy rules are discussed in the next section.
3.4 Interpretability of Fuzzy Controller
The goal of our work is to design an interpretable model which could be easily understandable by the farmers. To achieve this goal, we followed the following features as suggested by [28]:
• Our model uses a small number of fuzzy rules
• Our model uses a small number of variables in each rule
• Our model uses a small number of fuzzy sets for each variable
• Our model uses clear linguistic terms for fuzzy rules
• Our model makes sure that there are no contradictory rules
XAI not only gives understandable machine learning models but also justification for making decisions that can be used to promote system applicability. Interpretability is a measure used for fuzzy logic systems to show the understandability of the underlying models [27]. Even though a number of researchers have looked at the method of calculating interpretability of fuzzy logic systems, the Nauck index [28] and Fuzzy index [30] are the ones that are most commonly used [27]. For this work, we have evaluated the interpretability of our fuzzy system using the Nauck index.
Nauck index is a numerical measure to calculate the interpretability of a fuzzy logic system. A fuzzy logic system model is assumed to be more interpretable if its Nauck index is closer to 1.
Here, comp = complexity of FLS, cov = coverage degree of fuzzy partitions and part = partition index. comp is measured as the membership functions of output variable divided by the number of input variables in all the rules in fuzzy logic rule base and it is computed as
Here, m is the number of membership functions of the output variable, r is number of rules and ni is input variables used in the ith rule.
The quality of fuzzy partition is measured by cov in order to measure the membership degree for each element of the domain and the number of fuzzy sets. Complete coverage membership means membership degrees for each element of the domain adds up to 1 for a small number of fuzzy sets. For domain xi (where i
For discrete finite domain, we have Ni = |X| and replace the integral of the above equation.
part is computed for each input variable as the inverse of membership functions minus one and
Nauck index close to one shows high interpretability of the fuzzy logic system. The rules and membership functions for the fuzzy controller are designed by considering the Nauck index, further discussion is given in the next section.
4 A Use Case Scenario-Smart Irrigation System for Maize
For our proof of concept testing, we considered a smart irrigation system where soil temperature and soil moisture data have been used for monitoring crops in the farm environment and to decide if irrigation is required. We have considered maize as the crop in our proof of concept testing.
Maize (Zea mays L.) is the third most important cereal crop species cultivated worldwide which yields best with moderate soil temperatures and a plentiful supply of water [31,32]. Maize is gaining importance recently due to its high yield potential and many uses other than food such as bio-fuels production from maize is increasing each year to feed the rising demand for alternative fuels. Maize is also being increasingly used for other industrial purposes: in the production of starches, bio-degradable plastics, and ethanol [33]. Too little water in maize production can result in significant yield loss and even plant death, whereas too much water causes root disease and wasted water. Besides, as soil water acts as a carrier for nutrients, good water management is important within itself, as well as for good nutrient management in maize production [32]. Previous studies show that restricting water quantities in maize irrigation (replenishing only 65%–66% of the water deficit) during an experiment conducted in the plain of Thessaloniki reduced the crop yield by 37% [31].
Various other research scientists have made an extensive study [8, 34–36] of irrigation in the cultivation of maize–derived the same inference, i.e., that irrigation is of the utmost importance in maize production, from the appearance of the first silk strands until the milky stage in the maturation of the kernels on the cob [31]. For maize, soil moisture stress often causes wilting of plants and even reach a permanent wilting point. Also, different soil types such as silt loam, clay loam have different wilting points [37].
4.1 Customised Intelligent Controller: Maize Specific Factors
Maize is a fast-growing crop that needs moderate temperatures and a large volume of water. The ideal temperature for growing maize is 16°C–32°C, but with full irrigation, maize can tolerate high temperatures. However, at temperatures 38°C, it is difficult to maintain adequate water movement through the plant because of the high rate of evapotranspiration, even under irrigation. Which results in growth retardation. In addition, the night-time temperatures >21°C can also result in wasteful respiration and lower dry matter accumulation in the plant. Maize requires 50%–70% soil moisture and 500–800 mm water by rain or irrigation for the optimal range of yield, depending on climatic conditions. A high-yielding crop uses up to 850 mm of water during the growing season [32].
The smart agriculture system detects malfunction of the sensors and any security breach as an anomaly. For environmental sensors, the usual range of values can easily be identified using the geographical environmental data. Unusual sensor values (e.g., values deviating from the environmental pattern) in specific geographic locations and seasons of the year can be considered in the category of anomaly. From the machine learning point of view, we define the anomalies in the dataset that are the outlier values. For this use case, we have used the IoT sensor dataset [38]. In our selected dataset, missing sensor data is also defined as data anomaly in addition to out of the range temperature and moisture data at various depths of the soil. For example, volumetric water content values less than 0 or greater than 1, indicating anomaly in sensor reading or sensor failure.
The anomaly checker uses a ML model trained with the data collected from sensors. The model is trained to isolate anomalies from normal ranges of data. The trained model is tested with new data to check the performance of the model. Several ML classifier algorithms are tested to select an optimal model. We have conducted a preliminary evaluation of our machine learning module for detecting anomalies due to missing and out of range values.
The volumetric water and temperature sensors collect information from 30 cm depth of the soil over multiple years. The climate condition for the crop is identified as tolerant or extreme and when there is a sensor malfunction that results in out of range values the condition is considered as system anomaly. After the evaluation of the machine learning module, the final testing was done for detecting two classes, anomaly and normal. The anomaly checker also checks correlation among the values of closely placed sensors and we have used a machine learning model for this purpose. The difference in the current sensor value to the previous value is calculated for all sensors and this value should not vary among sensors by more than a predefined threshold value.
The input variables used in our fuzzy system are soil temperature and volumetric water. The membership functions for soil temperature (T) are Low (L), Ideal (ID), and High (H). The membership functions for the volumetric water (VW) are Very Low (VL), Low (L), Ideal (ID), and High (H). The output variable is the event (E) and the membership functions are Investigate (IN), Monitoring (M), Action Required (AR), and Immediate Action (IA).
4.3.1 Membership Functions for Soil Temperature
The reference soil temperature ranges between 0°C to 40°C. The ranges for all three membership functions have been designed based on maize related information provided in [32]. According to the literature, a soil temperature between 16°C and 32°C is regarded as ideal [32]. Based on this we have set the boundary for our membership functions with a 5°C–6°C of overlap. Some of the points that we considered during the design process are as follows:
• What happens when the temperature is 15°C, which is close to ideal and it's also at the upper end of the low range?
• What happens when the temperature is 32°C, which is situated between the upper end of the ideal and the lower end of the High?
We can deduct from the literature that when it's 15°C, the soil temperature started to get better, and it needs less attention than when it is 2°C. On the other hand, if the soil temperature is 32°C, even if this is within the ideal range, there is a chance that may increase and enter the high range. Hence, we need to be concerned about these boundary range temperatures as well. Based on such analytical reasoning, we have defined our membership functions for soil temperature as stated in Tab. 1. We have used trapezoid membership functions for all three ranges. Fig. 2a illustrates the membership functions for soil temperature.
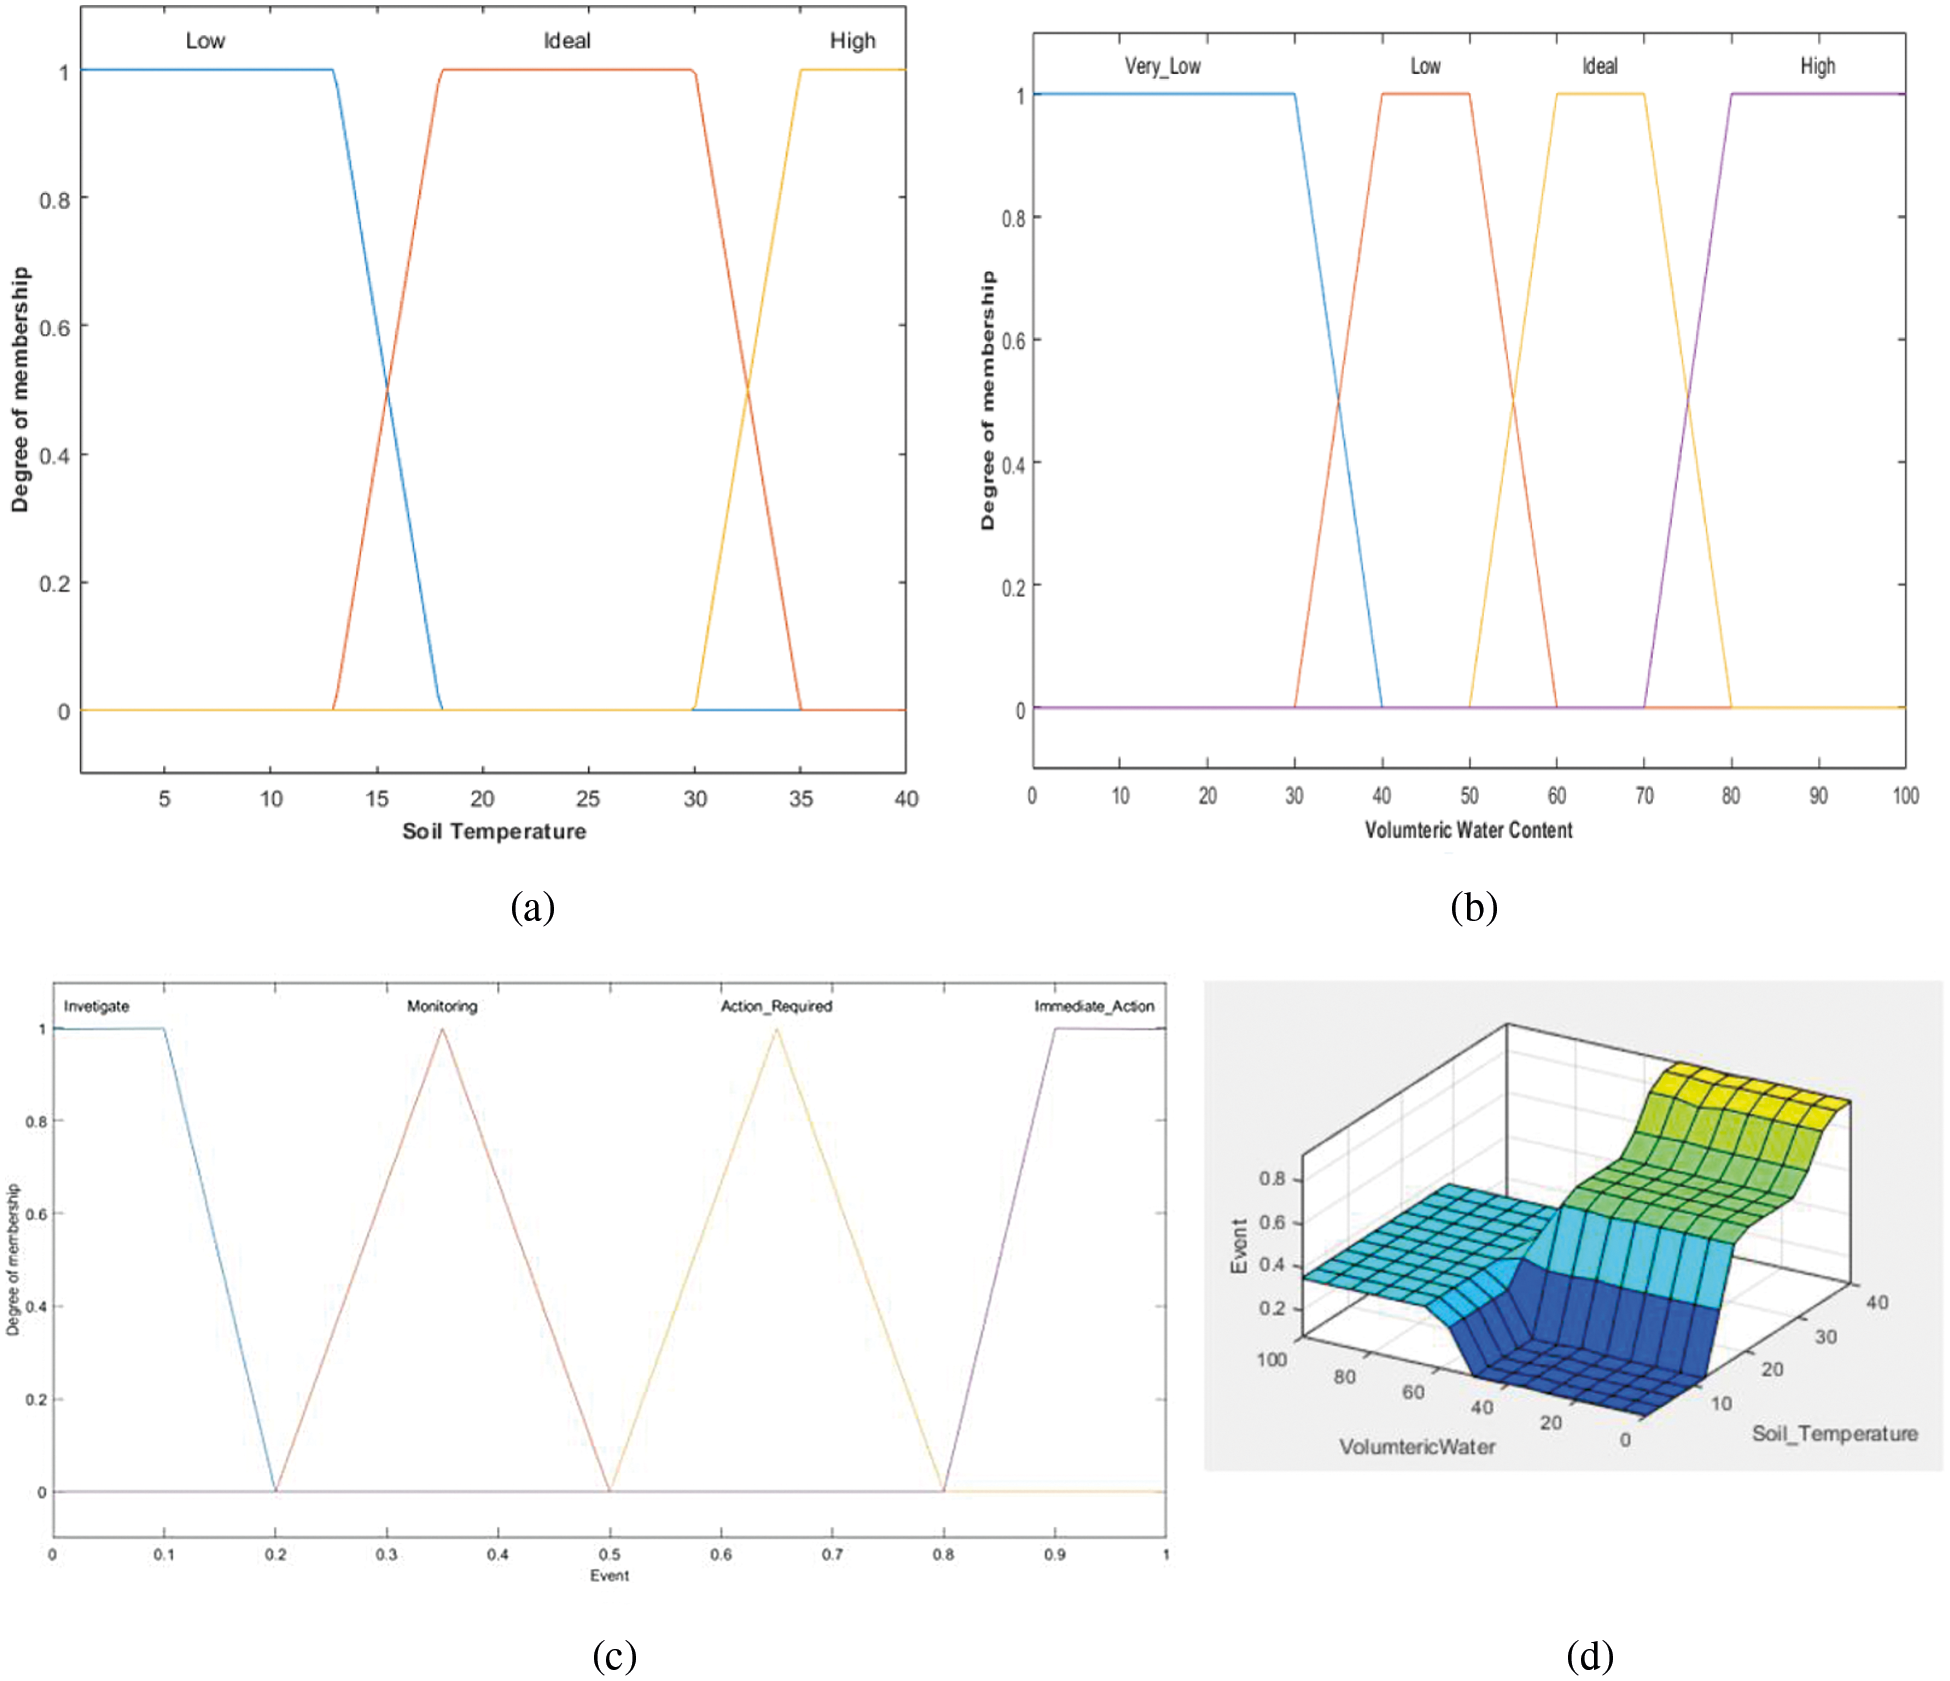
Figure 2: (a) Membership functions for soil temperature, (b) Membership functions for volumetric water content, (c) Membership functions for output events, (d) Surface view of the system
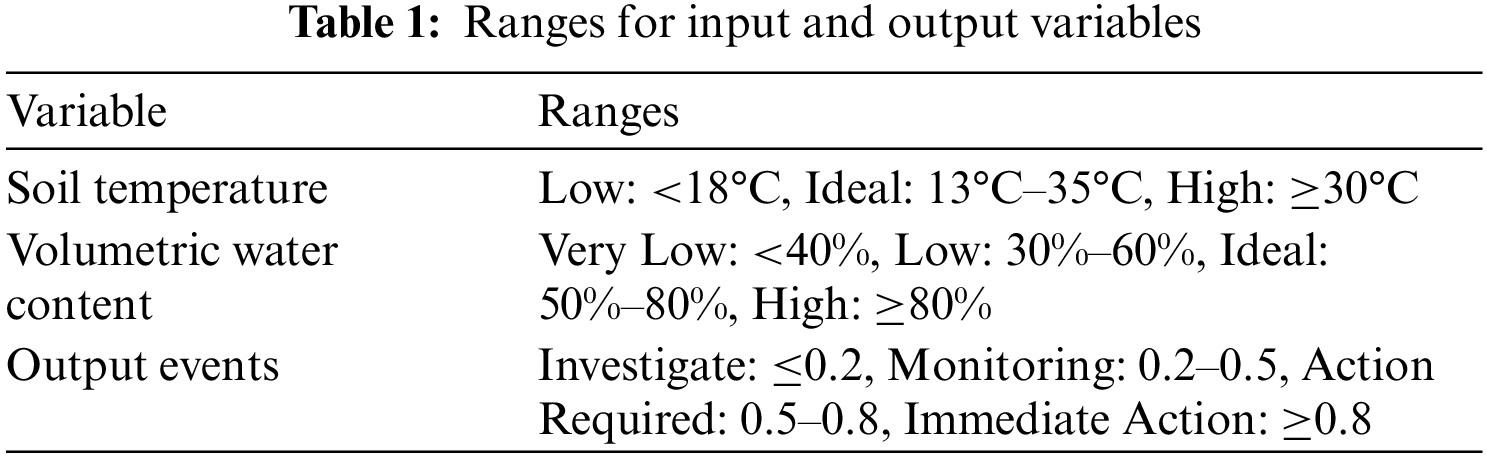
4.3.2 Membership Functions for Volumetric Water Content
We have applied similar analytical reasoning as soil temperature to design the membership functions for volumetric water content. The ranges are detailed in Tab. 1. Any volumetric water content below 40% is considered very low, a water range between 30%–60% is regarded as low. On the other hand, a water content between 50%–80% is defined as ideal and anything above 80% is considered as high. It is apparent that we have created a 10% overlap to tackle the boundary and near boundary values. The soil type in the dataset [38] is deep silt loams type, for which the wilting point is 10%–15%. We have decided the low range for our membership function based on this wilting point range. Fig. 2b displays the membership functions for volumetric water content.
4.3.3 Membership Functions for Output
The smart agriculture system is set to take four actions in course of the events. These actions are labelled as Investigate, Monitoring, Action required and Immediate action. The membership function ranges for the Event function are shown in Tab. 1. If there is any output value that is less than or equal to 0.2, the system will trigger an investigate event. If the system triggers a value between 0.2 and 0.5, the action item is to simply monitor the system. On the other hand, a value between 0.5 and 0.8 would activate an action required event and any value above 0.8 will set off for an immediate action. We have used triangular membership functions for the output function as that is the simplest and most efficient for this case. The function is described in Eq. (10) and Fig. 2c displays the membership functions for output events:
We have designed several rules for the fuzzy controller based on the correlation of soil temperature (ST) and soil volumetric water content (VW) [39]. Soil temperature and volumetric water content (VW) has a negative correlation.
As a result, if the ST goes up, the VW goes down. Based on this concept, we have designed our first rule to indicate that if the ST goes high, we do not have to look into VW; the farmer can take immediate action. High and low both ranges of VW can harm the plants. Therefore, if the VW is very high, the farmers do not need to check ST anymore and take immediate action. If both ST and VW are low, the farmers need to take some action based on the context of the season and daily weather. Tab. 2 shows the Fuzzy rules used to get the fuzzy output.
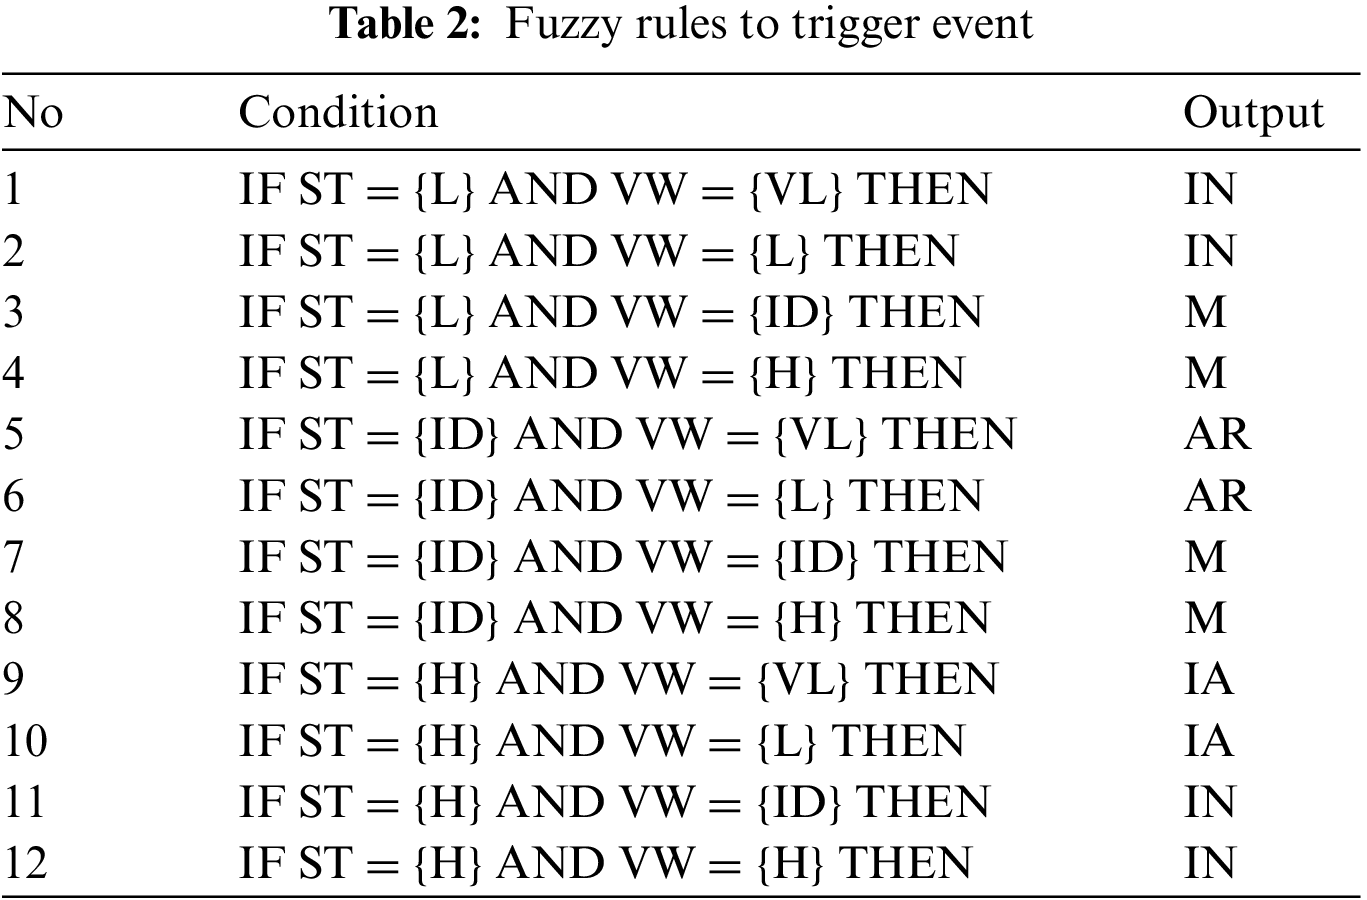
Fig. 2d shows the 3D surface view generated from two input variables (soil temperature and volumetric water) and the output variable of the event. The graph actually shows the dependency of the output on the two input values. For example, as the soil temperature is 35° Celsius (high) and volumetric water is 10 (very low) then the event will be 0.8 (immediate action).
This section presents the details of our experimental setup. For our experiments, we have used the IoT dataset available from the research conducted across the R. J. Cook Agronomy Farm [38]. The dataset contains the sensor readings of water content and soil temperature from 42 locations from 2007–2016. It consists of data from various depths of soil, in our experiment, we have considered the readings for 30 cm depth only. Each of the years in the dataset has approximately 8600 rows of records of soil temperature and soil volumetric water reading. These data rows contain the eight sensor readings of every hour throughout the year. The missing values in the selected dataset are replaced with a higher numeric number to facilitate the ML to recognise it as an anomaly. If the outlier value from a group of sensors reaches a certain threshold, an anomaly will be reported.
To train the anomaly checker three subsets of dataset is created,
• The first subset of data: sensor at CAF031 location at 30 cm depth is used for detecting anomalies due to being out of range or missing values. For our preliminary evaluation, the first subset of data is further enlarged with generated extreme values of sensors to emulate extreme reading or out of normal range reading as a third class of data in addition to anomaly and normal class.
• The second subset of data: sensors at CAF033 location at 30 cm depth is used for detecting anomalies due to being out of range or missing values. For the final testing, the extreme values are not considered which resulted in binary classification.
• The third subset of data: sensors at CAF031, CAF033 and CAF401 locations at 30 cm depth are used for detecting correlation-based anomalies. The third subset of data contains the soil temperature and volumetric water reading at 30 cm depth from July 2012 to June 2015. To develop an ML model, the data is divided into training and testing portions. The training portion contains sensor reading from July 2012 to June 2014, and the testing portion contains sensor reading from July 2014 to June 2015. The correlation threshold values are 5% and 0.50 for VW and ST, respectively. Based on these threshold parameters, the data is labelled either normal or anomalous. The missing sensor values are considered anomalies. The abrupt changes in VW and ST compared to neighbouring sensors is also considered an anomaly class based on the threshold value.
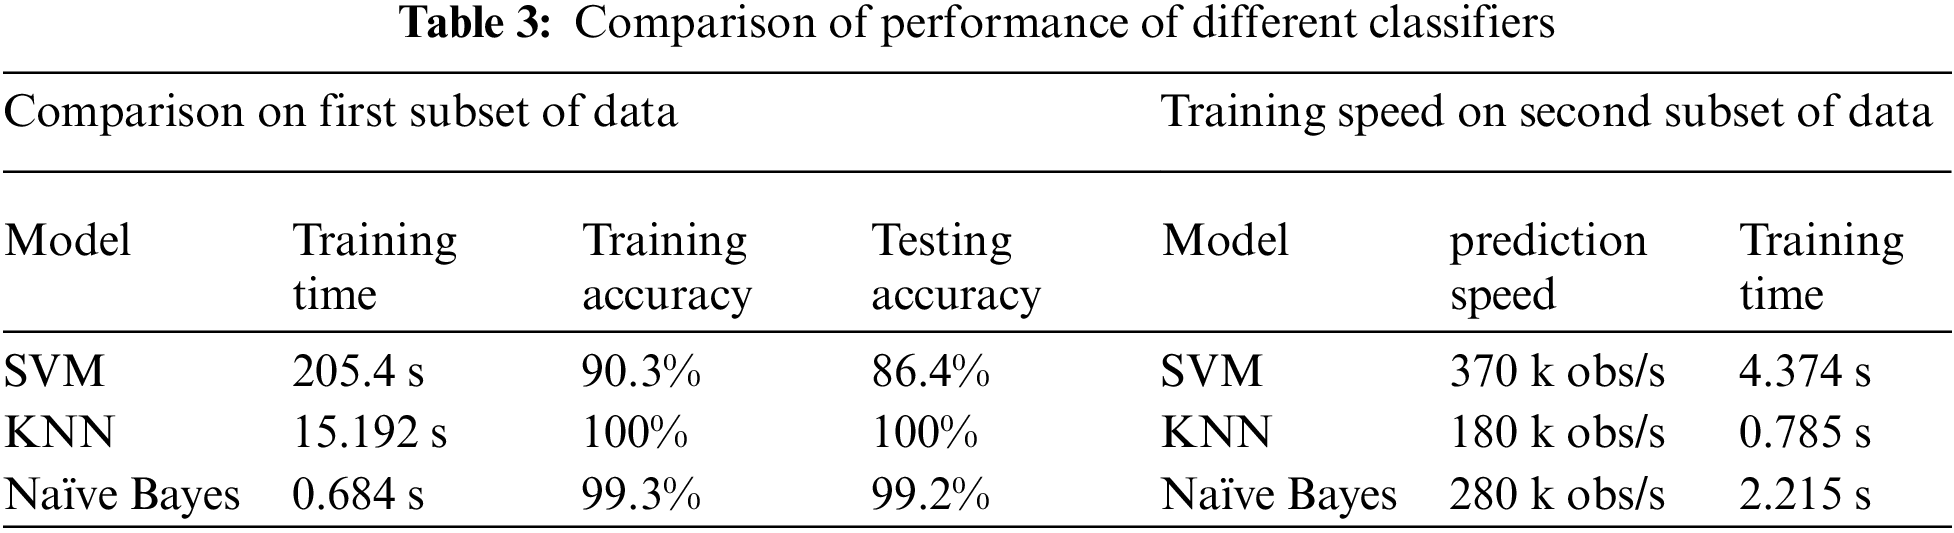
The smart anomaly checker utilised supervised ML to identify the out of range and missing values of the sensors. Using the first subset of data, three classification methods are utilised to train the ML models using the data from the sensor at location CAF031, the performance of the model is compared in Tab. 3. The training parameters of the KNN classifier are Distance metric: Euclidean, Distance weight: Equal and Standardized data: True. The training parameters of the Naive Bayes classifier are Distribution name for numeric predictors: Gaussian, Distribution name for categorical predictors: MVMN and Surrogate decision splits: Off. The training parameters of the SVM classifier are Kernel function: Linear, Kernel scale: Automatic, Box constraint level: 1, Multi-class method: One-vs.-one and Standardize data: True. The data is divided into 70/30 portions for training and testing. The scripts load the training data and train the model with three classifiers. The trained model instances are also tested from the testing portion of data. The labelled data is divided into a training and a testing portion to create ML classifiers. We have tested data with multiple classifiers to create multiple instances of the model and verified which classifier produces the best result from the training and testing phase. We have compared the output of several classifiers and selected KNN, which shows the best accuracy. The scripts also run tests using the test portion of the dataset. The results from the training and testing dataset are narrated in the following section.
We have used the Fuzzy Logic Designer of MATLAB2020A for our experiments. We have used the Mamdani inference system. The inference system integrates with a fuzzy rule base, fuzzifier, and defuzzifier to get crisp output values. Mamdani system is more intuitive and easier to understand rule bases, and they are well suited when the rules are created from human expert knowledge. For our system, the rules are created from the information gathered by the farmers and domain experts. Hence, we used the Mamdani inference system for our work.
We have used centroid defuzzification which returns the center of gravity of the fuzzy set along the x-axis. The centroid returns the point where the fuzzy set would balance. The calculation formula for centroid is as follows, where μ(xi) is the membership value for point xi in the universe of discourse.
In this section, we will present our results from our prototype implementation.
6.1 Anomaly Checker Performance
In the first subset of data, during the training 70304 data samples are used, out of those samples 37836 anomaly class, 29143 tolerate class and 3325 extreme class. In second subset of data 1852 anomaly class and 15668 normal class data samples are used for training.
The trained models from first subset and second subset of data are tested with the corresponding test dataset. Tab. 3 shows a comparison among the classifiers for our preliminary evaluation. In first dataset KNN algorithm could optimise the training model and it also performed well in testing scenario compared to SVM and Naive Bayes classifier to classify anomaly, extreme and tolerate situation at location CAF031. Misclassification cost for KNN is zero and accuracy reached 100%. In first subset of test data there are 37836 anomaly class, 9999 tolerate class and 1469 extreme class. For preliminary evaluation, SVM provided 86.4% accuracy, KNN provided 100% accuracy and NB model produced 99.2% accuracy.
Tab. 3 also shows a comparison of training speed and prediction speed among the instances of the ML model of second subset of data. All three classifiers for the second subset training and testing phase demonstrate 100% accuracy. However, considering the training time and prediction speed KNN can be better choice.
The confusion matrix in Fig. 3a shows the test results containing the number of anomalies correctly identified by the KNN classifier. If no anomaly is detected in the current sensor values, the anomaly checker checks the values of closely related sensors for differences in correlation using machine learning classifiers.
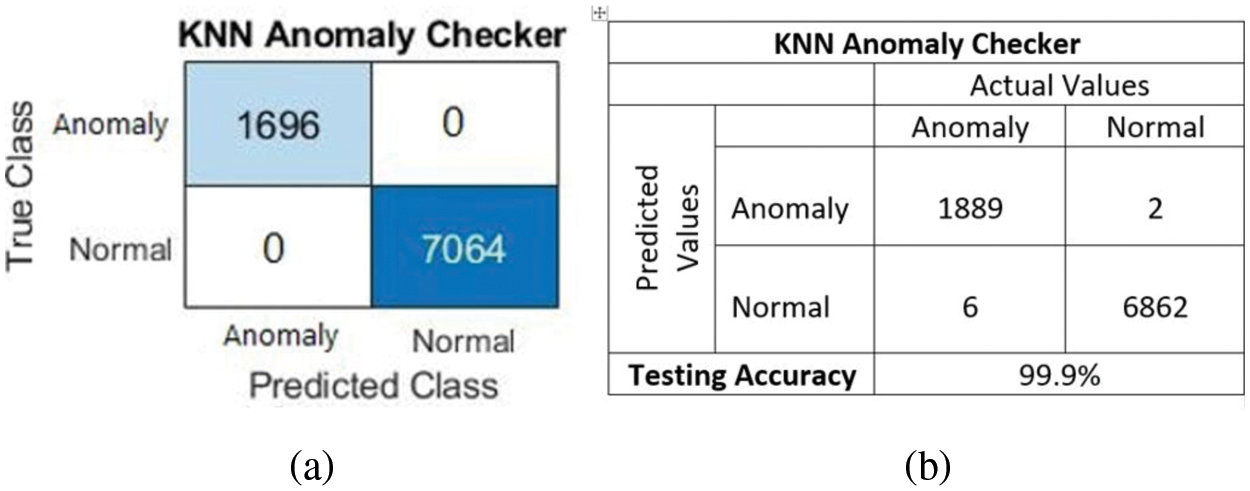
Figure 3: (a) Second subset of data: KNN testing confusion matrix, (b) Confusion matrix for test data of correlation
For detecting anomaly due to exceeding correlation threshold we have used the KNN classifier for binary classification to indicate anomaly or normal values. Fig. 3b shows the training and testing results containing the anomalies correctly identified by the KNN classifier for the third subset of data considering data of three sensors. The figure shows that our model could detect the anomaly and normal class with a 99.9% accuracy. When an anomaly checker detects an anomaly an event is generated to notify the farmer. When no anomaly is detected the data is passed to the fuzzy controller.
6.2 Test Cases for Fuzzy Logic System
We have tested the accuracy of our system for three cases. For testing, first, we created a dataset with several sets of input and output values. Then we evaluated our Fuzzy Inference System (FIS) with those chosen input values for soil temperature and volumetric water and checked the output responses for each of the test cases. Details of these cases and analysis of the output response are given below.
1) Case 1-Soil Temperature: 30°C and Volumetric Water: 55%
Soil temperature 30°C (which has a degree of membership of 1 of ideal temperature) and 55% volumetric water (which has a 0.5 degree of membership for both low and ideal case), the rules 2, 3, 5–8, 10 and 11 (as shown in Tab. 2) are triggered and the output response gives a crisp value of 0.5 and the corresponding event is “Monitoring”. This is the correct response that we were expecting.
2) Case 2-Soil Temperature: 32°C and Volumetric Water: 30%
For the input values of soil temperature 32°C and low volumetric water the rules 1, 5, and 9–12 (as shown in Tab. 2) are triggered and the output response gives a crisp value of 0.925 which belongs to the “Immediate Action” membership function. For such a low volumetric water level, this is the correct response that we were expecting.
3) Case 3-Soil Temperature: 25°C and Volumetric Water: 38%
For the input values of soil temperature 25°C (which have a level of 0.5 to both ideal and high category of membership function) and 38% volumetric water level, the rules 2, 5–8 and 10 (as shown in Tab. 2) are triggered and the output response shows that “Action Required” event will be triggered in this case. For soil temperature within ideal range and low volumetric water content, this is the correct response that we were expecting.
6.3 Calculation and Analysis of Interpretability Index for our Proposed System
Tab. 4 shows the value of different parameters used for the calculation of the Nauck index. Using the values presented in Tab. 4 Nauck index can be generated as:

As shown in the calculation above and in Tab. 4, the interpretability index of our system is not very high. Although we aimed to make the system interpretable for farmers, we also emphasise on accuracy. That's why we chose two input values rather than one. With two inputs, the maximum value of the interpretability index could be 0.5. Interpretability index 0.07 might not be considered as highly interpretable. So, we also tried to improve the interpretability by tuning the Fuzzy rules and membership function parameters (as detailed in Section 7).
7 Modified FIS to Increase Interpretability
We have tuned our FIS presented in Section 6 by reducing the input and output membership functions and fuzzy rules further to increase the interpretability index further. In our modified FIS, we also used two inputs (soil temperature and volumetric water) and the output is the actions required by the farmers. The membership functions of input and output values are described below and the rule set is shown in Tab. 5.

7.1 Membership Functions for Soil Temperature
The reference soil temperature ranges between 0°C to 40°C. The linguistic values for the three membership functions are Low (L), Ideal (I) and High (H) where temperatures below 18°C is considered as low, 13°C–35°C is considered as ideal and 30°C and up is considered as high.
7.2 Membership Functions for Volumetric Water
In the modified FIS, we have reduced the number of membership functions for volumetric water to 3-Low (L), Ideal (I) and High (H). The reference volumetric water content ranges between 0% to 100%. The linguistic descriptor “Low” refers to any value less than 50%, “Ideal” refers to any value from 40%–80% and any value above 70% is referred to as “High”.
7.3 Membership Functions for Output
The modified system is set to take three actions in course of the events. These actions are labelled as Monitoring, Action required and Immediate action. If there is any output value that is less than or equal to 0.30, the system will trigger a “Monitor” event. If the system triggers a value between 0.31 and 0.65, the action item is “Action Required”. On the other hand, a value between 0.66 and 1 would trigger an “Immediate Action” event.
7.4 Interpretability Index with Reduced Rules and Membership Function
We show different parameters that we used for the Nauck index calculation of the updated system in Tab. 4. We used the same Eq. (1) for this calculation. As shown in Tab. 4, the interpretability has increased to 0.19 for the updated system. By comparing the modified design to the original design, it is clear that the strategy of reducing the number of rules and input parameters for each rule improves the interpretability considerably. However, further changes in design could improve the interpretability but it may reduce the accuracy of the system as well. By looking at other work [27,28], a value of 0.19 for the Nauck index is comparable and better in most cases.
Once the Fuzzy system provides an output event, the action required by the farmer is interpreted based on our research. There is no irrigation requirement for two events: “Investigation” and “Monitoring”. Water application is required only if “Action Required” and “Immediate Action” events are triggered. The irrigation requirement depends on the stage of the crop lifecycle as discussed below.
Maize is a warm-season crop that needs regular irrigation for good yield. An irrigated optimal yielding maize crop in the dry season will require about 700 mm of water depending on planting time, seasonal conditions, and soil type [33]. Maize takes around 16–17 weeks (100 to 120 days) to reach physiological maturity and usually need approximately 100 days of irrigation. Too little water results in stress on the crop and reduce yield significantly, while too much water results in nutrient leaching, waterlogging and a waste of water and money [32]. However, the irrigation water for maize production varies from week to week, where the maximum amount of irrigation (70–84 mm/ha) requires in weeks 6–10 and a moderate amount of irrigation (35–42 mm/ha) requires in weeks 4–5, 11–13, as shown in Tab. 6 [33]. Applying such quantities of water will usually require two irrigation per week in case of ‘Action Required’. While in case of ‘Critical Action’ such quantities of water are required to give in one go.
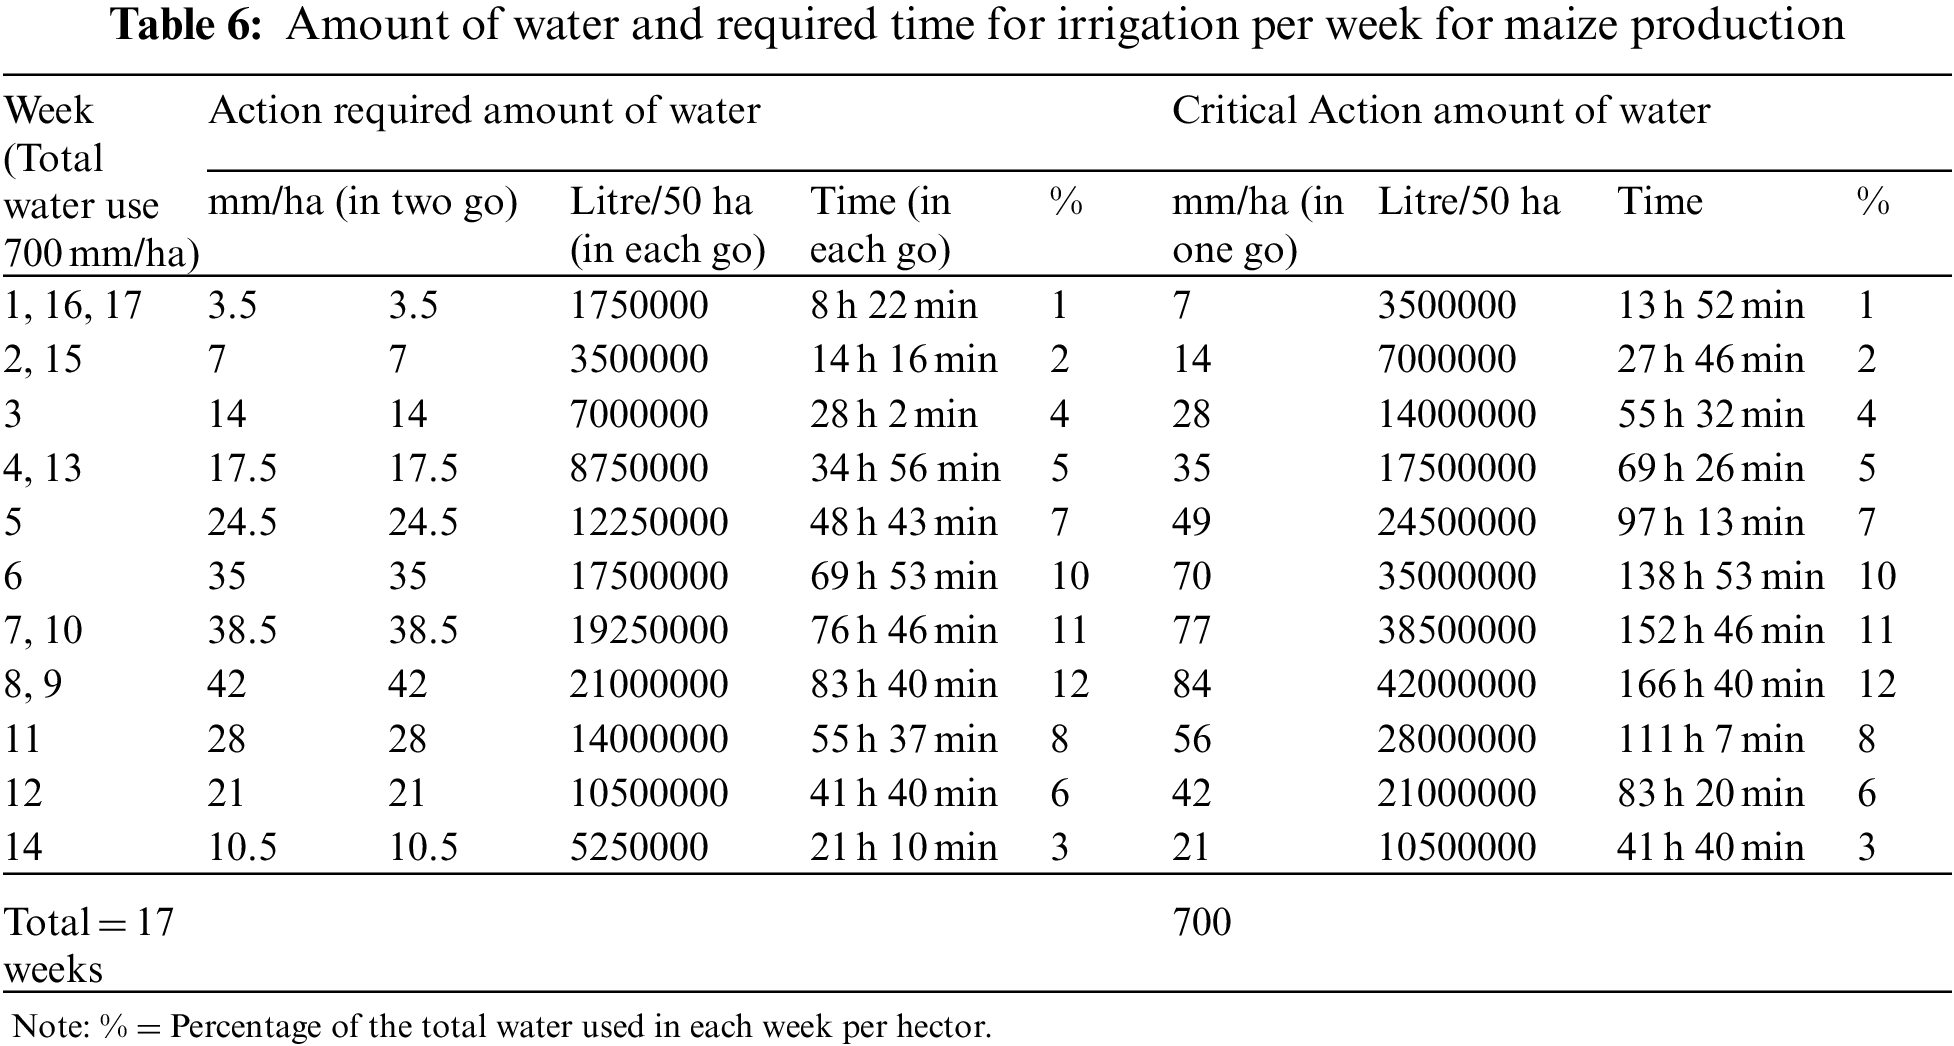
Irrigation systems are installed with sufficient planning or consideration of the physical environment or available resources where the capacity of an irrigation system is determined by the water availability. Most field crop irrigation systems in Australia are based on center pivots supplied by underground aquifers with a bore range from 30 to 70 L/s. With a given bore output 70 L/s, it is possible to calculate the amount of water and required times in each week to irrigate the entire area to satisfy crop water demand as shown in Tab. 6. This is crucial for working out pumping schedules and determining whether the crop can be irrigated sufficiently and timely to avoid stress [33].
Here, we show the calculation of the amount of irrigated water and required time for week 3 as an example. Calculation of other weeks can be done using the same method. Assume a bore capacity of 70 L/s (252 000 L/h) and a potential area of 50 hectares, total peak crop requirement of 28 mm per week to be applied in week 3. The volume of water required to provide 28 mm over 1 hectare (ha) (i.e., 28 mm deep × 1 ha area is 0.028 m × 10 000 m2 = 280 000 L required to water 1 ha). Amount (L) required for 50 ha = 280 000 L × 50 (4000, 000 L). So the time to irrigate 50 ha is = 14 000000/252 000 L/h (i.e., 70 L/s) = 14 000 000 L/252 000 L/h = 55 h 32 min. Here, for ‘Action Required’ the total 14 000, 000 L water should be given in two go where in each go the amount of irrigated water will be 7 000 000 L. And for ‘Critical Action’ the total 14 000, 000 L water should be given in one go.
An IoT and artificial intelligence-based smart irrigation architecture has been discussed, analysed and evaluated in this work. Customisability, consideration of security issues, interpretability and completeness of the given solution makes it an excellent candidate for achieving high crop yield. The system not only detects data anomalies, it also provides optimal solution for irrigation. A customisable fuzzy logic system generates events based on specific crop requirements and environmental factors. The design parameters are based on thorough research and investigation related to crop life cycle, soil types, suitable environmental factors and irrigation requirements. One of the main strengths of the system is its ability to be explainable and interpretable to farmers. We have measured the interpretability index of our system and also shown how the interpretability could be further improved. A proof of concept experiment was conducted to show the applicability of our system considering Maize as a target crop.
We are at the initial stage of our project focusing on the design of our architecture while using existing datasets. Our future work includes real-time data collection using environmental sensors to test our system. Furthermore, the system's customisability will be explored for different crops in different geographical areas. Moreover, measures to optimise the interpretability of the system will be considered as well.
Funding Statement: This work was supported by the Central Queensland University Research Grant RSH5345 (partially) and the Open Access Journal Scheme.
Conflicts of Interest: The authors declare that they have no conflicts of interest to report regarding the present study.
1. FAO, “The state of food and agriculture 2016,” [Online]. Available: http://www.fao.org/3/a-i6030e.pdf, 2016. [Google Scholar]
2. E. Technologies, “What is smart farming—everything you want to know about it,” [Online]. Available: https://medium.com/@emorphis.technologies/what-is-smart-farming-everything-you-want-to-know-about-it-28e0e5d8e142, 2019. [Google Scholar]
3. FAO, “The state of food and agriculture 2020. overcoming water challenges in agriculture. Rome,” [Online]. Available: https://doi.org/10.4060/cb1447en, 2020. [Google Scholar]
4. S. Nallani and V. B. Hency, “Low power cost effective automatic irrigation system,” Indian Journal of Science and Technology, vol. 8, pp. 1–6, 2015. [Google Scholar]
5. M. Gamo, M. Shinoda and T. Maeda, “Classification of arid lands, including soil degradation and irrigated areas, based on vegetation and aridity indices,” International Journal of Remote Sensing, vol. 34, no. 19, pp. 6701–6722, 2013. [Google Scholar]
6. R. Atta, T. Boutraa and A. Akhkha, “Smart irrigation system for wheat in Saudi Arabia using wireless sensors network technology,” International Journal of Water Resources and Arid Environments, vol. 1, no. 6, pp. 478–482, 2011. [Google Scholar]
7. J. Shi, X. Wu, X. Wang, M. Zhang, L. Han et al., “Determining threshold values for root-soil water weighted plant water deficit index based smart irrigation,” Agricultural Water Management, vol. 230, pp. 105979, 2020. [Google Scholar]
8. J. Fang and Y. Su, “Effects of soils and irrigation volume on maize yield, irrigation water productivity, and nitrogen uptake,” Scientific Reports, vol. 9, no. 1, pp. 1–11, 2019. [Google Scholar]
9. J. Fang and Y. Su, “Irrigation association,” Irrigation-Sixth Edition, 2011. [Google Scholar]
10. H. G. Jones, “Irrigation scheduling: Advantages and pitfalls of plant-based methods,” Journal of Experimental Botany, vol. 55, no. 407, pp. 2427–2436, 2004. [Google Scholar]
11. J. Shi, S. Li, Q. Zuo and A. Ben-Gal, “An index for plant water deficit based on root-weighted soil water content,” Journal of Hydrology, vol. 522, pp. 285–294, 2015. [Google Scholar]
12. H. Hagras, “Toward human-understandable, explainable AI,” Computer, vol. 51, no. 9, pp. 28–36, 2018. [Google Scholar]
13. P. Linardatos, V. Papastefanopoulos and S. Kotsiantis, “Explainable AI: A review of machine learning interpretability methods,” Entropy, vol. 23, no. 1, pp. 18, 2021. [Google Scholar]
14. D. V. Carvalho, E. M. Pereira and J. S. Cardoso, “Machine learning interpretability: A survey on methods and metrics,” Electronics, vol. 8, no. 8, pp. 832, 2019. [Google Scholar]
15. A. Fernandez, M. Jesus, O. Cordon, F. Marcelloni and F. Herrera, “Evolutionary fuzzy systems for explainable artificial intelligence: Why, when, what for, and where to,” IEEE Computational Intelligence Magazine, vol. 14, no. 1, pp. 69–81, 2019. [Google Scholar]
16. V. S. Silva and A. Freitas and S. Handschuh, “On the semantic interpretability of artificial intelligence models,” [Online]. Available: arXiv preprint arXiv:1907.04105, 2019. [Google Scholar]
17. M. Azaza, C. Tanougast, E. Fabrizio and A. Mami, “Smart greenhouse fuzzy logic based control system enhanced with wireless data monitoring,” ISA Transactions, vol. 61, pp. 297–307, 2016. [Google Scholar]
18. D. Thakur, Y. Kumar and S. Vijendra, “Smart irrigation and intrusions detection in agricultural fields using IoT,” Procedia Computer Science, vol. 167, pp. 154–162, 2020. [Google Scholar]
19. N. S. Pezol, R. Adnan and M. Tajjudin, “Design of an internet of things (iot) based smart irrigation and fertilization system using fuzzy logic for chili plant,” in Proc. 2020 IEEE Int. Conf. on Automatic Control and Intelligent Systems (I2CACIS), Shah Alam, Malaysia, pp. 69–73, 2020. [Google Scholar]
20. S. Khummanee, S. Wiangsamut, P. Sorntepa and C. Jaiboon, “Automated smart farming for orchids with the internet of things and fuzzy logic,” in Proc. of 2018 Int. Conf. on Information Technology (InCIT), Khon Kaen, Thailand, pp. 1–6, 2018. [Google Scholar]
21. G. Kokkonis, S. Kontogiannis and D. Tomtsis, “A smart IoT fuzzy irrigation system,” IOSR Journal of Engineering, vol. 7, pp. 15–21, 2017. [Google Scholar]
22. V. Puri, M. Chandramouli, C. V. Le and T. H. Hoa, “Internet of things and fuzzy logic based hybrid approach for the prediction of smart farming system,” in Proc. 2020 Int. Conf. on Computer Science, Engineering and Applications (ICCSEA), Gunupur, India, pp. 1–5, 2020. [Google Scholar]
23. S. Priyadharshini, K. Ajithkumar, P. Sakthivel, M. Arunkumar and R. Samvedhamani, “IoT based smart agriculture monitoring system using fuzzy logic,” Journal of Critical Reviews, vol. 7, no. 13, pp. 1229–1234, 2020. [Google Scholar]
24. I. N. Rudy Hendrawan, L. Putu Yulyantari, G. A. Pradiptha and P. Bayu Starriawan, “Fuzzy based internet of things irrigation system,” in Proc. 2019 1st Int. Conf. on Cybernetics and Intelligent System (ICORIS), Denpasar, Indonesia, vol. 1, pp. 146–150, 2019. [Google Scholar]
25. N. L. Tsakiridis, T. Diamantopoulos, A. L. Symeonidis, J. B. Theocharis, A. Iossifides et al., “Versatile internet of things for agriculture: An explainable ai approach,” in Proc. of IFIP Int. Conf. on Artificial Intelligence Applications and Innovations, Cham, Springer, pp. 180–191, 2020. [Google Scholar]
26. N. L. Tsakiridis, J. B. Theocharis and G. C. Zalidis, “Deco3rum: A differential evolution learning approach for generating compact mamdani fuzzy rule-based models,” Expert Systems with Applications, vol. 83, pp. 257–272, 2017. [Google Scholar]
27. T. R. Razak, J. M. Garibaldi, C. Wagner, A. Pourabdollah and D. Soria, “Interpretability indices for hierarchical fuzzy systems,” in Proc. 2017 IEEE Int. Conf. on Fuzzy Systems (FUZZ-IEEE), Naples, Italy, pp. 1–6, 2017. [Google Scholar]
28. D. D. Nauck, “Measuring interpretability in rule-based classification systems,” in Proc. the 12th IEEE Int. Conf. on Fuzzy Systems, FUZZ ‘03, St. Louis, MO, USA, vol. 1, pp. 196–201, 2003. [Google Scholar]
29. J. Ramirez Gomez, H. Vargas Montoya and A. Henao, “Implementation of a wormhole attack on wireless sensor networks with XBee S2C devices,” in Proc. 13th Colombian Conference, CCC 2018, Cartagena, Colombia, September 26–28, pp. 98–112, 2018. [Google Scholar]
30. J. Alonso, S. Guillaume and L. Magdalena, “A hierarchical fuzzy system for assessing interpretability of linguistic knowledge bases in classification problems,” in Proc. of 11th Int. Conf. of Information Processing and Management of Uncertainty in Knowledge-Based Systems, Paris, France, pp. 348–355, 2006. [Google Scholar]
31. P. S. Dioudis, A. T. Filintas and A. H. Papadopoulos, “Corn yield response to irrigation interval and the resultant savings in water and other overheads,” Irrigation and Drainage, vol. 58, no. 1, pp. 96–104, 2013. [Google Scholar]
32. Grain Research and Development Corporation, “Maize northern region-grownotes™,” 2017. [Google Scholar]
33. F. O'Gara, Irrigated Maize Production in the top end of the Northern Territory, Northern Territory Government, Department of Primary Industry, Fisheries and Mines, 2007. [Google Scholar]
34. C. Li, Y. Xiong, Z. Cui, Q. Huang, X. Xu et al., “Effect of irrigation and fertilization regimes on grain yield, water and nitrogen productivity of mulching cultivated maize (Zea mays L.) in the hetao irrigation district of China,” Agricultural Water Management, vol. 232, pp. 106065, 2020. [Google Scholar]
35. A. Filintas, “Soil moisture depletion modelling using a TDR multi-sensor system, GIS, soil analyzes, precision agriculture and remote sensing on maize for improved irrigation-fertilization decisions,” Engineering Proceedings, vol. 9, no. 1, pp. 36, 2021. [Google Scholar]
36. A. T. Filintas, P. I. Dioudis, D. T. Pateras, J. N. Hatzopoulos and L. G. Toulios, “Drip irrigation effects in movement, concentration and allocation of nitrates and mapping of nitrates with gis in an experimental agricultural field,” in Proc. of Scientific Congress on the Management of Aquatic Resources and the Sustainable Development of Thessaly, the 3rd Conf. of Thessaly Development, Larissa, ETHEM, pp. 159–171, 2003. [Google Scholar]
37. L. C. Torres, T. Keller, R. P. D. Lima, C. A. Tormena, H. V. D. Lima et al., “Impacts of soil type and crop species on permanent wilting of plants,” Geoderma, vol. 384, pp. 11498, 2021. [Google Scholar]
38. C. Gasch, D. Brown, C. Campbell, D. Cobos, E. Brooks et al., “A Field-scale sensor network data set for monitoring and modeling the spatial and temporal variation of soil water content in a dryland agricultural field,” Water Resources Research, vol. 53, no. 12, pp. 10 878–10 887, 2017. [Google Scholar]
39. O. T. Al-Taai and W. G. Nassif, “The relationship between soil temperature and volumetric soil water content in Iraq using ECMWF data for the period (1980–2016),” Journal of Physics: Conference Series, vol. 1530, no. 1, pp. 12138, 2020. [Google Scholar]
 | This work is licensed under a Creative Commons Attribution 4.0 International License, which permits unrestricted use, distribution, and reproduction in any medium, provided the original work is properly cited. |